Article

Multi-Species Assessment of Injury, Mortality, and Physical Conditions during Downstream Passage through a Large Archimedes Hydrodynamic Screw (Albert Canal, Belgium)

1
Research Institute for Nature and Forest, Team Aquatic Management, Havenlaan 88/bus 73, 1000 Brussels, Belgium
2
Centre for Biorobotics, Department of Computer Systems, Tallinn University of Technology, Ehitajate tee 5, 19086 Tallinn, Estonia
3
SJE Ecohydraulic Engineering GmbH, Viereichenweg 12, D-70569 Stuttgart (Vaihingen), Germany
*
Authors to whom correspondence should be addressed.
Sustainability 2020, 12(20), 8722; https://doi.org/10.3390/su12208722
Submission received: 31 August 2020 / Revised: 9 October 2020 / Accepted: 13 October 2020 / Published: 21 October 2020
(This article belongs to the Special Issue Hydropower Impacts on Aquatic Biota)

Abstract

:
Fish passing downstream through hydraulic structures and turbines may be exposed to an elevated risk of injury and mortality. The majority of live fish studies are single-species laboratory investigations and field studies of Kaplan turbines, with a limited number of studies in Francis and screw turbines. In addition to these studies, the physical conditions during turbine passage can be directly measured using passive sensors. In this study, we investigate the multispecies risk of injury and mortality during downstream passage through a large Archimedes hydrodynamic screw for bream (Abramis brama), eel (Anguilla anguilla), and roach (Rutilus rutilus) in conjunction with passive sensors that record the pressure, acceleration, and rate of rotation. This work proposes several new metrics to assess downstream passage including the times and durations of impact events, the kinetic energies of translation and rotation, and the pressure gradient. The major findings of this work are three-fold: (1) Significant differences in injury and mortality were observed between the three investigated species with 37% mortality for bream, 19% for roach, and 3% for eel on average. (2) The operational scenario was found to be significant only for a limited number of species-specific injuries and mortality rates. (3) In contrast to studies in Kaplan turbines, the sensor data revealed highly chaotic physical conditions in the Archimedes hydrodynamic screw, showing little difference in the physical metrics between operational scenarios.

Graphical Abstract

1. Introduction

Archimedes screws are among the world’s oldest hydraulic machines that remain in modern use. Their primary use is as a type of low elevation water pump, and in the latter part of the 20th century the screw has re-emerged as a turbine [1]. In 1994, the first Archimedes screw turbine was installed in Europe, and by 2012 Lashofer et al. counted some 400 worldwide [2]. Archimedes screw turbines are classified as small (1–10 MW) or mini (<1 MW) hydropower plants and are typically used at sites with a total elevation difference of 8–10 m and for discharges of 1–10 m3/s [3]. The screws rotate around an inclined axis ranging from 22° to 35° from the horizontal. They are further classified as “hydrodynamic screws” when the external cover does not turn with the screw, but is fixed and acts only as a support [1,3,4].
Archimedes screw turbines are frequently touted to be more “fish-friendly” than conventional turbines [5]. This claim is often made due to their very low rotational rates (30 rpm) and blade tip speeds (3.8 m/s), low rates of pressure change, low fluid shear, and a low overall number of blades, which reduce contact probability [5]. To date, there remain only a handful of studies that assess the impact of an Archimedes screw with live fish in a natural environment, which are summarized in this section. Due to the site-specific nature of each of these studies, the characteristics of the investigated screws cover a broad range. As an example of this range, images of the six different hydrodynamic screws from previous studies are provided in Figure A1.
One of the six studies includes the thesis work done by Schmalz [6], who investigated wild local fish species passing the screw, including roach (Rutilus rutilus), bream (Abramis brama), eel (Anguilla anguilla), bullhead (Cottus gobio), three-spined stickleback (Gasterosteus aculeatus), spined loach (Cobitis taenia), and grayling (Thymallus thymallus), among others. A substantial number of fish were found with scale loss, grinding injury, bleeding, and partial or complete cuts. In a study on the River Dart, UK, it was observed that almost all fish, including eels (Anguilla anguilla), trout (Salmo trutta) and salmonids (Salmo salar), passed through the Archimedes screw either unharmed (eels) or with negligible scale loss (salmon) [7,8,9,10]. Similarly, scale loss did not differ between treatment and control groups of salmon in a study on the river Don, Scotland [10], but investigations of scale loss on euthanized individuals at the same site showed severe scale loss and distinctive patterns of scale loss due to grinding between the turbine blades and housing trough [11]. In addition, further studies found that fish with a body mass less than 1 kg were not injured by contact with the screw leading edge if the tip speed was less than 4.5 m/s, and the addition of a rubber leading edge further reduced injuries to larger fish at higher tip speeds [12,13]. In the study of river lamprey (Lampetra fluviatilis) on the River Derwent, UK, the damage rate was 1.5% for 66 juveniles released immediately upstream and who subsequently passed the Archimedes screw [14]. The impact of the screws in the river Sour, UK, and Diemel, Germany, were investigated by acoustically tagged eels (Anguilla anguilla) and salmon (Salmo salar). The behavior of the eels in the river Sour was not found to be directly impacted by screw passage. However, migration delay was introduced at this site by the fish being frequently milled and rejected back upstream [9]. The study in the river Diemel observed a probability of 0–8% that a smolt would die after passing the screw [15]. Due to the limited number of live fish studies during Archimedes hydrodynamic screw passage, there exists a clear need to research and establish the risk of injury and mortality to fish passing downstream through screws.
Apart from assessing the biological responses of live fishes, the development of safer screws can also be assessed by using passive sensors, which measure the physical conditions experienced during passage. Several studies for Kaplan turbines exist [16,17,18], however there is only a single study to date that has used sensors to measure the physical conditions in an Archimedes turbine [19]. Sensor passage in this study was evaluated based on event-based statistics including the number and severity of strike events, the nadir (lowest) pressure, pressure maximum, and rate of pressure change. No live fish studies at the site were compared with sensor data in that study. However, two studies have combined live fish and sensor experiments [17,18]. The first study was performed in a laboratory setting investigating shear-related injury and mortality, and the second related the percentage of severe events (collision and/or shear) to 48 h delayed mortality from live fish studies in two Kaplan turbines. Therefore, the link between actively swimming fish and passive sensors remains to be conclusively investigated. Differences in the observed injury and mortality between fish species require multispecies, live fish experiments. Understanding the relationships among various strike variables and injury and mortality rates are necessary for improvements in turbine design [19,20]. This work is the first to investigate multispecies injury and mortality, including passive sensor data in a large Archimedes hydrodynamic screw.
The objective of this study was to investigate the risk of injury and mortality to multiple fish species, including an assessment of the physical conditions during downstream passage in a large (10 m head, 22 m length and 3 m width, 1 MW) Archimedes hydrodynamic screw. We assessed the risk of injury and mortality by conducting replicated, live fish experiments using three species: bream (Abramis brama), eel (Anguilla anguilla), and roach (Rutilus rutilus). Physical conditions were assessed based on passive measurements collected using bespoke barotrauma detection sensors (BDS). The Archimedes hydrodynamic screws were believed to be more fish friendly; however, some rate of injury and mortality was expected due to the large dimensions and steep inclination of the screw, and it was expected to differ between filiform/anguilliform fish and fusiform/subcarangiform fish. In contrast to conventional type screws, barotrauma-related injury and mortality was not expected to occur.

2. Study Site and Turbine Description

Field investigations were carried out in a large Archimedes hydrodynamic screw installed in the bypass channel of the Albert canal navigation lock located near Ham, Belgium (Latitude 51.097410, Longitude 5.105585, WGS84), as shown in Figure 1. The Albert canal is a shipping canal connecting the Meuse River in Liège to the Scheldt estuary in Antwerp. The 56 m elevation (“head”) difference between both locations is bridged by five intermediate-head navigation lock complexes (10–15 m head; [21]) and one low-head complex (head < 10 m). Detailed information on the canal’s operational conditions and flow regimes is provided in Verhelst et al. [22].
The Archimedes screws studied in this work are unique due to their large dimension and the fact that they can serve as both pumps and turbines (Figure 2). Additional features differentiating this installation from classical Archimedes screws are their half-open housings, which allow the screw to rotate independently of the outer housing. Currently, three of the five intermediate-head navigation lock complexes on the canal (Hasselt, Ham, and Olen) include these large Archimedes screws in their bypass channels. In contrast to the Olen and Hasselt sites, the Ham installation contains one screw, which is operated solely as a pump. The pump screw has a closed housing and smaller diameter, which results in a pumping capacity of 2 m3/s, and is labelled “B” in Figure 1c.
The Ham Archimedes hydrodynamic screws have an operating head of 10 m, corresponding to the height difference between the upstream and downstream canal ponds. Each screw consists of three blades with a lead (Ld) of 4.3 m and a helix length (Lb) of 21.5 m, connected to a central shaft with a length (L) of 28 m. The rotors (shaft and blades) have an inclination (β) of 38° and are designed to rotate at 33, 40, or 48 Hz (13.71, 16.62, and 19.95 rpm), which we designate as the operational scenarios of low, medium, and high rotational speeds, respectively. The maximum power output of the installation is 1.2 MW when all three screws are operating at the highest rotational speed of 19.95 rpm (Table 1). In this study, fish and barotrauma detection sensors were assessed for all three operational scenarios. The outflow of the screws is located in a concrete, trapezoid basin of 12 × 19 × 3 × 22 m with a constant 5 m water depth. Fish were collected in a custom fabricated steel cage with a trapezoidal shape (3 × 10 × 1 × 11 m), installed at the outflow of the basin into the shipping canal (Figure 1c). Table 1 below provides a summary of the abbreviated terms used to specify the screw’s characteristics following the terminology used in [23], including their corresponding values.

3. Materials and Methods

3.1. Data Collection

3.1.1. Fish

Hatchery-raised bream (Abramis brama), European eel (Anguilla anguilla), and roach (Rutilus rutilus) were selected to assess the risk of injury and mortality on downstream fish passage through the screws. These three species were chosen because they constitute 57% of the total fish biomass in the shipping canal [23,24]. The species represent two different body shapes (fusi- and filiform) and swimming modes (subcarangi- and anguilliform). In addition, silver eel use the shipping canal as a migration route to the sea [22,25,26].
Three replicates of 100 individuals from each species for each rotational speed (low, medium, and high, see Table 1) were forced to pass through the screw, resulting in a total of 2700 individuals. A breakdown of the trials is provided in Table 2. Three repetitions per test species and operational scenario were required to assess handling-related effects such as transporting the fish and contact prior to the injection in the screw. Captured individuals were measured and weighed and their condition (dead or alive) and physical status was evaluated based on visible external or internal injuries following protocols from Buysse et al. [27,28] and Mueller et al. [29]. Injuries were divided into three categories: (1) injury free; (2) minor superficial scratches for eel, scale loss for over maximally 25% of the body surface, and fin injuries; and (3) internal bruising (contusions), swelling or bleeding (hemorrhages), scale loss of at least 25% of the body surface, the presence of cuts/slashes, decapitation, or divided into parts. Category two was classified as slight injury, whereas category three was defined as severe injury. We refer to Mueller et al. [29] for a detailed presentation of the injury types. Following this work, fin damage entailed both hemorrhages and tears. At the Ham site, neither fin amputations nor spine deflections were observed. Emboli and pigment anomalies were not evaluated. All individual hatchery fishes were free of fungal or parasitic infections and fish condition was good. Fish length/weight data are provided in Figure A2 of the Appendix A. The collected data on injury and mortality analyzed in this study are publically available at the Zenodo repository (doi:10.5281/zenodo.4001981).
All fish were introduced into the screw at the top of the half-open screw housing, as seen in Figure 2 through an inclined double-walled polyethylene tube with a 0.3 m inner diameter. This allowed them to move along with the flowing water into the screw, before the first winding. Potential effects of the injection system were evaluated by screw passage effects on naturally passing fish. These are wild fish that swum or drifted from the bypass channel into the screw. They were captured and observed for 24 h, during which all three turbines were operational. The wild fish tests were performed during winter (December and January) and spring (April and May) months to account for differences in seasonal fish movement and migration behavior. Over 11 24 h monitoring events, a total of 244 fish (range 4–55 fish/24 h monitoring event) were caught of 11 different fish species.
Fish were collected by raising the cage out of the water and were subsequently transferred via a fyke net into drift nets, which were installed at the downstream portion of the cage. All nets were fabricated from knotless material to minimize damage to fish epidermis. Not all fish could be collected from the basin after screw passage due to the dimensions of the basin and the relatively large distance of the cage to the screw outflow. Fish that were not caught after screw passage remained in the basin and their state could not be evaluated. All fish were evaluated for 24 h delayed mortality. Fish classified as alive were those who remained alive 24 h after capture and first evaluation. Fish that were dying directly after capture or died within 24 h were classified as dead.

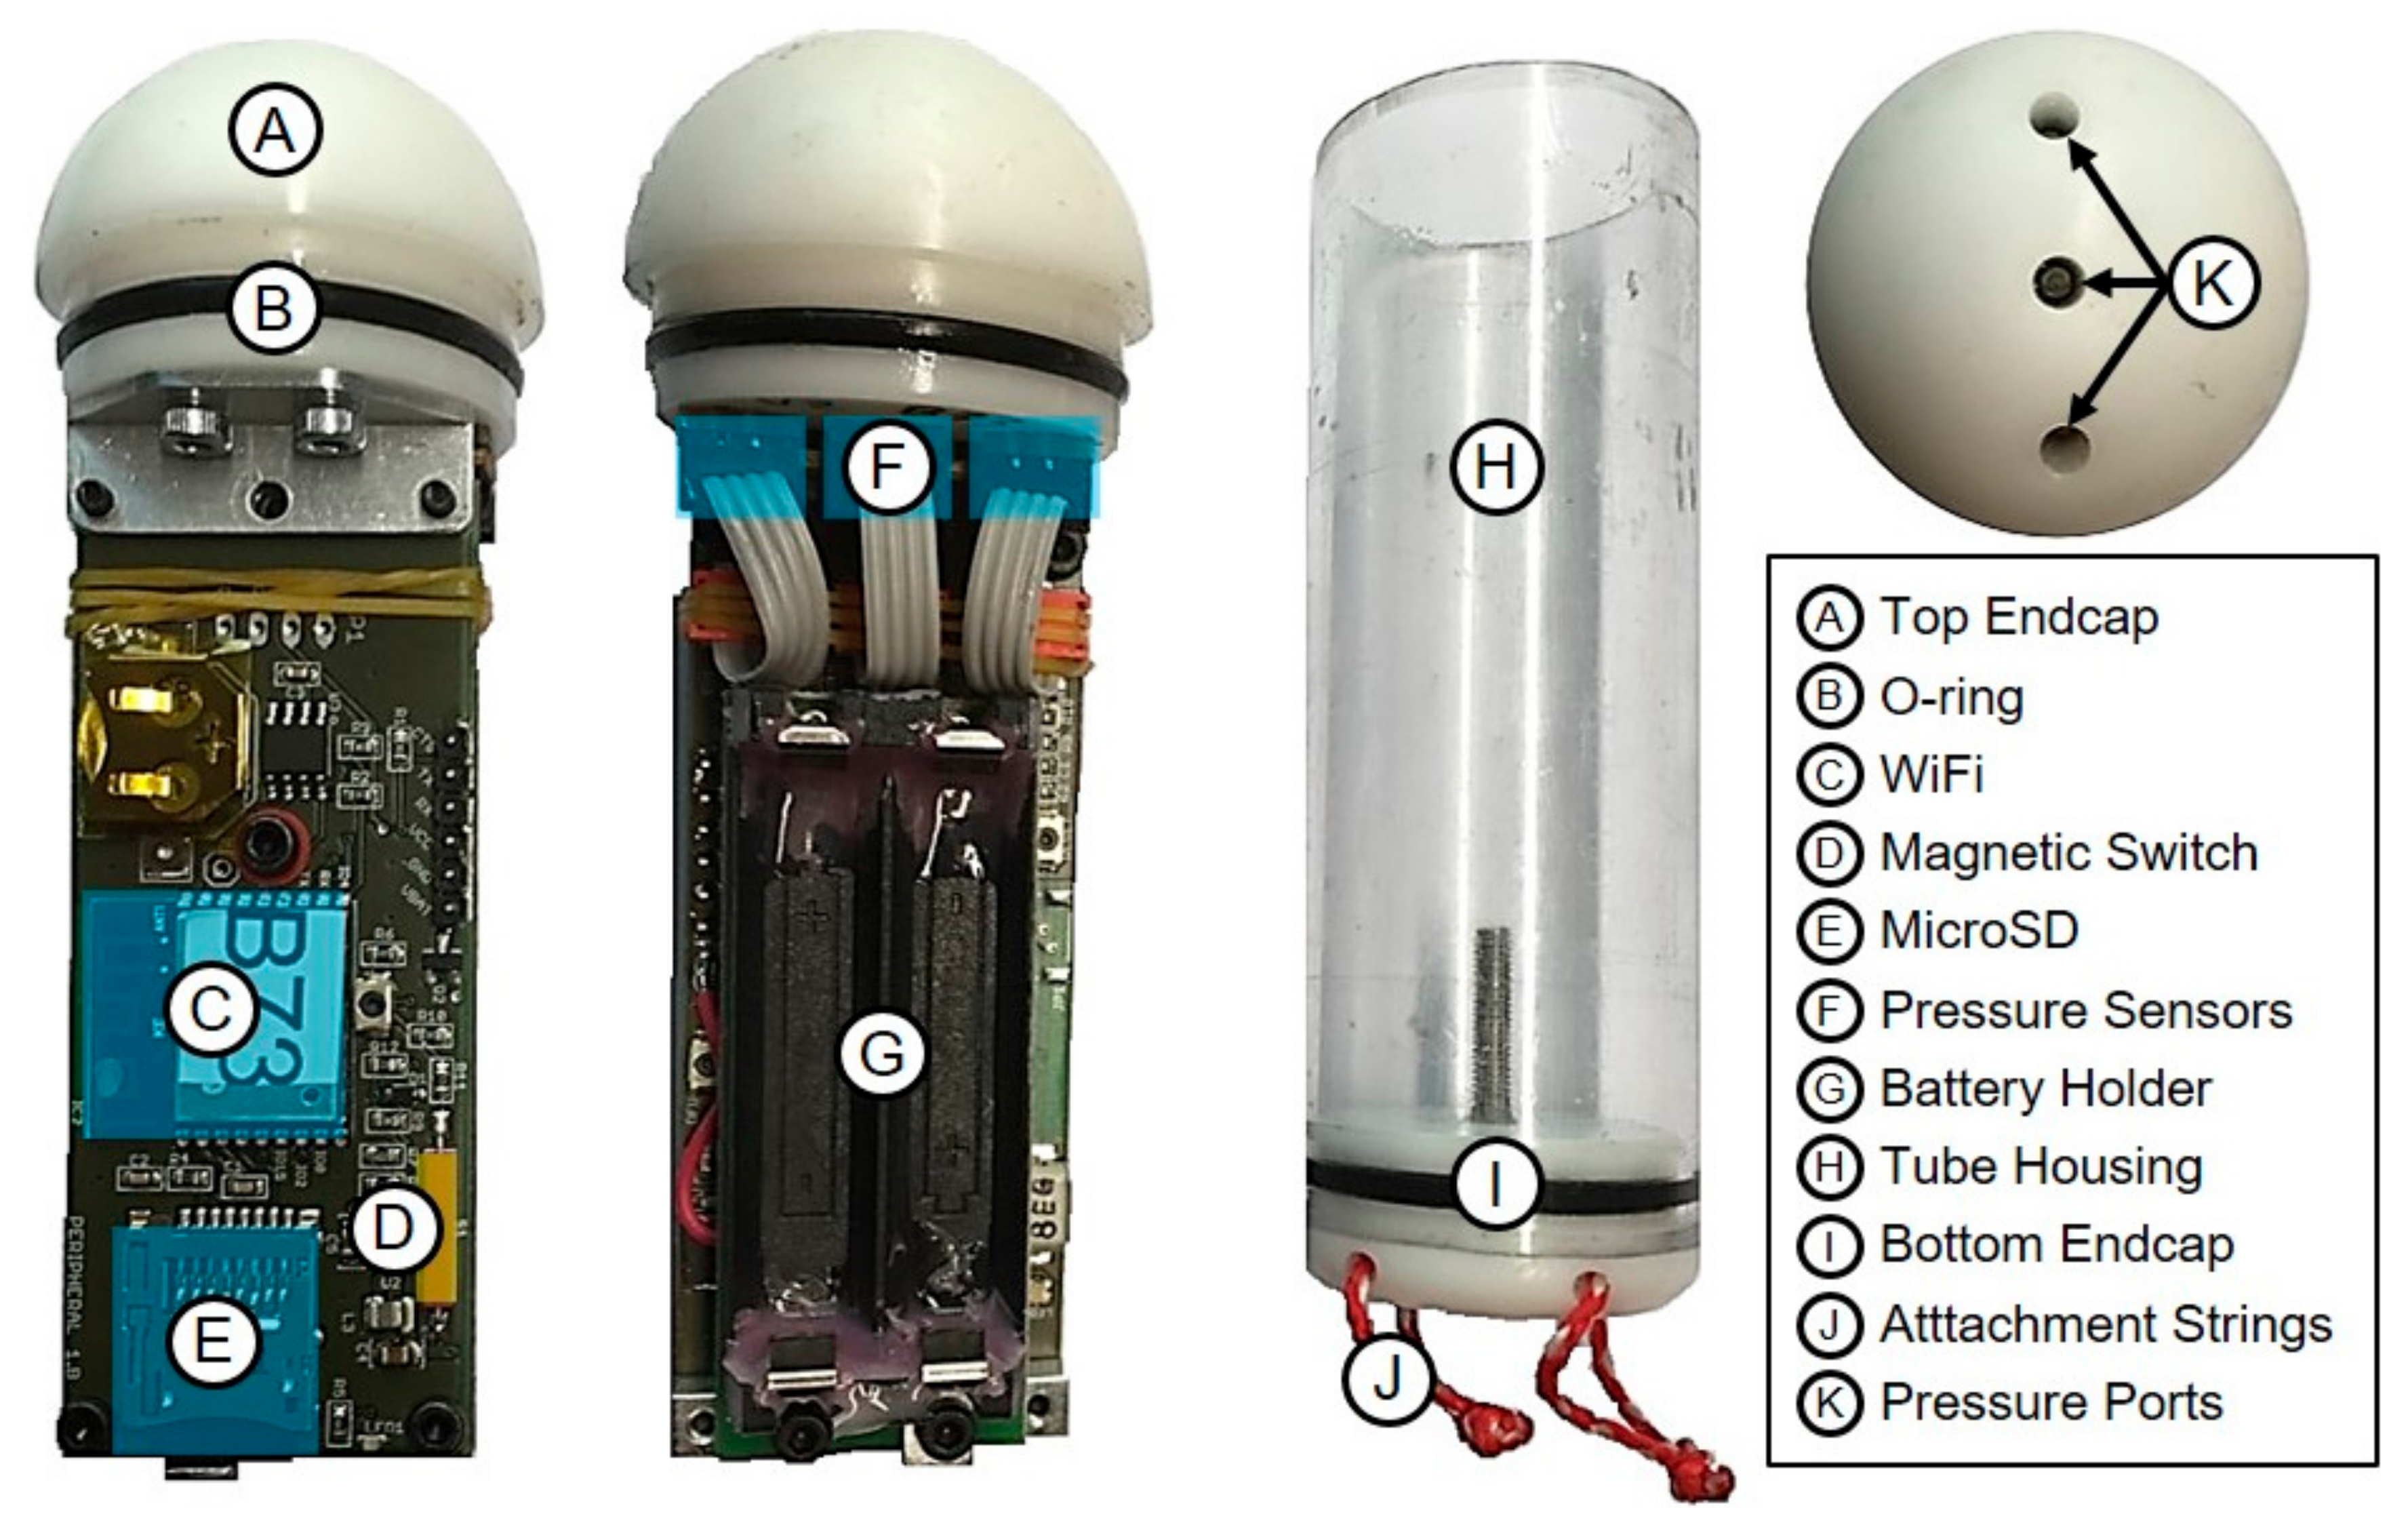
3.1.2. Barotrauma Detection Sensors

To measure the physical conditions during turbine passage, Barotrauma Detection System (BDS) sensors were passed through the turbine. The BDS is a rugged, neutrally buoyant, multi-modal underwater sensor which measures the total water pressure, linear acceleration, rotation rate, magnetic field intensity and absolute orientation (roll, pitch and yaw angles). The sensors were developed by the TalTech Centre for Biorobotics as part of the EU H2020 FITHydro project. Analysis of the BDS sensor unit data allows to establish exposure to events such as decompression, collisions and severe turbulence. An overview of the sensor components is provided in Figure 3. Neutral buoyancy of the BDS is achieved in the field by rotating the flat end cap to increase or decrease the device volume. Installed inside the hemispherical end cap (Figure 3A) are three identical digital total pressure transducers (Figure 3F,K) which measure the sum of the atmospheric, hydrostatic and hydrodynamic pressures. The transducers used in this work have a maximum pressure of 200 kPa (MS5837-2BA, TE Connectivity, Switzerland) and a rated sensitivity of 0.002 kPa (~0.2 mm water column). All data were recorded at 0.001 kPa resolution with 0.1 kPa (~10 mm water column) accuracy. The accuracy was determined by laboratory testing of each fully assembled BDS in a barochamber up to 550 kPa, 2.75 times the maximum rated pressure of the sensor, against a commercial pressure sensor (HOBO U20-001-02, Onset Computer Corp., USA). The additional sensors provide fault tolerance over a single sensor using triple modular redundancy. Furthermore, the three pressure transducers can be installed for deployments requiring either a 200 or 3000 kPa range. A custom waterproof housing holds the BDS electronics and two AAA batteries in a 140 mm long, 40 mm diameter polycarbonate tube with two machined polyoxymethylene end caps, with a total dry mass of 147 g.
A unique feature of the BDS sensors is that they are programmed for atmospheric auto-calibration to remove the site-specific changes in barometric pressure. This is the only data processing which occurs during sensor deployment and removes the need to correct the pressure readings to a common atmospheric pressure datum in post-processing. After the BDS is turned on using a magnetic switch, pressure data are logged for 15 s. The barometric pressure and any transducer-specific offsets are recorded, and all three transducers are set to a reference value of 100.0 kPa at local atmosphere. The cost of each BDS sensor is approximately 500 EUR.
Complementary to the three redundant pressure transducers, the BDS also contains a digital nine degree of freedom (DOF) inertial measurement unit (IMU), which includes a linear accelerometer, gyroscope, and magnetometer (BNO055, Bosch Sensortec, Reutlingen, Germany). The IMU uses proprietary sensor fusion algorithms to combine the linear accelerometer, gyroscope, and magnetometer readings into the absolute orientation (roll, pitch, and yaw angles). When the IMU is in sensor fusion mode, all variables are saved at 100 Hz with the exception of the magnetometer, which records at a maximum rate of 20 Hz. The IMU has the major benefit that the absolute orientation is calculated in real-time. The downside is that the sensor fusion algorithms are “black box”. Static and dynamic tests with a hexahedron turntable found that the BN055 orientation errors ranged from 0.53° to 0.86° for the pitch angle, 1.28° to 3.53° for the yaw angle, and 0.44° to 1.41° for the roll angle [30]. The BDS sensor data is saved as an ASCII text file with the structure provided at the Zenodo repository (doi:10.5281/zenodo.4005760). Data are recovered wirelessly after each deployment using the device’s ESP8266 WiFi module.
The BDS sensor tests were performed over the course of two days, on the 21 and 22 June 2018. The field deployment process for BDS sensors is based on successful tests at other sites, including a large Swiss Kaplan turbine [31]. The deployment process at the Ham study site involved four stages and used the same injection system as the live fish experiments. First, two balloon tags (YoYo Balloons, Suzuki Latex, Chiba, Japan) were affixed to the attachment cords (Figure 3K) on the back of the sensor, and 3 mL of 40% acetic acid solution at ambient air temperature was injected into each balloon. Each balloon had a gelatin capsule (Gr 00, Nagamil, Germany) filled with 2 g of sodium bicarbonate. The sensors were activated via the magnetic switch and atmospheric compensation was performed. After compensation, the sensors were hand-dropped into the Archimedes screw injection pipe. The sensors were recovered in the tail water with a net within a period of 5–10 min after the balloons had inflated. A summary of the BDS deployments is provided in Table 3. After recovery, the binary data files were transferred from the BDS using WiFi to a laptop for post-processing and analysis. Damage to the sensor housing was visually inspected, photographed, classified as “no damage”, “crushed”, or “scratched”, and marked with a black permanent marking pen to avoid false positive damage classification after redeployment.

3.2. Data Analysis

3.2.1. Fish

First, the test proportions of living and dead fish and the injury classes were defined. The test proportions were calculated as the number of fish per category relative to the total number of fish recovered. Next, chi-squared tests were performed to evaluate significant differences in mortality between species considering the three operational scenarios. The null hypothesis was that the mortality rates were independent of species and operational scenario. If the null hypothesis was rejected, a Bonferroni adjusted post hoc test was performed to indicate what level(s) significantly differed.
In addition to the chi-squared post hoc test for mortality, the pairwise difference between the three species was evaluated with a Cochran–Mantel–Haenszel (CMH) test. This was carried out using a three-way contingency table with species as the dependent variable and the operational scenario as the control variable. The null hypothesis of this test is accepted if the odds ratio of the partial tables equals one, meaning that the odds of the species do not differ [32]. With regards to this test, it is worth noting that the proportions of recovered fish were found to be nearly equal over the three rotational speeds. Slightly less bream and more roach were recovered over all tests performed, and the average proportions differed within 10% of the expected proportion of ~30% for all species. On average, 24% of the caught individuals were bream, 34% eel, and 42% were roach.
It is important to state that not all test fish could be recovered after screw passage. To maximize the catch efficiency, the turbines were kept operative for one to a few hours daily and for up to one week after a test was performed. Still, a percentage of the tested fishes could not be evaluated due to low capture rates, meaning that the results of the reported experiments may systematically underestimate the impact of the screws if the missing fish succumbed to injury. Hence, additional experiments with dead fish were performed to account for this. Specifically, 66 bream, 11 eel, and 106 roach were freshly killed and released in the concrete basin below the turbines to assess the recovery rates of 66%, 46%, and 53%, respectively. These percentages were not far below the range of the percentages of live fish recovered after each test, which ranged 34–49% (average 42%) for bream, 51–68% (average 60%) for eel, and 59–100% (average 72%) for roach. Although not statistically conclusive, this does indicate that the expected proportion of dead fish among the missing test fish is similar or slightly higher than the proportions of the recovered test fish. Finally, the probability of mortality for a fish during screw passage was calculated in addition to the observed proportions of dead fish per species:
P D =   P D | V P V P V | D
where P(D) is the probability for a fish to die due to screw passage, P(D|V) is the probability that captured test fish were dead due to screw passage, P(V) is the probability that a test fish was captured after passage, and P(V|D) is the probability of recapturing a freshly killed fish after screw passage. All fish test data were analyzed with the R software [33].

3.2.2. Barotrauma Detection System Sensors

The pressure metrics evaluated in this work are the nadir (lowest) pressure, pressure maximum, rate of pressure change (RPC), and a new metric, the maximum absolute pressure gradient. The RPC is used to assess the risk of barotrauma, defined as the largest magnitude of rapid decompression fish may experience during passage [34]. It is calculated as the ratio of the acclimation pressure of the fish upon entering the turbine to the nadir pressure. At the Ham site, fish enter the screw near the water surface at a shallow depth, which corresponds to the minimum rate of pressure change. The minimum RPC was calculated for each deployment as the ratio of the reference atmospheric pressure (100.0 kPa) to the nadir pressure recorded by the BDS (e.g., 100.00 ÷ 98.1 = 1.02). Study results from sensor data from a screw turbine [19] are provided for comparison with the BDS pressure variables calculated for the Ham test case and are presented in Table 4. The evaluation of BDS pressure data using the non-parametric Andersen–Darling test (α = 0.05) revealed that none of the pressure-based statistics followed a normal distribution, and we were thus unable to follow the approach taken in Pflugrath et al. [35] using T-tests. We evaluated differences between the four pressure-based metrics across the three scenarios using Kruskal–Wallis tests (α = 0.05). Specifically, the dependent variables were the nadir pressures, pressure maximum, minimum RPC, and the maximum absolute pressure gradient, and the three scenarios were the independent variables.
Impact event data differ from passive transport data due to differences in their time series signatures [36]. Specifically, impact events are characterized by a rapid changes in the kinetic energy of the sensor [37]. An impact-free deployment can be conceptualized as a sensor that flows through a turbine following a smooth trajectory. For such a deployment, a sensor time series showing the change in kinetic energy per unit time would remain very nearly zero over the entire passage duration. It is worth noting that this also applies to regions of the flow field with large velocity gradients, most commonly near walls and turbine blades. For example, a body of 1 kg mass experiencing a rapid change in translational velocity of 10 m/s over a one second interval sampled at 100 Hz results in a difference of only 0.005 Joules of translational kinetic energy.
Based on the changes in the sensor’s kinetic energy, we developed a new classification method for turbine passage sensor data, as illustrated in the “impactograms” presented in the Results section of this work. We calculated the total change in kinetic energy as the sum of the change in the kinetic energy of translation, Δ K E t , and the change in the kinetic energy of rotation, Δ K E r . As the mass, m, and moment of inertia, I, remain constant, the changes in kinetic energy are determined by the squared changes of the velocity of translation, Δ v 2 , and the squared changes of the angular velocity, Δ θ ˙ 2 . The change in the kinetic energy of translation was calculated as:
Δ K E t = 1 2 m Δ v 2 ,
and the change in the kinetic energy of rotation was given by:
Δ K E r = 1 2 I Δ θ ˙ 2 ,
The moment of inertia was approximated for the BDS sensors by treating them as simple cylinders of uniform density with total mass (M) of 148 g with 2 cm outer radius (R) and a total length (H) of 14 cm. Ix = ½ MR2; Iy,z = M(3R2 + H2)/12. The influence of this approximation is negligible, because the moment of inertia remains constant for all events and creates only a small constant bias in the calculation of the kinetic energies, which are driven by the squared changes of the translational and angular velocities as found in Equations (2) and (3).
We first converted the linear acceleration from body-oriented coordinates to a Cartesian reference system based on the magnetic angular rate and gravity (MARG) using the quaternions recorded by the IMU [38]. The coordinate transformation has no impact on the resulting analysis, but does aid in the interpretation of the sensor data results, because the accelerometer data can be viewed from a fixed inertial reference frame. Afterwards, we estimated the change in the three-dimensional velocity over time by integrating the linear acceleration data, as in [39]. Changes in the rotational velocity were obtained directly by calculating the difference between subsequent angular velocity measurements recorded by the rate gyro. The change in the kinetic energy of rotation was calculated using the body-oriented reference frame, because rotational motion is easier to interpret in this inertial reference system. Finally, for each deployment the total amount of kinetic energy of translation and rotation were summed and the ensemble mean was calculated for each discharge scenario for statistical analysis.
Impacts were counted as peaks in the acceleration magnitude, which we designate as “large impacts” if the acceleration magnitude was five times the gravitational acceleration or higher (≥5 g), and as “small impacts” if it was smaller (<5 g). The ensemble mean of the impact count was tabulated for each of the three operational scenarios. In addition to the impact count per deployment, we evaluated the duration between consecutive large impacts for each deployment, and the ensemble means of these durations were also calculated for each scenario. We also investigated the timing to the first large impact in order to determine if there was a particular region of the screw that may present a higher risk of injury and mortality. To do this, we calculated the time to the first large impact as well as the percentage of the average passage duration until this first large impact.
The differences between the kinetic energy IMU-based metrics were evaluated across the three operational scenarios using Kruskal–Wallis tests (α = 0.05). Specifically, the dependent variables were taken as the sums of the kinetic energies over the deployment Δ K E t , and Δ K E r , and the three operational scenarios were the independent variables. In addition to the kinetic energy IMU-based metrics, we also investigated the occurrence of large impact events, which were classified as peaks of the acceleration magnitude (after removing the gravitational acceleration) that were greater than 5 g and a minimum of 0.5 s apart. This was done by calculating the percentage of deployments for each discharge scenario in which a peak was recorded.
Finally, we created impactograms for each of the three operational scenarios to investigate the intensity, empirical probability, and temporal occurrence of impact events, which are discussed in more detail in the Results. The plot was created by calculating the count of BDS impacts greater than a given threshold as a fraction of the total passage duration for each operational scenario. It provides a simple means to visualize the temporal distribution of impacts including their severity as a function of the normalized total passage duration for each of the three operational scenarios.
After evaluating the sensor pressure and IMU recordings, we also recorded the physical damage observed to the external plastic housing after each deployment as either “no damage”, “crushed”, or “scratched”. The statistical assessment of crushing and scratching events was performed using a chi-squared test for independence. A contingency table for the number of no damage vs. damaged (crushed or scratched sensors) for the three operational scenarios was evaluated at the 1% significance level. All BDS sensor data analyses were performed with MATLAB version 2019b software [40].

4. Results

4.1. Fish

The results were assessed as the proportion of fish which were injured or died during screw passage, as our main objective was to determine if there were significant differences in mortality for the three species and to assess the potential impact of the operational scenarios that corresponded to increasing rotational speeds. Accordingly, the results provide insight into the proportions of fish showing a certain injury type and severity.

4.1.1. Mortality Rates
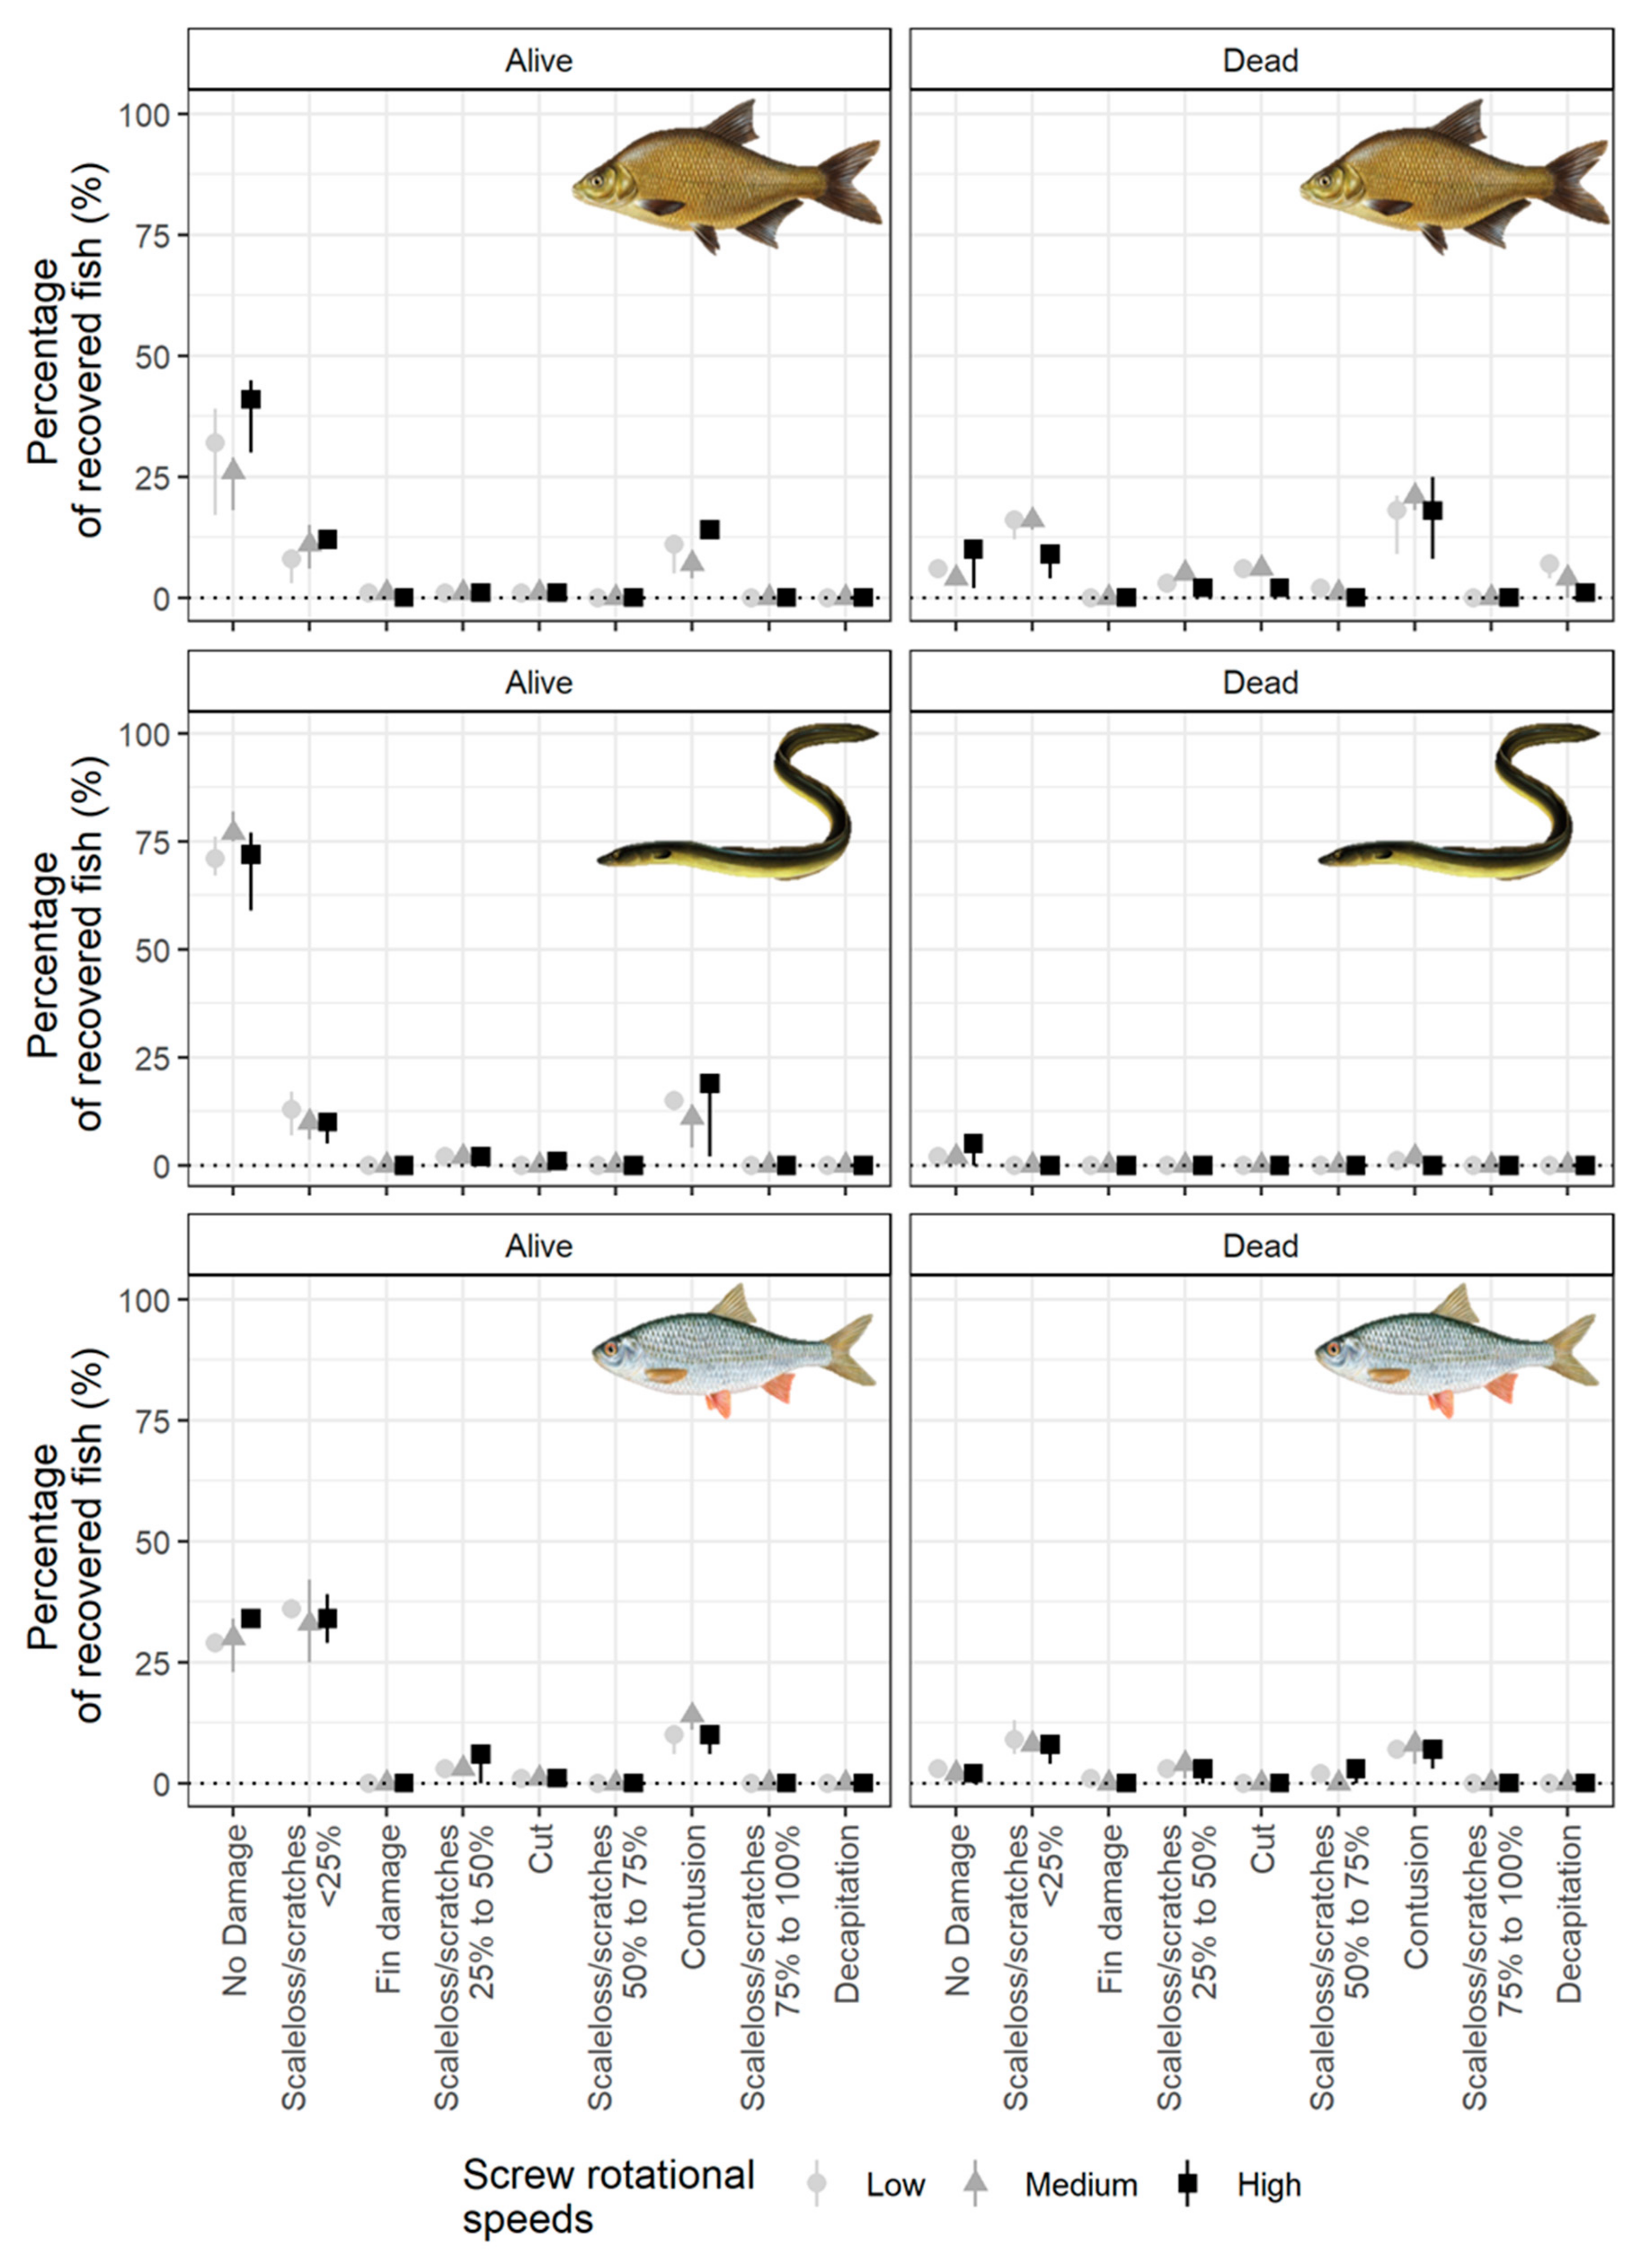
Considering the three investigated species and operational scenarios, the majority of all recovered fish were alive after screw passage. Mortality rates of recovered fish were 37% for bream and 19% for roach when averaged over all operational scenarios and corrected for the unobserved test fish. In stark contrast, the averaged mortality rate for eels after screw passage was 3%.
The chi-squared test of mortality rates indicated that the three different operational scenarios tested in the Archimedes hydrodynamic screw in this study did not have a significant effect when the differences between species were ignored (χ2 (2, n = 1564) = 1.71, p = 0.43). Furthermore, it was observed that the mortality rates are significantly different between species only when operational scenarios are ignored (χ2 (8, n = 1564) = 86.32, p < 0.001). The average mortality rates were then 42%, 1%, and 18% for bream, eel and roach, respectively. Hence, a post-hoc test indicated significant deviations from the expected mortality rates for bream and eel, but not for roach. When both the fish species and operational scenario were accounted for, the observed and expected numbers significantly differed for a limited number of cases (χ2 (2, n = 1564) = 219.72, p < 0.001, respectively). Post-hoc testing indicated an elevated risk of bream mortality for the slowest (p < 0.001) and middle (p < 0.001) rotational speeds with mortality rates of 46% and 48% on average, respectively (Figure 4). Lower mortality rates for bream (30% on average) and roach (14% on average) were observed only at the highest rotational speed when compared with the slowest and middle rotational speeds. An overview of the mortality rates is provided in Figure 4.
The CMH test on the differences in odds ratios between species provided additional insight on the effects of the three different operational scenarios and differences between species. The odds ratios between each pair of species were found to differ significantly. Specifically, it was found that eels had an overall lower mortality rate after screw passage when compared with bream (χ2 (1, n = 916) = 219.72, p < 0.001) and roach (χ2 (1, n = 1184) = 66.10, p < 0.001). Overall, roach had a slightly lower mortality rate than bream (χ2 (1, n = 1028) = 71.02, p < 0.001; Table A1). Finally, the CMH test revealed that the differences in the odds ratios for all three species were slightly lower for the highest rotational speed, indicating a smaller species effect at the highest rotational speed. A summary of the mortality rate statistics can be found in Table 5 and in Table A1.

4.1.2. Injury

The classification of injury severity was assessed as either “no”, ”slight”, or ”severe” and were strongly dependent on the species (χ2 (4, n = 1564) = 285.68, p < 0.001). Similarly to mortality, there was a significant difference between injuries for each species for a limited number of operational scenarios (χ2 (16, n = 1564) = 91.05, p < 0.001). Specifically, the Bonferroni post-hoc test indicated that severe injuries of bream occurred significantly more at the low and middle rotational speeds than would be expected if there was no effect of operational discharge. In contrast, eels were most likely to pass downstream without any external injuries for all operational rotation speeds. Post-hoc tests for roach revealed that they were more likely to have slight injuries for the low and high rotational speeds. Specifically, around 55% of recovered bream were found to be severely injured after passage at the lowest and middle rotational speed, compared to on average 36% without external injury. The severe and slight injury rates observed for eels were 19% and 11%, respectively, compared to 73% of them being not externally injured after screw passage averaged over the three operational scenarios. Considering that slight injuries were observed more than expected on the low and high operational rotation speeds for roach (Table A2), as many of them were severely injured as slightly and not injured, with percentages ranging from 30% to 36%, as shown in Figure 5.
Considering all species and operational scenarios, slight injuries were mostly scale loss for less than 25% of the body, and fin damage was not frequently observed. Specifically, only 0.2% of all roach (only the dead ones) and bream (only the living ones) suffered fin damage, and eels were not observed to have it (Figure 6). The severe injury type that was observed most often was a contusion. Cuts, scale loss over more than half of the body, and decapitations were unique. Only bream were decapitated, and only at the low (5%) and middle rotational speeds (3%). Contusions occurred on all species where they were found on 16% of bream, 10% of roach, and 14% of eel (Figure 6).

4.2. Barotrauma Detection System Sensors

4.2.1. Pressure Passage Metrics

The results of the nadir and minimum RPC (p = 0.42, χ2 = 1.72) tests are identical, because the RPC is calculated using a fixed acclimation pressure, and indicate that there was no significant difference between pressure minima across the three operational scenarios. Similarly, a comparison of the pressure maximum (p = 0.28, χ2 = 2.56) failed to indicate a significant difference between scenarios at the Ham study site. Considering the nadir, maximum pressure, and minimum RPC, there were no significant differences across operational scenarios. However, the Kruskal–Wallis test results from the maximum absolute pressure gradient (p = 0.04, χ2 = 6.6) detected a significant difference between scenarios, and a Tukey–Cramer post-hoc test identified the difference as being between the maximum absolute pressure gradients for the 33 and 40 Hz scenarios (p = 0.04).

4.2.2. Impact Events and Kinetic Energy Metrics

Considering the change in kinetic energy of translation across the three operational scenarios (Table 6), a significant difference was found (p = 0.03, χ2 = 6.93), and Tukey–Kramer post-hoc tests revealed that the difference was between the mean ranks of the operational scenarios “medium” (40 Hz) and “high” (48 Hz). These results stand in stark contrast to the change in rotational kinetic energy (p = 0.75, χ2 = 0.58), where the mean ranks across all three scenarios were found to be statistically insignificant.
The chi-squared test for independence and Bonferroni adjusted post-hoc test revealed a significant effect of rotational speed, where more scratches and crushes were observed than expected at the median rotational speed and less at the highest rotational speed (χ2 (2, n = 124) = 9.92, p < 0.01).
It was found that for the lowest rotation rate of 33 Hz, 33.3% of deployments experienced large impacts, as illustrated in Figure 7. This is nearly half of the total number of large impacts experienced by the other two scenarios, where 40 Hz had 66.7.1%, and the 48 Hz rotation rate had 54.6% of deployments with large impacts. Statistical testing was not performed for the impact metrics, because the resulting sample sizes were too small to assess the differences between scenarios at a 95% confidence interval.

4.3. Summary of Statistically Significant Results from Live Fish and Sensors

Due to the different metrics used to assess injury, mortality, and physical conditions, it is currently not possible to directly compare live fish and sensor experiment results. A key finding of this work was that statistical tests performed from the live fish experiments revealed complex relations for the species-specific probabilities of injury and mortality. Data from the passive sensors indicates that there is a very broad range of physical conditions present when passing through the Archimedes hydrodynamic screw investigated in this study. In summary, the effect of rotational speed significantly differed for a limited number of cases and was species-specific. The CMH test indicated that the differences in mortality rates between species was smaller at the highest rotational speed. The confounding influence of the rotational speed on the mortality rates for each fish species was performed using the Breslow–Day test statistic, where it was found to be negative for all pairwise comparisons (bream–eel: χ2 (2, n = 916) = 224.52, p < 0.001, bream–roach: χ2 (2, n = 1029) = 74.13, p < 0.001, eel–roach: χ2 (2, n = 1185) = 68.60, p < 0.001). The pressure passage metrics were similar over all three rotational speeds, except the absolute maximum pressure gradient, which significantly differed between the lowest and middle rotational speeds. Similarly, almost none of the kinetic energy metrics were significantly different between operational scenarios. Only the change in the kinetic energy of translation between the middle and highest rotational speeds was found to be significantly different. The external sensor damage varied with operational scenario, where significantly less damage was observed at the highest rotational speed (48 Hz), and slightly more damage occurred at the middle rotational speed (40 Hz; Table 5).

5. Discussion

Archimedes screw turbines are frequently touted to be more “fish-friendly” than conventional turbines due to their low rotational rates and correspondingly reduced blade tip speeds, reduced rates of pressure change, fluid shear, and overall number of blades, which reduce contact probability [5]. This can lend the impression that they are not harmful to fish. The objective of this study was to investigate the risk of injury and mortality to multiple fish species, including an assessment of the physical conditions during downstream passage in a large Archimedes hydrodynamic screw using live fish and passive sensors. Here we discuss our findings on mortality and injury of the tested fish; the influence of the rotational speed on mortality, injury, and physical conditions during passage; and how these results are related to previous investigations. It is our aim to provide new insights on the fish-friendliness of Archimedes hydrodynamic screws so developers can further optimize the designs to minimize the impact for all fish species.

5.1. Fish Mortality and Injury and Their Relation to the Physical Conditions Experienced

We found significant differences in mortality rates between bream, eel, and roach. The mortality rate for eel was the lowest. Multispecies studies are important because the majority of field studies of turbine passage involving live fish focus on a single species [41]. The multispecies study of an Archimedes hydrodynamic screw by Schmalz [6] observed mortality and injury per species, but did not evaluate potential differences between species. Kibel et al. [7,42] found no substantial impacts of an Archimedes hydrodynamic screw on eel, trout, and salmon.
Our observation of lower mortality rates for eel compared to other species was also found in Alden turbine [5], but is in stark contrast with the higher mortality rates found in Kaplan turbine studies [41]. The higher mortality rates for eels in Kaplan turbines were ascribed to the higher risk of turbine blade impingement due to their elongated body shape. We speculate that the different effects of Kaplan versus Archimedes hydrodynamic screws on eel mortality follows from the ability to react to the lower water velocities experienced during passage in an Archimedes screw. The significant difference between bream and roach, which have more similar body shapes, may indicate that species-specific behavior may potentially influence mortality rates in Archimedes hydrodynamic screws. Apart from the body shape, additional factors that might affect injury rates (and therefore potentially also mortality rates, although linkages between mortality and injury remain largely unexplored) are scale type, body size, and swim bladder morphology [29]. In our study we also tested, but did not find any significant effects of, body size on mortality rates.
Overall, the species-specific mortality rates observed here were higher than the rates found in previous studies that evaluated Archimedes hydrodynamic screw impacts on fish [7,9,14,15,42]. However, a direct comparison between studies is complicated by differences in the methodology applied, species investigated, and differences in turbine design and operation. Moreover, information on turbine design and operation are not always reported, even though it is established that it may influence the impact that the screw has on fish injury and mortality. For instance, Bevelhimer et al. [43] conducted lab experiments on live fish where it was found that higher translational strike velocities and thinner blades resulted in higher mortality. Therefore, studies of rotational screw impacts on live fish should always endeavor to report the screw characteristics, so that studies can be cross compared and effects evaluated in addition to lab studies. Detailed characteristics can further enhance the usefulness of biological assessments of turbine impact for validation of model simulations. In this work, we reported the characteristics of Archimedes screws following the recommendations of Al-saati [44]. Additionally, we suggest reporting the gap size, the presence of fish deterrence systems or fish-impact improvement measures (e.g., adapted leading edge profiles [12]), blade tip speeds, and blade thickness if available.
The injury rates in this study indicate species-specific differences for uninjured fish and fish showing slight scale loss. Although we did not statistically test it, because we assume the occurrence of unknown confounding factors, the frequency patterns were similar over all three species. When accounting for the state of the fish (dead or alive), with the exception of uninjured surviving eels (higher prevalence compared to bream and roach), slight scratches in all eels were found with lower prevalence, and slight scale loss in roach was found in higher prevalence.
Slight scale loss (<25% of the body) and contusions were most frequent among the externally injured fish observed in our study. Most likely, the contusions were caused when the fish was pinched between the screw and the housing. Unfortunately, we were unable to discriminate between pinches at first blade strike versus pinches at other locations in the screw along the way down. The large dimensions of the screw (22 m length) cause screw deflection with resulting gaps of up to 2 cm (visual assessment), where fish can be pinched at different locations along the length.
The complexity of physical passage was illustrated by the non-parametric Andersen–Darling test on the pressure-based statistics. The novel impactograms provide the first assessment of the temporal distribution of passive sensor impacts, including their severity and probability, as a function of the total passage duration and suggest that passage through the Archimedes screw is highly chaotic. No two single passage events showed the same empirical pressure distributions, and there were large variations between the timing of impact events. The analysis of the timing to the first impact showed that the duration to first impact decreased with increasing discharge, and that, considering all operational scenarios, all large impacts occurred on average within the first 42% of the passage duration. This indicates that a risk of injury or mortality due to impact events greater than 5 g may be more likely to occur during the early stages of passage for the range of discharges at the Archimedes screw investigated in this work.
The values of the pressure-based statistics are similar to those reported in Boys et al. [19]. The nadir values in both studies remained close to atmospheric pressure, where the overall range observed in the Ham screw turbine tended to be slightly higher (minimum nadir 93.5) than the screw turbine investigated in Boys et al. [19] (minimum nadir 81.8). Unsurprisingly, the larger Ham screw turbine had deeper troughs and also was able to entrain the sensors deeper into the tail water, and therefore the mean maximum pressures at Ham (118.7–112.4 kPa) exceeded those at the Boys et al. [19] test site (116.7 kPa) for both scenarios. The mean minimum RPC for both screws remained close to unity for all test cases (Ham RPC: 1.00–1.01, Boys et al. test site [19] RPC: 0.98–0.99).
However, it should also be noted that the standard deviations and ranges of the time to first impact show that this metric was imprecise for the study site. In order to assign a probability of occurrence to this metric, it would be necessary to carry out a larger number of BDS deployments. Nonetheless, if the assumption is true that an impact event corresponds to the cause of a severe external injury, such as a contusion, cut, substantial scale loss, or decapitation, this suggests that the observed severe external injuries were not exclusively caused by the leading edge. This is an important message for Archimedes screw designers. The severe injury types, such as cuts, decapitations, and bleedings that could be related to strike events [45] were relatively less frequent. Future studies should further address the relation between the impact events and the type of injuries they cause, and ideally the relations between the injury types and the mortality rates. In contrast to our study, internal injuries should be evaluated as well in future studies. Future studies would largely benefit from new sensors that could be attached to live fish, or at least are embedded in a housing with a fish-like body shapes with well-defined mechanical properties.
The relatively high frequency of slight scale loss observed could be an indication of the occurrence of shear stress [18], which also corresponds to regions of high pressure gradients and rapid changes in the flow acceleration. Slight scale loss was proven to result from recapture net damage in previous research [10,29], where Kibel [7] assessed a recapture net damage rate of 3%. The data in this study provide an estimate of 8% (bream and eel) and 28% (roach) prevalence of slight scale loss beyond the recapture net damage level assessed by Kibel [7]. The recapture nets used in this study were not installed in the outflow of the turbine, which might have prevented high flows going through the nets compared to previous studies of recapture net damage. Barotrauma-related injuries such as damaged eyes were not observed. This is in accordance to the pressure passage metrics observed in this study, which are a clear reflection of the physical conditions in an Archimedes screw, where fish and sensors are exposed to low pressure maxima due to low water depths, as well as limited nadir pressure due to the turbine being exposed to atmospheric pressure along its length. Therefore, the results of this study further substantiate those by Boys et al. [19], where it was indicated that barotrauma or pressure-related injuries appear unlikely at Archimedes screw turbines.
Overall, our results indicate that the investigated Archimedes hydrodynamic screw is not entirely fish-friendly, and that the observed injuries are likely caused by impact events and shear stress and not by pressure-induced barotrauma.

5.2. The Role of Operational Scenarios

The rotational speed of the studied screw had a very minor influence on injury, mortality, and the physical conditions during passage. We conclude this based on the following three findings. First, no significant effect of operational scenario (rotational speed) was found in the data on live fish, if the species was not accounted for. Second, the significant effects observed per species were different for each species. For instance, eel mortality was significantly lower at the highest rotational speed, whereas this was not observed for roach and bream, and the lowest and middle rotational speeds had no significant effect on roach survival, a negative effect on bream, and a positive effect on eel.
We remain unsure as to the underlying physical causes of the significant effects of the rotational speeds on the three investigated species. The passive sensor tests indicated that pressure metrics did not differ between rotational speeds. Only the maximal absolute pressure gradient differed significantly between the lowest and middle rotational speeds. Further, the kinetic energy of translation was only found to be significantly different between the middle and highest rotational speed, and no significant differences were found for the rotational kinetic energy. Crushed sensors, which may be seen as a crude proxy for contusions on a fish, were found to be higher than expected on the middle rotational speed and lower than expected on the higher rotational speed. A potential reason for the lack of unambiguous operational effects on fish and sensors may be the discrepancy in experiencing the physical and hydraulic forces between a moving flexible fish body and the passive, rigid sensor. Causal links between actively swimming fish and passive sensor data remain to be conclusively investigated.

5.3. Weaknesses of the Present Study and Benefits for Future Research

A weakness of this study is that it was performed with hatchery-reared fish of the three species investigated. Mueller et al. [29] indicated that injuries can be different between hatchery reared and wild fish. We have evaluated wild fish injuries and mortality rates and concluded that injury types were similar [46] to those observed to the hatchery reared fish, but the numbers of wild fishes passing the screw were too low to statistically compare it to the hatchery reared fishes tested. Further, in contrast to Mueller et al. [29], we have not investigated internal injuries, such as anomalies to the spine or internal hemorrhages, which could lead to an underestimation of the mortality rates. Finally, we did not account for differences in the location (head, middle, or tail) where injuries occurred, which may provide more detailed insight into the species-specific injuries observed after Archimedes screw passage [43,47].
Future studies can benefit from the observations made and methodologies presented in this study. Most importantly, our study supports the need for multispecies studies on Archimedes hydrodynamic screws to further elucidate the impact of these turbines on migrating and local fish species. Therefore, we suggest that wherever possible, representative species are tested in forced or volitional screw passage experiments. The statistical analyses applied on mortality rates here in this study showed that differences in mortality and injury rates between species may not be exclusively tested with a chi-squared test and accompanying post-hoc tests. Additionally, differences should be evaluated using a CMH test to conclude what causes these species-specific differences. The chi-squared test in this study did not indicate a significant effect of roach on the number of surviving or killed fish, because it did not differ from the expected numbers of surviving or killed roach. However, this depends on the number of species tested and changes (lowers) when an additional species is added to the test. Subsequent comparison of the three species one by one with the CMH test indicated significant differences between roach and bream and roach and eel. Additionally, the CMH test allowed us to compare the operational scenario as an additional factor, see for example Agresti et al. [32]. The advantage of the chi-squared test over the CMH test is that it indicates how the factors affect the states tested by residual analysis. Hence, both tests complement each other to make the best conclusions on species-specific differences.
A novel contribution of this work is that we proposed new physical metrics to assess downstream passage including the kinetic energies of translation and rotation and the pressure gradient. This is the first study to cross-compare the change in translational and rotational kinetic energies during turbine passage, and the differences in these parameters should be compared in future works in other screws and turbine types as well to determine what typical distributions of these parameters are. In order to assign a probability of occurrence to this metric, it would be necessary to carry out a greater number of passive sensor deployments. Another novel development is the impactogram, which allows for the visualization of the severity and empirical probability of physical metrics during turbine passage. Future studies will include cross-comparison of the impactogram to characterize turbine passage for different turbine types. We highly encourage a review publication comparing existing studies on Archimedes screws that formulates a standardized description of the essential characteristics on screw operation and design as proposed in this publication.
Lastly, we point out that the link between the actively swimming fish and passive sensors remains to be conclusively investigated. Hence, we suggest that future studies on the impact of Archimedes and other types of hydrodynamic screws would largely benefit from newly designed sensors that could either be attached to live fish or that are embedded in a housing that resembles a true fish body.
The results of this study provide new insights into the number, type, and severity of injuries, mortality rates, and a detailed assessment of the physical conditions recorded by the sensors considering three different rotational speeds. Furthermore, suggestions are made on how fish and sensor data may be analyzed in future studies to investigate the relationships between the observed rates of injury and mortality with measurements of the physical conditions experienced during downstream passage. The novel contribution of this work is that we propose several new metrics to assess downstream passage, including the kinetic energies of translation and rotation and the pressure gradient. Finally, we provide a new type of visualization to assess the severity of turbine passage based on the normalized passage duration of multiple sensors.

6. Conclusions

The key finding of this study is that the large Archimedes hydrodynamic screw investigated in this work did pose a risk of injury and mortality to the three species investigated. Specifically, we found that (1) there are significant differences in injury and mortality between eel, roach, and bream. (2) The rotational speed of the studied screw had a minor influence on injury, mortality, and the physical conditions during passage. (3) In contrast to previous works in Kaplan turbines, the passive sensor data in the Archimedes hydrodynamic screw were highly variable, and for some physical metrics, the data were not statistically reproducible due to the complex physical environment. To clarify observations of fish injury and mortality with sensor data, sensors that can be deployed on live fish are needed. The Archimedes hydrodynamic screw turbine design could further be improved if future studies ensure a thorough cross-comparison of the physical conditions recorded by passive sensors. To this end, we encourage the use of the new sensor physical metrics proposed in this research, which include a broader range of physical variables as well as the temporal distributions of severe events. In order to evaluate the physical differences fish experience during downstream passage at other installations, we will compare the results of live fish and sensor data from this study to that of a pumping station in a future work, including live fish with body-mounted sensors.

Author Contributions

Conceptualization: J.A.T., M.S., J.C., D.B. and I.S.P.; methodology: J.A.T., J.C., R.B. and I.S.P.; software: I.S.P. and J.A.T.; validation: M.S., J.A.T., R.B. and I.S.P.; formal analysis: J.A.T., G.T., M.S., D.B. and I.S.P.; investigation: R.B., J.A.T., G.T., D.B., J.C. and I.S.P.; resources: R.B. and G.T.; data curation: J.A.T. and I.S.P.; writing—Original draft preparation: I.S.P. and J.A.T.; writing—Review and editing: J.A.T., I.S.P., M.S., R.B., G.T. and D.B.; visualization: I.S.P. and J.A.T.; supervision: J.A.T., J.C. and M.S.; project administration: I.S.P., J.C., M.S. and J.A.T.; funding acquisition: J.C., M.S. and J.A.T. All authors have read and agreed to the published version of the manuscript.

Funding

This research was funded by the European Union’s Horizon 2020 (H2020) research and innovation program FITHydro (www.fithydro.eu), under Grant Agreement No. 727830. It was also financed in part by the Estonian Research Council PUT grant 1690 and IUT grant 339. The project also received the strong financial support of the Vlaamse Waterweg NV (DVW; https://www.vlaamsewaterweg.be/).

Acknowledgments

The Centre for Biorobotics would like to thank Andres Ernits and Mairo Leier for their valuable contributions to the sensor electronics and waterproof housing development. The research institute for nature and forest (INBO, Belgium) would like to thank De Vlaamse Waterweg NV for the general logistical and technical support of the fish experiments. We are grateful for the scientific contributions of Ans M. Mouton at the start of the study and for the ad hoc field assistance of Jeroen Van Wichelen, Lore Vandamme, and Sophie Vermeersch. Most importantly, we acknowledge the essential technical support and preparations provided by Nico De Maerteleire, Sebastien Pieters, Emilie Gelaude, and Karen Robberechts of the fish experiments performed in this study.

Conflicts of Interest

The authors declare no conflict of interest. The funders had no role in the design of the study; in the collection, analyses, or interpretation of data; in the writing of the manuscript; or in the decision to publish the results.

Ethics Approval

The experiments with hatched and wild fish performed in this study are approved by the Ethical Committee of the Research Institute for Nature and Forest (ECINBO09).

Appendix A

Figure A1. Images of the Archimedes hydrodynamic screws assessed with live fish experiments. (a) Screw at Howsham Mill, river Derwent, UK, assessed by Bracken and Lucas [14]. (b) Screw at the River Dart, UK, assessed by Kibel et al. [7,42], photo credit: Fishtek Consulting. (c) Screw at Flatford Mill, river Stour, UK, assessed by Piper et al. [9]. (d) Screw at Kuhlemühle, river Diemel, Germany; assessed by Havn et al. [15], photo credit: Torgeir B Havn. (e) Screw in the river Werra in Meiningen, Germany, assessed in the thesis (not published) of Schmalz [6]. (f) Screw at the river Don, Scotland, assessed by Brackley et al. [10,11], photo credit: MannPower Hydro.
Sustainability 12 08722 g0a1
Figure A2. Length (cm) to weight (g) relations of the tested fish per species (Abramis brama (a), Anguilla anguilla (b), and Rutilus rutilus (c)) per operational scenario of the screw (Low, Medium and High rpm, see Table 1) and per repeating test (point shape).
Sustainability 12 08722 g0a2
Table A1. Overview of the statistical tests performed, the hypothesis tested, and the resulting test statistics for tests on the mortality rates as observed in live fish passage experiments at the Archimedes hydrodynamic screws of the hydropower plant of Ham on the Albert canal in Belgium.
Statistical TestFactorsNull HypothesisChi-Squared (χ2)Sample Size (N)Degrees of Freedomp-Value
Cochran–Mantel–Haenszel 1Bream-eelOdds ratios are equal219.729161<0.001
Bream-roach71.0210281<0.001
Eel-roach66.1011841<0.001
Chi-squared 2SpeciesObserved and expected frequencies are equal254.3715642<0.001
Operational scenarios1.71156420.43
Species operational scenarios86.3215648<0.001
Statistical testFactors Residualsp-Values
Post-Hoc Bonferroni 3Bream −14.08<0.001
Eel 12.57<0.001
Roach 0.221.00
Bream–low −5.27<0.001
Bream–medium −5.25<0.001
Bream–high −1.970.86
Eel–low 3.590.01
Eel–medium 3.240.02
Eel–high 3.470.01
Roach–low −0.291.00
Roach–medium 0.021.00
Roach-high 0.891.00
R packages used: 1 base, samplesizeCMH and DescTools for the Breslow-day test; 2 stats; 3 chisq.posthoc.test.
Table A2. Overview of the statistical tests performed, the hypothesis tested, and the resulting test statistics for tests on the general injury classes as observed in live fish passage experiments at the Archimedes hydrodynamic screws of the hydropower plant of Ham on the Albert canal in Belgium.
Statistical TestFactorsChi-Squared2)Sample Size
(N)
Degrees of Freedomp-Value
Chi-squared 1Species285.6815644<0.001
Operational scenarios3.41156440.49
Species operational scenarios91.05156416<0.001
Statistical TestFactorsResidualsp-Value
No injurySlight injurySevere injuryNo injurySlight injurySevere injury
Post-Hoc Bonferroni 2Bream <0.01<0.01<0.001
Eel <0.001<0.001<0.001
Roach 1.00<0.001<0.001
Bream–low 1.001.000.04
Bream–medium 0.511.000.02
Bream–high 1.001.001.00
Eel–low 0.011.000.55
Eel–medium 0.000.580.16
Eel–high 0.020.501.00
Roach–low 0.110.011.00
Roach–medium 0.560.441.00
Roach-high 1.000.051.00
R packages used: 1 stats; 2 chisq.posthoc.test.

References

  1. Waters, S.; Aggidis, G.A. Over 2000 years in review: Revival of the Archimedes Screw from Pump to Turbine. Renew. Sustain. Energy Rev. 2015, 51, 497–505. [Google Scholar] [CrossRef] [Green Version]
  2. Lashofer, A.; Hawle, W.; Pelikan, B. State of technology and design guidelines for the Archimedes screw turbine. In Proceedings of the Hydro 2012—Innovative Approaches to Global Challenges, Bilbao, Spain, 1 October 2012. [Google Scholar]
  3. Quaranta, E.; Revelli, R. Gravity water wheels as a micro hydropower energy source: A review based on historic data, design methods, efficiencies and modern optimizations. Renew. Sustain. Energy Rev. 2018, 97, 414–427. [Google Scholar] [CrossRef]
  4. Lubitz, W.D.; Lyons, M.; Simmons, S. Performance model of Archimedes screw hydro turbines with variable fill level. J. Hydraul. Eng. 2014, 140, 1–11. [Google Scholar] [CrossRef]
  5. Hogan, T.W.; Cada, G.F.; Amaral, S.V. El estado de las turbinas hidroeléctricas ambientalmente mejoradas. Fisheries 2014, 39, 164–172. [Google Scholar] [CrossRef]
  6. Schmalz, W. Untersuchungen zum Fischabstieg und Kontrolle möglicher Fischschäden durch die Wasserkraftschnecke an der Wasserkraftanlage Walkmühle an der Werra in Meiningen—Abschlussbericht; FLUSS: Schleusingen, Germany, 2010. [Google Scholar]
  7. Kibel, P. Fish Monitoring and Live Fish Trials. Archimedes Screw Turbine, River Dart. Phase 1; Fishtek Consulting Ltd.: Devon, UK, 2007. [Google Scholar]
  8. Kibel, P. Archimedes screw turbine fisheries assessment Phase II Eels Kelts. Aquacult Eng. 2008, 1, 297–310. [Google Scholar]
  9. Piper, A.T.; Rosewarne, P.J.; Wright, R.M.; Kemp, P.S. The impact of an Archimedes screw hydropower turbine on fish migration in a lowland river. Ecol. Eng. 2018, 118, 31–42. [Google Scholar] [CrossRef]
  10. Brackley, R.; Bean, C.; Lucas, M.; Thomas, R.; Adams, C. Assessment of scale-loss to Atlantic salmon (Salmo salar L.) smolts from passage through an archimedean screw turbine. In Proceedings of the the 11th ISE 2016, Melbourne, Australia, 7–12 February 2016. [Google Scholar]
  11. Brackley, R.; Lucas, M.C.; Thomas, R.; Adams, C.E.; Bean, C.W. Comparison of damage to live v. euthanized Atlantic salmon Salmo salar smolts from passage through an Archimedean screw turbine. J. Fish Biol. 2018, 92, 1635–1644. [Google Scholar] [CrossRef] [Green Version]
  12. Kibel, P.; Pike, R.; Coe, T. The Archimedes Screw Turbine: Assessment of Three Leading Edge Profiles; Fishtek Consulting Ltd.: Devon, UK, 2009. [Google Scholar]
  13. Lyons, M.; Lubitz, W.D. Archimedes screws for microhydro power generation. In Proceedings of the ASME 2013 7th International Conference on Energy Sustainability Collocated with the ASME 2013 Heat Transfer Summer Conference and the ASME 2013 11th International Conference on Fuel Cell Science, Engineering and Technology, ES 2013, Minneapolis, MI, USA, 14–19 July 2013. [Google Scholar]
  14. Bracken, F.S.A.; Lucas, M.C. Potential impacts of small-scale hydroelectric power generation on downstream moving lampreys. River Res. Appl. 2013, 29, 1073–1081. [Google Scholar] [CrossRef] [Green Version]
  15. Havn, T.B.; Sæther, S.A.; Thorstad, E.B.; Teichert, M.A.K.; Heermann, L.; Diserud, O.H.; Borcherding, J.; Tambets, M.; Økland, F. Downstream migration of Atlantic salmon smolts past a low head hydropower station equippped with Archimedes screw and Francis turbines. Ecol. Eng. 2017, 105, 262–275. [Google Scholar] [CrossRef]
  16. Fu, T.; Deng, Z.D.; Duncan, J.P.; Zhou, D.; Carlson, T.J.; Johnson, G.E.; Hou, H. Assessing hydraulic conditions through Francis turbines using an autonomous sensor device. Renew. Energy 2016, 99, 1244–1252. [Google Scholar] [CrossRef] [Green Version]
  17. Deng, Z.; Carlson, T.J.; Duncan, J.P.; Richmond, M.C.; Dauble, D.D. Use of an autonomous sensor to evaluate the biological performance of the advanced turbine at Wanapum Dam. J. Renew. Sustain. Energy 2010, 2, 1–12. [Google Scholar] [CrossRef]
  18. Deng, Z.; Guensch, G.R.; McKinstry, C.A.; Mueller, R.P.; Dauble, D.D.; Richmond, M.C. Evaluation of fish-injury mechanisms during exposure to turbulent shear flow. Can. J. Fish. Aquat. Sci. 2005, 62, 1513–1522. [Google Scholar] [CrossRef]
  19. Boys, C.A.; Pflugrath, B.D.; Mueller, M.; Pander, J.; Deng, Z.D.; Geist, J. Physical and hydraulic forces experienced by fish passing through three different low-head hydropower turbines. Mar. Freshw. Res. 2018, 69, 1934–1944. [Google Scholar] [CrossRef]
  20. Čada, G.F. The Development of Advanced Hydroelectric Turbines to Improve Fish Passage Survival. Fisheries 2001, 26, 14–23. [Google Scholar] [CrossRef]
  21. PIANC. Final Report of the International Commission for the Study of Waves; PIANC: Brussels, Belgium, 1986; Volume 3. [Google Scholar]
  22. Verhelst, P.; Baeyens, R.; Reubens, J.; Benitez, J.P.; Coeck, J.; Goethals, P.; Ovidio, M.; Vergeynst, J.; Moens, T.; Mouton, A. European silver eel (Anguilla anguilla L.) migration behaviour in a highly regulated shipping canal. Fish. Res. 2018, 206, 176–184. [Google Scholar] [CrossRef] [Green Version]
  23. Kemper, J.H.; Vis, H. Sonaronderzoek naar het visbestand in het Albertkanaal in het Vlaamse Gewest; ATKB: Nieuwegein, The Netherlands, 2010. [Google Scholar]
  24. Visser, E.C.; Kroes, M.J. Onderzoek Naar Het Visbestand in Het Albertkanaal 2012–2015. Available online: https://www.kroes-consultancy.nl/onderzoek-naar-visbestand-albertkanaal-2012-2015/ (accessed on 21 October 2020).
  25. Vergeynst, J.; Pauwels, I.; Baeyens, R.; Coeck, J.; Nopens, I.; De Mulder, T.; Mouton, A. The impact of intermediate-head navigation locks on downstream fish passage. River Res. Appl. 2019, 35, 224–235. [Google Scholar] [CrossRef]
  26. Vergeynst, J. Downstreameel and Salmon Migration through a Shipping Canal: Challenges on the Road; Ghent University (UGhent) and Research Institute for Nature and Forets (INBO): Gent, Belgium, 2020. [Google Scholar]
  27. Buysse, D.; Mouton, A.M.; Stevens, M.; Van den Neucker, T.; Coeck, J. Mortality of European eel after downstream migration through two types of pumping stations. Fish. Manag. Ecol. 2014, 21, 13–21. [Google Scholar] [CrossRef]
  28. Buysse, D.; Mouton, A.M.; Baeyens, R.; Coeck, J. Evaluation of downstream migration mitigation actions for eel at an Archimedes screw pump pumping station. Fish. Manag. Ecol. 2015, 22, 286–294. [Google Scholar] [CrossRef]
  29. Mueller, M.; Pander, J.; Geist, J. Evaluation of external fish injury caused by hydropower plants based on a novel field-based protocol. Fish. Manag. Ecol. 2017, 24, 240–255. [Google Scholar] [CrossRef] [Green Version]
  30. Lin, Z.; Xiong, Y.; Dai, H.; Xia, X. An Experimental Performance Evaluation of the Orientation Accuracy of Four Nine-Axis MEMS Motion Sensors. In Proceedings of the the 5th International Conference on Enterprise Systems: Industrial Digitalization by Enterprise Systems, Beijing, China, 22–24 September 2017; Institute of Electrical and Electronics Engineers Inc.: Piscataway, NJ, USA, 2017; pp. 185–189. [Google Scholar]
  31. Kriewitz-Byun, C.R.; Tuhtan, J.A.; Toming, G.; Albayrak, I.; Kammerer, S.; Vetch, D.F.; Peter, A.; Stoltz, U.; Gabl, W.; Marbacher, D. Research Overview on Multi-Species Downstream Migration Measures at the Fithydro Test Case HPP Bannwil. In Proceedings of the the 12th International Symposium on Ecohydraulics (ISE 2018), Tokyo, Japan, 19–24 August 2018. [Google Scholar]
  32. Agresti, A. An Introduction to Categorical Data Analysis, 2nd ed.; John Wiley & Sons, Inc.: Hoboken, NJ, USA, 1996; ISBN 978-0-471-22618-5. [Google Scholar]
  33. R Development Core Team. R: A Language and Environment for Statistical Computing; R Development Core Team: Vienna, Austria, 2011; Volume 1, p. 409. [Google Scholar]
  34. Boys, C.A.; Robinson, W.; Miller, B.; Pflugrath, B.; Baumgartner, L.J.; Navarro, A.; Brown, R.; Deng, Z. A piecewise regression approach for determining biologically relevant hydraulic thresholds for the protection of fishes at river infrastructure. J. Fish Biol. 2016, 88, 1677–1692. [Google Scholar] [CrossRef]
  35. Pflugrath, B.D.; Boys, C.A.; Cathers, B.; Deng, Z.D. Over or under? Autonomous sensor fish reveals why overshot weirs may be safer than undershot weirs for fish passage. Ecol. Eng. 2019, 132, 41–48. [Google Scholar] [CrossRef] [Green Version]
  36. Bodily, K.G.; Carlson, S.J.; Truscott, T.T. The water entry of slender axisymmetric bodies. Phys. Fluids 2014, 26, 072108. [Google Scholar] [CrossRef]
  37. Haehnel, R.B.; Daly, S.F. Maximum Impact Force of Woody Debris on Floodplain Structures; Hanover: Vicksburg, MS, USA, 2002. [Google Scholar]
  38. Madgwick, S.O.H.; Harrison, A.J.L.; Vaidyanathan, R. Estimation of IMU and MARG orientation using a gradient descent algorithm. In Proceedings of the IEEE International Conference on Rehabilitation Robotics Rehab Week Zurich, Zurich, Switzerland, 29 June–1 July 2011; pp. 1–7. [Google Scholar]
  39. Alexander, A.; Kruusmaa, M.; Tuhtan, J.A.; Hodson, A.J.; Schuler, T.V.; Kääb, A. Pressure and inertia sensing drifters for glacial hydrology flow path measurements. Cryosphere 2020, 14, 1009–1023. [Google Scholar] [CrossRef] [Green Version]
  40. The Mathworks, Inc. MATLAB, Version 9.6, 2019 MATLAB. Available online: https://www.mathworks.com/ (access on 21 Octorber 2020).
  41. Brown, R.S.; Colotelo, A.H.; Pflugrath, B.D.; Boys, C.A.; Baumgartner, L.J.; Deng, Z.D.; Silva, L.G.M.; Brauner, C.J.; Mallen-Cooper, M.; Phonekhampeng, O.; et al. Sobre el barotrauma en peces durante su tránsito por hidro-estructuras: Una estrategia global para el desarrollo sustentable de los recursos hídricos. Fisheries 2014, 39, 108–122. [Google Scholar] [CrossRef]
  42. Egg, L.; Mueller, M.; Pander, J.; Knott, J.; Geist, J. Improving European Silver Eel (Anguilla anguilla) downstream migration by undershot sluice gate management at a small-scale hydropower plant. Ecol. Eng. 2017, 106, 349–357. [Google Scholar] [CrossRef]
  43. Bevelhimer, M.S.; Pracheil, B.M.; Fortner, A.M.; Saylor, R.; Deck, K.L. Mortality and Injury Assessment for Three Species of Fish Exposed to Simulated Turbine Blade Strike. Can. J. Fish. Aquat. Sci. 2019, 76, 2350–2363. [Google Scholar] [CrossRef]
  44. Al-saati, N.H. Archimedean Screw Pumps—Definitions; Al-Furat Al-Awsat Technical University: Najaf, Iraq, 2017. [Google Scholar]
  45. Baumgartner, L.J.; Daniel Deng, Z.; Thorncraft, G.; Boys, C.A.; Brown, R.S.; Singhanouvong, D.; Phonekhampeng, O. Perspective: Towards environmentally acceptable criteria for downstream fish passage through mini hydro and irrigation infrastructure in the Lower Mekong River Basin. J. Renew. Sustain. Energy 2014, 6, 012301. [Google Scholar] [CrossRef] [Green Version]
  46. Baeyens, R.; Pauwels, I.; Buysse, D.; Mouton, A.; Vergeynst, J.; Papadopoulos, I.; Demaerteleire, N.; Pieters, S.; Gelaude, E.; Robberechts, K.; et al. Monitoring van de effecten van de pompinstallatie en waterkrachtcentrale te Ham op het visbestand in het Albertkanaal; Reports from the Research Institute for Nature and Forest: Brussels, Belgium, 2019. [Google Scholar]
  47. Saylor, R.; Fortner, A.; Bevelhimer, M. Quantifying mortality and injury susceptibility for two morphologically disparate fishes exposed to simulated turbine blade strike. Hydrobiologia 2019, 842, 55–75. [Google Scholar] [CrossRef]
Figure 1. Site map of the Archimedes hydrodynamic screw investigated in this study near Ham, Belgium (a, red square). The shipping canal flow direction is indicated by the black arrows. Aerial imagery of the Ham test site (b), with the location of the hydropower installation (white square) in the ship lock bypass channel. White dotted arrows indicate the flow direction when the Archimedes hydrodynamic screws are in turbine mode. The shipping canal flow direction is indicated by the white arrow. Aerial view of the hydropower installation (c), where “A” denotes the three Archimedes hydrodynamic screws and “B” corresponds to the screw with a closed housing, which serves as pump. Both live fish and sensors were passed through the central screw unit of the three “A” screws during hydropower generation. The flow direction in the screw and the canal is indicated by a white arrow. The purple trapezoid indicates the outflow basin of the screws, where fish enter after screw passage. Fish were trapped in a cage that closed-off the outflow basin from the canal.
Sustainability 12 08722 g001
Figure 2. Profile of the Ham Archimedes hydrodynamic screw and indication of the injection location of fish and sensors on the top valve of the turbine (inset picture showing the valve in closed position).
Sustainability 12 08722 g002
Figure 3. Overview of the BDS sensors. The top endcap (A,B) contains three pressure transducers (F,K). Below there are two electronics boards containing the WiFi module (C), magnetic switch (D), microSD storage (E), and AAA battery holder (G). The sensor and electronics payload (AG) is screwed by hand onto the bottom endcap (I), which also includes two rugged nylon attachment strings (J) for the balloon tags to bring the neutrally buoyant sensor back to the water surface.
Sustainability 12 08722 g003
Figure 4. Proportions of bream (Abramis brama), eel (Anguilla anguilla), and roach (Rutilus rutilus) indicating the state as either alive or dead after forced Archimedean screw turbine passage for each of three rotational speeds (rpm, see Table A1).
Sustainability 12 08722 g004
Figure 5. Percentage of all fish caught after forced turbine passage that were either not injured, slightly injured, or heavily injured. Tests were performed with three species (bream: Abramis brama, eel: Anguilla anguilla, and roach: Rutilus rutilus) at three screw rotational speeds (rpm, see Table 1).
Sustainability 12 08722 g005
Figure 6. Proportions of recovered bream (Abramis brama, top), eel (Anguilla anguilla, middle), and roach (Rutilus rutilus, bottom), indicating the injury type and the state as either alive (left) or dead (right) for each of the three rotational speeds (legend). Marks indicate the average proportion over three repeated tests. Vertical lines indicate the observed range from the three replicates. Scale loss applies to bream and roach, whereas scratches apply to eel.
Sustainability 12 08722 g006
Figure 7. Impactograms for the three operational scenarios at the Ham test site. (a) Low rotational speed, 33 Hz, where it can be seen that the highest probable impacts were concentrated small impacts of <10 m/s2 in the last 20% of the passage. (b) Medium rotational speed, 40 Hz, which shows similar distribution of impacts to the low discharge scenario, with slightly reduce low-impact probabilities. (c) High rotational speed, 48 Hz, which had a nearly even distribution of impact probabilities over all deployments. The horizontal gray line corresponds to the 5 g threshold used to establish the mean duration to the first large impact as provided in Table 6, illustrated as the vertical black lines, and the standard deviation is shown as the vertical gray region.
Sustainability 12 08722 g007
Table 1. Essential characteristics of the Archimedes hydrodynamic screw investigated in this work at of Ham, Belgium.
Screw ParametersAbbreviations Indicated in Figure 2Value
Maximum power (MW)-1.2
Centre tube length (m)L23.8
Helix length (m)Lb21.5
Slope (°)β38
Number of blades-3
Helix lead (m)Ld4.3
Centre tube diameter (m)d2.4
Helix diameter (m)D3.1
Helix operation (rpm/Hz/m3/s)-13.71/33/3
16.62/40/4
19.95/48/5
Gap between helix and housing (cm)-±2 cm
Fish deterrence system-None
Fish injury reduction measures-None
Table 2. Summary table of the live fish investigations, including the numbers of tested and recovered fish per operational scenario and per species (bream, European eel, and roach).
Rotation Speeds of OperationSpeciesNumber of Fish TestedNumber of Fish Recovered
(% Total)
Test 1Test 2Test 3Test 1Test 2Test 3
LowBream100100100494740
MediumBream100100100464241
HighBream100100100463534
LowEel100100100686351
MediumEel100100100655955
HighEel100100100645754
LowRoach1001001001007164
MediumRoach100100100787259
HighRoach100100100746665
Table 3. BDS sensor deployment summary for the Ham screw turbine; all sensors were recovered. Three different operational scenarios were investigated based on a total of 124 sensor deployments, producing 91 usable data sets for statistical analysis. The majority of recovered sensors did not have physical damage. Sensors with damage were visually inspected and classified as either crushed or scratched. The passage duration data are reported as ensemble means ± their standard deviation (SD) followed by the variable’s range (minimum to maximum) in parentheses, where appropriate.
Operational Scenario
(Table 1)
Number of Sensors DeployedNumber of Useful Datasets
(% Total)
Number of Crushed Sensors (% Total)Number of Scratched Sensors (% Total)Passage Duration (min) Mean ± SD (Range)
Low
(30 Hz)
4530 (67)4 (9)9 (20)75 ± 25
(41–165)
Medium
(40 Hz)
3928 (72)3 (8)13 (33)51 ± 19
(30–137)
High
(48 Hz)
4033 (83)1 (3)3 (8)42 ± 10
(19–69)
Table 4. Summary of pressure variables (reference atmospheric pressure 100.0 kPa) from BDS deployments at Ham (columns two to four) compared with sensor values from the smaller screw turbine evaluated by Boys et al. (reference atmospheric pressure unknown; [19]). Where available, all data are reported as ensemble means ± their standard deviation (SD) followed by the variable’s range in parentheses.
Pressure-Based MetricLow rpm Mean ± SD (Range)Medium rpm Scenario
Mean ± SD (Range)
High rpm Scenario
Mean ± SD (Range)
High Power 1
Mean ± SD (Range)
Low Power 1
Mean ± SD (Range)
Nadir
(kPa)
99.6 ± 1.1
(97.1–101.5)
99.1 ± 1.9
(93.5–101.3)
98.9 ± 1.8
(94.7–103.4)
100.1 ± 4.2
(95.1–111.3)
98.5 ± 5.3
(81.8–106.6)
Maximum
(kPa)
122.4 ± 11.8
(106.7–149.3)
122.3 ± 9.5
(110.6–146.9)
118.7 ± 7.8
(108.0–143.7)
116.7116.7
Minimum
RPC
1.00 ± 0.01
(0.98–1.03)
1.01 ± 0.02
(0.99–1.07)
1.01 ± 0.02
(0.97–1.06)
0.99 ± 0.04
(0.94–1.10)
0.98 ± 0.05
(0.81–1.06)
Maximum absolute pressure gradient (kPa)8.96 ± 6.31
(1.73–29.66)
10.96 ± 4.06
(3.92–18.39)
9.52 ± 5.73
(2.67–31.80)
Not measuredNot measured
1 Results from Boys et al. [19].
Table 5. Overview of the statistically significant relations observed for the fish and BDS sensor experiments at the Ham study site. The statistical assessment of fish data and BDS external damage data were performed using a chi-squared test for independence, whereas the statistical assessment of BDS sensor pressure data was performed using the Kruskal–Wallis test and Tukey–Cramer post-hoc test. (**: significant at the 1% significance level, *: significant at the 5% significance level, Pos.: positive relation for the chi-squared test, Neg.: negative relation for the chi-squared test, D: dead, Se: severe injury, Sl: slight injury, N: no injury).
SubjectDataFactorsOperational Scenario
Low
(33 Hz)
Medium
(40 Hz)
High
(48 Hz)
Live
Fish
Mortality dataNo species
BreamD ** (Pos.)D ** (Pos.)
EelD ** (Neg.)D * (Neg.)D ** (Neg.)
Roach
Injury dataNo species
BreamSe * (Pos.)Se * (Pos.)
EelN ** (Pos.)N ** (Pos.)N ** (Pos.)
RoachSl ** (Pos.) Sl * (Pos.)
BDS
Sensors
Nadir pressure
Pressure maximum
RPC
Maximum Absolute Pressure gradient *
Change in the kinetic energy of translation *
Change in rotational kinetic energy
Sensor housing * (Pos.)* (Neg.)
Table 6. Summary of IMU-based metrics from BDS deployments at Ham for each of the three operational scenarios investigated. Where applicable, the results are reported as ensemble means ± their standard deviation (SD) followed by the variable’s range in parentheses.
IMU-Based MetricLow 33 Hz
Mean ± SD (Range)
Medium 40 Hz
Mean ± SD
(Range)
High 48 Hz
Mean ± SD
(Range)
Δ K E t 1.22 ± 0.95
(0.21–4.52)
1.81 ± 1.31
(0.43–6.48)
1.32 ± 1.15
(0.26–4.60)
Δ K E r 0.63 ± 0.27
(0.15–1.24)
0.64 ± 0.21
(0.22–1.19)
0.62 ± 0.28
(0.22–1.56)
Percentage of BDS with large impacts, >5 g
(%)
33.366.754.6
Mean duration to first
Large impact, >5 g
(s)
13.41 ± 10.93
(2.22–32.79)
12.87 ± 5.99
(2.97–24.22)
8.19 ± 7.05
(0.01–20.94)
Percentage of mean passage duration until first large impact, >5 g
(%)
34 ± 26.7
(7.6–80.6)
42.2 ± 21.3
(10–80.6)
36.5 ± 31.5
(0–42.6)
Publisher’s Note: MDPI stays neutral with regard to jurisdictional claims in published maps and institutional affiliations.

