Optimization of Reactor Temperature for Continuous Anaerobic Digestion of Cow Manure: Bangladesh Perspective
by
 , , ,
, , ,
Rajesh Nandi
1 ,
,
Chayan Kumer Saha
1,* ,
,
Shiplu Sarker
2 ,
,
Md. Sanaul Huda
1 and 
Md. Monjurul Alam
1 1
Department of Farm Power and Machinery, Bangladesh Agricultural University, Mymensingh 2202, Bangladesh
2
Department of Manufacturing and Civil Engineering, Norwegian University of Science and Technology, 2815 Gjøvik, Norway
*
Author to whom correspondence should be addressed.
Sustainability 2020, 12(21), 8772; https://doi.org/10.3390/su12218772
Submission received: 28 September 2020
/
Revised: 19 October 2020
/
Accepted: 20 October 2020
/
Published: 22 October 2020
(This article belongs to the Special Issue Integrated Biorefineries)
Abstract
:Converting organic waste into energy through anaerobic digestion is gaining popularity day by day. The reactor temperature is considered as one of the most vital factors for the digestion process. An experiment was conducted in the Biogas Laboratory of Green Energy Knowledge Hub at Bangladesh Agricultural University (BAU) to examine the influence of temperature on anaerobic digestion of cow-dung. Laboratory-scale continuous stirred tank reactors with a working volume of 15 L were operated for a 30-day retention time. The reactors were set at 20 °C, 25 °C, 30 °C, 35 °C, 40 °C and 45 °C, respectively to determine the effect of temperature on anaerobic digestion performance. Different parameters like total solids, volatile solids, pH, volatile fatty acids, ammonia nitrogen, total nitrogen, biogas production rate and methane concentration were examined. Among all the reactors, the reactor at 40 °C temperature produced maximum biogas (312.43 L/kg VS) and methane yields (209.70 L/kg VS), followed by the reactors at 35 °C and 30 °C, respectively. Statistical analysis of the obtained experimental results using Minitab® showed that the optimum process performance in terms of methane yield and volatile solid degradation is achieved at a reactor temperature of 35.82 °C.
1. Introduction
Global energy demand is increasing greatly due to a higher population growth rate and rapid industrialization [1,2,3]. Current energy demand is mostly met by non-renewable energy sources. With the overuse of these limited non-renewable energy sources, the world is now facing an energy crisis. Non-renewable energy sources are also responsible for greenhouse gas (GHG) emissions. It is thus necessary to search for new sustainable as well as renewable energy sources to meet future energy demand.
Bangladesh is a country of around 162 million people with ~1.1% growth of population annually. Per capita energy generation in Bangladesh is 426 kWh [4], which perhaps is very low. Currently, the country has a power generation capacity of ~20,000 MWe, only 1.37% of which comes from renewable sources [5]. It is estimated that the country would require circa 34,000 MWe by the year 2030 to fulfil its demand [6]. Around 58% of the country’s electricity comes from natural gas [5]. Energy consumption in Bangladesh mostly depends on imported fossil fuels and the country has limited proven natural gas reserves. Moreover, fuel prices are increasing swiftly and gas reserves are declining at an increasing rate. Bangladesh has been looking for alternative energy sources. The government of Bangladesh has planned to generate 10% of its total power generation from renewable energy sources by 2020 [7]. Biogas is a prospective alternative source of energy in Bangladesh. According to the Bangladesh Bureau of Statistics (BBS), the cattle population of the country is around 24 million [8], which produce around 240 million kg of cow-dung daily.
The anaerobic digestion (AD) of the organic materials by microorganisms at anoxic environment produces biogas. Biogas contains 48–65% (v/v) methane and 36–41% (v/v) CO₂, <1% (v/v) oxygen, 32–169 ppm hydrogen sulfide and traces of other gases [9]. Many factors affect the biogas production such as: the C/N ratio, temperature, pH, volatile fatty acids (VFAs), hydraulic retention time (HRT), nutrients, organic loading rate (OLR) and toxicity [10]. Temperature is one of the important factors which influences the activity of microorganisms, and thus the productivity of the AD. In Bangladesh, there are about 91,350 [11] biogas plants, most of which are fixed dome types. Since these biogas plants do not involve any temperature controller, their operational temperatures depend on variations of external temperature, i.e., between ~9 and ~37 °C. Due to this seasonal variation of temperature, the stable biogas production throughout the year is difficult to maintain [12,13,14,15,16].
The AD typically takes place in three different temperature regions: psychrophilic (<30 °C), mesophilic (30–40 °C) and thermophilic (50–60 °C) [17]. At the transition zone, between the any two regions, both microbial activity and growth rate are low [18]. The most favorable condition for methanogens lies between the mesophilic and thermophilic regions, resulting in a higher rate of biogas production [10]. Although AD can occur below 20 °C, the degradation rate at low temperature condition is slow. The correlation between temperature and reaction rate can be shown by Equation (1) [19]:
where, represents the reaction rate constant at temperature T, denotes the reaction rate constant at 20 °C, θ represents the temperature activity constant and T is the temperature.
Heating a digester to higher temperature improves the biogas production rate, shortens the retention time and reduces the digester size. However, due to the higher resulting energy input, instability and sensitivity to inhibition thermophilic process in many applications is financially less attractive [10]. Theoretically, microbial activity at thermophilic temperature is easily hampered by temperature fluctuations and needs a longer period to adjust to a new temperature, whereas mesophilic methanogens can endure temperature variations of +/−3 °C without a considerable drop in biogas production [20]. Alvarez et al. [21] observed that the biogas productivity of AD decreases with the fluctuations in temperature. Zhou et al. [22] reported that there is a risk of ammonia inhibition and a larger degree of imbalance associated with the thermophilic process. Garba [15] reported that methane-producing bacteria are very sensitive to speedy changes in temperature and suggested to avoid any drastic changes in temperature. From the findings of various researchers, it thus can be concluded that the operation temperature must remain stable to enable smooth progress of the AD.
Several studies have been carried out on biogas production from different feedstocks at different process conditions in Bangladesh [23,24,25,26,27]. Most of them are batch experiments which have only determined the bio-methane potential and are often unreliable in predicting the biogas generation over a long run [28,29]. Moreover, batch experiments are not able to provide instant feedback from a dynamic change of parameters in an anaerobic environment, such as an instantaneous change in temperature on anaerobic digestion performance. To the best of the authors’ knowledge, very few studies so far have aimed to optimize the reactor temperature for AD of cow-dung in Bangladesh context. However, since cow-dung here is the most prevalent form of agricultural wastes with physical properties determined by the local farming conditions, which as a result are likely to influence the biogas production, more research to this substrate in every farm or rural level should be emphasized. To this end, the objectives of the present study are: (i) to examine the influence of temperature on AD and biogas production using cow-dung from a local farm into CSTR, (ii) to optimize the reactor temperature in order to maximize methane yield and volatile solid degradation efficiency by using a best-fit regression model in Minitab®.
2. Materials and Methods
2.1. Experimental Site
The experiment was conducted at the Biogas Laboratory of GEKH (Green Energy Knowledge Hub), Department of Farm Power & Machinery, Bangladesh Agricultural University, Mymensingh. Cow manure was used as a substrate in this experiment. Raw cow-dung was collected from the dairy farm of Bangladesh Agricultural University. After collection, the substrate was stored between −5 and −10 °C in a freezer. Prior to AD, the cow-dung was defrosted to a normal room temperature.
2.2. Experimental Setup
For the experiment, a test rig was set-up with 3 identical CSTR (BTP2-control, UIT, Dresden, Germany) units (Figure 1) and a central control unit. Each of the CSTR units was equipped with a CSTR reactor, a gas drum (TG 05; 0.5 L per turn of the hand, Measurement range: 1–60 L, reading accuracy 0.002 L, measurement accuracy: ±0.2%), a polyvinyl fluoride gas bag (10 L), a heating control unit and an agitator system composed of a propeller shaped stirrer coupled with an agitator shaft and an electric stirrer motor (10–500 rpm). The three reactor units were each connected with a separate SENSO control module, serving operational parameters control, agitator shaft’s height control and data acquisition and their record. The reactor tank consisted of a glass tube, which was fixed at the bottom on a raised steel platform that was joined with flanges at the top through flat seal rods. The capacity of each reactor was 17.2 L with working volume of 15 L. The heating element of the CSTR consisted of a heating mat which was attached to the outside surface of the glass tube. The heating mat was controlled by a built-in temperature controller (T-controller, temperature consistency: ± 0.1 °C), which simultaneously measures the temperatures of the heating mat, substrate and biogas. The signals generated in the temperature controller were transferred through RS-485 interface to the SENSO control module for display and record. In order to prevent heat loss, an insulating mat surrounding the glass tube was installed using a hook-and-loop tape.
The produced biogas from the reactors was first removed from moisture by passing through a gas washing bottle and then was supplied to the gas drum meter or gas bag for collection. The gas drum meter operates continuously in real-time and measures the quantity of the produced biogas within the reactor and is interconnected with the SENSO control for data logging. The gas bag was used for the temporary storage of the generated biogas in each reactor. The gas bag was connected with each reactor via a control valve. The biogas temperature measurement was made in the connected tube of the gas bag near the control valve. The temperature was measured by a temperature sensor (measuring range: 0–60 °C, accuracy: ±0.2 °C), which was mounted with a T-piece connector. According to the chosen settings at the SENSO control, the gas bag was emptied periodically, during which time the biogas quality was measured by using a gas analyzer (SSM 6000, Pronovza Analysentechnik GmbH & Co., Berlin, Germany). The biogas flow through the gas analyzer was regulated by a control valve via the central control unit.
The central control unit consists of a rack with plastic sheets and fixtures and houses the gas analyzing unit, a pressure sensor and an ethernet-switch. The pressure sensor is located in the gas supply line from reactor to the gas analyzer and monitors the emptying of the gas bag during gas analysis by regulating an integrated exhaust pump. The central control module serves the control of biogas quality measurement of all the reactor units in a multiplex mode (e.g., simultaneous measurement of multiple parameters at a time), and the measured data of all the reactor units are stored in the SENSO module.
2.3. Experimental Procedure
Considering the ambient temperature variation in Bangladesh, the experiment was carried out at reactor temperatures of 20, 25, 30, 35, 40 and 45 °C, respectively in two rounds. In the first round three reactors were set at 20, 25 and 30 °C, while in the second round the same three reactors were set at 35, 40 and 45 °C, respectively. Inoculum for the experiment was collected from the digestate of a previous experiment conducted at the same laboratory. Each reactor was filled with 14.5 L of inoculum and set at selected temperature. Each day, feeding of the reactors was done manually with 500 mL mixture of raw cow-dung and water with a mixing ratio of 1:1. The digestate corresponding to the same amount of feeding was withdrawn per day, keeping the operational HRT to be constant at 30 days. The digester contents were mixed mechanically for 24 h per day at the agitator speed of 60 rpm. Stirring helps to prevent crust formation and keeps a uniform temperature distribution throughout the reactor load [30]. The biogas yield was measured by the gas drum and was recorded once daily. The pH value, temperature and biogas flow rate were measured automatically and saved in a database in a 15 min interval for the whole duration of the experiment. The total solids (TS) content, volatile solids (VS) content, dissolved VFA concentration, ammonia nitrogen concentration and total nitrogen concentration were determined weekly by analyzing the samples of digestate for each reactor, as described below.
2.4. Analytical Methods
Total solids were measured by following the standard [31], where a known amount of sample was dried in a heating oven (UN 30, Memmert, Schwabach, Germany) at 105 °C for 24 h. The volatile solids were determined by combusting the sample remained after drying in a muffle furnace (LE 14/11/ B 150, Nabertherm, Lilienthal, Germany) at 550 °C for 5 h [31]. The difference in weight before and after the combustion represents the amount of volatile solids. The mass that remained after the combustion represents the ash content. The pH-value of digestate was determined using a calibrated pH/Conductometer (914 pH/Conductometer, Metrohm, Herisau, Switzerland). The VFA was determined after diluting a certain amount of sample using a Titrator (848 Titrino plus, Metrohm, Switzerland). A model proposed by Møller and Ward [32] was used to calculate the VFA. Total ammonium nitrogen (TAN) and total nitrogen (TN) were determined using photometric kits (Spectroquant kit, Merck, Burlington, MA, USA). For the measurement of TAN, a 1 g sample was diluted with water 50 times. Then, 0.10 mL of pretreated sample was taken into a reaction cell and 1 dose of NH4-1 and 150 mg of NH4-2 were added and mixed. The reaction cell was allowed to be stable for 15 min and then the sample was measured by a photometer (NOVA 60, Memmert, Schwabach, Germany). For the measurement of TN, a 1 g sample was taken into an empty cell and subsequently it was diluted with water 10 times. After the dilution, 150 mg N-1K and 6 drops N-2K were added to it. Then, the cell was kept inside a thermo-reactor (TR 420, Merck, Darmstadt, Germany) at 120 °C for 60 min. After withdrawing from the reactor, the cell was allowed to cool. Later, 1 mL of pretreated sample was taken into a reaction cell and 1 mL N3-K was mixed with it. The mixture was then set aside for 10 min to become stable. Finally, the total nitrogen was measured using the photometer.
The biogas volume was measured by the gas drum meter and was recalculated to Normal Temperature and Pressure (NTP), while the biogas composition (e.g., percent volume of CH4, CO2, and H2S) was determined automatically by using the integrated gas analyzer.
2.5. Calculation and Statistical Analysis
The carbon to nitrogen ratio (C/N) was determined according to Waskman [33] using Equation (2).
After collecting all the data, statistical analysis was performed. Significant differences between treatments were determined by conducting ANOVA (Analysis of Variance) using IBM SPSS Statistics 20.
2.6. Optimization
Optimum input settings are required to maximize the methane yield and volatile solid degradation. Best-fit regression equations and standard forms of regression models were analyzed for optimization of temperature using Minitab® 19 (State College, PA, USA).
3. Results and Discussions
3.1. Substrate Characteristics
During the experiment, feedstock characteristics were measured. Table 1 represents the properties of cow-dung used in the experiment. The TS and VS content of raw cow-dung were 17.30% and 14.51%, respectively. After mixing with water, the TS and VS contents were reduced to 8.65% and 7.26%, respectively. The pH was found to be 7.08, which is similar to the rate found in a past study by Abubakar and Ismail [34], e.g., 7.1–7.4. The C/N ratio was found to be 26. Rahman et al. [35] determined that the optimum C/N ratio for biogas production lies between 25 and 30, while other researchers such as Giovanna et al. [36] reported a wider range (e.g., 9–50). Gao et al. [37] determined the C/N ratio of cow-dung to be 17.24 during their study on co-digestion of cow-dung with maize straw and vegetable waste in China. In contrast, Yadav et al. [38] reported a higher C/N value of 50.2 for the characteristics of mixed cow-dung and biogas plant slurry in India. These differences in the C/N ratio of cow-dung may be due to the different cattle feeding characteristics in different countries. Due to these differences, the potential of biogas production from cow-dung in Bangladesh may differ from other countries.
3.2. Effect of Temperature on pH
Variation of pH at different temperatures is presented in Figure 2. Fatty acids are formed in the hydrolysis and acidogenesis stage. If the amounts of VFA are higher, they reduce the pH and in the worst case scenario also collapse the system due to the disturbances in activities of acetogens and methanogens [39]. The variation of the pH during the digestion process was monitored continuously. The average pH at 20, 25, 30, 35, 40 and 45 °C temperatures were 6.16, 6.28, 6.44, 6.45, 6.45 and 6.13, respectively. The values of pH at 30, 35 and 40 °C were relatively higher and stable over the experimental period. On the other hand, a low pH was observed at 20 and 25 °C. At 45 °C, pH started decreasing swiftly after day 4 and dropped to 5.75. Due to this drop in pH, the biogas production in the reactor also reduced [10]. The pH at 45 °C started to recover from day 19 and reached 6.57, resulting in improved methanogens’ activity and thus in an improved biogas yield at that point. As the substrate in AD was converted into biogas and the resulting CO2 from biogas reacted with water to produce bicarbonate, the level of pH in the reactor was influenced. Generally, when the pH is influenced, the microbial metabolism is also affected. Rahman et al. [40] observed a low pH at low temperatures, when the conversion rate of organic matter into biogas was low. Also, a high hydrolysis rate contributed to reducing pH due to an increased level of VFA, and thus caused lowered AD efficiency [41]. Vangase and Bartlett [42] observed a drop in pH at high temperature when they studied the effect of various temperatures on the AD of Laminaria digitata.
3.3. Effect of Temperature on VFA
Variation of VFAs at different temperatures are presented in Figure 3. Production of VFAs varied among different temperatures. The VFA values showed a decreasing trend as the temperature increased from 20 °C to 40 °C. High levels of VFAs were observed at 45 °C. The highest accumulation of VFAs (5.34 g/L) was observed during the third week of the experiment at 45 °C, which may be due to a higher rate of hydrolysis or acidogenesis [43]. This high value of VFA reduced the pH and activity of methanogenic bacteria, as a result of which biogas production reduced greatly. From week 3 and onwards, VFA formation at 45 °C started decreasing, causing pH to increase and ultimately to increase methane production. VFA was produced during hydrolysis and acedogenesis stages by acid forming bacteria. This VFA was then converted into biogas by using methanogens in a stable AD process. In this study, accumulation of VFA at low temperatures might be due to reduced metabolic activity of methanogens at a low temperature. Sneath et al. [44] showed that the value of VFA should be less than 2 g/L for the smooth operation of the AD. Hansson [45] observed higher levels of VFA and lower biogas production under a thermophilic condition as compared to a mesophilic condition.
3.4. Effect of Temperature on TS and VS Degradation
Total solid degradation (TSD) and volatile solid degradation (VSD) are important factors influencing the AD performance. The TSD and VSD values of the substrate during the experiment are presented in Figure 4. The values of TS and VS in the digested manure in all experiments were less when compared to non-digested cow manure (Table 2), as organic contents are utilized to produce biogas through AD. The average TSD at 20, 25, 30, 35, 40 and 45 °C temperatures were 8.99%, 16.91%, 26.16%, 30%, 31.19% and 21.45%, respectively. The highest TSD efficiency was found for the reactor at 40 °C and the lowest was obtained for the reactor at 20 °C. The average VSD at reactor temperatures of 20, 25, 30, 35, 40 and 45 °C were 12.16%, 19.37%, 28.96%, 32.74%, 35.12% and 23.15% respectively. The results showed that the TSD and VSD increased from 20 to 40 °C and then decreased at reactor temperature of 45 °C. Leven et al. [16] found that the degradation capacity at mesophilic temperature was higher than that of thermophilic temperature during their investigation on the effect of temperature to different bacterial communities for the AD of organic household waste. At a mesophilic condition, a higher degree of microbial diversity was observed, and this might have resulted in an enhanced degradation efficiency [16]. Wang and Wan [46] observed that the degradation efficiency of organic compounds increased with increasing temperatures from 20 °C to 40 °C. However, the degradation efficiency started and continued to decline as the temperature increased further from 40 °C to 45 °C.
3.5. Effect of Temperature on Ammonia-Nitrogen
Total ammonia-nitrogen (TAN) is a crucial parameter for determining the stability of the digestion process. Generally, a too high value of TAN indicates process instability, leading to inhibition [10]. During the experiment, the TAN of digestate was measured and shown in Figure 5. Production of ammonia nitrogen decreased with the increase in the temperature up to 40 °C. At 20 °C and 25 °C, the average TAN was between 2 and 2.5 g/L, while at 30 °C, 35 °C, 40 °C and 45 °C, the values of average TAN ranged between 0.85 and 1.16 g/L. Concentrations of TAN greater than 1.5 g/L are normally considered to be inhibitory for AD [47]. During the experiment, high levels of ammonium at lower temperatures (20 °C and 25 °C) can correlate with a lower biogas yield, which however was not confirmed in the present case.
3.6. Effect of Temperature on Biogas Yield and Composition
The daily biogas yield from the AD of cow-dung at different temperatures is shown in Figure 6. Variations in biogas generation were observed as the reactor temperature was varied. Average biogas production at 20, 25, 30, 35, 40 and 45 °C was 26.44 (±7.01) L/kg VS, 101.80 (±7.62) L/kg VS, 230.28 (±47.03) L/kg VS, 289.09 (±22.59) L/kg VS, 312.43 (±25.41) L/kg VS and 142.4 (±116.8) L/kg VS, respectively. The reactor at 40 °C produced the highest amount of biogas. The second-best performance was obtained at 35 °C which produced 7.47% less biogas than that of at 40 °C, followed by the reactor at 30 °C (26.29% less), 45 °C (54.42% less), 25 °C (67.42% less) and 20 °C (91.54% less), respectively. The result of an ANOVA test showed that biogas production at 35 and 40 °C was significantly higher than at 20, 25, 30 and 45 °C, but the difference among these temperatures was not significant (Table 3). At lower temperatures (20 °C and 25 °C) the metabolic activity of microorganisms is generally ineffective and consequently the biogas production for these temperatures was found to be low. From Figure 6, it is evident that the reactor at 45 °C showed better performance than other reactors until day 4. After day 4, the biogas production at 45 °C started decreasing, which may have been due to the drop in pH and increase in VFA (Figure 2 and Figure 3). However, after day 21, biogas production at the same operational temperature started increasing, which was possibly due to the improvement in methanogenesis caused by the increased pH and decreased VFA. In contrast, at 35 °C and 40 °C, the average biogas production for the majority of the period remained stable due to the favorable levels of pH and VFA for methanogens activity. In fact, among all the temperature investigated, at 40 °C the maximum biogas production was achieved. The experimental results here coincide with the preceding studies that obtained a higher biogas yield with an increase in temperature within mesophilic conditions than that of within the thermophilic conditions [40,48,49,50]. Vanegas and Bartlett [42] found a higher biogas yield at 35 °C than at 45 °C for AD of Laminaria digitata. Pfeffer [51] studied the AD of household solid waste at temperatures between 35 °C and 60 °C and found the two optima: one at 40 °C and another at 60 °C. Franqueto et al. [52] observed the maximum biogas yield at 40 °C when they examined anaerobic co-digestion of animal waste with agricultural residue at varying temperatures (e.g., 36 °C to 60 °C). Membere and Sallis [53] found the biogas yield to be at its maximum at 35 °C when conducting an experiment at different temperatures (e.g., 25 °C, 30 °C, 35 °C and 55 °C). The methane concentration was however much higher at 55 °C compared to the rest of the temperatures. The study suggested that thermophilic temperature has a significant influence on acclimatization, as methanogens require more time to adapt under this condition.
Biogas compositions at different temperatures are presented in Figure 7. The methane, carbon dioxide and hydrogen sulfide concentrations generated during AD were measured. The average methane concentration of the biogas throughout the experiment at 20, 25, 30, 35, 40 and 45 °C was 55.63 (±0.87%), 57.16 (±0.94%), 66.37 (±1.40%), 67.05 (±0.8%), 67.16 (±1.55%) and 61.83 (±6.74%), respectively. The results showed that the methane concentration was low at lower temperatures (20 °C and 25 °C). The methane concentration at 30 °C, 35 °C and 40 °C did not vary considerably, but a wide range of its variation was observed at 45 °C (Table 3). During the start-up period, the methane concentration at 45 °C was high but after day 4, it started decreasing and reached a minimum level on day 16. The high level of methane concentration during the start-up period was possibly due to the accelerated hydrolysis that contributed to enhanced acidogenesis followed by effective methanogenesis [54]. After day 20, the methane concentration started increasing again and the methane concentration at 45 °C was much higher than other reactors over the last 5 days of the experiment, which might be attributed to a shift in the microbial community as the reactor recovered from the period of instability [55]. The concentration of CH4 in the biogas largely depends on pH, as it controls the speciation of the carbonate system and the release of CO2. When the pH is high due to the high alkalinity resulting in from NH3 release, the biogas composition shifts more toward CH4 [56]. Also, according to Bushwell’s equation for theoretical biogas yield [57], the oxidation state of the biomass influences the biogas composition by driving the proportion of released methane. Methane concentration at 40 °C was higher than at other temperatures due to the neutral and stable pH over the course of the experiment, which maintained the stability of the system. High concentrations of CO2 were observed at lower temperatures (20 °C and 25 °C). Carbon dioxide concentrations at 30 °C, 35 °C and 40 °C were low and almost constant over the experimental period, but at 45 °C, higher CO2 concentrations were observed from day 7 to 23 due to the low pH. The concentration of hydrogen sulfide was very low. For all temperature conditions, values of hydrogen sulfide were observed ranging from 0 to 98 ppm. The high value of H2S can reduce the methanation process by poisoning the cell activity. Chynoweth and Isaacson [58] reported that H2S concentrations greater than 6% can limit methanogenesis. In this study, the concentrations of H2S at all temperatures were within the safe operational range.
3.7. Effect of Temperature on Methane Yield
Daily methane production at different reactor temperatures is shown in Figure 8. The average methane production at 20, 25, 30, 35, 40 and 45 °C were 14.70 L/kg VS (±3.88), 58.20 L/kg VS (±4.55), 153.05 L/kg VS (±32.11), 193.78 L/kg VS (±14.54), 209.70 L/kg VS (±16.23) and 94.63 (±82.3) L/kg VS, respectively (Table 3). The highest volume of methane was produced at 40 °C. The reactor at 20, 25, 30, 35 and 45 °C temperatures produced 92.99%, 72.24%, 27.01%, 7.59% and 54.89% less methane in comparison to the reactor at 40 °C. Results of ANOVA revealed that a significantly greater volume of methane was generated at 35 °C and 40 °C than that of at 20 °C, 25 °C, 30 °C and 45 °C (Table 3), respectively. No significant difference in methane yield was found between the temperatures at 35 and 40 °C. Chen [59] also obtained maximum methane yield at 40 °C during the investigation on influence of different parameters on the anaerobic fermentation of micro-algae. Artsupho et al. [60] observed higher methane yield at a higher temperature in the mesophilic region. Vangas and Bartlett [42] showed that a mesophilic condition produced more biogas and methane than both thermophilic and psychrophilic conditions. Hobson et al. [61] found a linear correlation between biogas yield and temperature from 25 °C to 44 °C when they investigated piggery and poultry wastes AD. Rahman et al. [40] showed that the methane production improved from 35 °C to 45 °C when examining the co-digestion performance of poultry droppings with sugar mill press mud. Varel et al. [62] observed a higher methane yield at 35 °C than at 55 °C when they examined the bio-methane potentiality of Spirulina Maxima. Their study suggested that low nutrients, a low C/N ratio or toxic compounds that were generated during the digestion at 55 °C were responsible for low methane production. Previous studies [39,63] on anaerobic digestion suggested that the drop in methane yield is directly linked to the sensitivity of the methanogens to the accumulation of inhibitory components such as ammonia and H2S [63] or VFA [39]. In the present study, we observed a high level of VFA accumulated (Figure 3) for a short period in the reactor at 45 °C, which in turn reduced the pH of the system and ultimately hampered the activity and growth of methanogens. As a result, the biogas production in that reactor was reduced. Similarly, at lower temperatures (20 °C and 25 °C) metabolic activity of methanogens was presumed to be low, which consequently might have reduced the production of methane.
3.8. Model Fitting and Optimization
In this study, the relationship between predictor and response variables was developed using regression analysis. All independent variables were fitted to three different models: linear, quadratic and cubic models. The summary of model statistics is presented in Table 4. Temperature was considered as a predictor/independent variable, while methane yield and VSD were considered as response/dependent variables. The best model was selected on the basis of the highest coefficient of regression (R2) and lowest value of standard error of regression (S). After applying these two conditions, the cubic model (Figure 9) was found to be the best fit model. For methane yield and VSD, the values of R2 were 99.04% and 98.84%, respectively. The values of S for specific methane yield and VSD were 12.04 and 1.48, respectively. The regression equations obtained using the cubic model are shown in Table 5. These two equations were used in optimization of the temperature. The temperature was optimized for maximum methane yield and VSD using the response optimizer of Minitab®. The optimum temperature was found to be 35.82 °C, at which the maximum methane yield was 185.92 L/kg VS and maximum VSD was 32.83% (Figure 10), respectively. In optimization, composite desirability is an important factor which determines how well the input settings optimize a group of responses. In this study, the composite desirability was found to be 0.92. A composite desirability close to 1 indicates that the input settings were significantly optimized for maximizing the response variables. This result is in contrast with Rahman et al. [40], who obtained the optimum reactor temperature as 44 °C for anaerobic co-digestion of poultry droppings and sugar mill press mud. In the current study, continuous stirring tank reactors were operated at six mesophilic temperatures ranging from 20 °C to 45 °C. Thus, the difference in optimum temperature from the past study [40] might be due to different substrate characteristics and their co-digestion effect.
3.9. Model Validation
The measured values were compared with predicted values obtained from the cubic model for validation (Table 6). There were few differences between measured and predicted values of specific methane yield and VSD for all the temperatures that the reactor was tested.
4. Conclusions
Anaerobic digestion is a popular technology which converts organic matter into biogas through the enzyme-mediated activity of bacteria and archaea. AD performance at different temperatures was evaluated using cow-dung in CSTR reactors and the obtained results are summarized as follows:
- ▪
- The pH of the reactors at 30 °C, 35 °C and 40 °C was stable and favorable for biogas production. However, at 45 °C the pH was low and varied significantly. At lower (20 °C and 25 °C) temperatures, pH values were stable for a majority of the time, but the average levels were lower than those of at 30, 35 and 40 °C. Unstable and lower pH values at digester temperatures of 20, 25 ad 45 °C were found to be correlated with the higher levels of VFA accumulation, which in turn was correlated with the decreased levels of biogas production
- ▪
- Total methane production increased with the temperature from 20 to 40 °C. At 45 °C, VFA accumulation escalated and caused a process imbalance and as a result reduced the biogas yield. Among the six temperatures used, the reactor at 40 °C produced the highest amount of average methane, while the reactor at 35 °C produced only 7.59% less methane compared to that of at 40 °C.
- ▪
- Statistical analysis results from the Minitab® showed the reactor temperature of 35.82 °C as the optimum for maximizing biogas production from the cow-dung.
In future work, an experiment operated with two or multiple HRT should be conducted so that the biogas production results at different temperatures on those HRTs can be obtained, based on which a comparison with the current results carried out only for one HRT can be made.
Author Contributions
Conceptualization, R.N., C.K.S. and M.S.H.; methodology, R.N. and C.K.S.; software, R.N.; validation, R.N., C.K.S. and S.S.; formal analysis, R.N.; investigation, R.N. and M.S.H.; writing—original draft preparation, R.N.; writing—review and editing, S.S., C.K.S., M.S.H. and M.M.A.; supervision, C.K.S. and M.MA.; project administration, M.M.A.; funding acquisition, M.M.A. and S.S. All authors have read and agreed to the published version of the manuscript.
Funding
This research was funded by the International Finance Corporation (IFC), grant number: “600237”, and the APC was funded by the Norwegian University of Science and Technology (NTNU).
Acknowledgments
The authors would like to thank the International Finance Corporation (IFC), Bangladesh, for funding the Green Energy Knowledge Hub Project (Project No.: 600237), to allow this research to be undertaken.
Conflicts of Interest
The authors declare no conflict of interest.
References
- Hasanuzzaman, M.; Islam, M.A.; Rahim, N.A.; Yanping, Y. Energy demand. Energy Sustain. Dev. 2020, 41–87. [Google Scholar] [CrossRef]
- Gómez-Camacho, C.E.; Ruggeri, B. Energy Sustainability Analysis (ESA) of Energy-Producing Processes: A Case Study on Distributed H2 Production. Sustainability 2019, 11, 4911. [Google Scholar] [CrossRef] [Green Version]
- Jeung, J.H.; Chung, W.J.; Chang, S.W. Evaluation of Anaerobic Co-Digestion to Enhance the Efficiency of Livestock Manure Anaerobic Digestion. Sustainability 2019, 11, 7170. [Google Scholar] [CrossRef] [Green Version]
- BPDB (Bangladesh Power Development Board). Available online: https://www.bpdb.gov.bd/bpdb_new/resourcefile/annualreports/annualreport_1574325376_Annual_Report_2018-19.pdf (accessed on 10 July 2020).
- Hasan, A.S.M.M.; Ammenberg, J. Biogas potential from municipal and agricultural residual biomass for power generation in Hazaribagh, Bangladesh—A strategy to improve the energy system. Renew. Energy Focus 2019, 29, 14–23. [Google Scholar] [CrossRef]
- Masud, M.H.; Nuruzzaman, M.; Ahamed, R.; Ananno, A.A.; Tomal, A.N.M.A. Renewable energy in Bangladesh: Current situation and future prospect. Int. J. Sustain. Energy 2019, 1–44. [Google Scholar] [CrossRef]
- Rahman, A. Green Banking and Sustainable Development: The Case of Bangladesh. Available online: Bb.org.bd/governor/speech/feb022013gse.pdf (accessed on 10 July 2020).
- BBS (Bangladesh Bureau of Statistics). Available online: https://bbs.portal.gov.bd/sites/default/files/files/bbs.portal.gov.bd/page/86b66335_4fa7_4143_a034_9abe3c537553/2020-05-15-16-25-34428631989cd04e5d8609c8ae6aed5c.pdf (accessed on 10 July 2020).
- Khalid, A.; Arshad, M.; Anjum, M.; Mahmood, T.; Dawson, L. The anaerobic digestion of solid organic waste. Waste Manag. Oxf. 2011, 31, 1737–1744. [Google Scholar] [CrossRef]
- Sarker, S.; Lamb, J.J.; Hjelme, D.R.; Lien, K.M. A Review of the Role of Critical Parameters in the Design and Operation of Biogas Production Plants. Appl. Sci. 2019, 9, 1915. [Google Scholar] [CrossRef] [Green Version]
- GEKH (Green Energy Knowledge Hub). Survey Report on Biogas Plans in Bangladesh by Green Energy Knowledge Hub; Bangladesh Agricultural University: Mymensingh, Bangladesh, 2015. [Google Scholar]
- Hasan, A.B.M.S.; Rahman, M.Z. Change in Temperature over Bangladesh Associated with Degrees of Global Warming. Asian J. Appl. Sci. Eng. 2013, 2, 62–75. [Google Scholar]
- Wang, S.; Ma, F.; Ma, W.; Wang, P.; Zhao, G.; Lu, X. Influence of Temperature on Biogas Production Efficiency and Microbial Community in a Two-Phase Anaerobic Digestion System. Water 2019, 11, 133. [Google Scholar] [CrossRef] [Green Version]
- Luo, G.; De Francisci, D.; Kougias, P.G.; Laura, T.; Zhu, X.; Angelidaki, I. New steady-state microbial community compositions and process performances in biogas reactors induced by temperature disturbances. Biotechnol. Biofuels 2015, 8, 3. [Google Scholar] [CrossRef] [Green Version]
- Garba, B. Effect of temperature and retention period on biogas production from ligrocellulosic material. Renew. Energy 1996, 9, 938–941. [Google Scholar] [CrossRef]
- Leven, L.; Eriksson, A.R.B.; Schnürer, A. Effect of process temperature on bacterial and archael communities in two methanogenic bioreactors treating organic household waste. FEMS Microbiol. Ecol. 2007, 59, 683–693. [Google Scholar] [CrossRef] [PubMed]
- Goswami, R.; Chattopadhyay, P.; Shome, A.; Banerjee, S.N.; Chakraborty, A.K.; Mathew, A.K.; Chaudhury, S. An overview of physico-chemical mechanisms of biogas production by microbial communities: A step towards sustainable waste management. Biotech. 2016, 6, 72. [Google Scholar] [CrossRef] [Green Version]
- Zhao, C. Effect of Temperature on Biogas Production in Anaerobic Treatment of Domestic Wastewater UASB System in Hammarby Sjöstadsverk. Master’s Thesis, Royal Institute of Technology (KTH), Stockholm, Sweden, 2011. [Google Scholar]
- Neshat, S.A.; Mohammadi, M.; Najafpour, G.D.; Lahijani, P. Anaerobic co-digestion of animal manures and lignocellulosic residues as a potent approach for sustainable biogas production. Renew. Sustain. Energy Rev. 2017, 79, 308–322. [Google Scholar] [CrossRef]
- Dobre, P.; Matei, F.; Nicolae, F. Main factors affecting biogas production-an overview. Rom. Biotechnol. Lett. Romenia 2014, 19, 9283–9296. [Google Scholar]
- Alvarez, J.A.; Zapico, C.A.; Gomez, M.; Ruiz, I.; Soto, M. Anaerobic treatment and pre-treatment of municipal wastewater at low ambient temperature. In Proceedings of the 9th World Congress Anaerobic Digestion, Antwerp, Belgium, 2–6 September 2001. [Google Scholar]
- Zhou, S.; Zhang, J.; Zou, G.; Riya, S.; Hosomi, M. Mass and Energy Balances of Dry Thermophilic Anaerobic Digestion Treating Swine Manure Mixed with Rice Straw. Biotechnol. Res. Int. 2015, 895015. [Google Scholar] [CrossRef] [Green Version]
- Iqbal, S.A.; Rahaman, S.; Rahman, M.; Yousuf, A. Anaerobic digestion of kitchen waste to produce biogas. Procedia. Eng. 2014, 90, 657–662. [Google Scholar] [CrossRef] [Green Version]
- Rahman, M.A.; Saha, C.K.; Feng, L.; Møller, H.B.; Alam, M.M. Anaerobic digestion of agro-industrial wastes of Bangladesh: Influence of total solids content. Eng. Agric. Environ. Food 2019. [Google Scholar] [CrossRef]
- Akter, S.; Tasnim, S.M.; Saha, C.K.; Nandi, R.; Huda, M.S. Bio-energy potential of different food wastes. J. Bangladesh Agric. Univ. 2020, 18, 138–144. [Google Scholar] [CrossRef]
- Tasnim, T.; Behera, S.K.; Zafar, M.; Park, H. Batch anaerobic digestion of simulated Bangladeshi food waste: Methane production at different inoculum-to-substrate ratios and kinetic analysis. Int. J. Glob. Warm. 2016, 9, 95–101. [Google Scholar] [CrossRef]
- Miah, M.R.; Rahman, A.K.M.L.; Akanda, M.R.; Pulak, A.; Rouf, M.A. Production of biogas from poultry litter mixed with the co-substrate cow dung. J. Taibah Univ. Sci. 2016, 10, 497–504. [Google Scholar] [CrossRef] [Green Version]
- Hinks, J.; Edwards, S.; Sallis, P.J.; Caldwell, G.S. The steady state anaerobic digestion of Laminaria hyperborean—Effect of hydraulic residence on biogas production and bacterial community composition. Bioresour. Technol. 2013, 143, 221–230. [Google Scholar] [CrossRef] [PubMed]
- Ward, A.J.; Feng, L.; Moset, V.; Moller, H.B. Estimation of Methane Yields in Continuous Biogas Reactors Using Kinetic and Mass Flow Models. Chem. Eng. Technol. 2018, 41, 761–767. [Google Scholar] [CrossRef]
- Nandi, R.; Saha, C.K.; Huda, M.S.; Alam, M.M. Effect of Mixing on Biogas Production from Cowdung. Eco Friendly Agric. J. 2017, 10, 7–13. [Google Scholar]
- APHA. Standard Methods for the Examination of Waste Water, 23rd ed.; American Public Health Association: Washington, DC, USA, 2017. [Google Scholar]
- Møller, H.B.; Ward, A.J. Modeling Volatile Fatty Acid Concentration in Livestock Manure–Based Anaerobic Digesters by Simple Titration. Environ. Eng. Sci. 2011, 28, 507–513. [Google Scholar] [CrossRef]
- Waskman, S.A. Chemical nature of organic matter or humus in sols, peat bogs and composts. J. Chem. Educ. 1935, 12, 511–519. [Google Scholar] [CrossRef]
- Abubakar, B.S.U.I.; Ismail, N. Anaerobic digestion of cow dung for biogas production. ARPN J. Eng. Appl. Sci. 2012, 7, 169–172. [Google Scholar]
- Rahman, M.A.; Moller, H.B.; Saha, C.K.; Alam, M.M.; Wahid, R.; Feng, L. Optimal ratio for anaerobic co-digestion of poultry droppings and lignocellulosic-rich substrates for enhanced biogas production. Energy Sustain. Dev. 2017, 39, 59–66. [Google Scholar] [CrossRef]
- Giovanna, G.; Claudia, C.; Filomena, D.; Stefania, P.; Biagio, M.; Mario, M. Does the C/N ratio really affect the bio-methane yield? A three years investigation of Buffalo manure digestion. Chem. Eng. Trans. 2016, 49, 463–468. [Google Scholar] [CrossRef]
- Gao, R.; Li, Z.; Wang, X.; Cheng, S.; Yin, F. Study on anaerobic co-digestion of cow manure, maize straw and vegetable waste. In Proceedings of the 2015 International Conference on Applied Science and Engineering Innovation, Henan, China, 30–31 August 2015; pp. 357–363. [Google Scholar] [CrossRef] [Green Version]
- Yadav, A.; Gupta, R.; Garg, V. Organic manure production from cow dung and biogas plant slurry by vermicomposting under field conditions. Int. J. Recycl. Org. Waste Agric. 2013, 2, 21. [Google Scholar] [CrossRef] [Green Version]
- Komemoto, K.; Lim, Y.G.; Nagao, N.; Onoue, Y.; Niwa, C.; Toda, C. Effect of temperature on VFA’s and biogas production in anaerobic solubilisation of food waste. Waste Manag. 2009, 29, 2950–2955. [Google Scholar] [CrossRef] [PubMed]
- Rahman, M.A.; Møller, H.B.; Saha, C.K.; Alam, M.M. The effect of temperature on the anaerobic co-digestion of poultry droppings and sugar mill press mud. Biofuels 2019. [Google Scholar] [CrossRef]
- Karakashev, D.; Bastone, D.; Angelidaki, I. Influence of environmental conditions on methanogenic compositions in anaerobic biogas reactors. Appl. Environ. Microbiol. 2005, 71, 331–338. [Google Scholar] [CrossRef] [Green Version]
- Vanegas, C.; Bartlett, J. Anaerobic Digestion of Laminaria digitata: The Effect of Temperature on Biogas Production and Composition. Waste Biomass Valorization 2013, 4, 509–515. [Google Scholar] [CrossRef]
- Mao, C.; Zhang, T.; Wang, X.; Feng, Y.; Ren, G.; Yang, G. Process performance and methane production optimizing of anaerobic co-digestion of swine manure and corn straw. Sci. Rep. 2017, 7, 9379. [Google Scholar] [CrossRef] [PubMed] [Green Version]
- Sneath, R.W.; Burton, C.H.; Williams, A.G. Continuous aerobic treatment of piggery slurry for odor control scaled up to a farm-size unit. J. Agric. Eng. Res. 1992, 53, 81–92. [Google Scholar] [CrossRef]
- Hansson, G. Methane production from marine, green macro algae. Resour. Conserv. 1983, 8, 185–194. [Google Scholar] [CrossRef]
- Wang, J.; Wan, W. Effect of temperature on fermentative hydrogen production by mixed cultures. Int. J. Hydrog. Energy 2008, 33, 5392–5397. [Google Scholar] [CrossRef]
- Rajagopal, R.; Massé, D.I.; Singh, G. A critical review on inhibition of anaerobic digestion process by excess ammonia. Bioresour. Technol. 2013, 143, 632–641. [Google Scholar] [CrossRef]
- Ramaraj, R.; Unpaprom, Y. Effect of temperature on the performance of biogas production from Duckweed. Chem. Sci. 2016, 1, 58–66. [Google Scholar]
- Liu, Z.; Lv, J. The effect of total solids concentration and temperature on biogas production by anaerobic digestion. Energy Sources Part A Recovery Util. Environ. Eff. 2016, 38, 3534–3541. [Google Scholar] [CrossRef]
- Obiukwu, O.O.; Grema, L.U. The Optimum Mesophilic Temperature of Batch Process Biogas Production from Animal-based Wastes. Res. J. Appl. Sci. Eng. Technol. 2014, 16, 1772–1776. [Google Scholar] [CrossRef]
- Pfeffer, J.T. Temperature effects on anaerobic fermentation of domestic refuse. Biotechnol. Bioeng. 1974, 16, 771–787. [Google Scholar] [CrossRef]
- Franqueto, R.; da Silva, J.D.; Konig, M. Effect of Temperature Variation on Codigestion of Animal Waste and Agricultural Residue for Biogas Production. Bioenergy Res. 2020, 13, 630–642. [Google Scholar] [CrossRef]
- Membere, E.; Sallis, P. Effect of temperature on kinetics of biogas production from macroalgae. Bioresour. Technol. 2018, 263, 410–417. [Google Scholar] [CrossRef] [Green Version]
- Li, Y.; Chen, Y.; Wu, J. Enhancement of methane production in anaerobic digestion process: A review. Appl. Energy 2019, 240, 120–137. [Google Scholar] [CrossRef]
- Wang, X.; Li, Z.; Zhou, X.; Wang, Q.; Wu, Y.; Saino, M.; Bai, X. Study on the bio-methane yield and microbial community structure in enzyme enhanced anaerobic co-digestion of cow manure and corn straw. Bioresour. Technol. 2016, 219, 150–157. [Google Scholar] [CrossRef]
- Connelly, R. Second-Generation Biofuel from High-Efficiency Algal-Derived Biocrude. In Bioenergy Research: Advances and Applications, 1st ed.; Gupta, V., Touhy, M., Kubicek, C., Saddler, J., Xu, F., Eds.; Elsevier: Waltham, MA, USA, 2014; pp. 153–170. [Google Scholar] [CrossRef]
- Sialve, B.; Bernet, N.; Bernard, O. Anaerobic digestion of microalgae as a necessary step to make microalgal biodiesel sustainable. Biotechnol. Adv. 2009, 27, 409–416. [Google Scholar] [CrossRef] [Green Version]
- Chynoweth, D.; Isaacson, R. Anaerobic Digestion of Biomass; Elsevier Applied Science: New York, NY, USA, 1987. [Google Scholar]
- Chen, P.H. Factors Influencing Methane Fermentation of Micro-algae. Ph.D. Thesis, University of California, Berkeley, CA, USA, 1987. [Google Scholar]
- Artsupho, L.; Jutakridsada, P.; Laungphairojana, A.; Rodriguez, J.F.; Kamwilaisak, K. Effect of Temperature on Increasing Biogas Production from Sugar Industrial Wastewater Treatment by UASB Process in Pilot Scale. Energy Procedia. 2016, 100, 30–33. [Google Scholar] [CrossRef] [Green Version]
- Hobson, P.N.; Bousfield, S.; Summers, R.; Mills, P.J. Anaerobic digestion of piggery and poultry wastes. In Anaerobic Digestion; Stafford, B.E., Wheatley, B.I., Hughes, D.E., Eds.; Applied Science Publishers: London, UK, 1980; pp. 237–253. [Google Scholar]
- Varel, V.H.; Chen, T.H.; Hashimoto, A.G. Thermophilic and mesophilic methane production from Spirulina maxima. Resour. Conserv. Recycl. 1988, 1, 19–26. [Google Scholar] [CrossRef]
- Samson, R.; LeDuy, A. Detailed study of anaerobic digestion of Spirulina maxima algal biomass. Biotechnol. Bioeng. 1986, 28, 1014–1023. [Google Scholar] [CrossRef] [PubMed]
Figure 1.
Experiment set-up with three continuously stirred tank reactors (CSTRs).
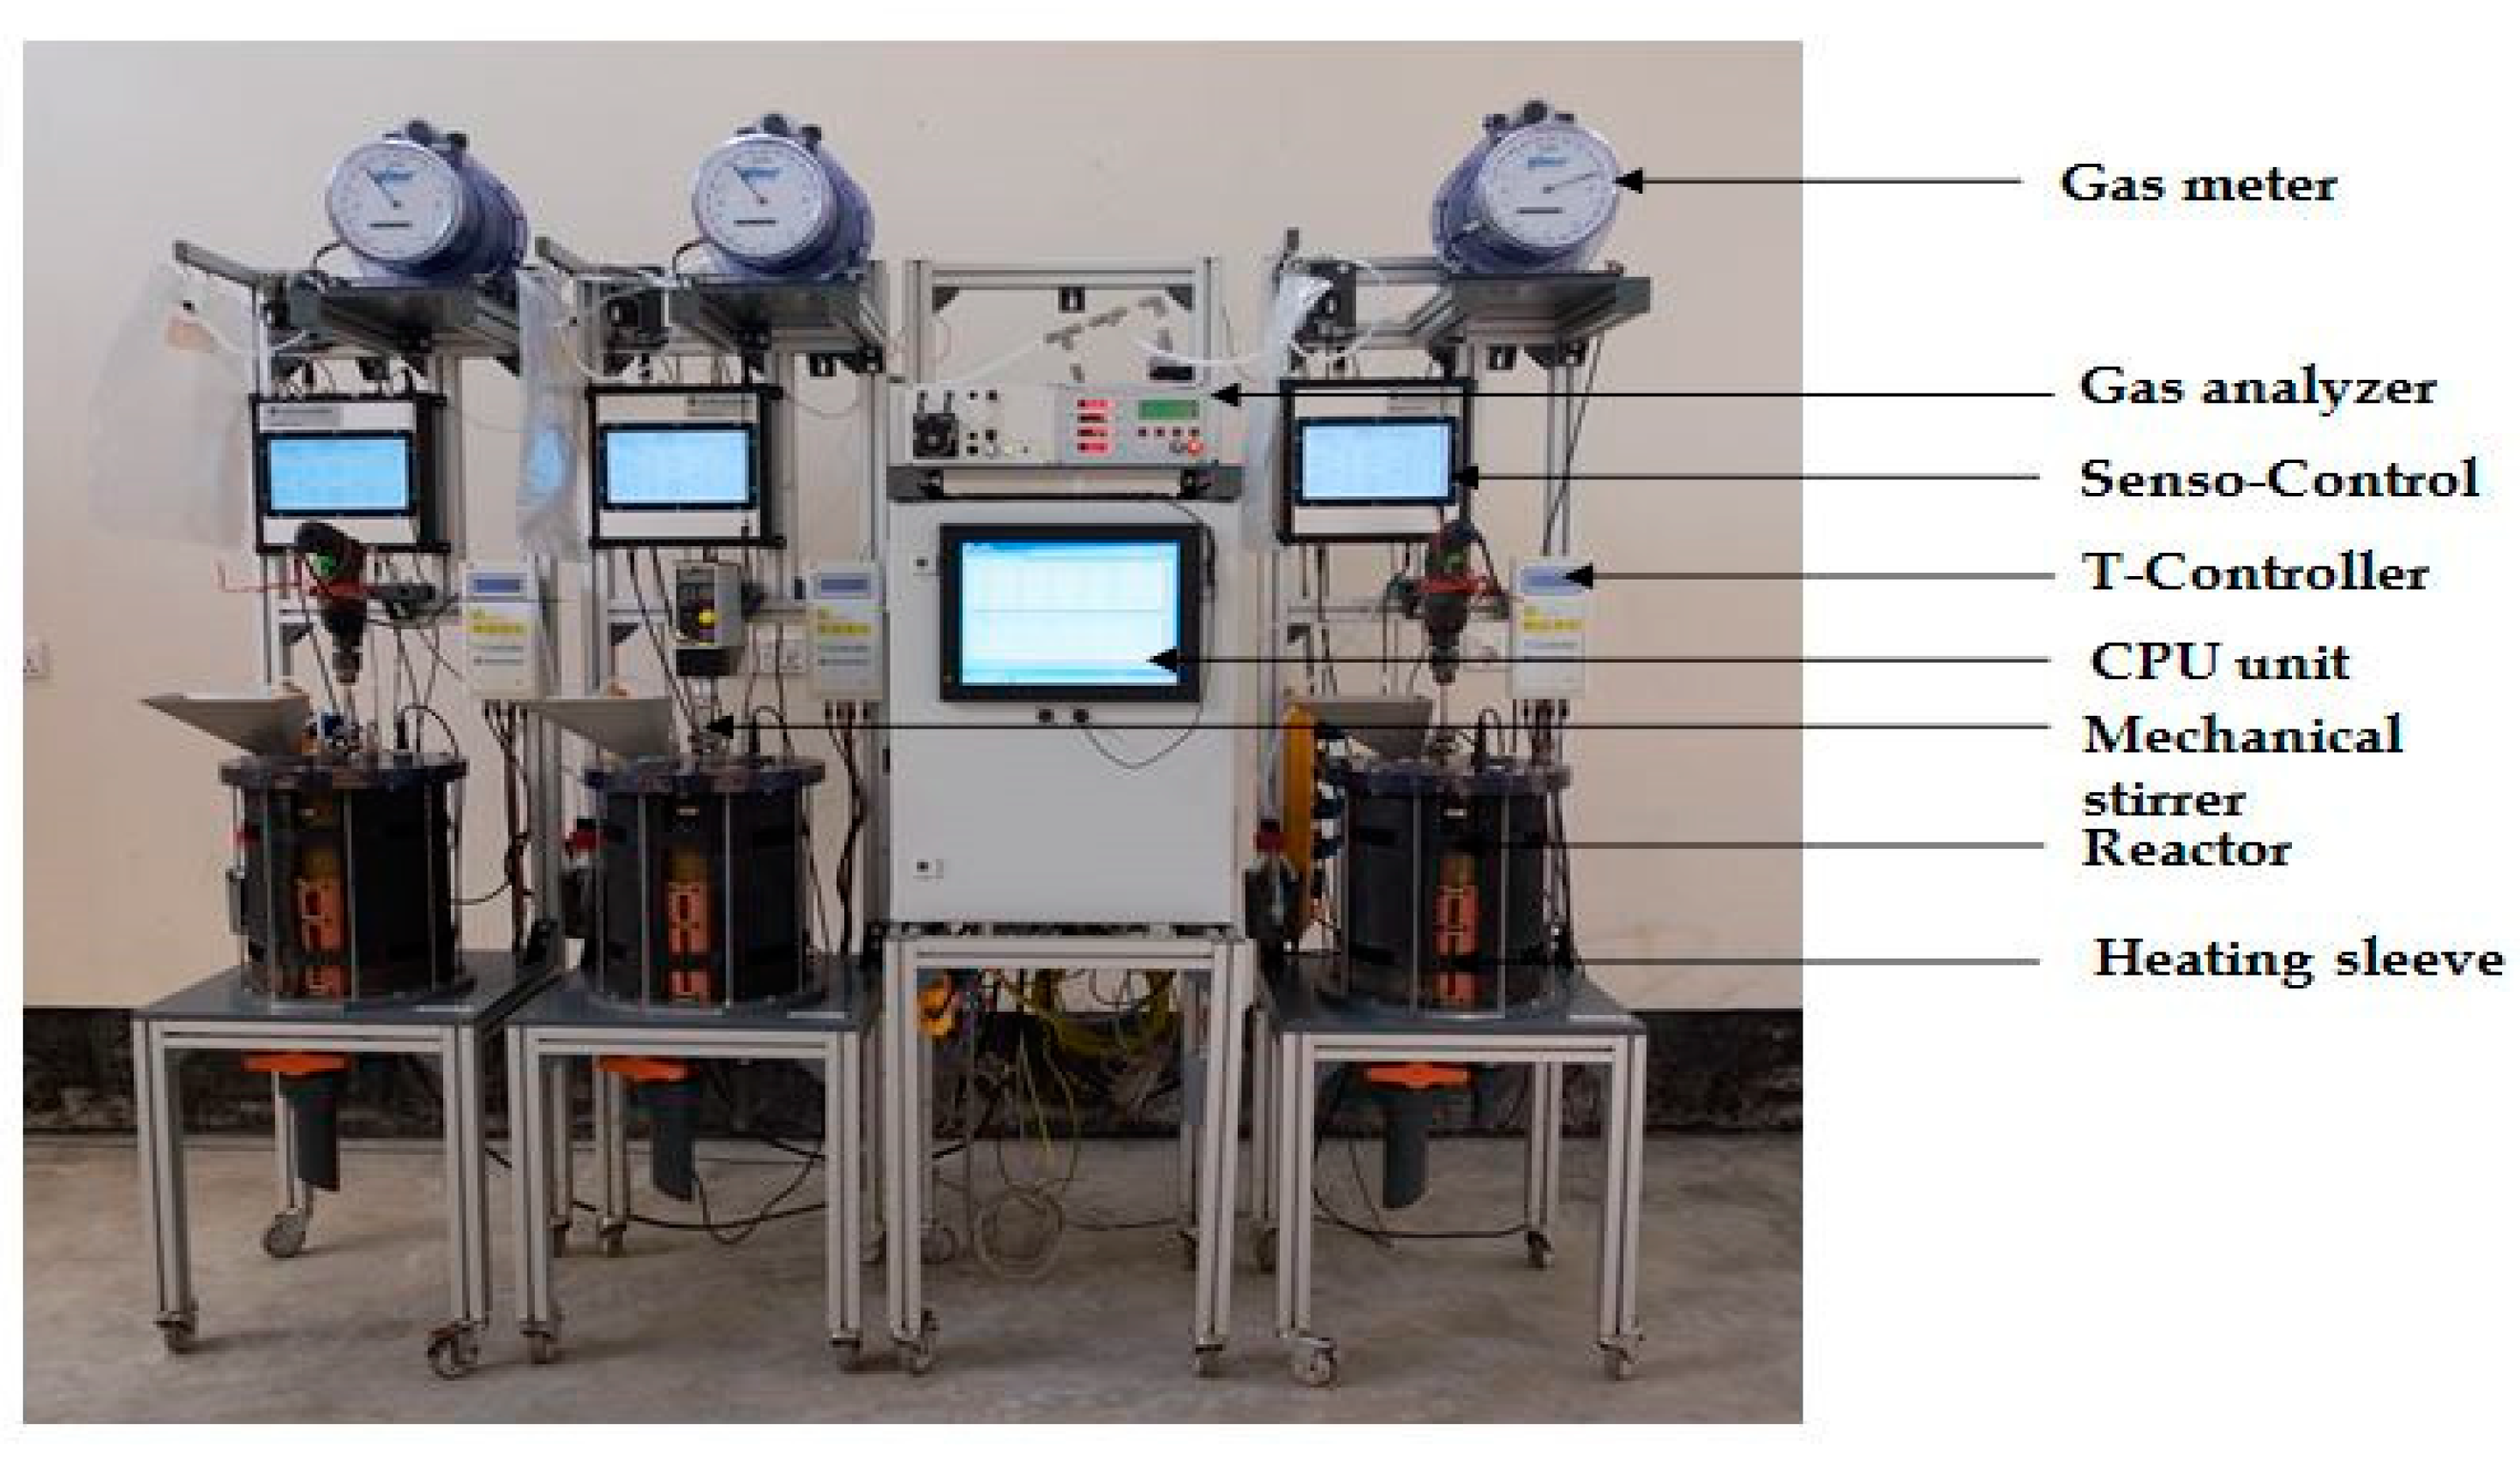
Figure 2.
Variation of the pH at different temperatures (each data point here represents the average of triplicate experiment).
Figure 2.
Variation of the pH at different temperatures (each data point here represents the average of triplicate experiment).

Figure 3.
Variation of volatile fatty acids (VFAs) at different temperatures (each data point here represents the average of a triplicate experiment).
Figure 3.
Variation of volatile fatty acids (VFAs) at different temperatures (each data point here represents the average of a triplicate experiment).

Figure 4.
Degradation efficiency over the digestion period (each data point here represents the average of a triplicate experiment.).
Figure 4.
Degradation efficiency over the digestion period (each data point here represents the average of a triplicate experiment.).

Figure 5.
NH4-N concentration at different temperatures (each data point here represents the average of a triplicate experiment).
Figure 5.
NH4-N concentration at different temperatures (each data point here represents the average of a triplicate experiment).
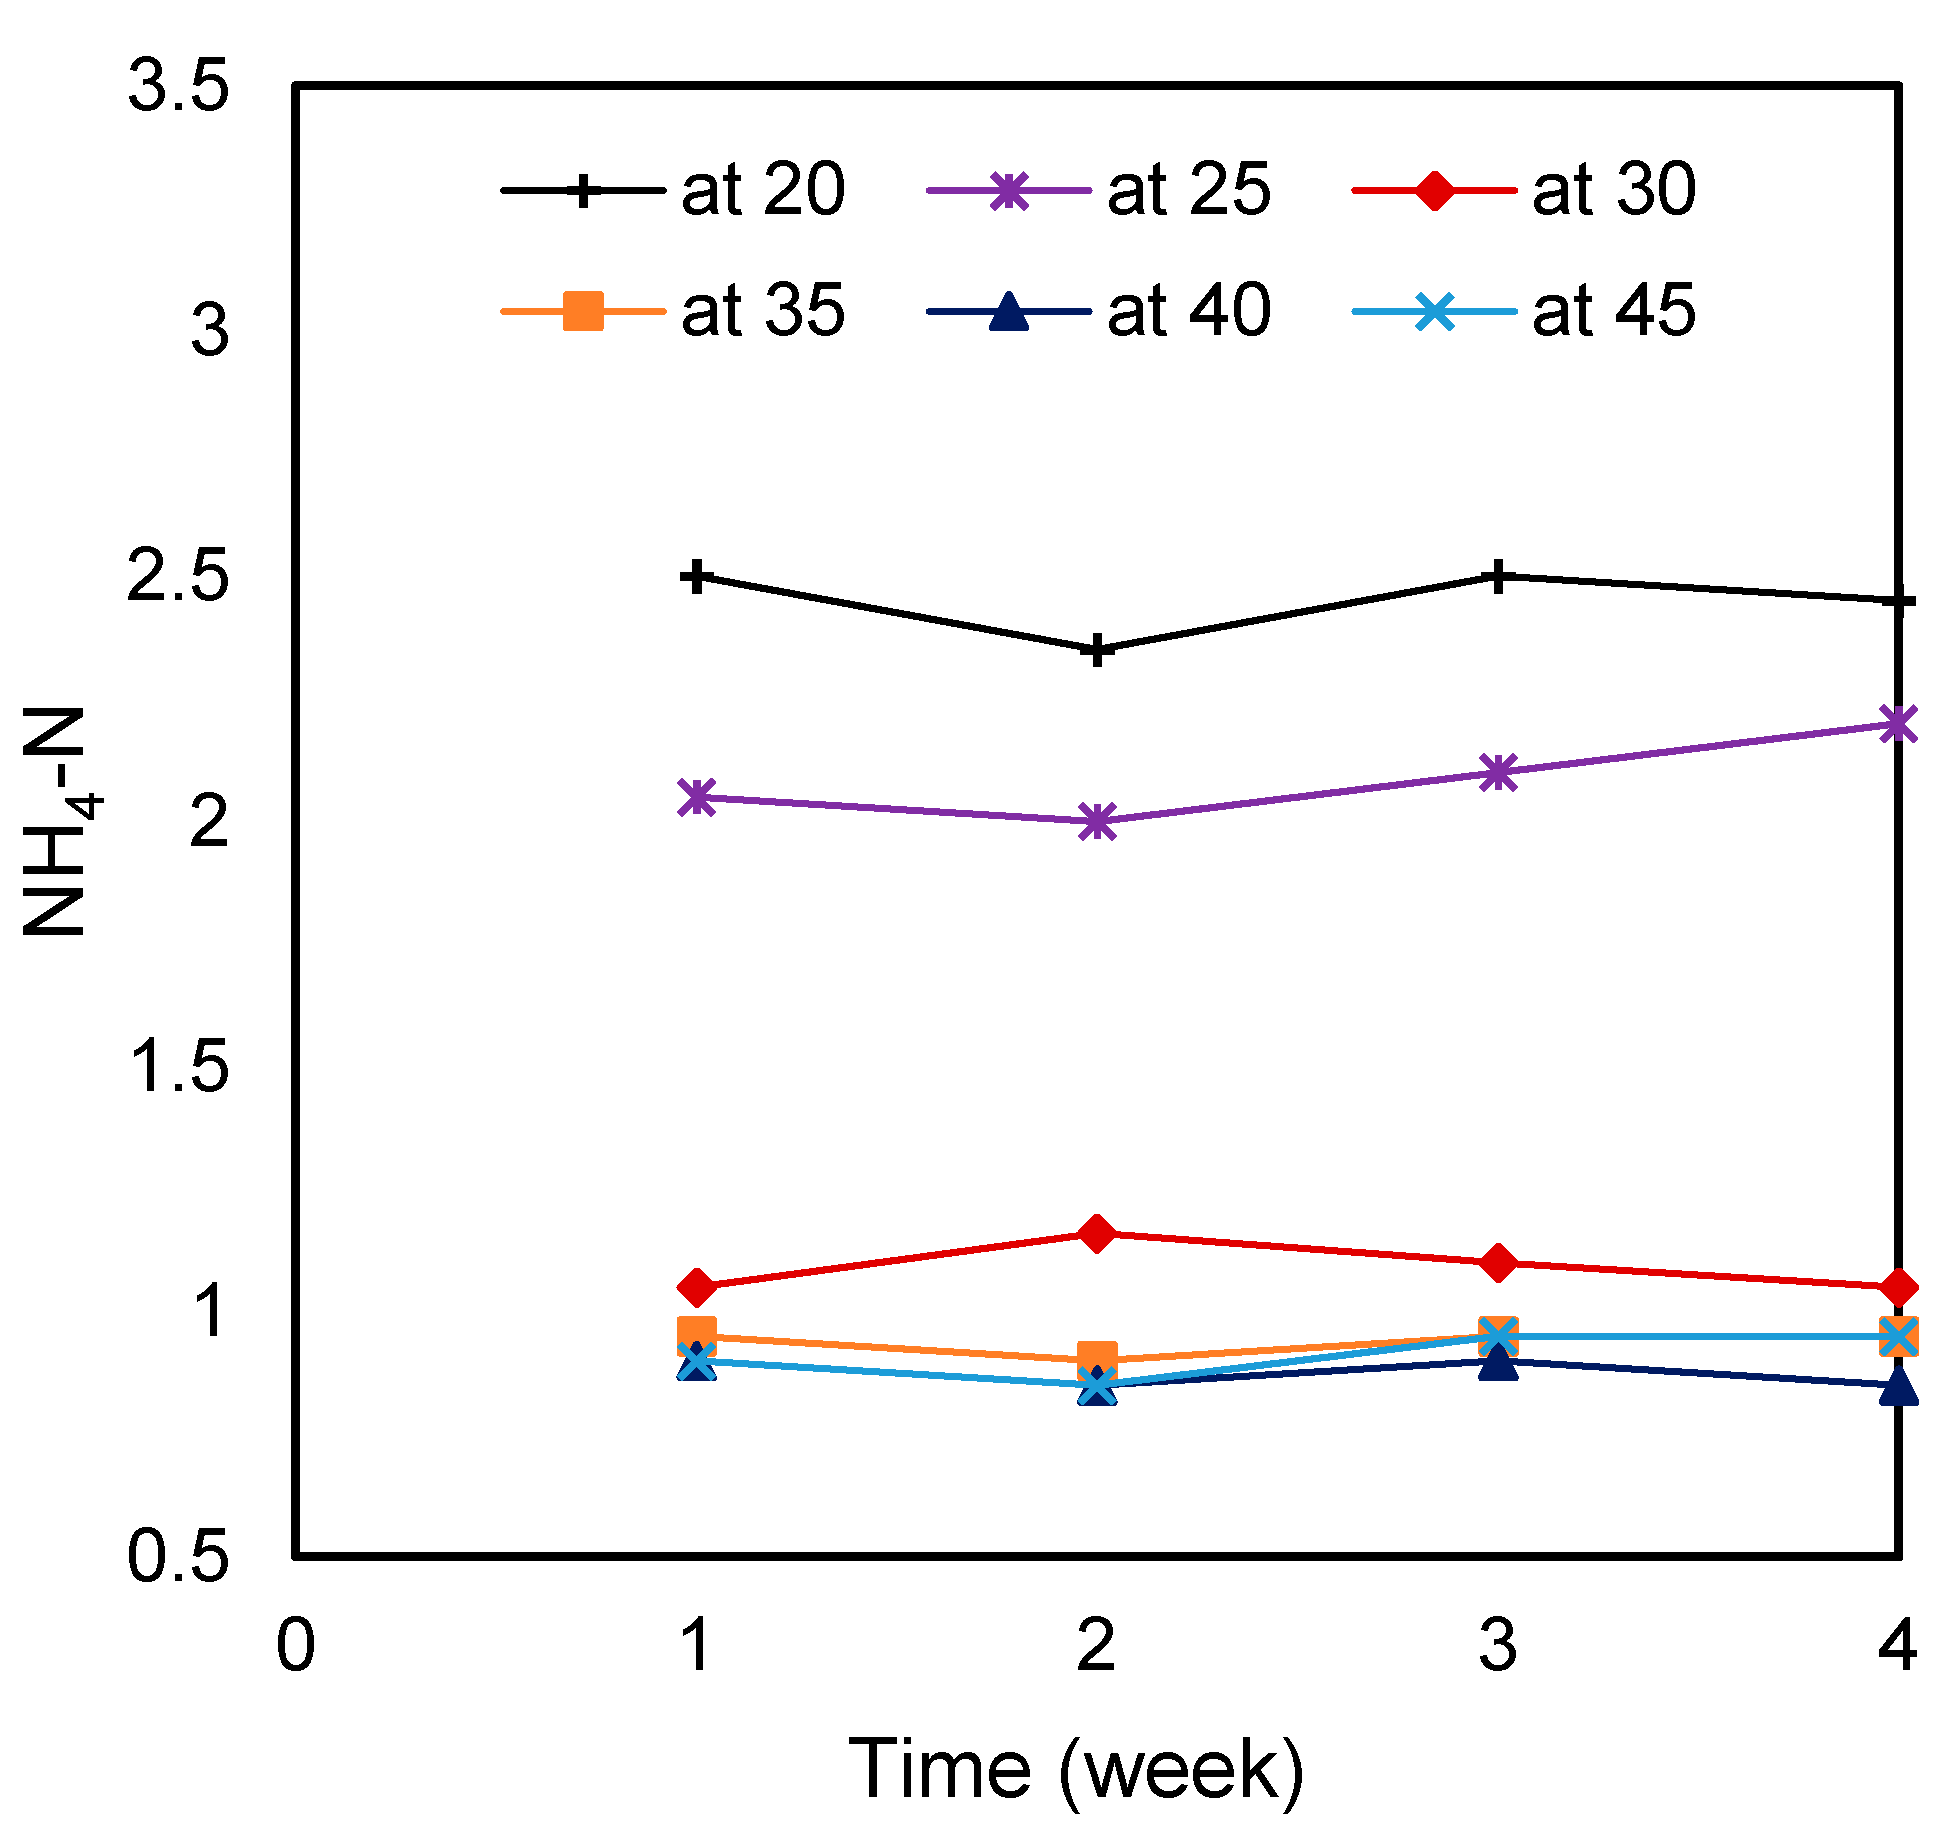
Figure 6.
Biogas production profiles at different temperatures.

Figure 7.
(a) Methane, (b) CO2 and (c) H2S content at different temperatures.


Figure 8.
Methane production profiles at different temperatures.
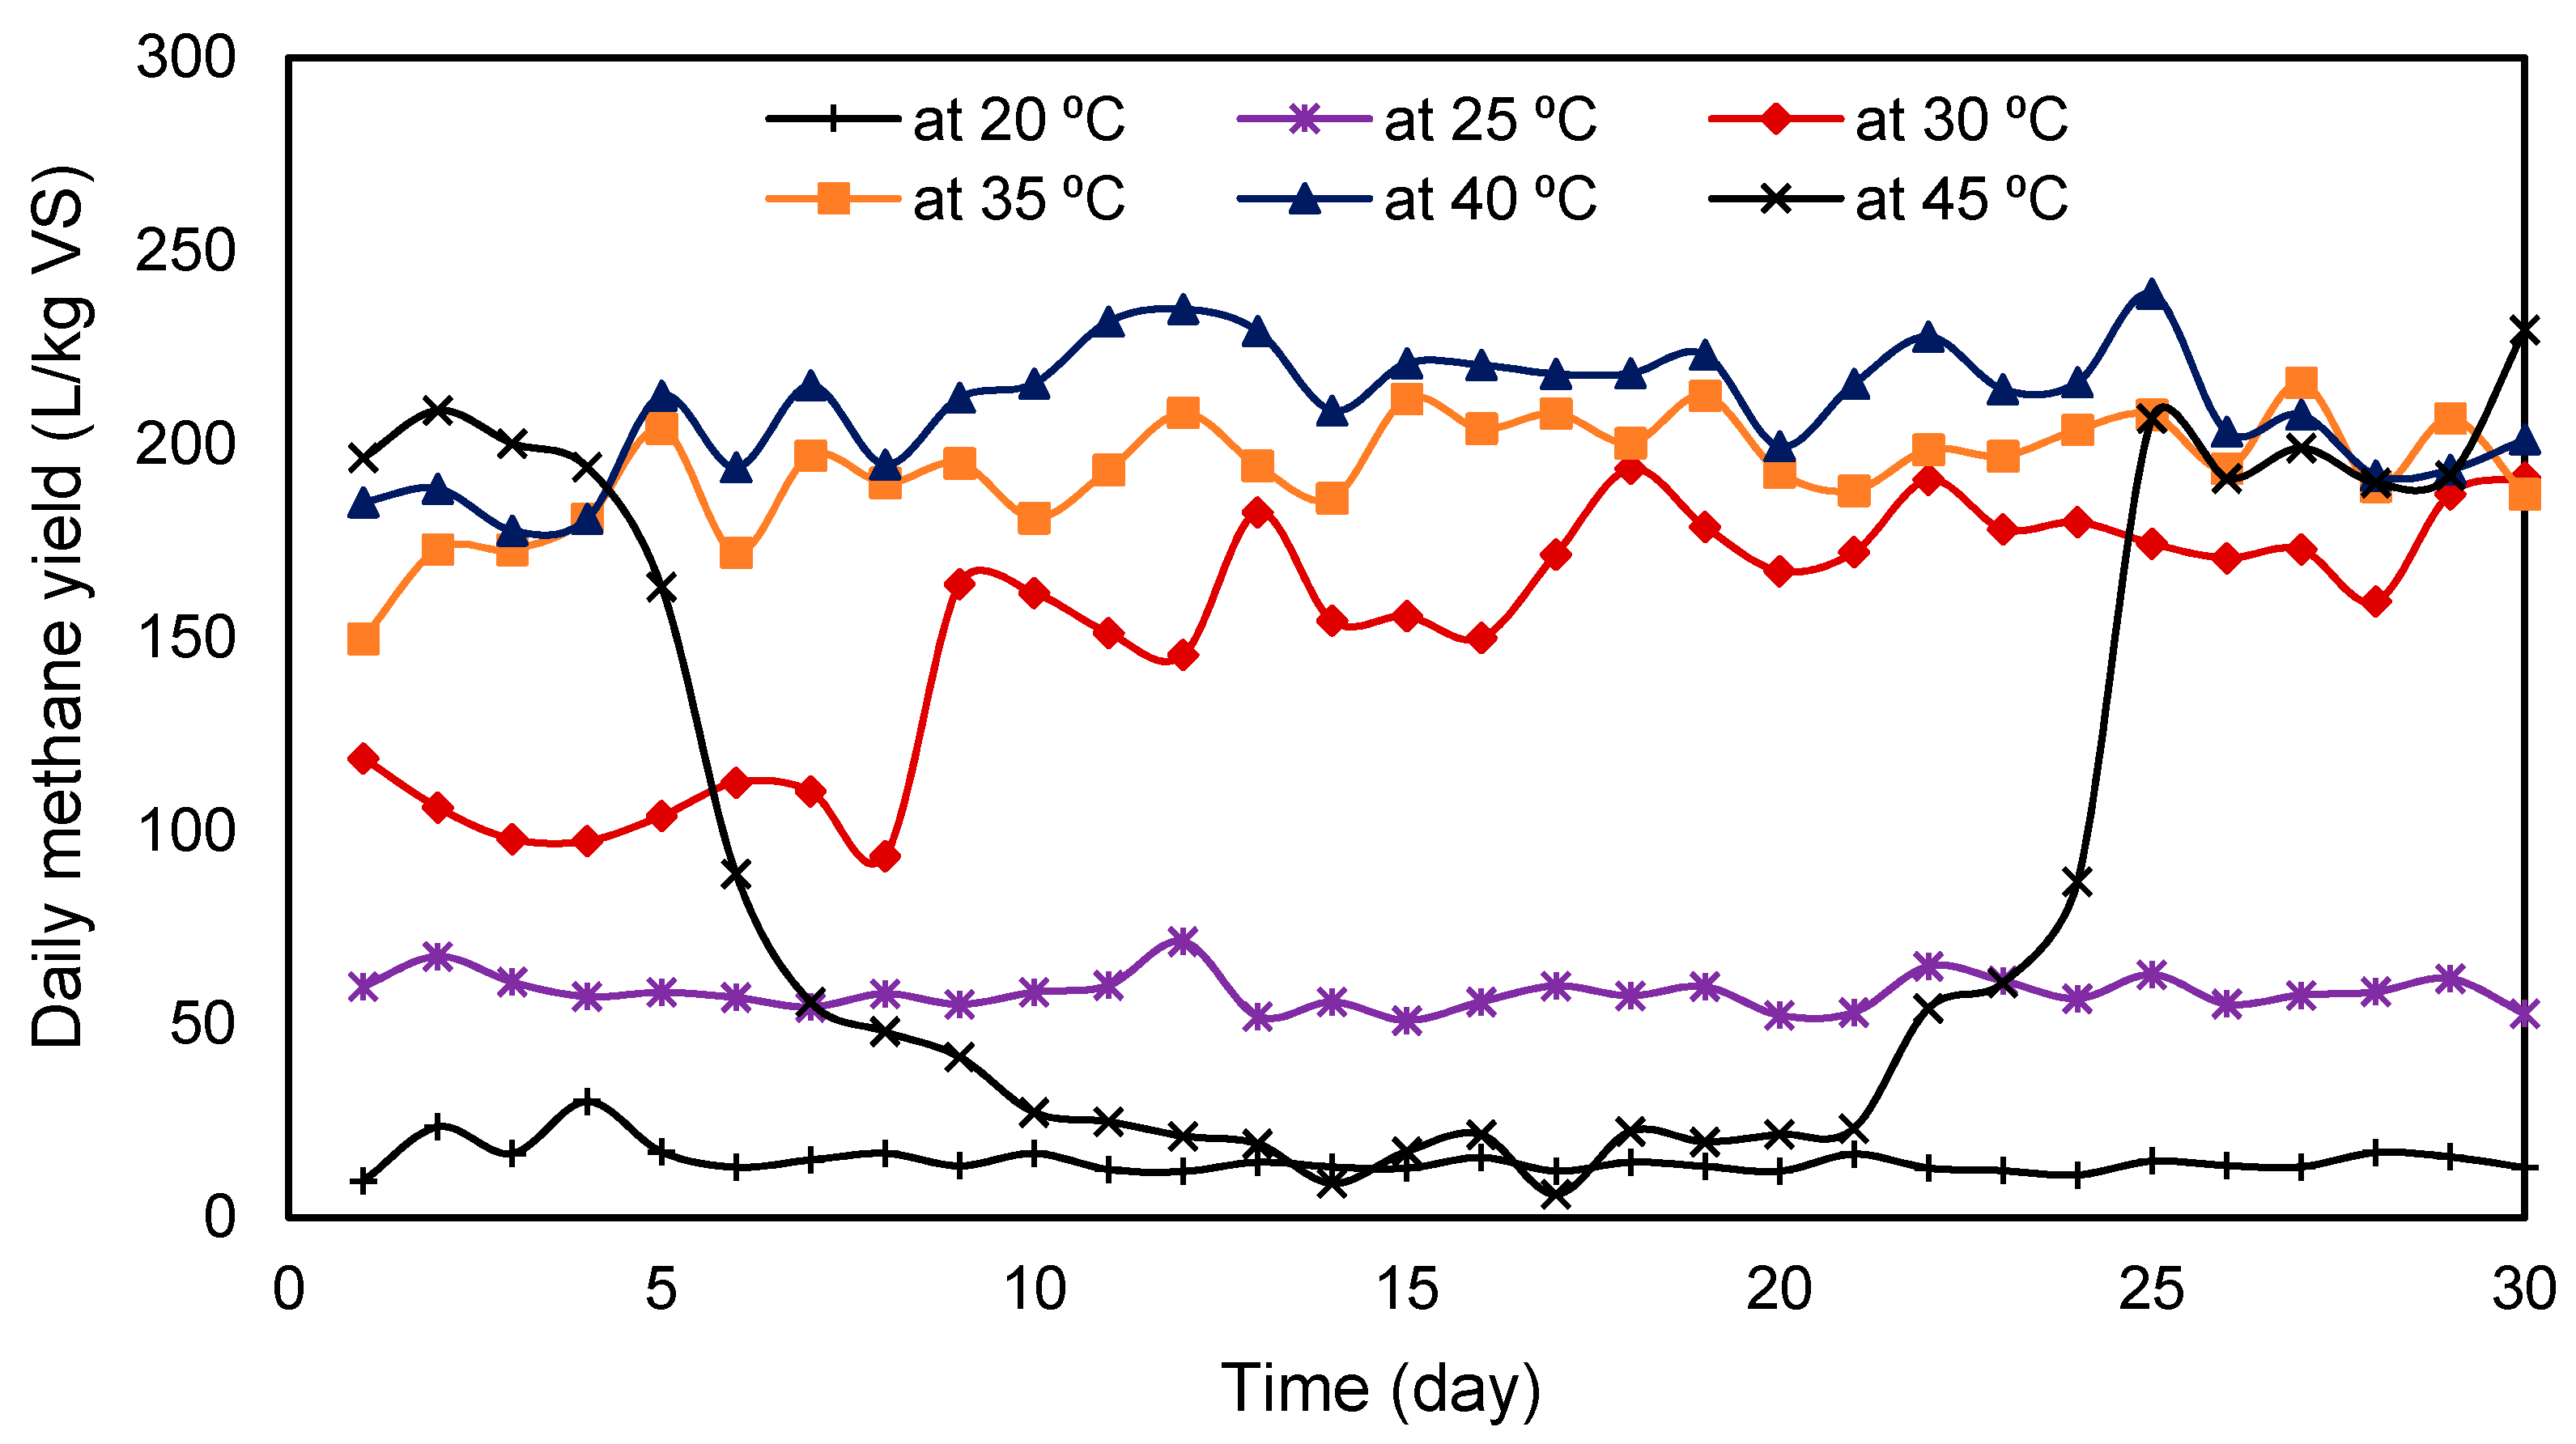
Figure 9.
Regression polynomial curve for (a) Methane yield and (b) VSD.

Figure 10.
Optimization plot.


Table 1.
Characteristics of cow-dung.
| Parameter | Value |
|---|---|
| TS (%) | 17.30 ± 0.08 |
| VS (%) | 14. 51 ± 0.09 |
| pH | 7.08 ± 0.03 |
| VFA (g/L) | 4.03 ± 0.05 |
| Alkalinity (g/L) | 0.04 ± 0.00 |
| NH4-N (g/L) | 1.66 ± 0.03 |
| Total Nitrogen (g/L) | 3.16 ± 0.01 |
| C/N ratio | 26.02 ± 0.22 |
Table 2.
Digestate characteristics.
| Parameter | 20 °C | 25 °C | 30 °C | 35 °C | 40 °C | 45 °C |
|---|---|---|---|---|---|---|
| TS (%) | 7.87 ± 0.18 | 7.19 ± 0.20 | 6.39 ± 0.19 | 6.06 ± 0.31 | 5.95 ± 0.27 | 6.80 ± 0.39 |
| VS (%) | 6.37 ± 0.10 | 5.84 ± 0.13 | 5.16 ± 0.80 | 4.89 ± 0.30 | 4.72 ± 0.23 | 5.58 ± 0.40 |
| VFA (g/L) | 3.61 ± 0.22 | 2.20 ± 0.16 | 1.33 ± 0.19 | 1.10 ± 0.12 | 1.03 ± 0.08 | 3.02 ± 1.75 |
| NH4-N (g/L) | 2.45 ± 0.07 | 2.09 ± 0.09 | 1.09 ± 0.05 | 0.94 ± 0.03 | 0.88 ± 0.03 | 0.91 ± 0.05 |
Table 3.
Changes in biogas volume, methane composition and pH at different temperatures.
| Temperature (°C) | Biogas Volume (L/kg VS) (Mean ± SD) | CH4 (%) | CH4 (L/kg VS) | pH |
|---|---|---|---|---|
| 20 | 26.44 ± 7.01 a | 55.63 ± 0.87 a | 14.70 ± 3.88 a | 6.16 ± 0.04 a |
| 25 | 101.80 ± 7.62 b | 57.16 ± 0.94 b | 58.20 ± 4.55 b | 6.28 ± 0.04 b |
| 30 | 230.28 ± 47.03 c | 66.37 ± 1.40 c | 153.05 ± 32.11 c | 6.44 ± 0.03 a |
| 35 | 289.09 ± 22.59 d | 67.05 ± 0.8 c | 193.78 ± 14.54 d | 6.45 ± 0.03 a |
| 40 | 312.43 ± 25.41 d | 67.16 ± 1.55 c | 209.70 ± 16.23 d | 6.45 ± 0.02 a |
| 45 | 142.4 ± 116.8 e | 61.83 ± 6.74 d | 94.6 ± 82.3 e | 6.13 ± 0.30 b |
| p-value (temperature) | 0.000 | 0.000 | 0.000 | 0.000 |
| p-value(time) | 0.872 | 0.513 | 0.848 | 0.398 |
a–e Within each column, different letters indicate a significantly increased difference (p < 0.05).
Table 4.
Model statistics.
| Methane Yield (L/kg VS) | VSD (%) | |||
|---|---|---|---|---|
| Model | Standard Error of Regression (S) | Regression Coefficient (R2) | Standard Error of Regression (S) | Regression Coefficient (R2) |
| Linear | 68.36 | 37.97% | 7.37 | 42.49% |
| Quadratic | 36.79 | 86.53% | 3.26 | 91.55% |
| Cubic | 12.04 | 99.04% | 1.48 | 98.84% |
Table 5.
Best fit regression equations using the cubic model.
| Predictor | Response Variable | Regression Equation |
|---|---|---|
| Temperature (T) | Methane yield (Y) | Y = 1020 − 129.1 T + 5.158 T2 − 0.06102 T3 |
| VSD | VSD (%) = 75.62 − 9.473 T + 0.4195 T2 − 0.005216 T3 |
Table 6.
Comparison between measured and predicted values of specific methane yields and VSD.
| Methane Yield (L/kg VS) | VSD (%) | |||
|---|---|---|---|---|
| Temperature (°C) | Actual | Predicted | Actual | Predicted |
| 20 | 14.70 | 13.04 | 12.16 | 12.23 |
| 25 | 58.20 | 62.81 | 19.37 | 19.48 |
| 30 | 153.05 | 141.66 | 28.96 | 28.15 |
| 35 | 193.78 | 203.82 | 32.74 | 34.32 |
| 40 | 209.70 | 203.52 | 35.12 | 34.08 |
| 45 | 94.63 | 95.00 | 23.15 | 23.51 |
Publisher’s Note: MDPI stays neutral with regard to jurisdictional claims in published maps and institutional affiliations. |
© 2020 by the authors. Licensee MDPI, Basel, Switzerland. This article is an open access article distributed under the terms and conditions of the Creative Commons Attribution (CC BY) license (http://creativecommons.org/licenses/by/4.0/).
Share and Cite
MDPI and ACS Style
Nandi, R.; Saha, C.K.; Sarker, S.; Huda, M.S.; Alam, M.M. Optimization of Reactor Temperature for Continuous Anaerobic Digestion of Cow Manure: Bangladesh Perspective. Sustainability 2020, 12, 8772. https://doi.org/10.3390/su12218772
AMA Style
Nandi R, Saha CK, Sarker S, Huda MS, Alam MM. Optimization of Reactor Temperature for Continuous Anaerobic Digestion of Cow Manure: Bangladesh Perspective. Sustainability. 2020; 12(21):8772. https://doi.org/10.3390/su12218772
Chicago/Turabian StyleNandi, Rajesh, Chayan Kumer Saha, Shiplu Sarker, Md. Sanaul Huda, and Md. Monjurul Alam. 2020. "Optimization of Reactor Temperature for Continuous Anaerobic Digestion of Cow Manure: Bangladesh Perspective" Sustainability 12, no. 21: 8772. https://doi.org/10.3390/su12218772
Note that from the first issue of 2016, this journal uses article numbers instead of page numbers. See further details here.