1. Introduction
With limited natural resources, about 99% of the required energy of Taiwan is imported, putting uncertainties on the economy and energy safety. Developing renewable will alleviate such situation. Among the potential options, the wind energy and photovoltaic (PV) are the most practical techniques. For wind energy, we are actively developing the offshore wind farm, with the goal of 5.7 GW in 2025. Locations suitable for the large and onshore wind turbine have almost been installed. Large onshore wind turbines are installed along the coastal line of western Taiwan. Thus, further installation should shift to the inland and urban region.
In summer, tropical cyclones and Asia monsoon is commonly confronted in Taiwan. In winter, the northeast trade wind is the primary source of wind power for the wind turbine system. Large-scale wind turbines were installed along the western coastal line of Taiwan. Newly planned wind farm will turn to inland area with more complex terrain and obstacles. The assessment of wind resources and micro-siting that should be conducted before the development of wind farm would be more challenging.
Wind resources evaluation has been conducted for decades and there have been several kinds of commercial software available on the market. Such programs can be classified as the simple-linear and detail-nonlinear model. For the simple-linear, such as the Wind Atlas Analysis and Application Program (WAsP) model, the overall trend and distribution of wind resources can be obtained in a short period of time. For the detail-nonlinear model (such as computational fluid dynamics, CFD), sophisticated set-up of the numerical model and a large amount of computational resources are required. The comparison of the linear and non-linear model has been made in several studies in the past. Hillring and Krieg [
1] developed the wind atlas by WAsP for a region in Sweden. As the preliminary study, the resolution was not good, and rough indication can be obtained by this analysis. They also pointed out that further study with better resolution should be made as the reference for policy making process. Durak and Sen [
2] used WAsP to install 20,600 kW wind turbines in a wind farm of Turkey with average distance of 150–200 m. They also suggested that the annual electricity production (AEP) evaluated by WAsP should be reduced by 10% for the effect of the comprehensive loss. The yielding AEP with the effect of loss was 31–41 GWh.
Berge et al. [
3] found that using the CFD models led to insignificant improvement when comparing to that by WAsP. However, for the site with complex terrain (such as cliff), the superiority was observed for the CFD model from the study of Palma et al. [
4]. Dehmas et al. [
5] built the wind atlas by WAsP for a wind farm in Algeria. Five wind turbines were installed in the model to evaluate AEP. Furthermore, economic and carbon-reduction analyses were also conducted. Results showed that the simple payback was about 13.3 years, and the carbon reduction was 8588 tons/year. Carvalho et al. [
6] evaluated the wind resources by Weather Research and Forecasting (WRF) and WAsP in two sites located in Portugal with complex terrain. Results showed that the output data by the mesoscale model should not be employed mainly due to the lower resolution of the terrain data. Waewsak et al. [
7] built the wind atlas along the coastal regions of Thailand. Optimization was conducted with parameters of wind turbine capacity and inter-distance of each turbine. Resulted showed that the average wind speed on the height of 120 m in the coastal regions was about 3.3~5.3 m/s, which is not good when comparing the value of Taiwan (at least 9 m/s above). With the scope of 90 MW, the calculated AEP was about 170 GWh/year. Lennard et al. [
8] employed the Karlsruhe Atmospheric Mesoscale Model (KAMM) and WRF to compare the generalized wind climate for WAsP for South Africa. Results showed that the bias among the investigated regions was about 10% by the KANN-based method, while it was about 5% by the WRF-based method. The WRF model is better suited in the prediction of wind resources for the regions with complex topography with the expense of longer computational time. A case study for the wind farm in Ecuador was conducted by Meteodyn and WAsP [
9]. Underestimation was observed for by the comparison with real electricity production for both employed codes. The difference was about 8.7% for WAsP, and it was 7% for the CFD-based Meteodyn. Thus, after the sophisticated setup and longer calculation time, improvement of 1.7% on the evaluation of AEP was obtained. From the above review, it can be concluded that the software-WAsP has been employed for the analysis of wind resources for many years in several countries. Case studies were made in Europe and Asia, proving its credibility. Comparing with the computational resources demanded a CFD model, the WAsP is relatively simple and reliable results can be obtained except for the regions with complex terrain.
For the analyses of Taiwan, a simplified mathematical model was proposed. Chang et al. [
10] firstly evaluate the wind resources for Taiwan in 2003 by a two-stage procedure. By comparing three wind turbine characteristics (available factor, capacity factor and turbine efficiency), they pointed out four locations with good wind resources, i.e., Wuchi, Lanyu, Tungchitao, and Hengchun. Later, the wind atlas of western and coastal region of Taiwan was made by WAsP with only one set of weather data. Fang [
11] assessed the wind energy along the west coast line of Taiwan and Penghu Archipelago using WAsP. Averaged wind speed and power density with different height among the investigated locations were presented. The average wind speed in the area of Penghu archipelago is above 10 m/s and power density is above 1400 W/m
2. A case study was conducted in the Changhua offshore wind farm by using 180 wind turbines with capacity of 3 MW. The resulting AEP was about 11.3 GWh. With the feed-in tariff policy for the offshore wind farm, the expected income was about 60 million NTD. For regions far away from the observation side (north and south end of Taiwan), the reliability of the calculated results might be problematic.
Since the wind farm evaluated for a case of inland of Taiwan area has not yet been conducted with high spatial precision and local weather data, the purpose of the present study is to conduct a case study of micro-siting for the campus of the Institute of Nuclear Energy Research (INER). Selected commercialized wind turbines were virtually installed on the selected locations. The corresponding AEP of the deployed wind farm within the campus of INER was evaluated. The appropriateness of the deployment of wind farm is discussed comprehensively. Suggestions are proposed based on the calculated results. The grid connected wind farm is developed accordingly.
2. Numerical Model
In this study, the commercial software WAsP is employed to evaluate the wind resource and develop the wind atlas as a case study for the campus of INER. This software was proposed firstly by Wind Energy and Atmospheric Physics Department at Risø National Laboratory in 1987. It is designed to process wind data and create a wind atlas. The climate estimation, prediction of wind power and wind turbine siting can also be made by this software. With implementation in more than 100 countries around the world for decades, WAsP has become the generally accepted tool for the assessment of wind sources and turbine siting.
From the literature review, the error of the calculation by WAsP is lower than 10%. Nevertheless, reliable input data should be provided to ensure results with good quality. Weather data and terrain map are the most important information for the evaluation by WAsP. The hourly averaged wind speed and corresponding wind direction collected by the observation site are transformed into statistical data by WAsP Climate Analyst (WACA) as the observed wind climate file. The frequencies of occurrence of a specific wind in the designated sectors (wind rose) and wind speed bins are included as the ASCII text file. The terrain information is edited by the WAsP Map Editor to generate the digital map file for further calculation.
By importing time sequential wind speed and direction, the statistical wind data can be obtained and expressed by the Weibull probability density distribution function in Equation (1)
where
p is the probability of wind speed
V,
A is the scale parameter, and
k is the shape parameter. The power production is then evaluated by the so-called emergent distribution in WAsP 8 with better accuracy. In WAsP 7, the combined Weibull distribution was used. In most cases, the difference is not significant. However, for the case with large sector-wise variation, difference of about 5% might be encountered. In the present study, the calculation is conducted by WAsP 11 with emergent distribution.
In the proposed model, the local weather data are incorporated with digital map to evaluate the wind resources. The Shuttle Radar Terrain Mission (SRTM) 90 m Digital Elevation Data is employed in this study, which is obtained from the Consortium of International Agricultural Research Center-the Consortium of Spatial Information (CGIAR-CSI). The SRTM files are made by NASA and they have some void problem. These no-data voids are processed by CGIAR-CSI from the original SRTM DEM. The comparison is made for the digital elevation model to ensure the quality [
12]. The satellite image from Google Earth is employed to draw the roughness of analyzed terrain. For the comparison and validation, the public wind atlas from the website of Thousand Wind Turbines Project is introduced [
13]. The evaluation of wind resources is conducted by the open sources code-WRF with resolution of 2 km × 2 km. In this study, the micro-scale-based WAsP model is employed with better grid resolution to develop the wind atlas for the campus of INER.
Total energy produced by the designated wind turbine system during a one-year period is generally referred to as the AEP with unit of MWh (for small scale wind turbine system) or GWh (for large-scale wind turbine system). In the calculation of AEP, it is assumed that the availability of the wind turbine system is 100%, and the losses due to the mechanical and electrical transmission are not considered. The power produced by the employed wind turbine depends on the speed of coming wind. The wind speed at the hub height is usually used as a reference value to describe the performance of a wind turbine. The power curve is defined as the power generated within the operable range of hub height wind speed (from cut-in to cut-out). The generated power increases with the wind speed as the wind speed is larger than the cut-in value of the wind turbine system. The maximum value of power is also called the rated-power of the wind turbine system. For the wind speed larger than the cut-out value, the turbine will be stopped to prevent the damage on the turbine system.
The ratio of the thrust force upon the wind turbine system and the dynamic force of air is generally referred to as the thrust coefficient. This dimensionless coefficient indicates how much the wind turbine system affects the fluid flow as indicated in Equation (2).
where
Ct is the thrust coefficient,
Ft is the thrust force,
ρ is the density of air,
D0 is the diameter of the rotor,
U0 is the speed of coming wind.
2.1. Employed Wind Turbine Systems
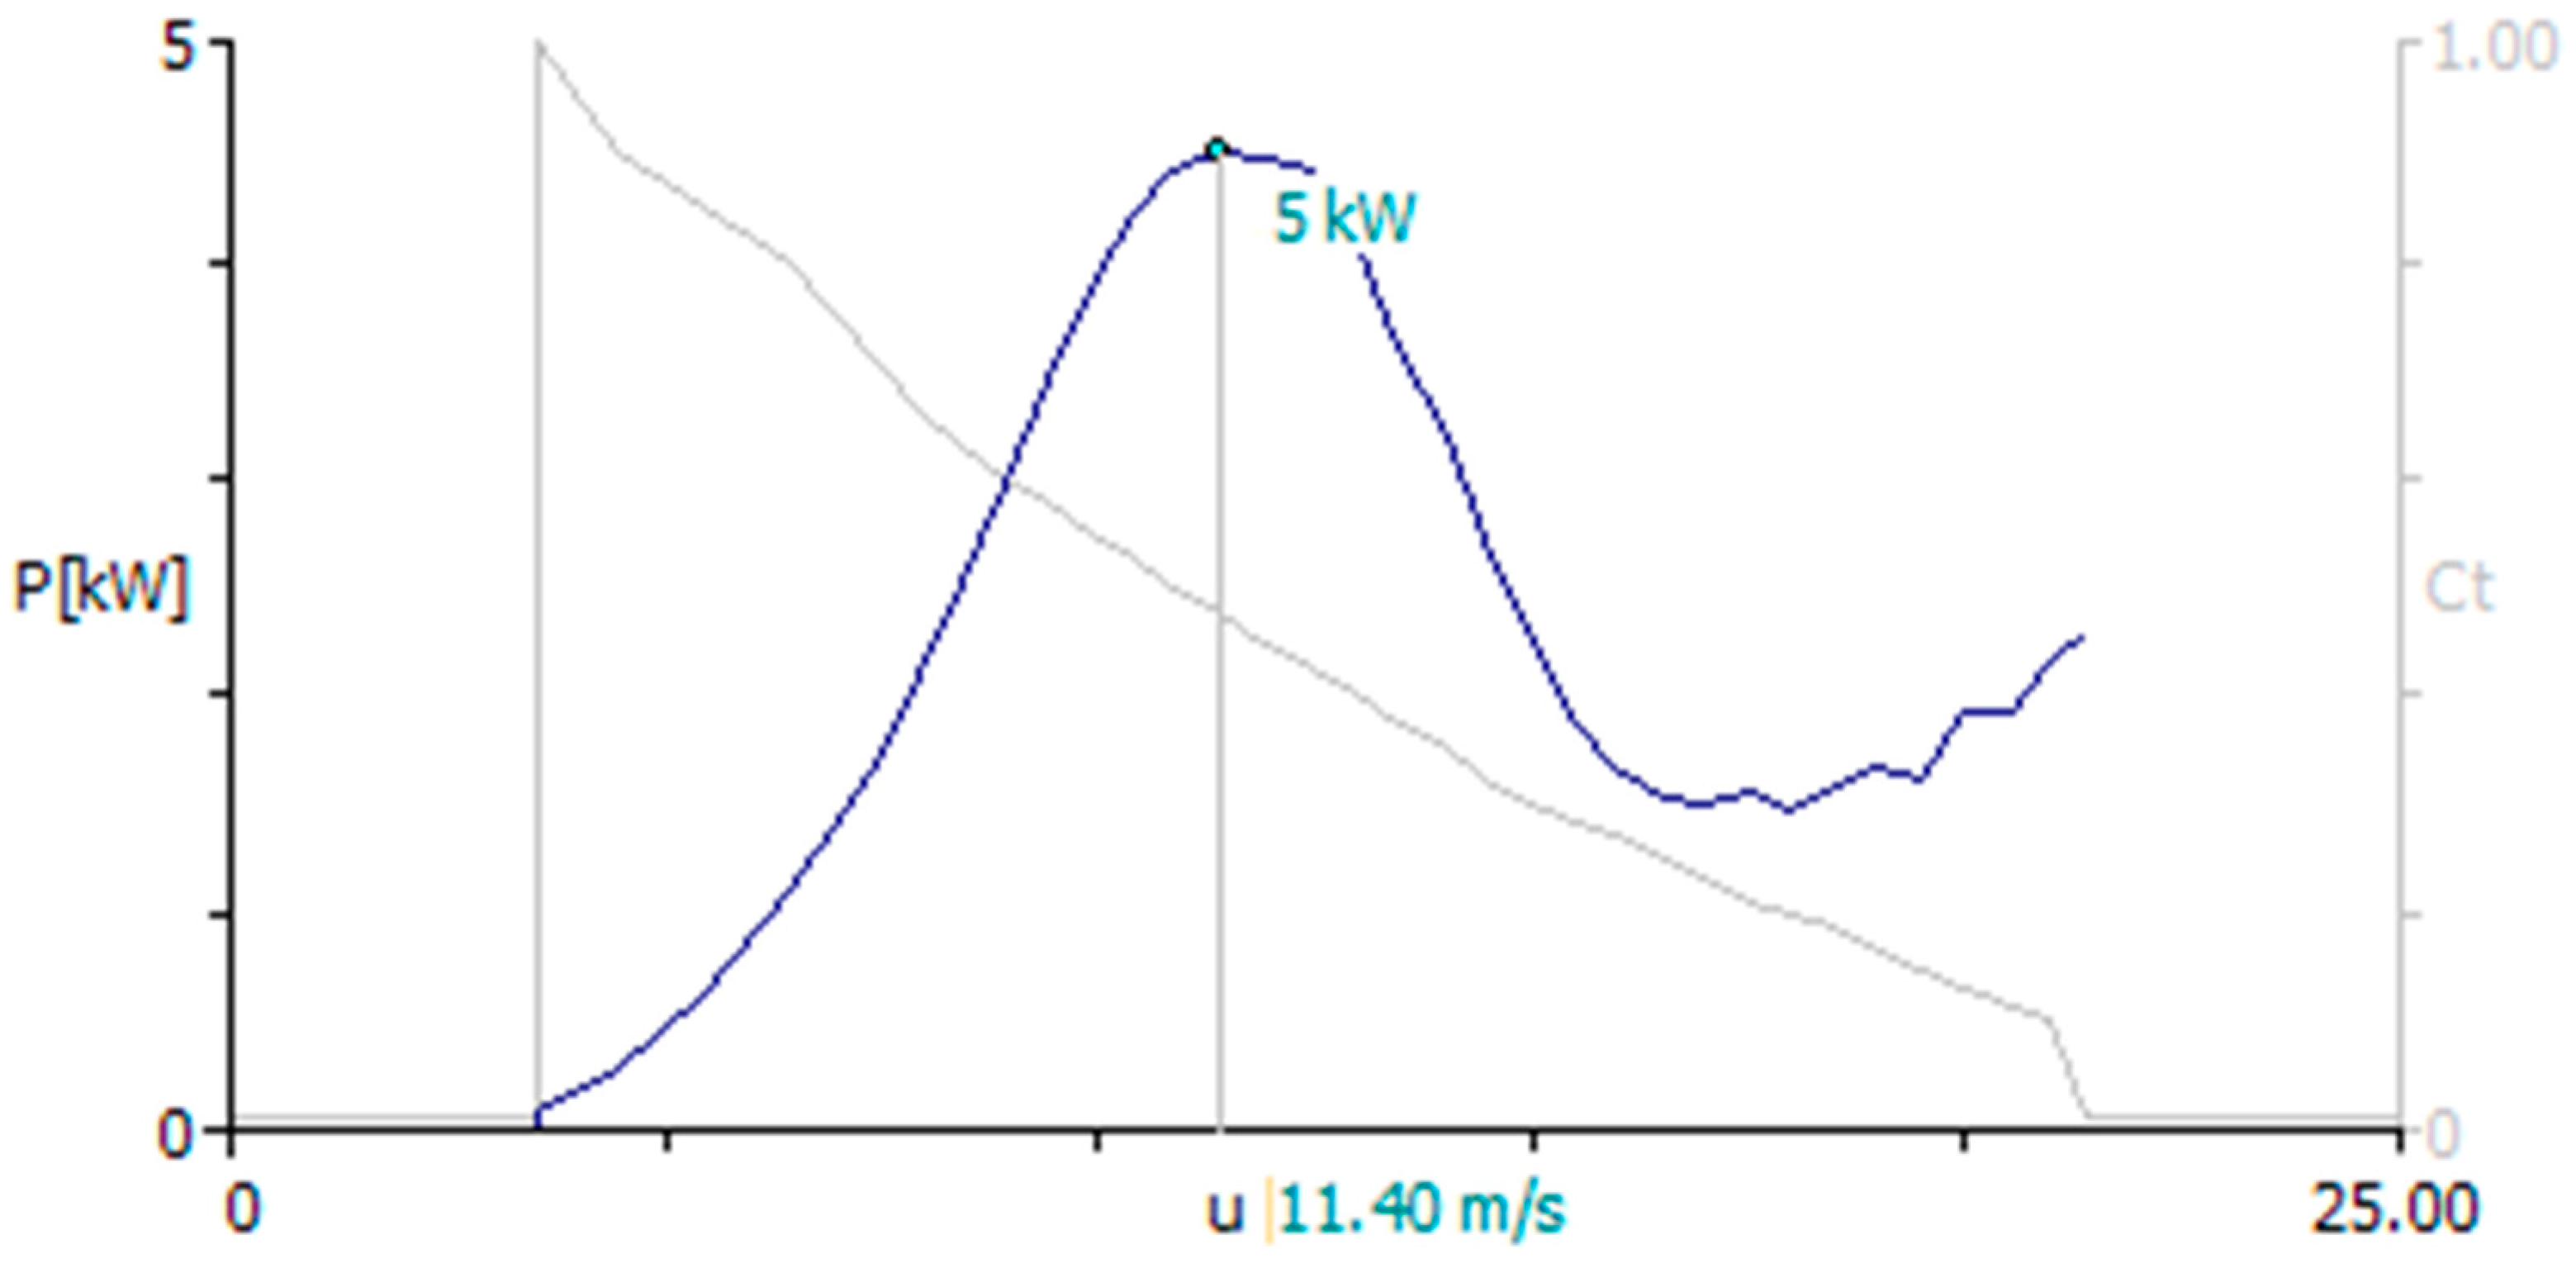
The wind turbine systems of 1 kW, 5 kW, 25 kW, 30 kW and 150 kW are included in the present study. The power curves for the employed commercial wind turbine (1 kW and 5 kW) are described in
Figure 1 and
Figure 2. The data for the thrust coefficient can be measured via the tower bending moment or estimated by a rotor simulation program. With the given data of the thrust coefficient, the wake loss of the investigated wind farm can be estimated. By including the wake loss of the modeled wind farm, the calculated AEP will be reasonably reduced. In the present study, these two characteristic curves (power curve and thrust coefficient) are built by the WAsP-Turbine editor. The detail specification of 1 kW and 5 kW wind turbine are listed in
Table 1.
The INER-developed wind turbine system of INER 25 kW (
Figure 3) is also included in the present study (
Figure 3). The power curves with different pitch angle are compared in
Figure 4. The rated power is 25 kW at the wind speed of 12 m/s. Other specifications are listed in
Table 1.
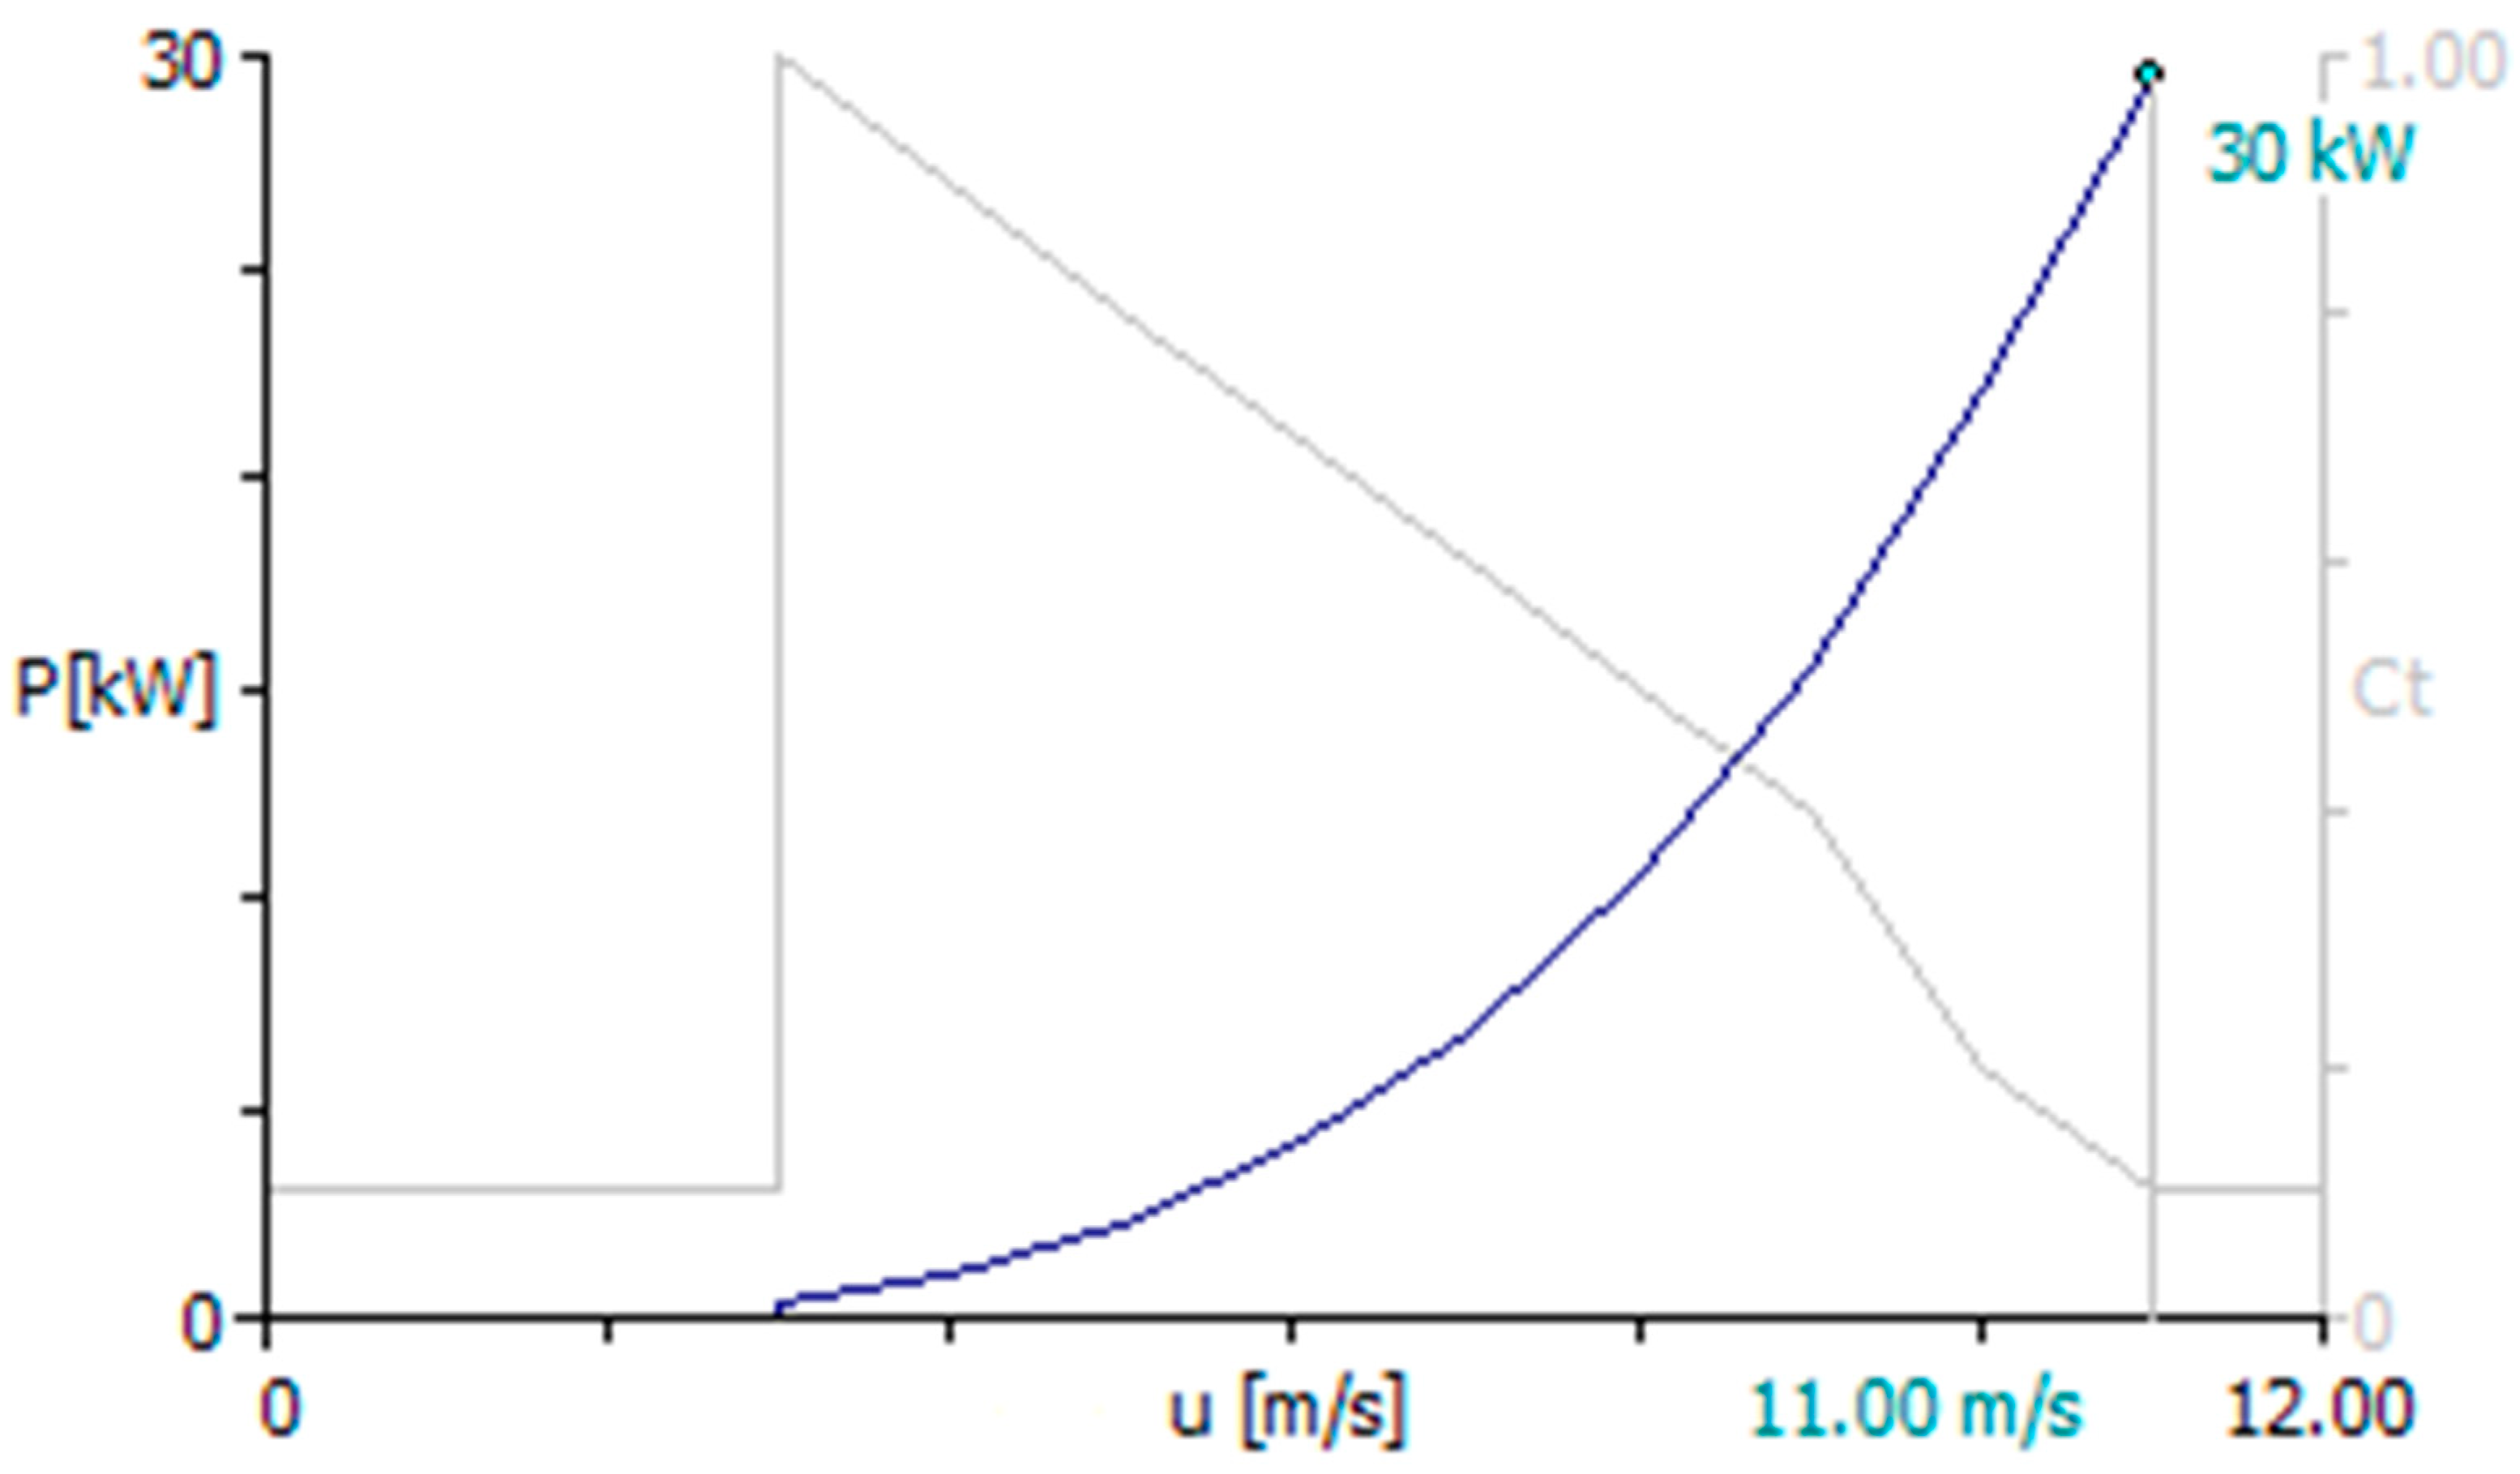
Besides the previously mentioned wind turbine systems, another commercial 30 kW wind turbine from the UK is also included in the present study as the comparison with that developed by indigenous company. Its power curve is presented in
Figure 5. The specification of the employed 30 kW wind turbine is listed in
Table 1.
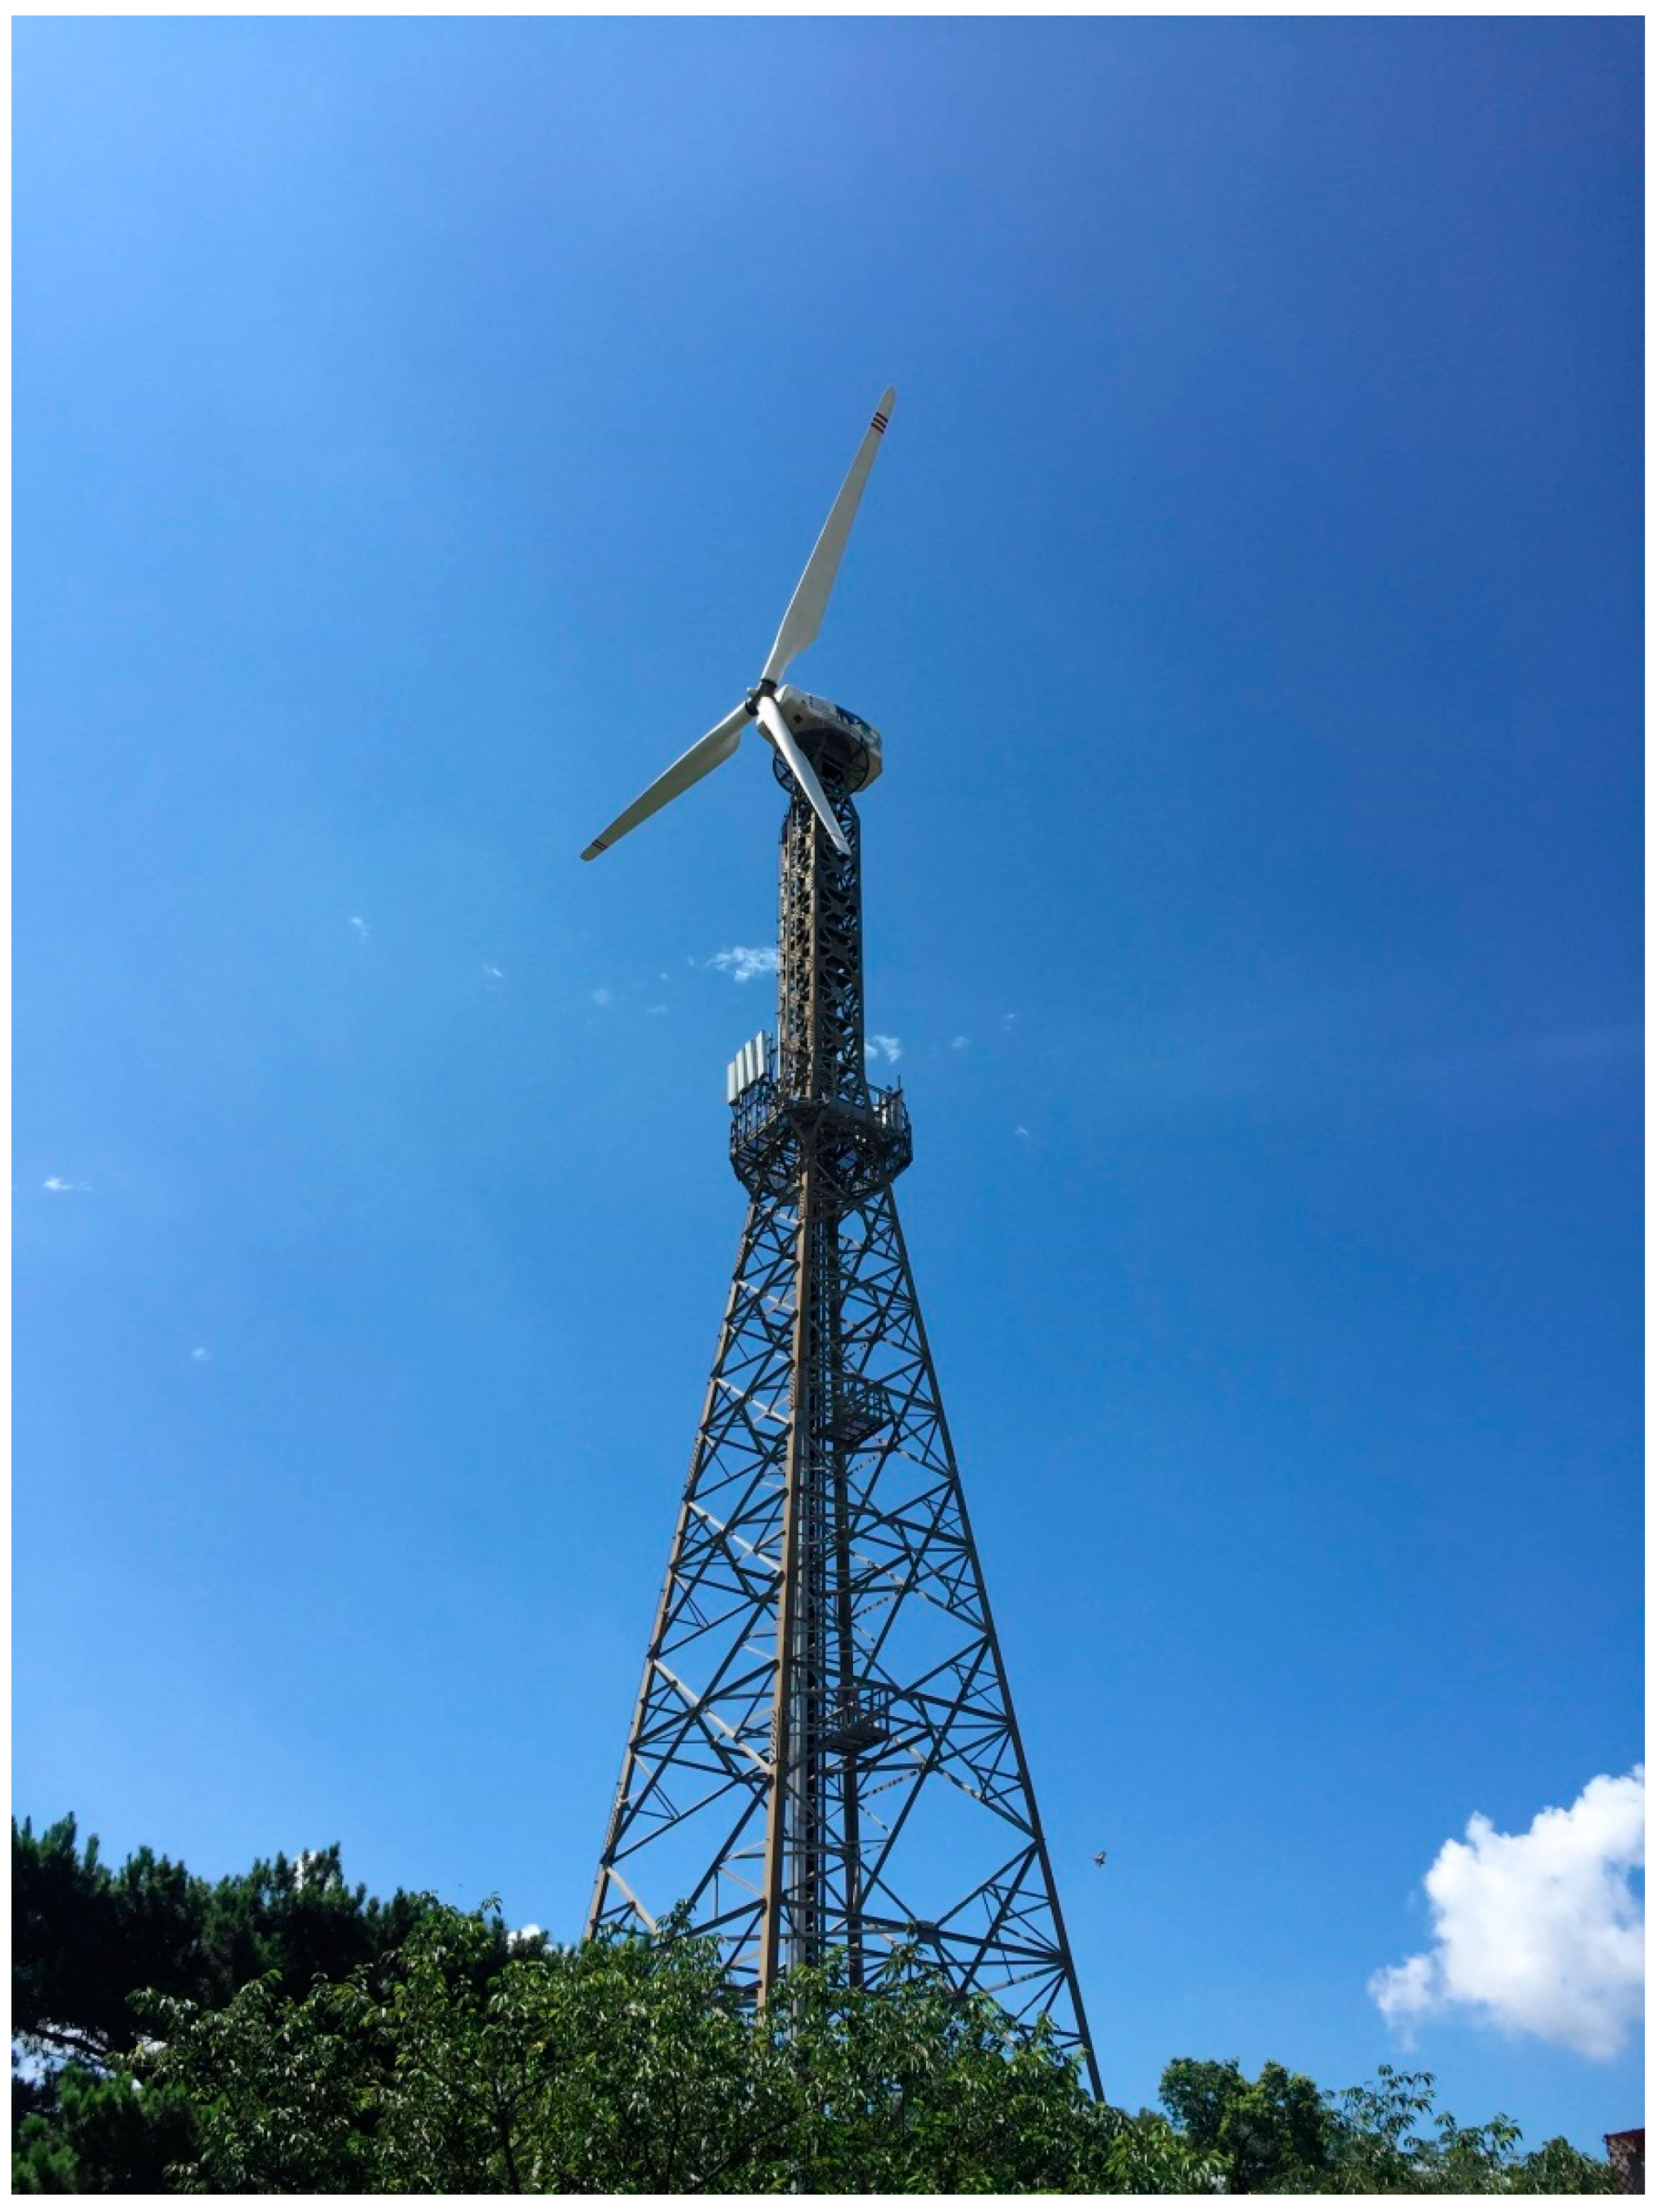
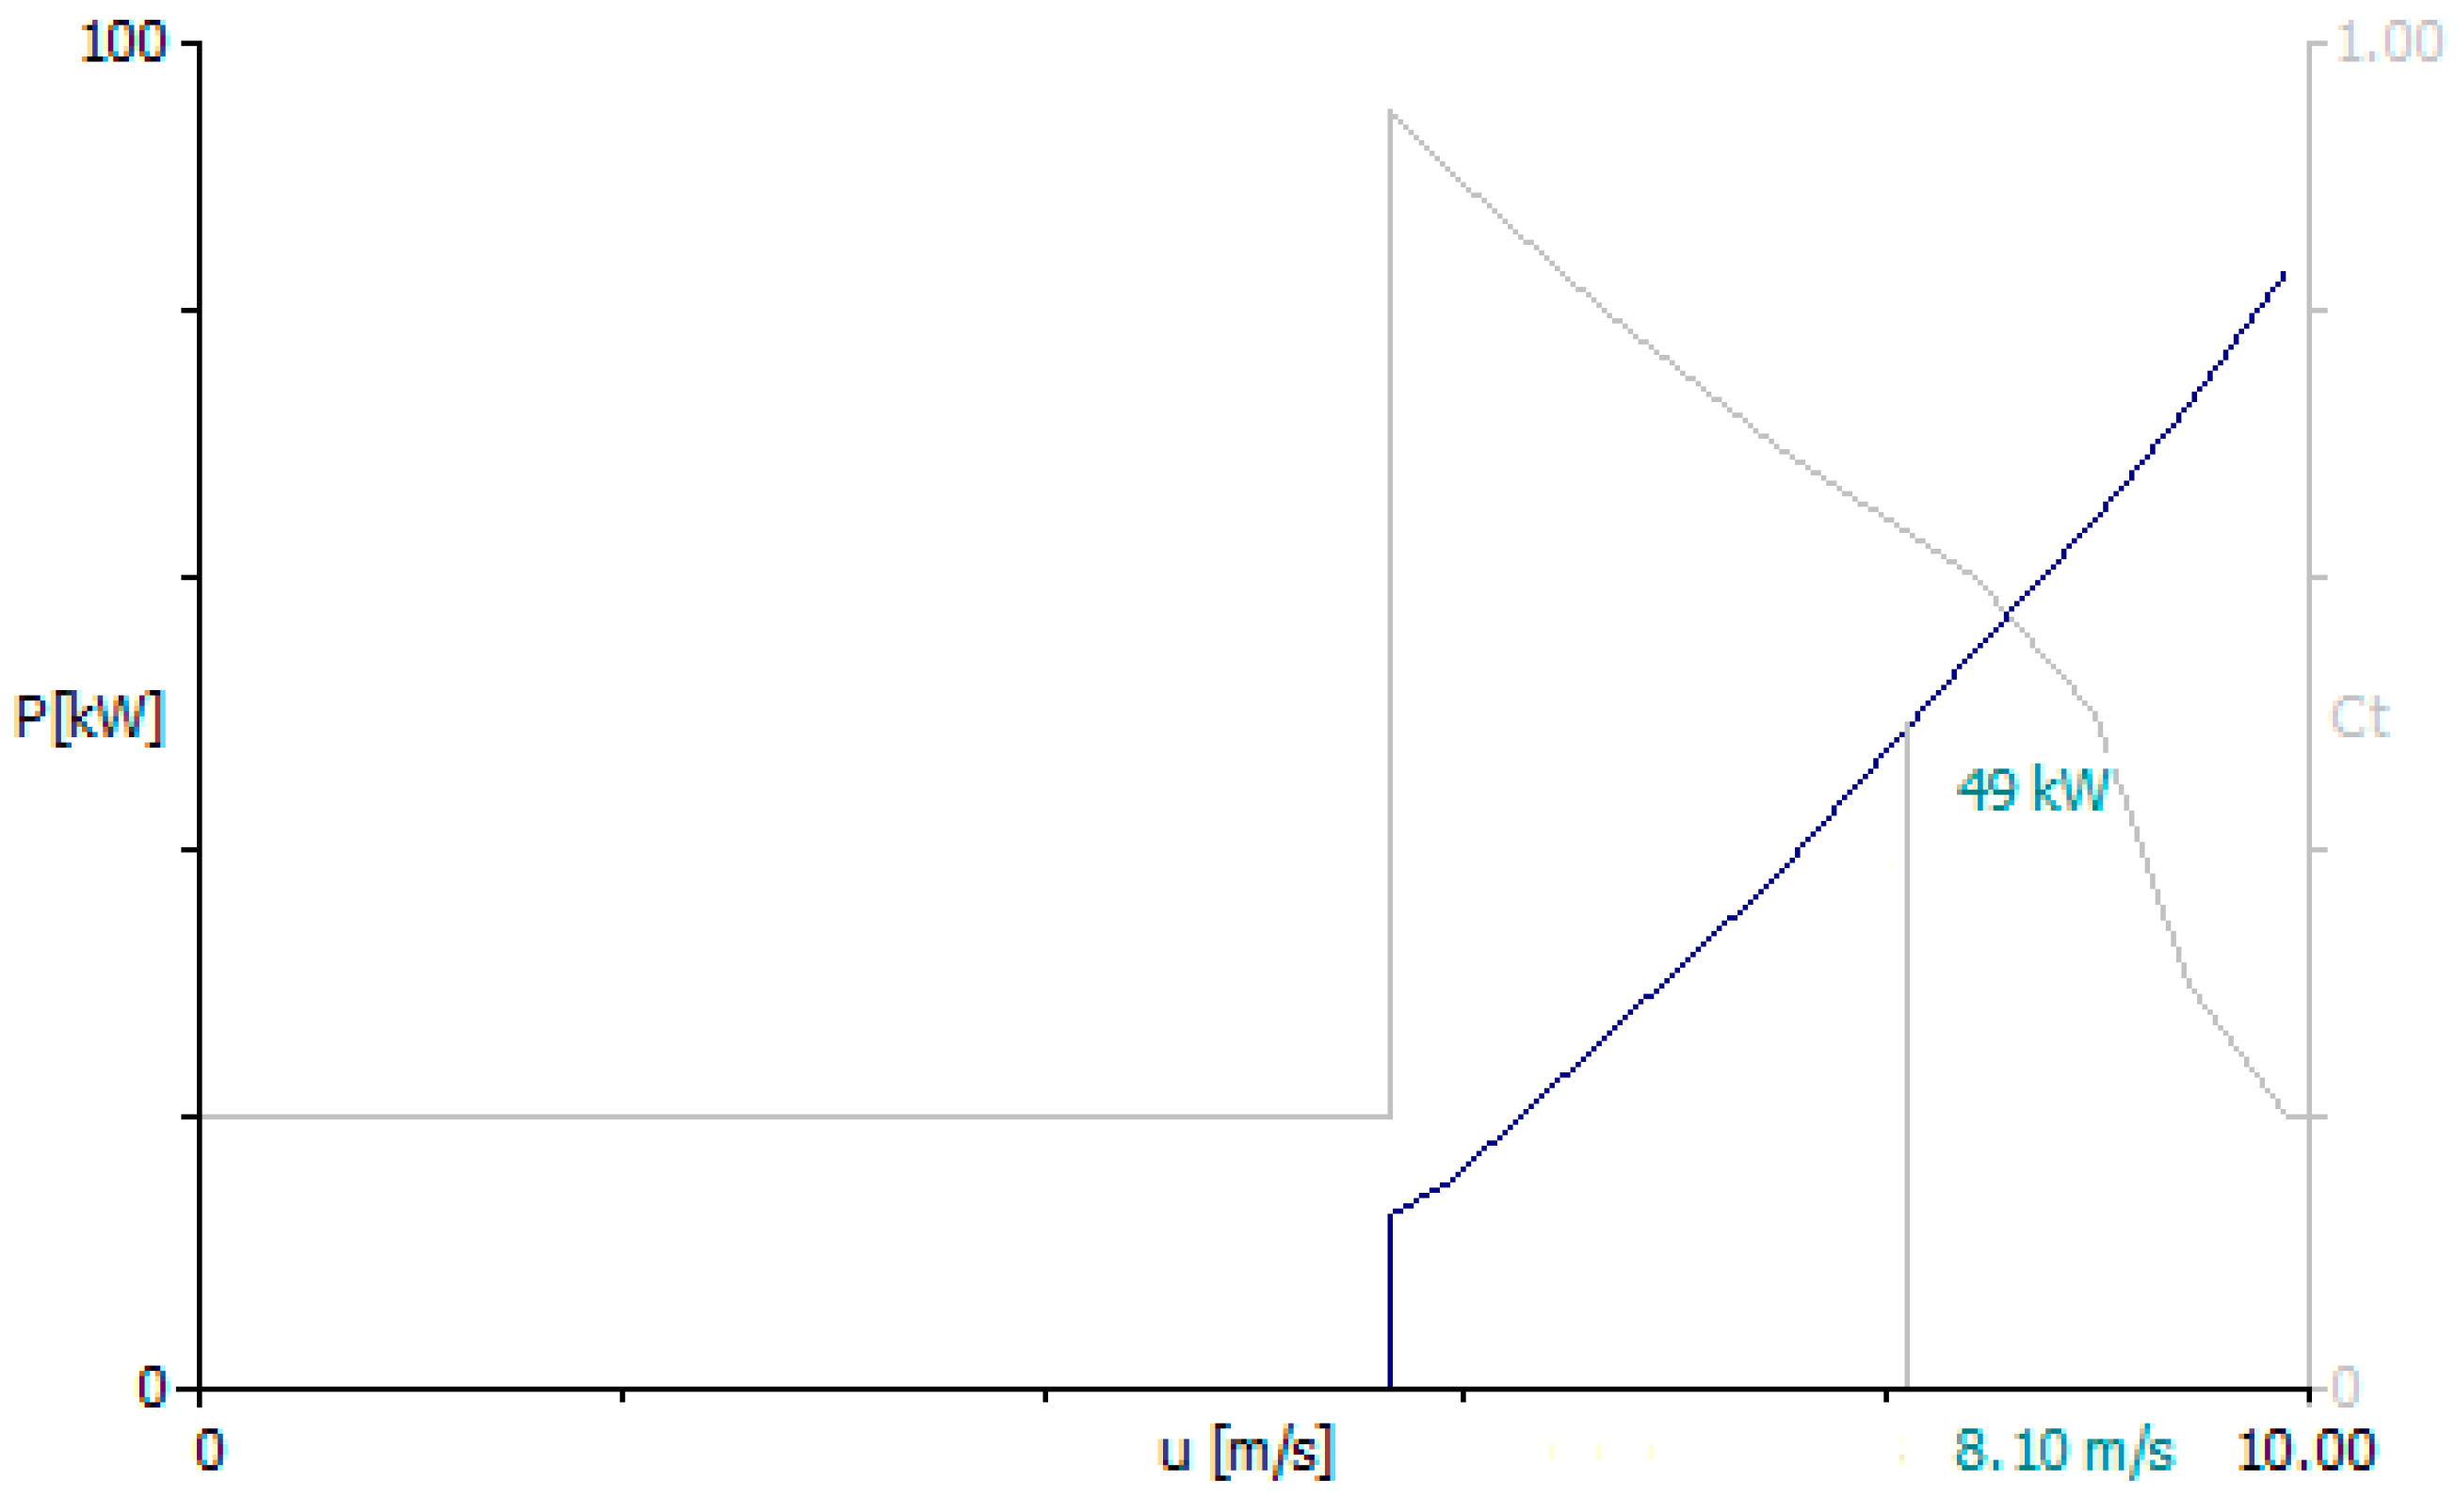
Finally, the INER-developed 150 kW wind turbine (
Figure 6) is also included in the present study. The characteristic curves for the existed turbine INER 150 II for the calculation are presented in
Figure 7, and the specification of the 150 kW wind turbine is listed in
Table 1.
2.2. Employed Weather Data
Two sets of weather data are available and employed in the present study, namely, Hall-039 and Hall-048. The location of Hall-039 is relatively close to the 25 kW wind turbine, while Hall-048 is inside the designated wind farm and next to 150 kW wind turbine. However, the completeness of Hall-039 (96%) is better than that of Hall-048 (62%). The reduction of completeness for both sites is due to the regular power-off in the campus of INER with more locally switch-off experiment for the site of Hall-048 and nearby wind turbines.
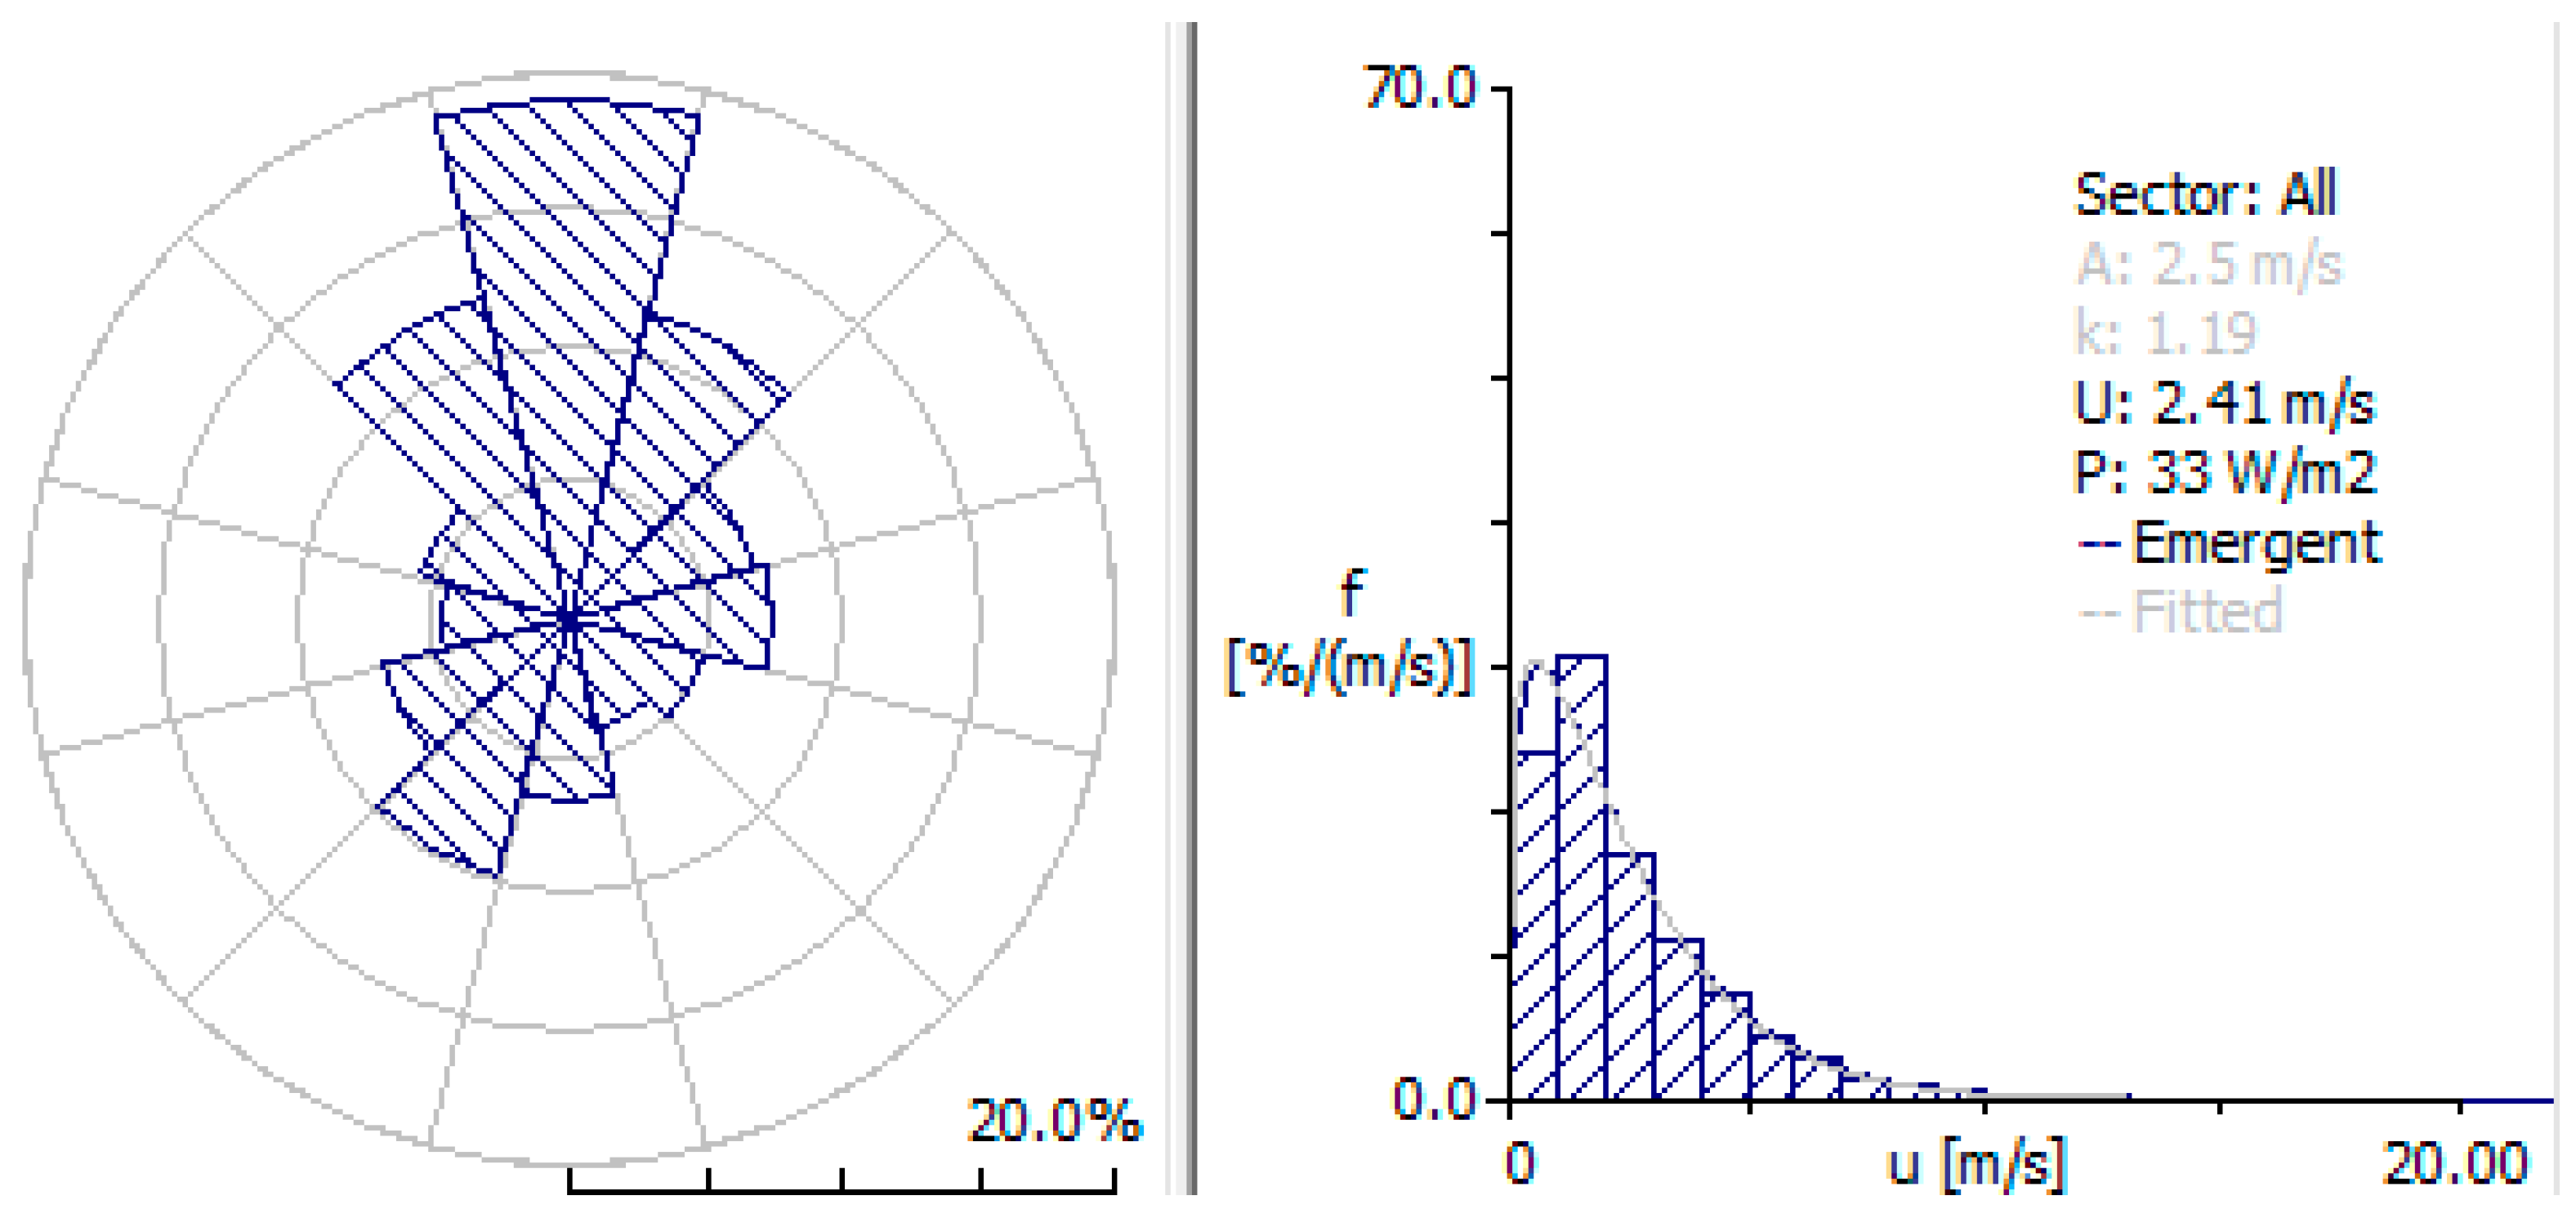
After the statistical treatment of the collected time series weather data, the wind roses are presented in
Figure 8 and
Figure 9. For the distribution, the measured year-averaged wind speed for the site of Hall-048 (with height of 10 m) is 2.4 m/s, mainly from the direction of north. The year-averaged wind speed for the site of Hall-039 (with height of 15 m) is about 3.04 m/s, mainly from the north-east direction.
From the macro-aspect, these two sites are very close to each other. Thus, the deviation on the weather data might mainly be because of the insufficient height for the site of Hall-048 and surrounding trees affecting the flow fiend and wind speed. It should be noted that the data of Hall-039 are more complete with longer distance, while Hall-048 is inside the investigated wind farm with less data. In the present study, both sets of weather data will be employed to evaluate the possible range of AEP for the investigated wind farm.
3. Results
In this study, a methodology is proposed for the evaluation of the grid-connected wind farm in the campus of INER. For the evaluation, the following steps should be conducted accordingly:
Develop the evaluation model including the effect of buildings
Wind farm deployment
Evaluation of AEP according to the planned deployment
Build wind farm (in INER campus for the present study)
Long term operation (at least one year)
Comparison of AEP (calculated value vs. real wind farm)
Parameters correction and model improvement
In this study, the first four steps are conducted. The rest of the steps are expected to be competed in the mid of 2021.
3.1. Micro-Sitting in INER Including Whole Campus
In this section, the model of the micro-siting for the campus of INER is extended to the full campus as indicated in
Figure 10. The entire campus of INER is classified into several small blocks for the calculation. Regions with a large number of trees are modeled as porous material by setting the value of porosity as 0.5 as indicated in
Figure 10 with a yellow rectangle. For the region at the upper right regions, some buildings outside the range of INER are also included in the proposed model under the consideration of completeness. The coordinate system is built with the original point set in the bottom left corner. The faraway buildings and lower trees are not considered since their impact on the results of power production would be insignificant.
In
Figure 11, the layout of the modeled buildings is indicated. Buildings are built as the black rectangles with zero porosity, and trees are built with blue rectangles with porosity of 0.5 as suggested from the User Menu of WAsP 11. The locations of the 25 and 150 kW horizontal axis wind turbine (HAWT) are indicated as the originally existing system. For the newly installed wind turbine, the 1 kW, 5 kW and 30 kW HAWT systems are employed. Three new wind turbines are virtually installed near the wall of the INER campus next to the 150 kW wind turbine.
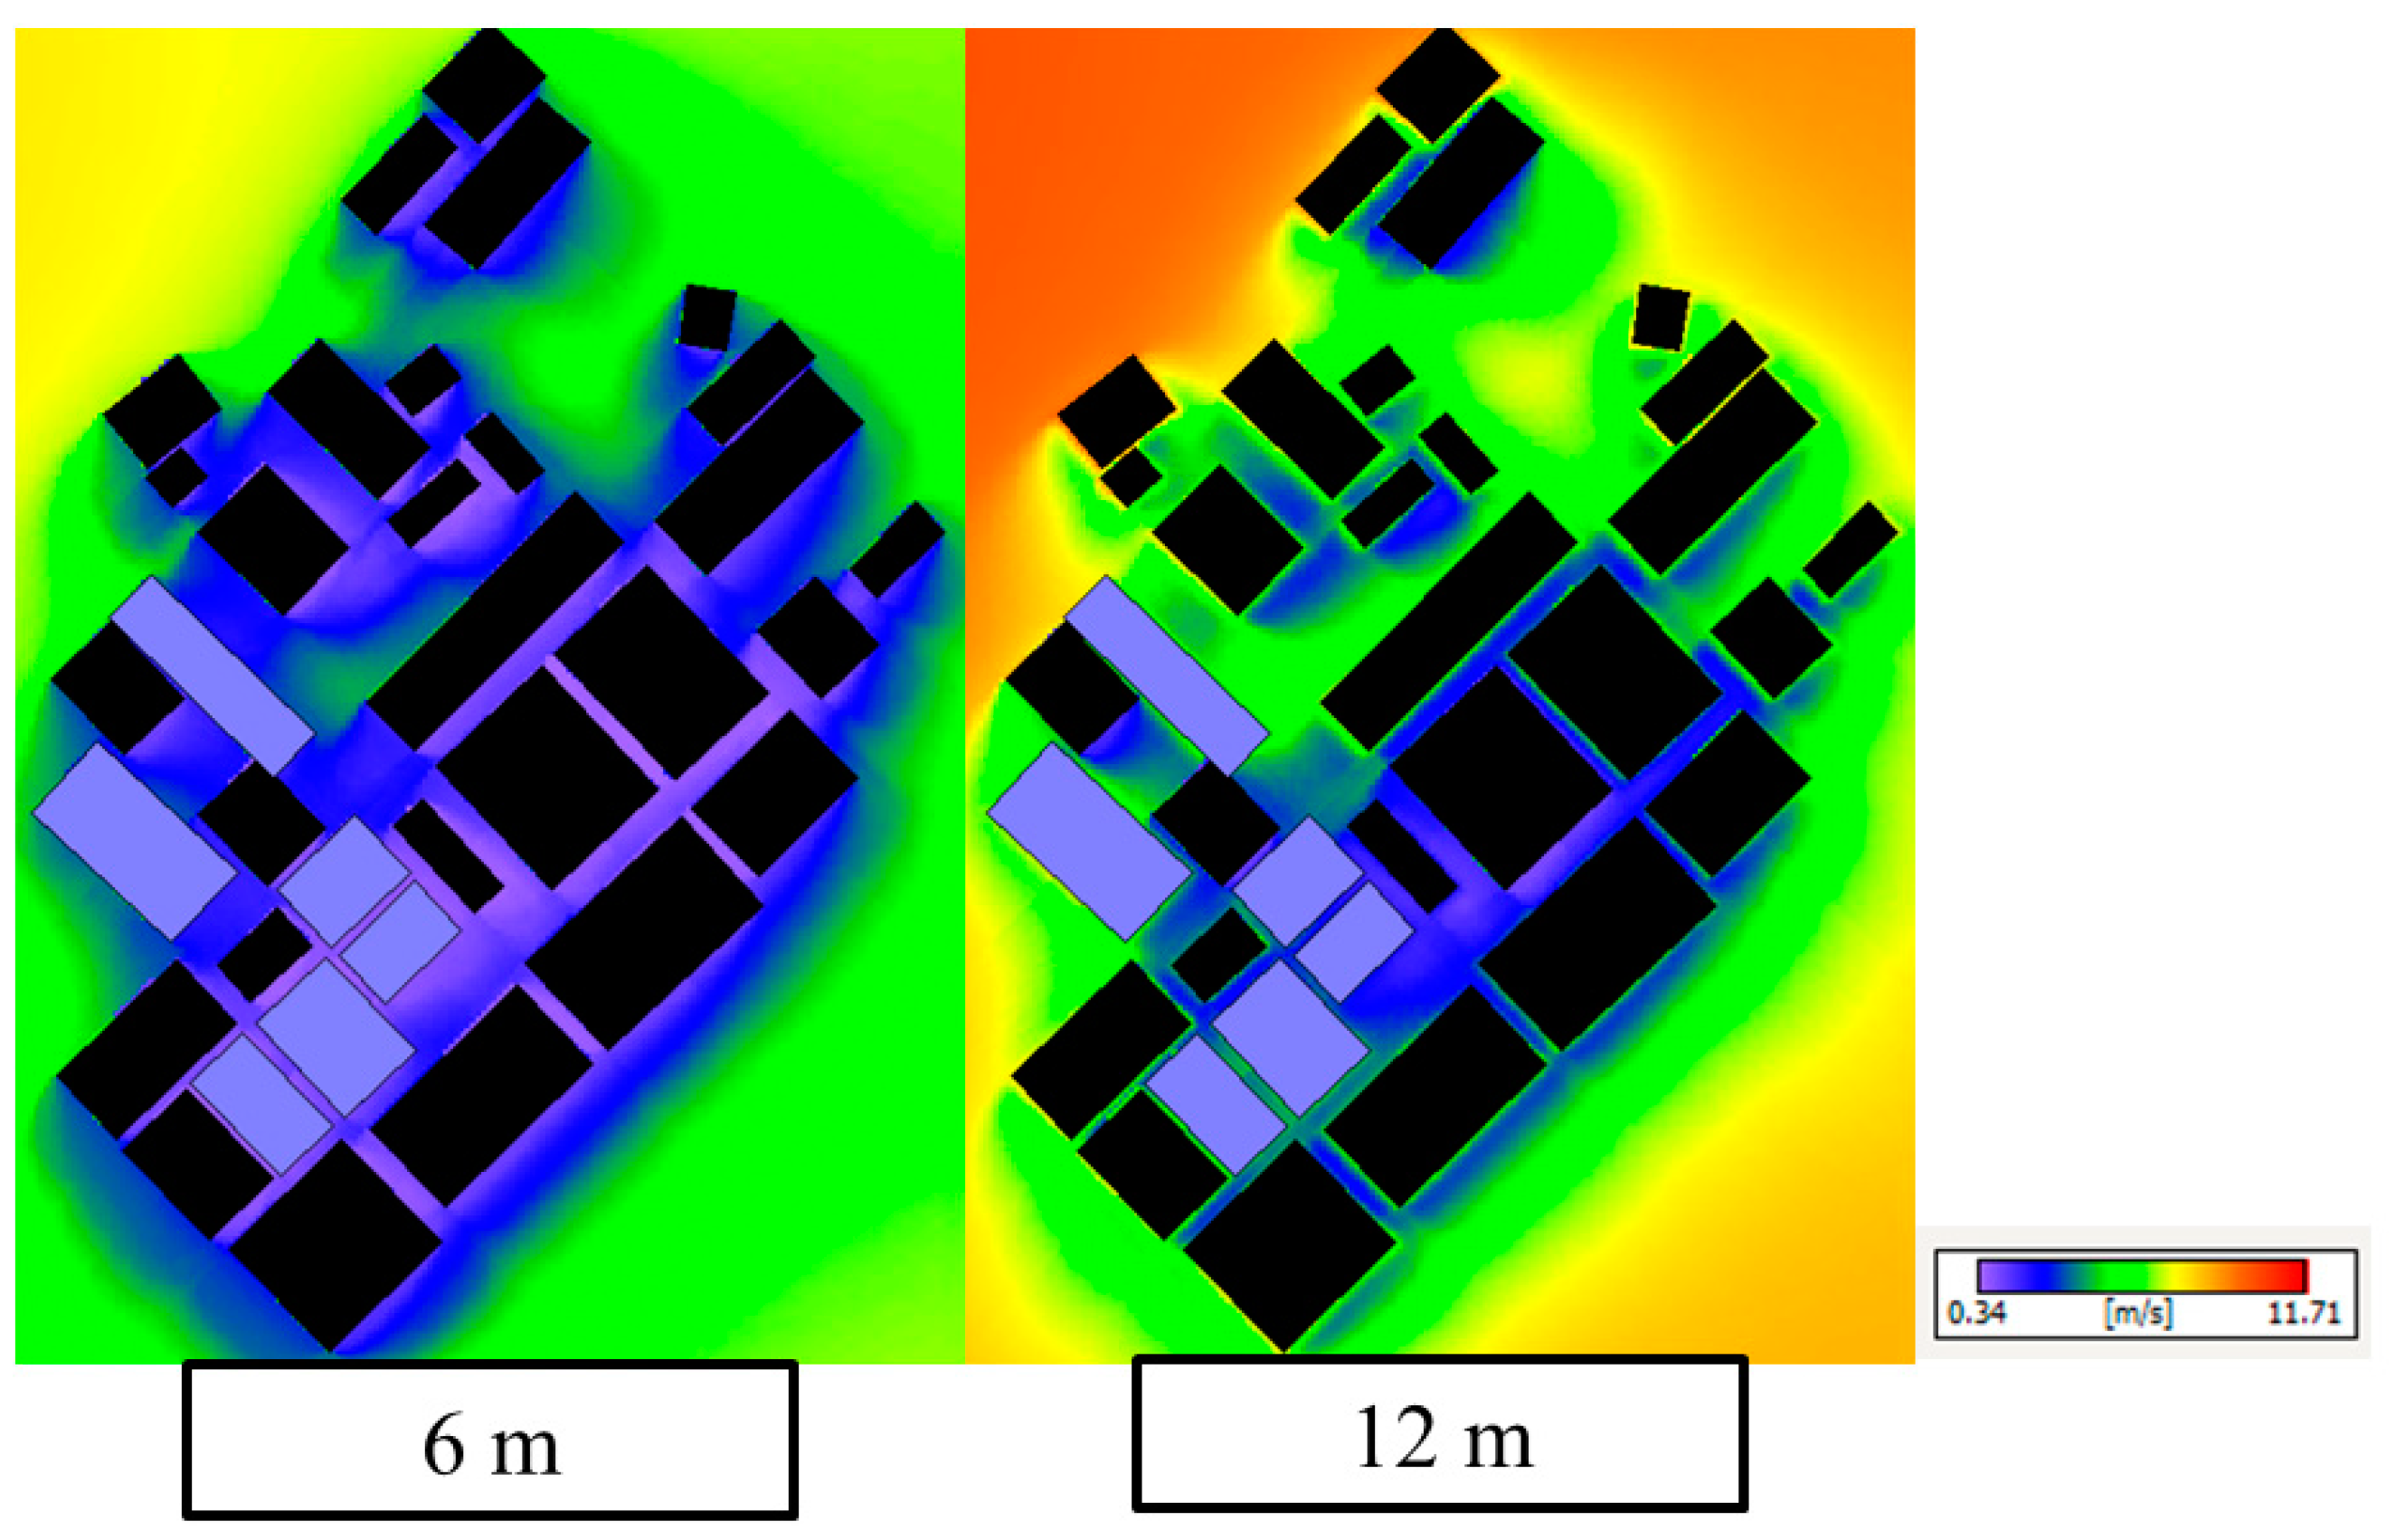
Calculated distributions of wind speed by the proposed WAsP model at the height of 6 m and 12 m are presented in
Figure 12. The distribution of wind speed at the height of 6 m is significantly influenced by the nearby buildings. It is expected that the AEP of a wind turbine with hub height below 10 m will significantly decrease. At the height of 12, the speed reduction zones are smaller since the heights of the majority buildings of INER are about 10 m. Therefore, the performance for planned wind turbine with hub height higher than 10 m should be better.
3.2. Effect of Obstacle on Wind Turbine—25 kW
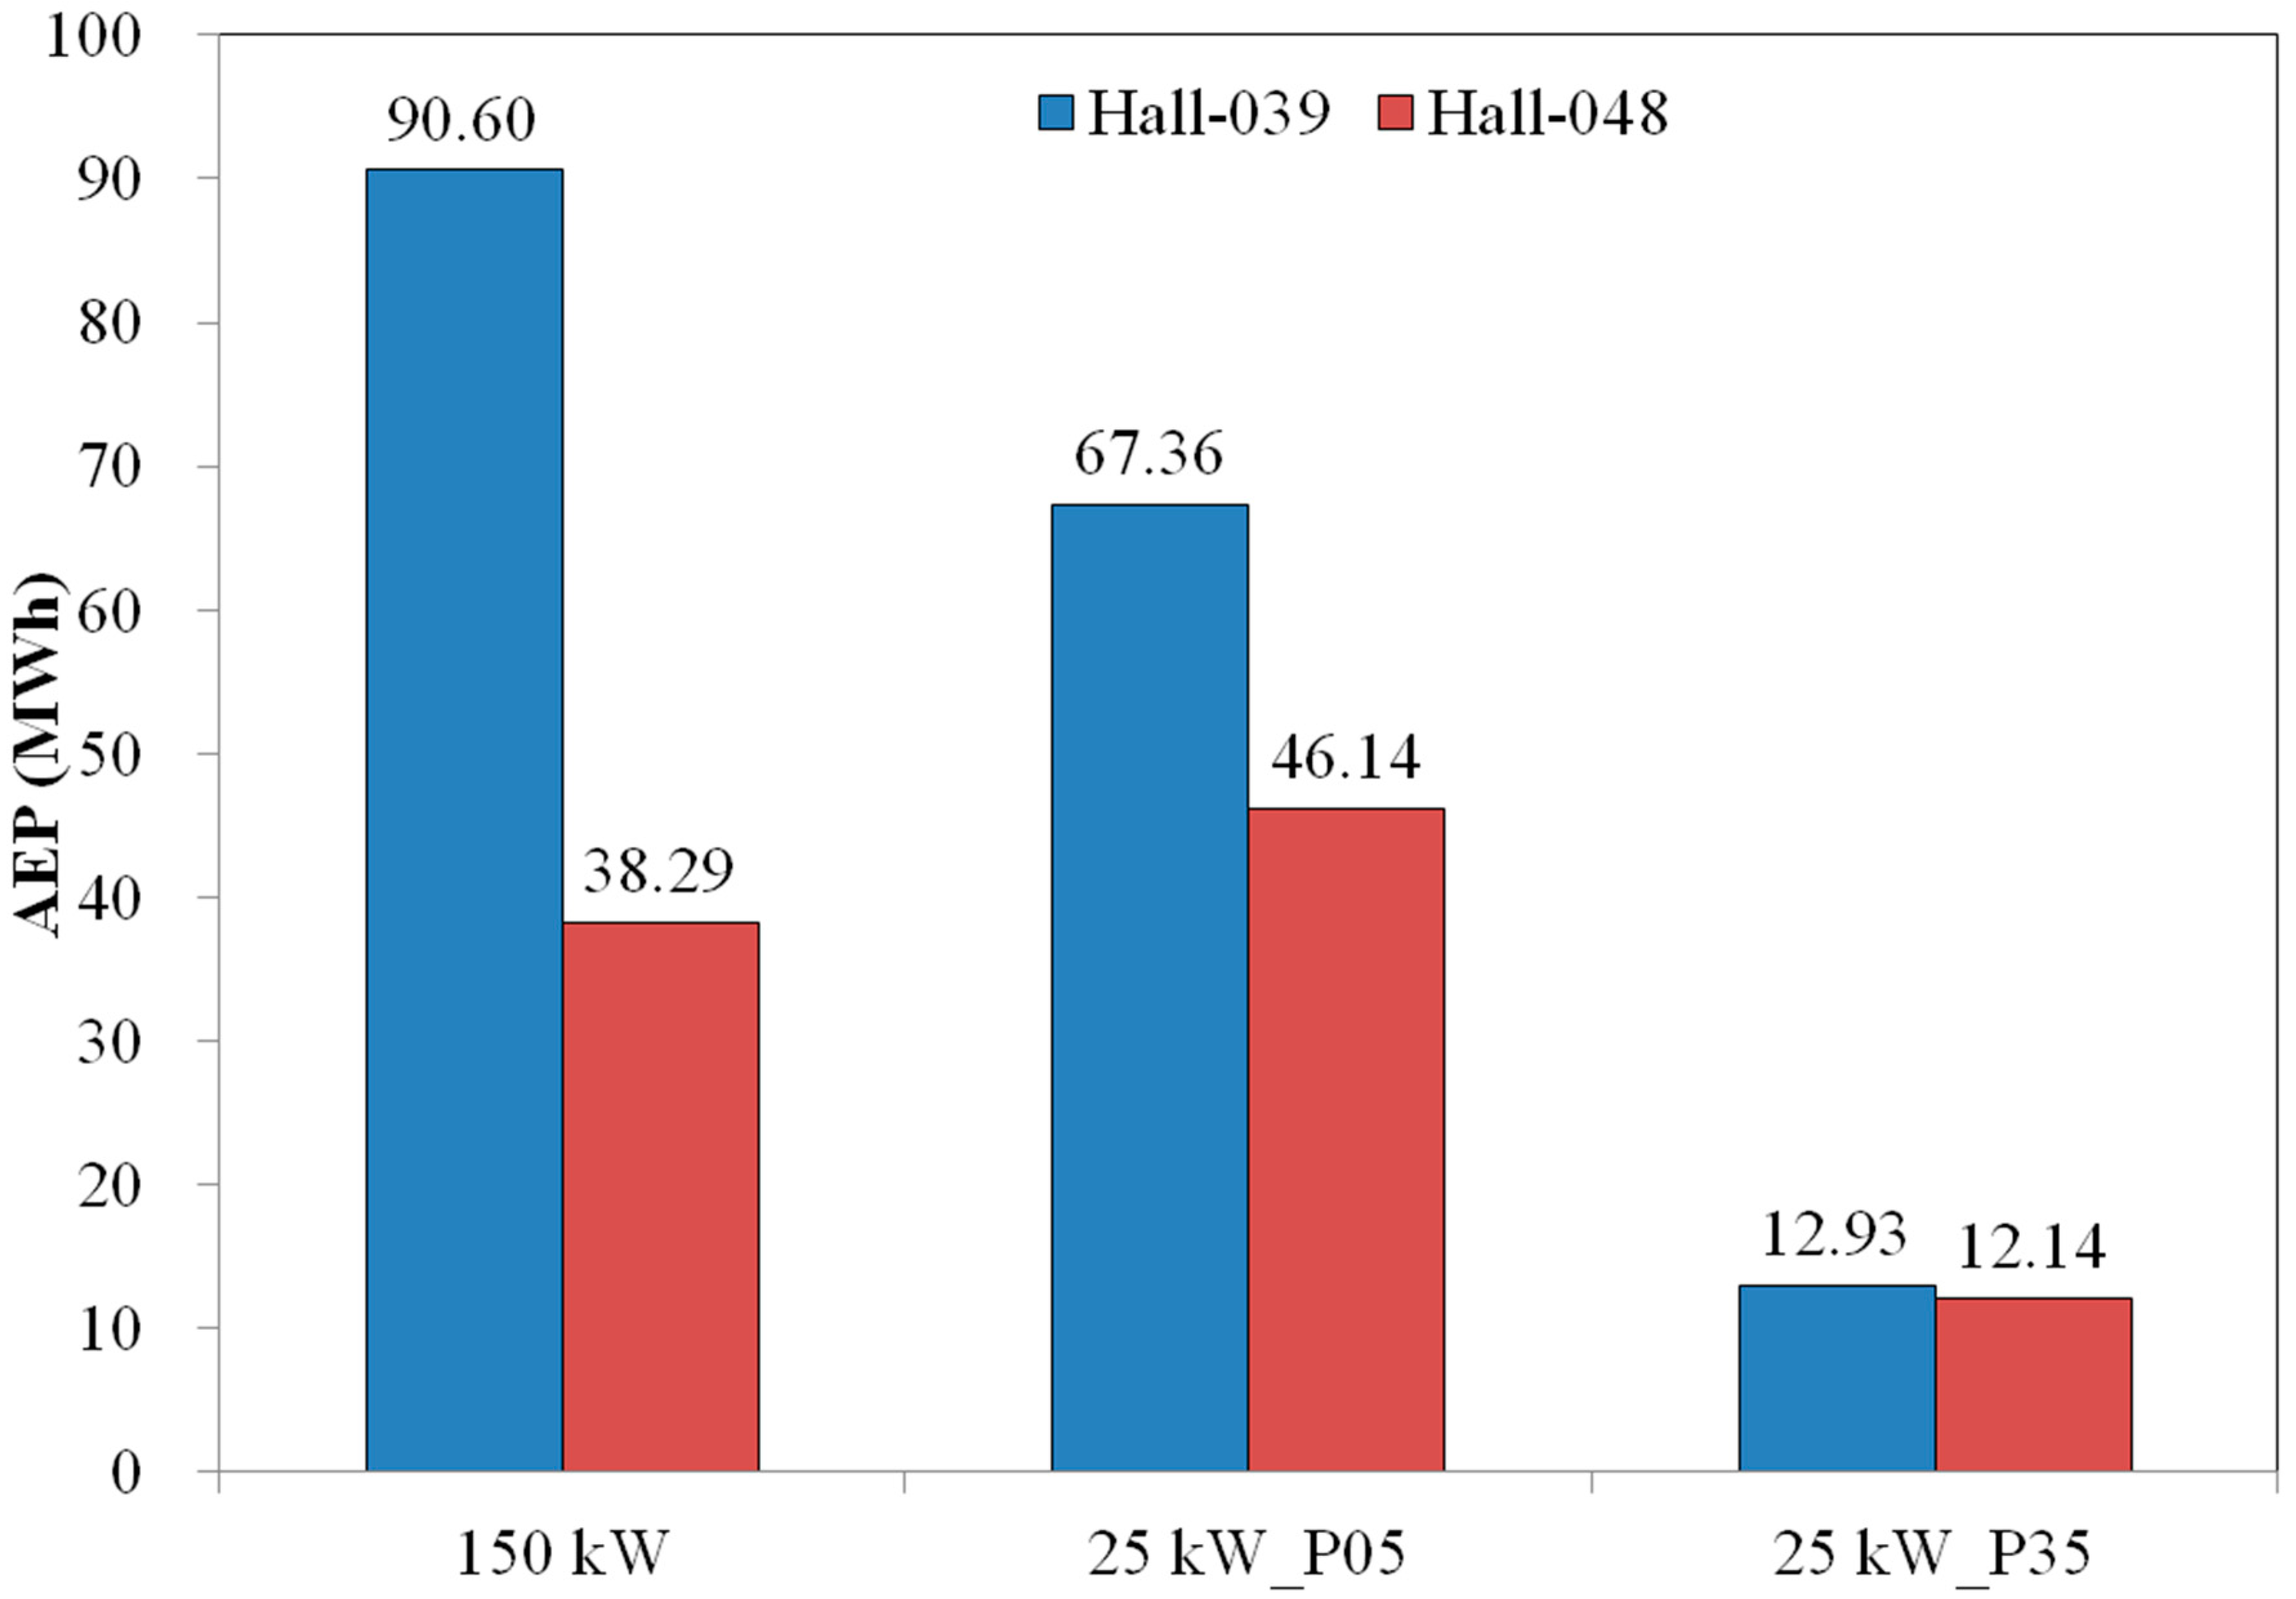
In this section, the performance of INER 25 kW wind turbine is investigated. The purpose of this discussion is to make sure that the WAsP model can properly evaluate the AEP for the wind turbine system overlapped with the obstacles for building. The hub height of INER 25 kW wind turbine is 25 m, and the height of the building is 10 m. It is expected that the AEP of wind turbine higher than surrounding building should not be affected. If the WAsP model cannot work properly, however, abnormal or even zero AEP would be encountered. Results are shown in
Figure 13. The AEP of INER-25 kW-P05 is 46 and 67 MWh depending on employed weather data, while it is only about 12 MWh for the condition of P35. Thus, the power production for the wind turbine installed within the range of building still can be qualitatively evaluated via the proposed model.
The performance of INER 25 kW is generally suppressed due to safety concerns. As indicated in
Figure 13, the AEP of the case of P05 is only 25% lower that of the 150 kW wind turbine, while it is significantly reduced to about 12 MWh with pitch angle of 35 degrees which is employed during most of the operation. For the effect of employed weather data, higher AEP can be obtained with the weather data of Hall-039, and a much lower value is observed when switching to that of Hall-048. For the reduction from Hall-039 to Hall-048, it is 57% for the 150 kW wind turbine, and it is 31% for 25 kW P05. The reduction is only 6% for 25 kW P35 since its performance is highly suppressed.
Considering the pros and cons of these two sets of weather data (better location for Hall-048 and higher completeness for Hall-039), both of these two data sets are employed for the evaluation of wind farm performance in the next section. Deviation is expected on the calculated AEP. Result will be employed to identify a possible range of generated AEP for the deployed wind farm for the site of INER campus.
3.3. Wind Farm Deployment
In the investigation of the effect of wind turbine on AEP of designated wind farm, different kind of wind turbines are virtually installed at the selected locations. The locations available for the installation of wind turbine in INER are limited due to the restriction of
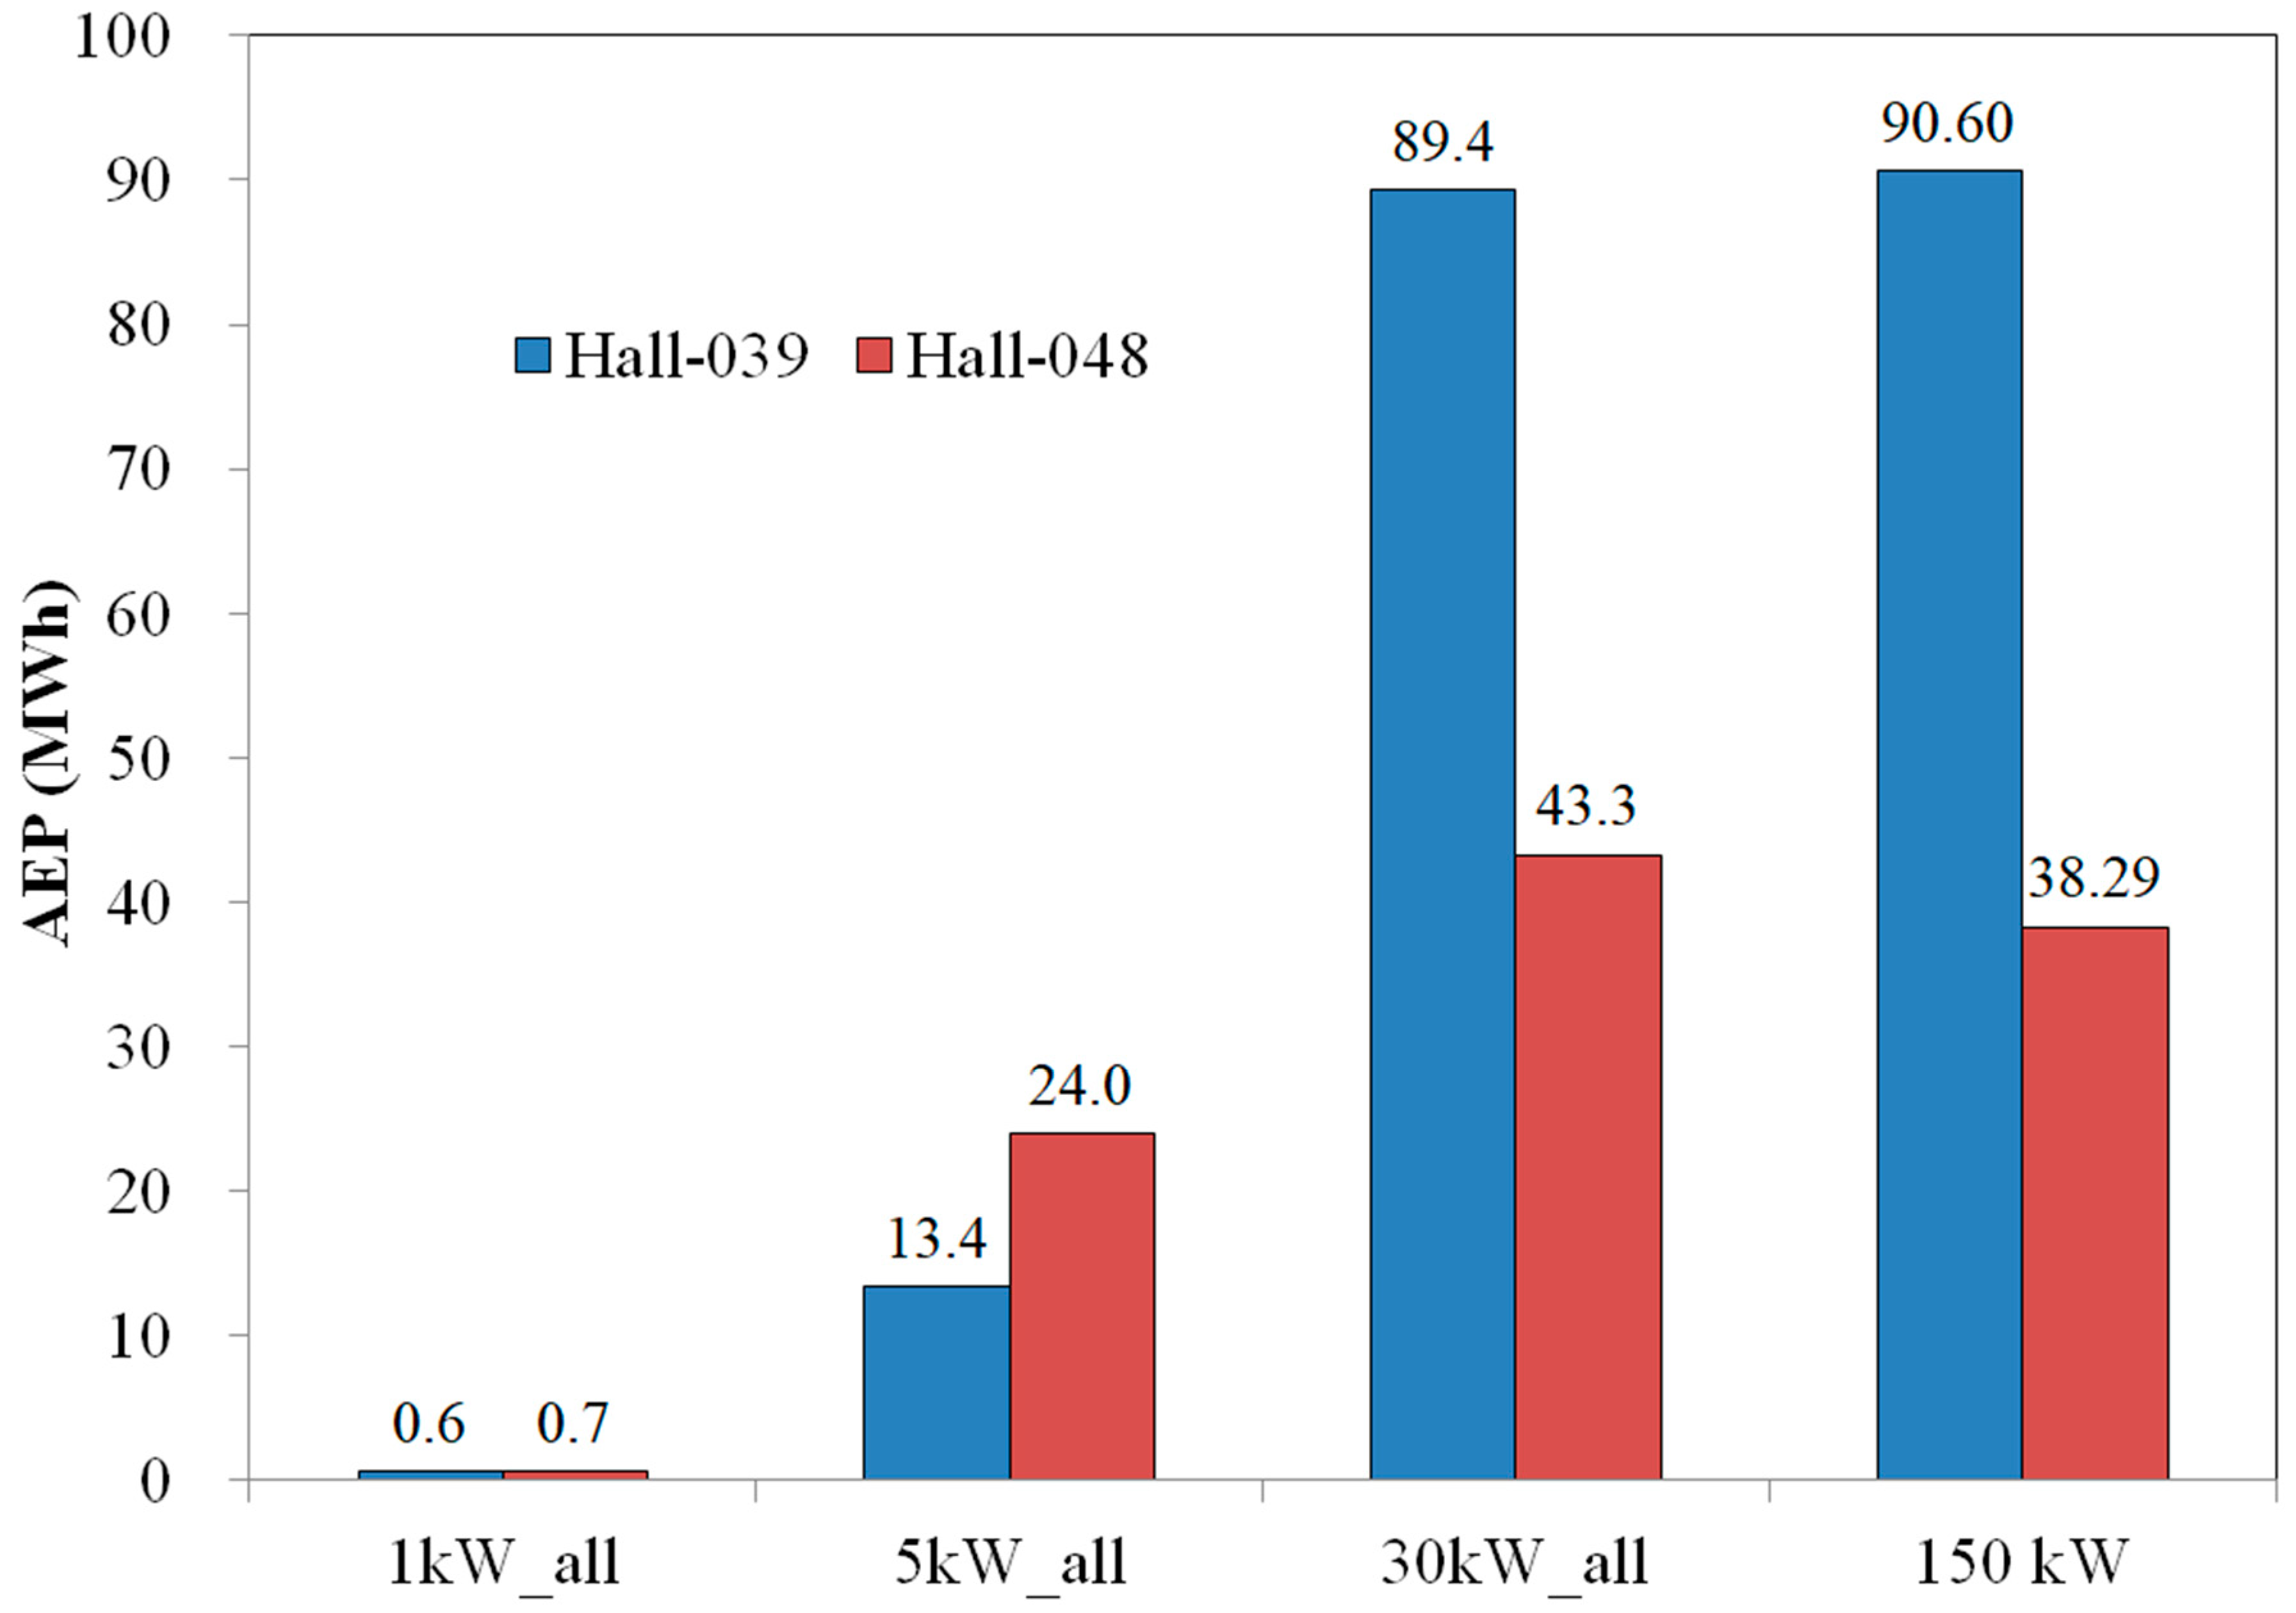
Building Act. The alternative option is to install the newly introduced wind turbine on the existed tower. Therefore, in the present investigation, the location of wind turbines is fixed with different rotor parameter (performance curve and hub height) to investigated its effect on the production of AEP. Calculated results are compared in
Figure 14.
The self-developed wind turbines can be employed for the comparison of AEP. The INER-25 kW wind turbine is constantly operated under the experimental conditions to test some developing control strategy. Thus, it is more appropriate to employ the AEP of INER-150 kW for the comparison of AEP with that of WAsP model. The predicted AEP for the 150 kW wind turbine is from 90.6 and 38.3 MWh and the real AEP (after the statistical process) is 89.6 MWh. The difference is only 1.1%. This indicates that the predicted AEP by the proposed model is consistent with experimental data by using the weather data of Hall-039.
The AEP is about 600 to 700 kWh by using the 1 kW wind turbine, which might be the most appropriate for those existing support towers. The AEP difference using different weather data is also insignificant for the 1 kW wind turbine system.
When introducing the 5 kW wind turbine system, the AEP obviously increases from 13 to 24 MWh. The generated AEP due to the switch of weather data from Hall-039 to Hall-048 increases, which is opposite to the following two investigated cases. Such variation is also observed in the case of 1 kW with very small increment.
For the case of 30 kW, the corresponding AEP increased from 43 to 89 MWh (sum of three wind turbines). The AEP drastically decreases when switching the weather data from Hall-039 to Hall-048, which is consistent with the cases of INER-25 kW and INER-150 kW.
For the evaluation of AEP, the mechanical and electrical transmission loss should also be evaluated. From a surveyed study for a planning wind farm in Taiwan, the electrical transmission loss is about 2%, and the mechanical loss is about 14.7%. Thus, the average loss combining these two effects is about 16.7%. The mechanical loss is site-dependent. Further comparison with actual AEP should be conducted to fine tune the value of these mentioned losses.
Considering the proactivity on the installation for the site in INER campus, the finalized decision on the selection of wind turbine is 1 kW system. The finalized wind farm is shown in
Figure 15. The hub height is 6 m for the right-side wind turbine with three blades. For the middle wind turbine, its hub height is also 6 m with five blades. On the left side, the hub height is 10 m with three blades. Different hub heights and blade number are intentionally selected to investigate its effect on the performance of individual wind turbine and entire wind farm. The installation of wind turbine is completed, and power generation-related data are collected via the supervisory control and data acquisition (SCADA) system.
Continuous operation of the developed wind farm will be conducted, and the power production-related data will be collected for the validation of the numerical model in the future.
4. Discussion
In the present study, the AEP is evaluated by using different capacity of wind turbine from 1 kW to 150 kW. Besides the commercial type, the self-developed wind turbine systems are also included. Comparing the main specification of the investigated wind turbine systems, the most obvious difference is the survival wind speed of the self-developed wind turbines. As an experimental facility, smaller survival wind speed is intentionally designed to protect the turbine blades and the support structure. The effect of the designated lower survival wind speed (22 m/s and 25 m/s) on the performance of the deployed wind farm would be insignificant since the hourly averaged wind speed is generally lower than the survival wind speed for the investigated site of the present study.
In the investigation for the effect of obstacle on the 25 kW wind turbine, the AEP of the investigated INER 25 kW is observed properly even if it is installed within the representative building block. With aggressive pitch angle (P05), its AEP is only 25% lower than that of the 150 kW wind turbine system. The competence of the proposed WAsP model is verified for the calculation of AEP for a wind turbine system located within building block.
For the validation of the proposed WAsP model, the difference between the calculated and real AEP of INER-150 kW wind turbine is only 1.1%, which is much better than some previous studies (8.86% [
9] and 10% [
2]). The consistent result is mainly due to the higher hub height of the INER-15 kW wind turbine system. At the height of 50 m, the coming wind is more stable, and the effects of trees and building on the flow field and power production are also smaller.
Comprehensive comparison is made for wind farm deployment. Based on the presented results, it is deduced that the hub heights of 1 kW and 5 kW are not enough and the performance of the wind turbine is significantly affected by the surrounding trees, buildings and nearby wake flow. For the wind turbine system with height higher than 20 m, the effect of nearby building and wake would be less important. The effect of different weather data on the generated AEP is consistent for the wind turbine higher than 20 m.
The newly developed wind farm will be continuously operated. The comparison and revision with the proposed numerical model can be conducted with the one-year-long data. Furthermore, it is also suggested to conduct the case study outside the INER campus via the proposed methodology in the future to promote the development of renewable energy for Taiwan. The effects of the mechanical and the electrical transmission losses on AEP are not considered in the present study. From a referred case study, the mechanical and electrical transmission losses are suggested. But the applicability should be verified, and parameters should be adjusted by comparing the calculated value against the real power production of the investigated wind farm in the future.
5. Conclusions
The case study of micro-siting for the campus of INER was conducted. Selected commercialized wind turbines and self-developed systems were virtually installed on the selected locations. The corresponding AEP of the deployed wind farm within the campus of INER was evaluated. The appropriateness of the deployment of wind farm was discussed comprehensively.
The effect of buildings on the flow field of wind and the performance of wind turbine was discussed. The performance of wind turbine installed within a grouped building was also investigated. Different weather data were also introduced and the corresponding AEP were evaluated for the comprehensive evaluation for wind farm deployment.
Considering the proactivity on the installation for the site in INER campus, the finalized decision on the selection of wind turbine is a 1 kW system. The installed wind farm is completed. Different hub heights and blade number were intentionally selected to investigate its effect on the performance of individual wind turbine and entire wind farm. The installation of the wind turbine is completed, and power generation-related data were collected via the SCADA system. The proposed numerical model will be fine-tuned via the comparison of the experimental data in the future.
Author Contributions
Conceptualization, M.-H.C., Y.-T.L., P.-H.C. and H.C.W.; methodology, M.-H.C.; software, M.-H.C.; validation, M.-H.C., Y.-T.L. and C.-C.C.; formal analysis, M.-H.C. and C.-C.C.; investigation, M.-H.C.; resources, M.-H.C., and Y.-T.L.; data curation, M.-H.C.; writing—original draft preparation, M.-H.C.; writing—review and editing, M.-H.C., P.-H.C., C.-C.C. and H.C.W.; visualization, M.-H.C.; supervision, Y.-T.L., P.-H.C. and H.C.W.; project administration, M.-H.C.; funding acquisition, Y.-T.L. All authors have read and agreed to the published version of the manuscript.
Funding
This research was funded by Ministry of Science and Technology ROC, grant number 108-3116-F-042A-006. (Ming-Hong Chen, Yan-Ting Lin and
Huei-Chu Weng)
Conflicts of Interest
The authors declare no conflict of interest.
References
- Hillring, B.; Krieg, R. Wind energy potential in southern Sweden—Example of planning methodology. Renew. Energy 1998, 13, 471–479. [Google Scholar] [CrossRef]
- Durak, M.; Şen, Z. Wind power potential in Turkey and Akhisar case study. Renew. Energy 2002, 25, 463–472. [Google Scholar] [CrossRef]
- Berge, E.; Gravdahl, A.R.; Schelling, J.; Tallhaug, L.; Undheim, O. Wind in complex terrain. A comparison of WAsP and two CFD-models. Proc. EWEC 2006, 27, 10. [Google Scholar]
- Palma, J.M.L.M.L.M.; Castro, F.A.; Ribeiro, L.F.; Rodrigues, A.H.; Pinto, A.P. Linear and nonlinear models in wind resource assessment and wind turbine micro-siting in complex terrain. J. Wind. Eng. Ind. Aerodyn. 2008, 96, 2308–2326. [Google Scholar] [CrossRef]
- Dehmas, D.A.; Kherba, N.; Hacene, F.B.; Merzouk, N.K.; Merzouk, M.; Mahmoudi, H.; Goosen, M.F. On the use of wind energy to power reverse osmosis desalination plant: A case study from Ténès (Algeria). Renew. Sustain. Energy Rev. 2011, 15, 956–963. [Google Scholar] [CrossRef]
- Carvalho, D.; Rocha, A.; Santos, C.S.; Pereira, R. Wind resource modelling in complex terrain using different mesoscale–microscale coupling techniques. Appl. Energy 2013, 108, 493–504. [Google Scholar] [CrossRef]
- Waewsak, J.; Chaichana, T.; Chancham, C.; Landry, M.; Gagnonc, Y. Micro-siting Wind Resource Assessment and Near Shore Wind Farm Analysis in Pakpanang District, Nakhon Si Thammarat Province, Thailand. Energy Procedia 2014, 52, 204–215. [Google Scholar] [CrossRef][Green Version]
- Lennard, C.; Hahmann, A.N.; Badger, J.; Mortensen, N.G.; Argent, B. Development of a Numerical Wind Atlas for South Africa. Energy Procedia 2015, 76, 128–137. [Google Scholar] [CrossRef]
- Ayala, M.; Maldonado, J.; Paccha, E.; Riba, C. Wind Power Resource Assessment in Complex Terrain: Villonaco Case-study Using Computational Fluid Dynamics Analysis. Energy Procedia 2017, 107, 41–48. [Google Scholar] [CrossRef]
- Chang, T.; Wu, Y.-T.; Hsu, H.-Y.; Chu, C.-R.; Liao, C.-M. Assessment of wind characteristics and wind turbine characteristics in Taiwan Assessment of wind characteristics and wind turbine characteristics in Taiwan. Renew. Energy 2003, 28, 851–871. [Google Scholar] [CrossRef]
- Fang, H.-F. Wind energy potential assessment for the offshore areas of Taiwan west coast and Penghu Archipelago. Renew. Energy 2014, 67, 237–241. [Google Scholar] [CrossRef]
- Jarvis, A.; Rubiano, J.; Nelson, A.; Farrow, A.; Mulligan, M. Practical Use of SRTM Data in the Tropics—Comparisons with Digital Elevation Models Generated from Cartographic Data; International Centre for Tropical Agriculture: Cali, Colombia, 2004. [Google Scholar]
- Industrial Technology Research Institute. Thousand Wind Turbines Project. Available online: http://www.twtpo.org.tw/intro.aspx?id=462 (accessed on 18 August 2020).
- AEOLOSH 30KW. Available online: https://en.wind-turbine-models.com/turbines/1864-aeolos-aeolos-h-30kw (accessed on 18 August 2020).
| Publisher’s Note: MDPI stays neutral with regard to jurisdictional claims in published maps and institutional affiliations. |
© 2020 by the authors. Licensee MDPI, Basel, Switzerland. This article is an open access article distributed under the terms and conditions of the Creative Commons Attribution (CC BY) license (http://creativecommons.org/licenses/by/4.0/).


