1. Introduction
In recent years, the development of multi-carrier energy systems (MCE) has gained worldwide attention. This is a result of the rising global energy tensions, the interactions between gas, heat, and electricity networks, and the penetration of various energy storage facilities such as power to gas systems and fuel cells [
1,
2]. However, the environmental pollution and energy crisis are the most critical issues. The improvement of energy efficiency has become an unavoidable option to overcome these problems [
3]. Therefore, the operation of energy carriers to supply the energy demand, called the energy commitment (EC) problem, must be optimized to increase the efficacy of the energy system.
The power system operator applies unit commitment (UC) to assign the optimal generation scheme of units for a weekly or daily period [
4]. Several research works have studied the UC problem. For instance, Morales-Espana and Tejada-Arango [
5] proposed a formulation for clustered UC (CUC) in order to accurately model the flexibility requirements such as reserves, ramping, and shutdown/startup constraints; moreover, in [
6]. A temporal decomposition strategy for computation time reduction of security-constrained UC (SCUC) was proposed. In [
7], Ning and You suggested a new data-driven adaptive robust optimization model for the solution of UC with integration of wind power units into smart grids. A variable reduction technique for large-scale UC is introduced in [
8].
Energy hub (EH) is a unit providing the output and input of fundamental features, storage, and conversion of various energy carriers. Thus, the EH expresses an extension or generalization of a network node in an electric power system [
9]. In [
10], Moazeni et al. studied the optimal scheduling of an EH with various energy resources for serving stochastic heat and electricity demands considering uncertain prices and operational constraints, such as downtime requirements and minimum uptime. Furthermore, an intelligent modeling and optimization method for EH is proposed in [
11] by dividing the complex EH into several simple EHs. Dolatabadi et al. [
12] also evaluated the operation of an EH consisting of combined heat and power units (CHP), wind turbine, boiler, and storage facilities based on a hybrid stochastic/information gap decision theory model.
In recent years, networks such as natural gas, heating, and electrical networks are generally considered as independent systems known as multi-carrier energy system (MES) [
13,
14]. In [
15], Wang et al. proposed a new optimal planning model for CHP in MES to benefit both networks by reducing the use-of-system (UoS) charge for system users and deferring investment for network owners. Moreover, a robust day-ahead operation technique for a MES that improves the power systems flexibility with a large integration rate of variable wind turbines is proposed in [
16]. Furthermore, in [
17], Kampouropoulos et al. presented a new technique for the energy optimization of MES, which combines a genetic algorithm for optimizing its energy flow. Additionally, an adaptive neuro-fuzzy inference network for modeling and forecasting the power load of a plant is proposed.
One of the important indicators of quality assessment of life and the level of progress in a society or country is energy consumption;supplying this energy demand is the main challenge of energy operation and planning. Particularly, energy planning makes and confirms scenarios in the energy economy based on the World Energy Council definition that: “part of economics related to energy problems, taking into account the analysis of energy supply and demand, as well as execution of the means for ensuring coverage of energy needs in a national or international background” [
18]. In general, energy planning approaches are categorized in three groups: model-based planning, analogy-based strategy, and inquiry-based one [
19]. The energy planning based on models contains econometric and optimization models. The econometric model depends on mathematical and statistical approaches such as regression investigation [
19,
20]. Moreover, the optimization scheme makes the step from a description by a model to an instruction by a model when the best possible solution method based on a goal function is needed, as an optimization procedure will prove that any deviation from a defined condition leads to a degraded one [
21,
22]. This is the extensive classification of tools for energy planning. Particularly, the great relevance of this fact is related to the family of multi-period linear programming schemes [
23,
24,
25].
Regardless of the used method, energy planning issue requires a detailed study of the energy system. In [
26], Cormio has presented a linear programming optimization scheme based on the energy flow adopted optimization framework. Moreover, as it is well-defined in [
27], integrated planning of energy resources is the process that includes “finding the optimum combination of supply and consumption smoothing resources in order to meet energy needs in an area or country.” In this reference, a series of basic features planning for minimization of energy costs and social and industry costs is mentioned [
28]. In addition, Hobbs has developed a linear programming integer in order to unify the consumption and production resources management programs. This model is based on mixed-integer linear program (MILP) and Linear Program (LP) [
29] that includes the features of the demand side management (DSM) [
30,
31]. Hobbs and Contlella have presented a model of integrated resource planning (IRP) considering the environmental impact of power generation [
32]. Moreover, in [
33], Hirst and Goldman have shown how environmental factors can impact the IRP program. In the planning of such systems by the traditional method, all demand must be met by the supply of electrical energy, and shortage is not acceptable; however, in the IRP method, it is assumed that the production shortfall can be compensated through consumption management programs [
34], so that in many processes of IRP, applying demand management programs can play an important role in meeting demand [
29]. In order to remove large numbers of DSM options and determine which options are more feasible, usually the cost savings method is used that estimates the value of each management plan for system energy consumption [
35].
Optimization of horizontal planning is performed for two times: once according to the predicted electrical load at baseline and again with the expected load curve. If consumption management programs run, energy cost savings are equal to the difference between production costs and production capacity in the two mentioned states [
36]. Several studies have performed energy consumption management in developing countries [
37] such as Cyprus, Nepal [
38], and Sri Lanka [
39,
40]. Such management approaches include the effect of power factor correction, programs for improving the efficiency of lighting and air conditioning, energy audit, using engines with smart meters, etc., in final consumption.
Energy systems are based on fossil fuels (i.e., natural gas, oil, and coal), which represents the most important primary energy source worldwide [
41,
42,
43]. Concerning the shortage of fossil fuels, high penetration of renewable sources with hydrogen as an energy carrier has been suggested in [
44]. Moreover, in [
45], a general structure has been developed for modeling energy systems, including various energy carriers such as power, gas, heat, and other forms of energy. Nevertheless, while renewable resources considered as primary energy carrier that follows its position in the energy system, the transportation industry is heavily dependent on oil energy carrier and there is no easy solution to meet the demand for renewable transport sector [
46]. As an alternative to dependence of energy economy on oil energy carrier, hydrogen energy economy arises [
47]. A comparison in terms of efficiency and operational capabilities between different energy carriers is performed in [
48] in order to generate cheap power. Traditional primary resources (i.e., fossil fuels) have limited capacity, and an appropriate planning must be done considering the presence of renewable primary energy carriers [
49].
In this research work, based on dynamic programming (DP) and genetic algorithm (GA) concepts, the solution of energy commitment (EC) in multi-carrier energy systems is proposed. Moreover, considering the required information from the final energy consumption, in the present study, a mathematical model is developed to estimate the amount of electrical energy demands in the country, the combination of input fuel to power plants, and the optimum combination of production with a view to satisfying the demand. Thus, it offers the best integration of primary energy carriers to supply energy consumption.
This work enables a better understanding for the following benefits:
Determination of the most appropriate pattern of using energy carriers to satisfy energy consumption.
Study of integrated energy network.
Integrated optimization of energy carriers instead of independent optimization of each carrier separately.
Mathematical modeling of energy network from bottom to up (from the lowest energy level to the highest energy level).
Application of DP and GA in EC.
Impact of crude oil refining and its products on EC.
Distribution of electrical energy as a subset of EC study.
This paper is structed as follows:
Section 2 presents the EC problem formulation. The steps and process of implementing the proposed study are described in
Section 3. In
Section 4, the simulation results of the solution of EC problem are studied. Finally,
Section 5 discusses the conclusions.
2. EC Problem Formulation
There are several methods for establishing reference energy system. The easiest way is to do hand calculations, but since one of the reference energy system applications is to study effects of changes in the structure of demand on the supply side, and also in large networks the calculations are very heavy and time-consuming, it seems desirable to model the energy grids in a specific software.
A power system simulator in Brookhaven National Laboratory was developed based on the development and design of the idea of the reference system. The basic idea of matrix formulation is to create vertical incisions in the energy system [
50].
The energy grid matrix model is simulated step by step from the lowest energy level as the final energy load to the highest energy level, which is the primary energy carrier.
In the first step,
as final energy consumption matrix based on the various energy consumption sectors is defined by Equation (1).
where
is the final various energy loads and
is a transformation matrix for conversion of the consumption sectors to carriers.
Considering the losses in distribution and transmission sectors, energy consumption is determined by Equation (2).
where
is the final energy consumption by different carriers considering losses and
is transmission, distribution, and energy consumption efficiency matrix. It should be noted that due to the fact that mathematical modeling is considered from demand to production (down to up), the
parameter (transmission, distribution, and consumption efficiency) has values of 1 or above.
In order to convert the electricity demand as a secondary energy carrier to primary energy carriers, first the production of each unit must be determined, then the required carriers to supply fuel of power plants are calculated. The participation rate of each power plant unit in supplying electricity demand is calculated by Equation (3). After allocating electrical energy to the units, the amount of energy input to different power plants considering the efficiency of power plants can be calculated by Equation (4).
where
is power generation of various plants,
is total produced power,
is the separation of power supply matrix by various plants,
is efficiency matrix of plants, and
is fuel of plants.
After determining the total amount of energy input to each power plant, the amount of different fuels according to the type of power plant is calculated by Equation (5).
where
is the requirement energy carriers to generate electrical energy demand and
is separation of fuel of plants to matrix of various carriers.
After the model of power supply, the requirement for various carriers in regard to power supply is computed by Equation (6):
where
is the requirement for various carriers concerning transmission, distribution, energy usage, and supply power losses, and
is produced power.
Up to this stage of modeling, energy grid losses have been calculated, as well as electrical energy, as one of the most important energy demands that is converted into energy carriers input to power plants. In fact, based on the energy conversion process in power plants, the number of energy carriers (which is used as fuel for power plants) with a certain amount is converted to electricity carriers.
Another conversion energy process considered in the proposed study is to simulate the process of refining crude oil in refineries and converting crude oil into various petroleum products. Refining of crude oil energy carrier as a primary energy carrier and conversion to obtained energy carriers from refining is simulated by Equation (7).
where
is the upper bound of refineries capacity,
is the share of each product generated by crude oil refining, and
is the generated carriers by refining.
The requirement for energy carriers after simulating the crude oil refining process is specified by Equation (8).
where
is the refined crude oil,
is the carriers need considering power loss in production and refinement steps.
After determining the amount of need for different energy carriers in order to supply energy demand, the amount of import and export of carriers based on the amount of domestic production is determined by Equation (9).
where
P is the domestic supply of primary carriers and
is carriers import and export. In
, positive/negative signs mean import/export of primary carriers.
The amount of production share of each power plant unit in supplying electricity demand in Equation (3) should be allocated optimally based on the economic dispatch. Genetic algorithms (GA) is used to achieve this purpose and optimally allocation electrical energy to power plants.
Genetic Algorithm
Genetic algorithm is a search algorithm that has arisen with inspiration from Darwin’s natural principle and the principles of genetics. This principle is based on choosing a random set of strings (i.e., potential solutions) and with regard to compatibility (i.e., criterion for measuring the performance) and applying genetic operators over successive generations, attains to adaptive strings (i.e., optimum solutions).
The general framework of genetic algorithm is as follows:
Coding parts of the search space: In the genetic algorithm, a string should be assigned anywhere in the search space because the genetic algorithm works with strings.
Production of the initial population and calculation of the amount of people’s fitness: After determining the kind of coding, the initial population should be determined. One of the important parameters in the genetic algorithm is to determine the number of the initial population. Usually, a score is given to each string of the search space that reflects the well-being or fitness score of that string. This score indicates how much chance that person has to participate in the production of children. Generally, the objective function value is considered as a fitness number anywhere.
Proliferation: At this stage, people are chosen from the initial population to produce children and sent to the pond coupling. People with higher fitness should have greater opportunities to produce children. There are several methods for making this choice. For example, using a roulette wheel is one of these methods.
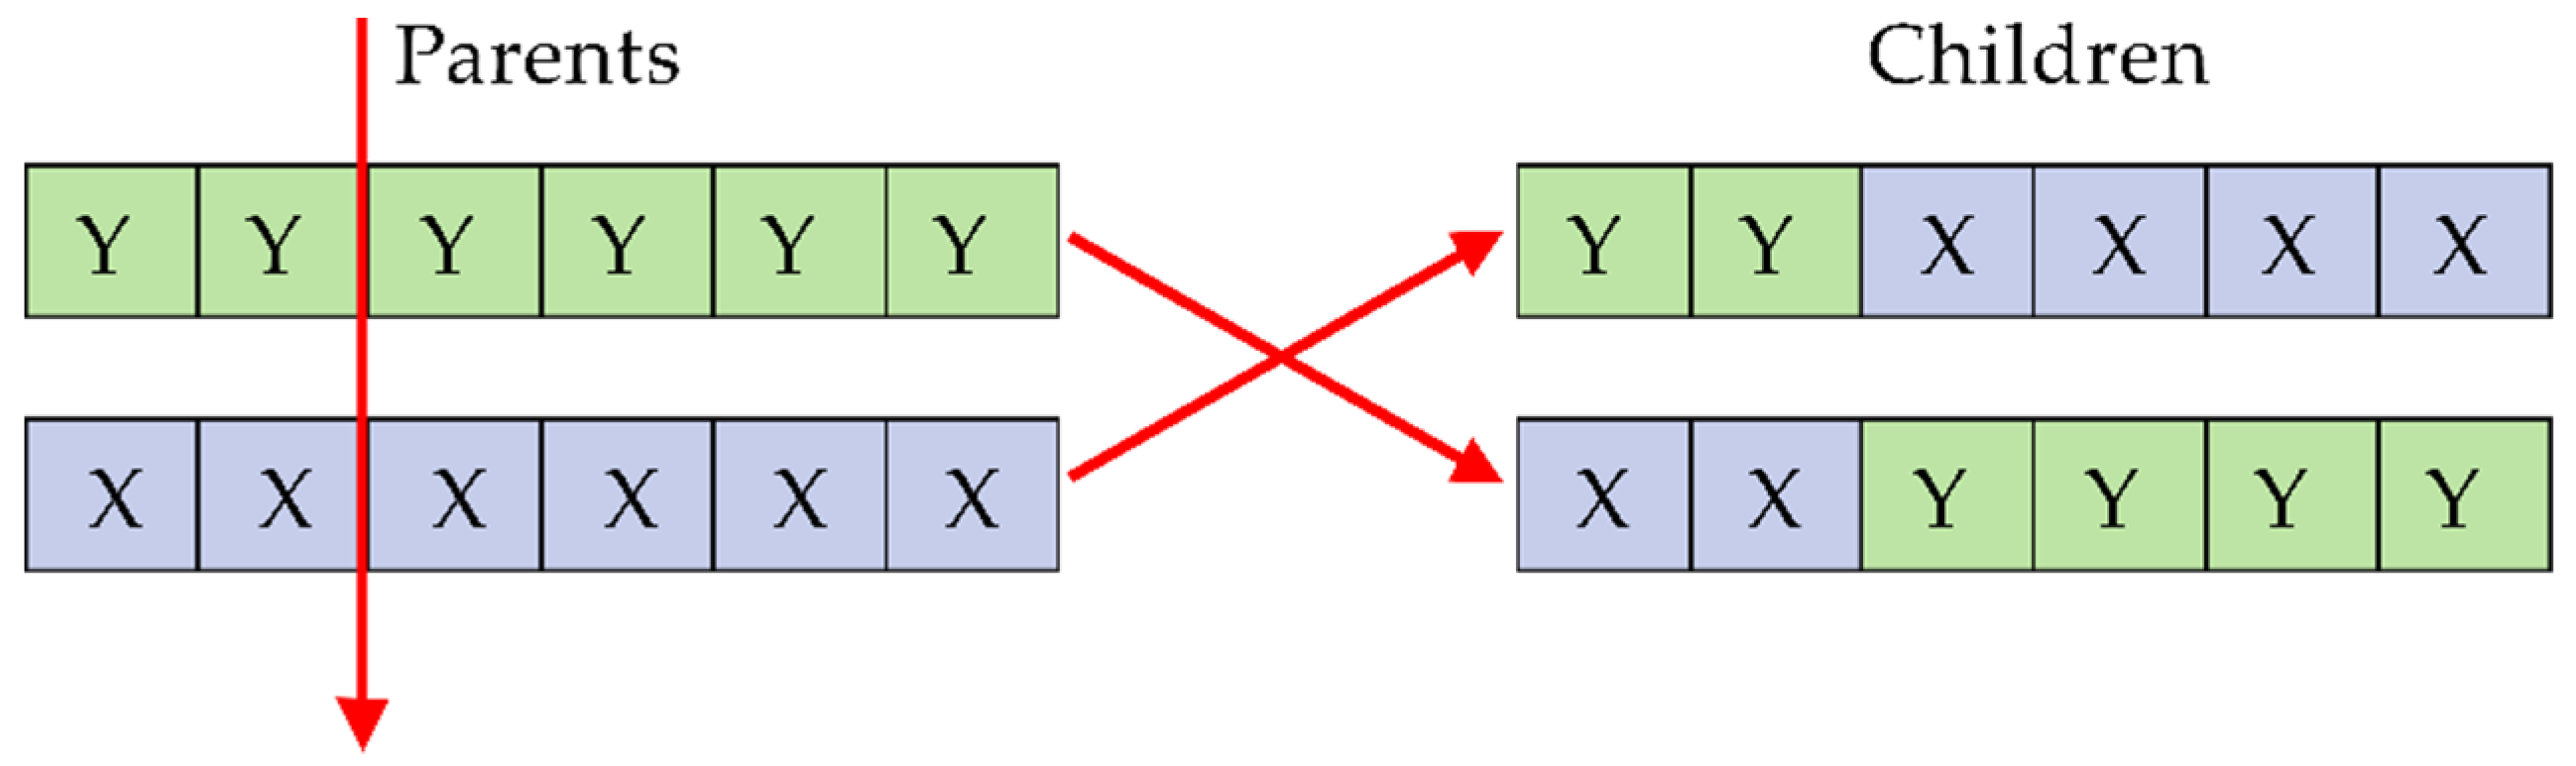
Applying genetic operators on selected people in proliferation: By applying genetic operators on people, the children population is produced. Some of these operators are mentioned here:
- (A)
Displacement: The approach of performing displacement on two strings that have been selected from a pond coupling is shown in
Figure 1. The result of this action is producing two children.
- (B)
Mutations: Random variation of a gene in each category is called mutation.
- (C)
The translation operator: At this stage, a part of the string is selected and after translation placed in its position.
- (D)
Selection: At the last stage, after generating children from the set of the initial population, children must be chosen for the next generation. For selection by the roulette wheel, race or elitism methods can be used.
By applying proliferation, displacement, mutation, and selection on a new generation again, the third generation can be produced. This generation will continue to make a stop condition [
51].
Genetic algorithm has been used as a widely used optimization technique in various studies such as UC [
52], wind energy studies [
53], and path planning for self-reconfigurable robots [
54].
3. Simulation and Discussion
This section focuses on different parts including the simulation parts, results, and discussions. It provides a concise and precise description of the experimental results, the interpretation, as well as the experimental conclusions that can be drawn.
3.1. Case Study
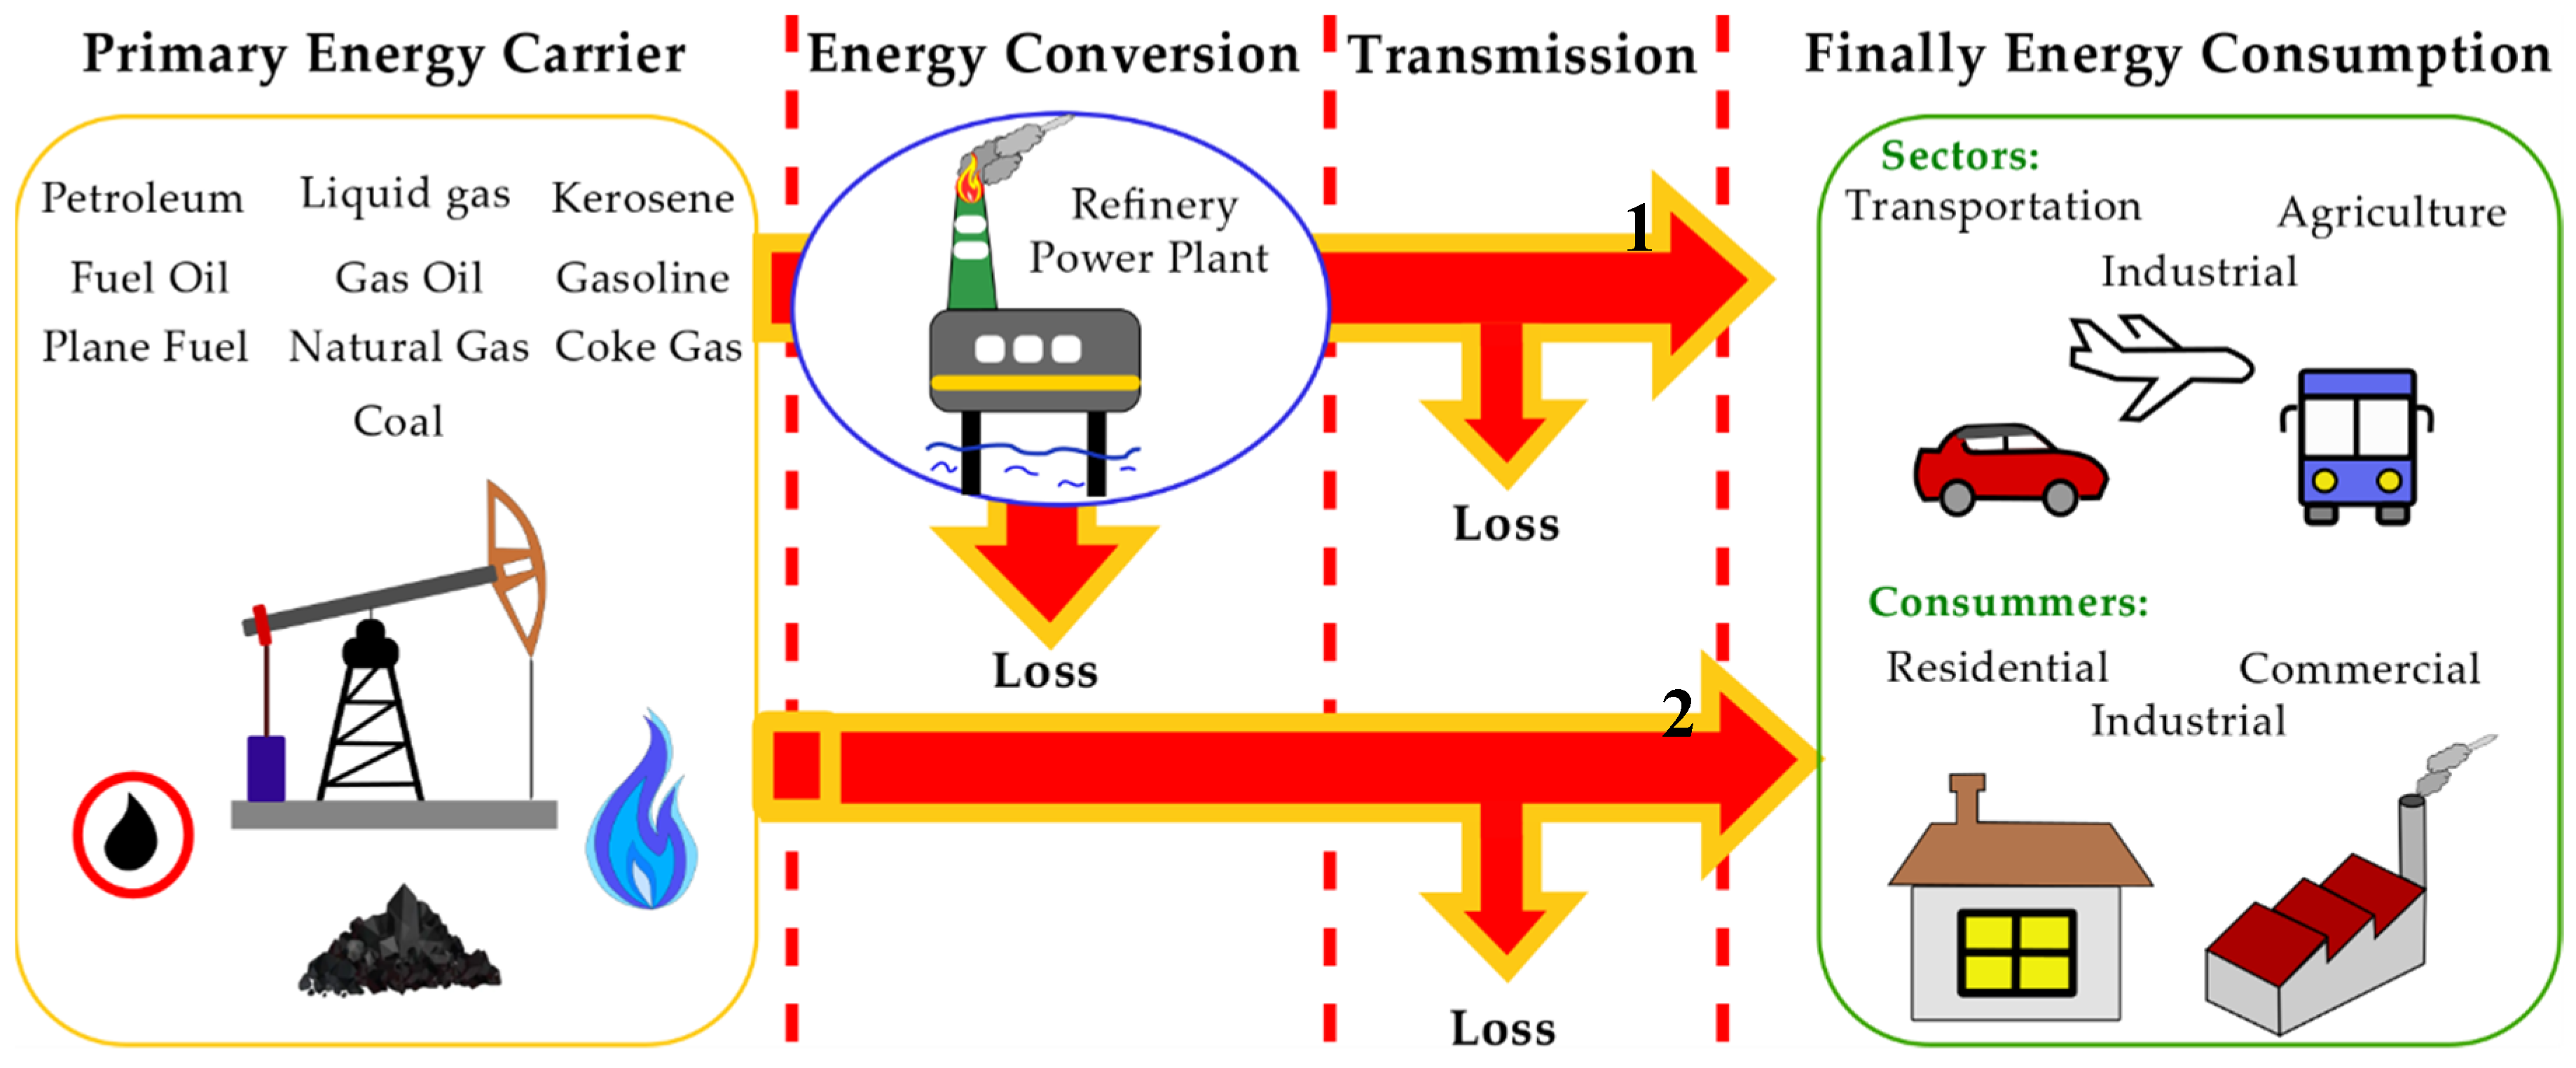
To illustrate the energy planning of primary energy carriers, a multi-carrier energy system with four power plants is used. The selected network contains transportation, industrial, and agriculture sectors; residential, commercial, and industrial consumers. Such parties are selected in the studied multi-carrier system for investigating a realistic viewpoint of interconnection among different energy carriers. The diagram of this studied multi-carrier system as well as its energy flow is drawn in
Figure 2. In other words,
Figure 2 shows the flow of energy from primary energy carriers to energy demand. Part of the energy demand is met directly from the primary energy carriers, which is indicated by arrow 2. Part of the energy demand is related to secondary energy carriers that become available after the energy conversion process in refineries or power plants. This concept is indicated by arrow 1. For example, electrical energy is a secondary energy carrier that is generated based on the conversion process of energy carriers in power plants. Information on this system is shown in
Table 1,
Table 2,
Table 3,
Table 4 and
Table 5. Some additional information is also provided in the
Appendix A (
Table A1,
Table A2 and
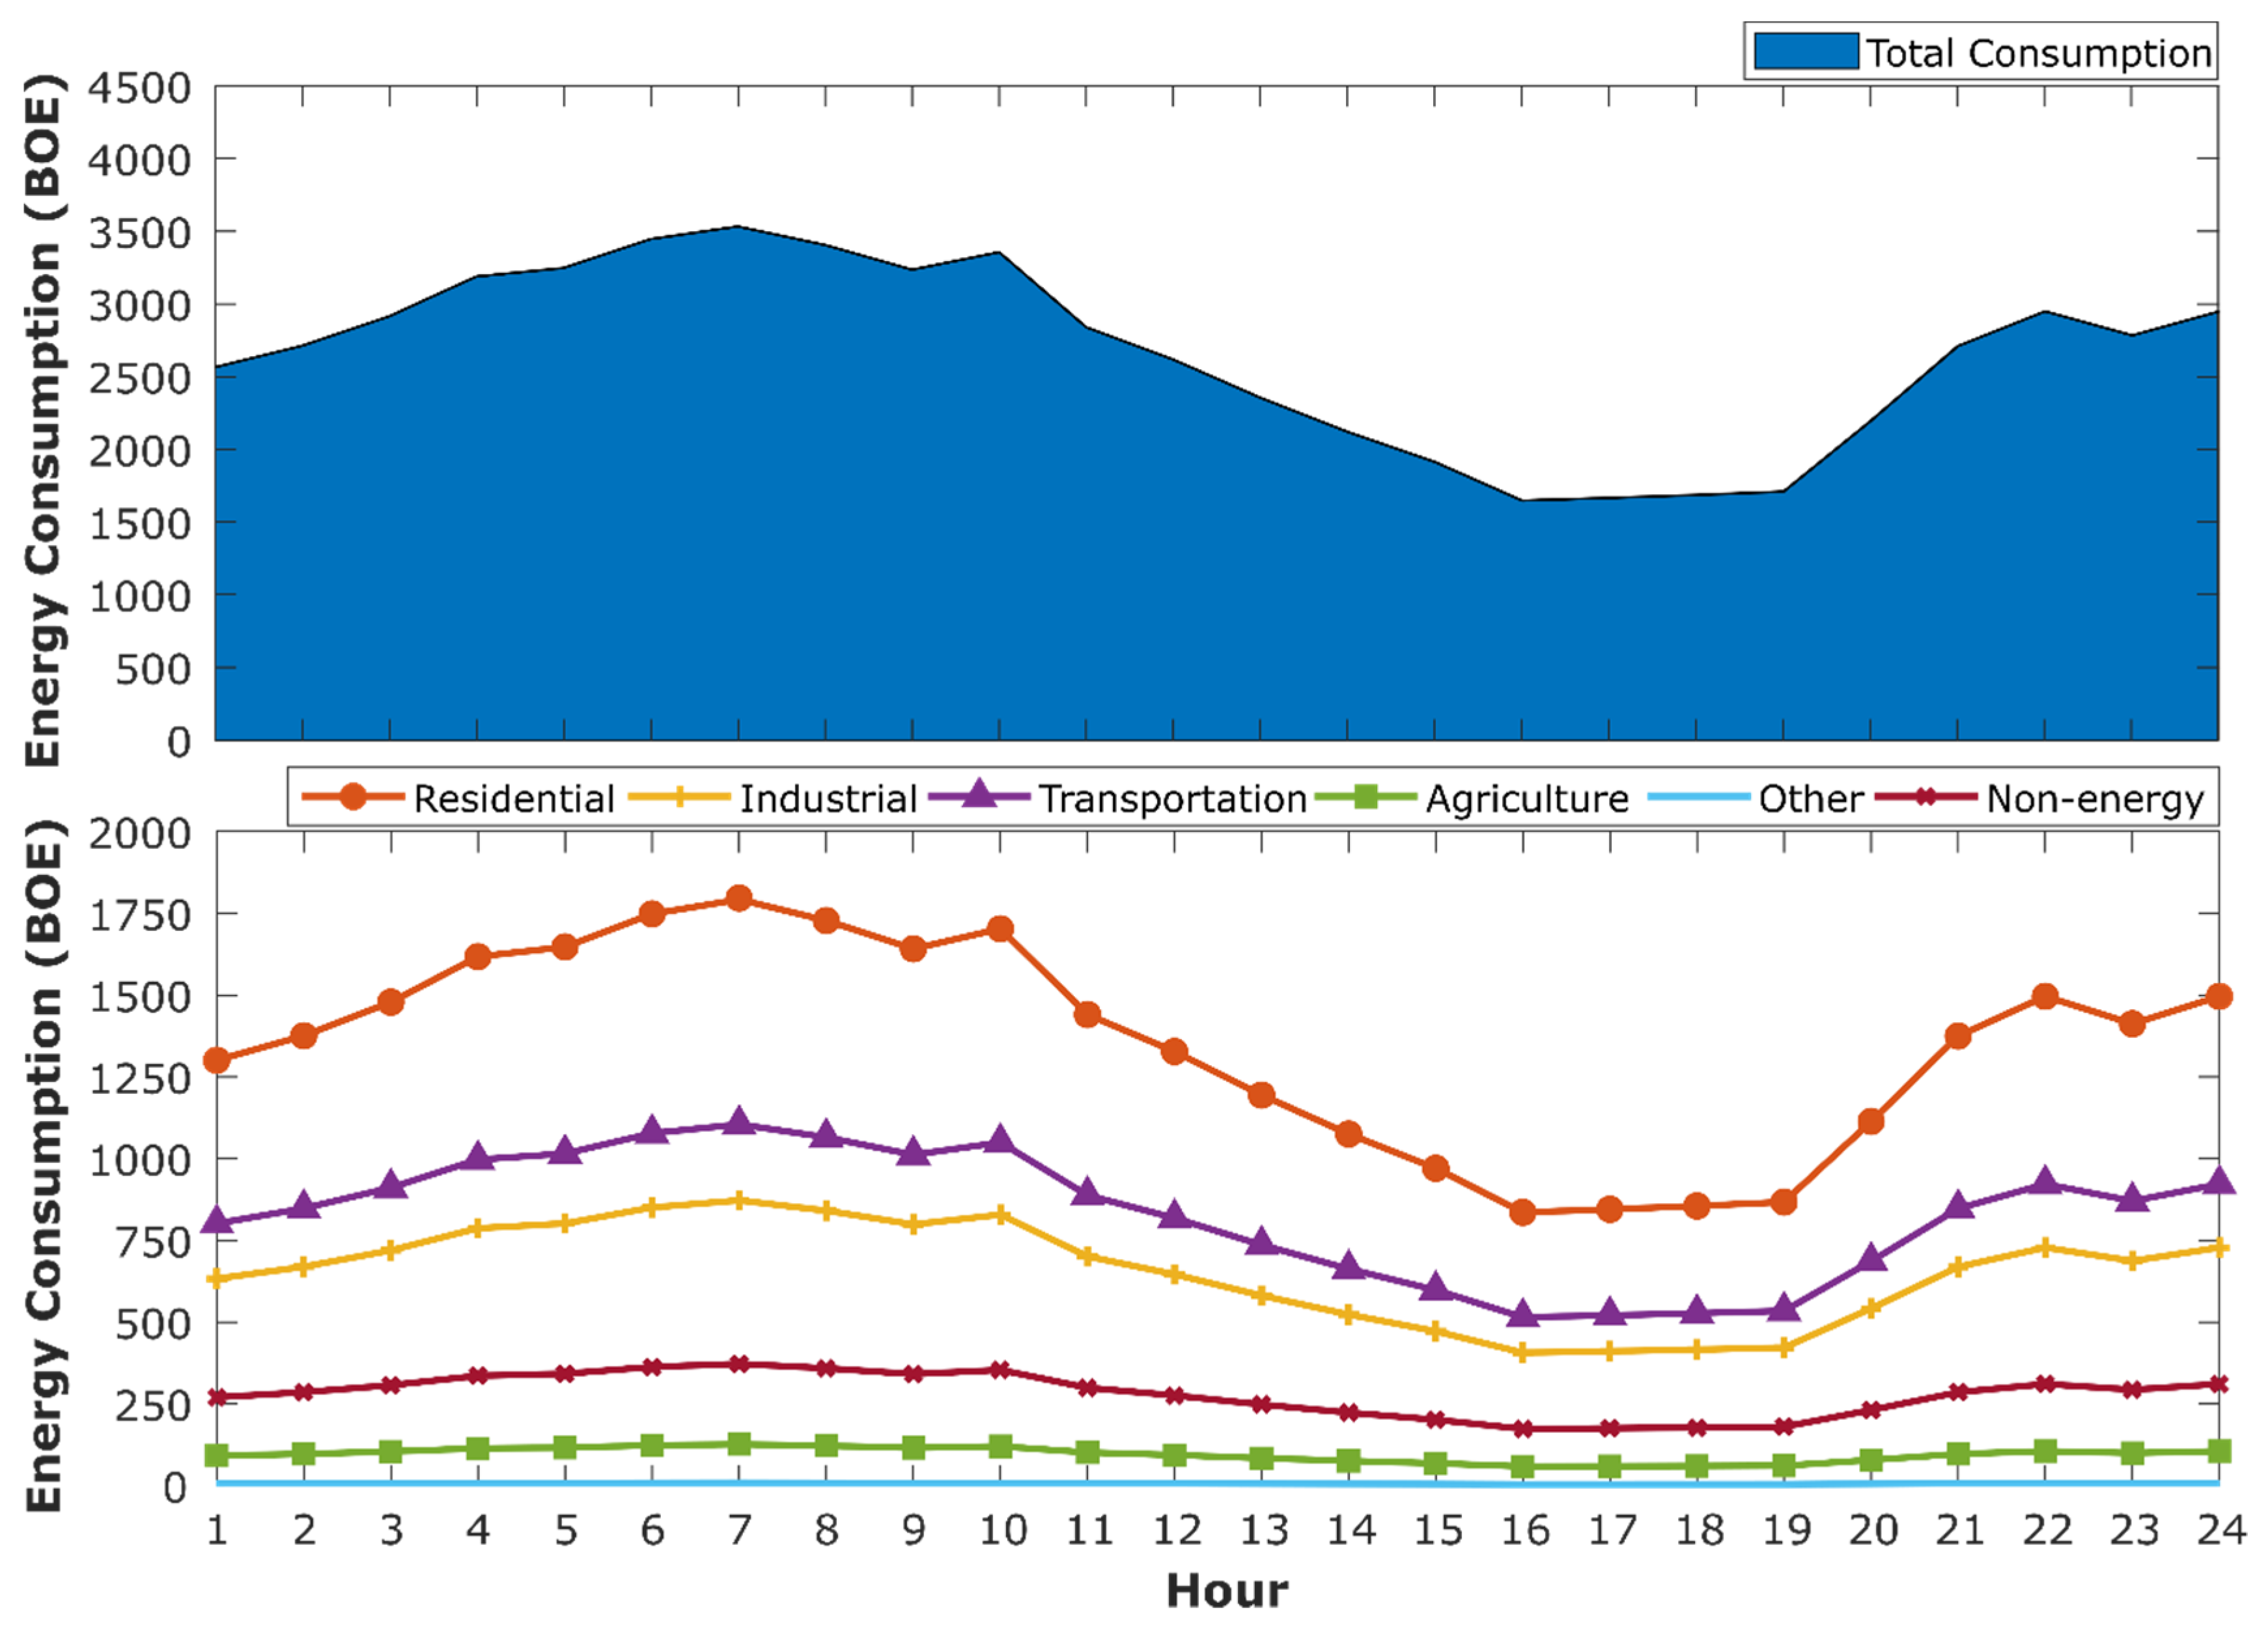
Table A3). The profile of energy demand is displayed in
Figure 3. This figure shows the energy demand for all energy carriers (and not just electrical energy). Part of this energy demand is related to electricity demand, which is supplied by power plant units. Specifically, according to the information provided in
Table 1 and
Table 2, the peak demand for electricity in the seventh hour of the study is equal to 650.83122 MWh. This is while the maximum capacity of electricity production by the power plant units of this network is equal to 840 MWh. Therefore, the grid is able to supply the electricity demand.
3.2. ED and UC Solving
In recent years, various optimization algorithms have been introduced by researchers [
55,
56,
57,
58,
59,
60,
61,
62,
63,
64,
65,
66,
67,
68,
69] and have been applied by scientists in various fields such as energy [
70], protection [
71], electrical engineering [
72,
73,
74,
75,
76], energy carriers [
77,
78], and energy management [
79,
80] to achieve the optimal solution. Optimization algorithms have been always a popular way to solve ED and UC problems. In this paper, the economic distribution of electrical energy is done using GA. The objective functions of economic distribution of electrical energy are presented in Equations (10)–(13).
where
is the objective function,
is the set of input fuels to power plants,
is the whole energy input to power stations of fuel type
i,
is the fuel cost of plant type
i,
is the set of different plants,
is the set of plants of type
j in the studied network,
is the fuel contribution factor
i from the plant’s energy input type
j,
is the input energy to fuel conversion matrix proportional to the plants,
is the input energy power plants matrix,
is the power plants efficiency vector, and
is the output electrical energy of power plants.
3.3. Determination of Optimization Constraints
The constraints include:
- (1)
- (2)
Unit generation limits
where
N is the number of plants,
is output power by the
ith unit at time
t,
is the electric power demand at time t,
is the minimum power,
is output power, and
indicates the maximum output power of the
ith plant.
3.4. Employement of Dynamic Programming
After the distribution of power at each time of planning, tailored to each energy division mode between power plants, the planning process continues and, therefore, an integration of energy carriers corresponding to the integration of plants is obtained. At this stage, energy strategy planning during the study period will be carried out using dynamic programming.
Recursive method for calculation of the least cost at hour K with the combination I, is as:
In Equation (16), is the minimum cost in order to achieve (K, I) state, is the cost of (K, I) state, and is the cost of transition from the state (K − 1, L) to (K, I). The (K, I) state is combination number I at hour K.
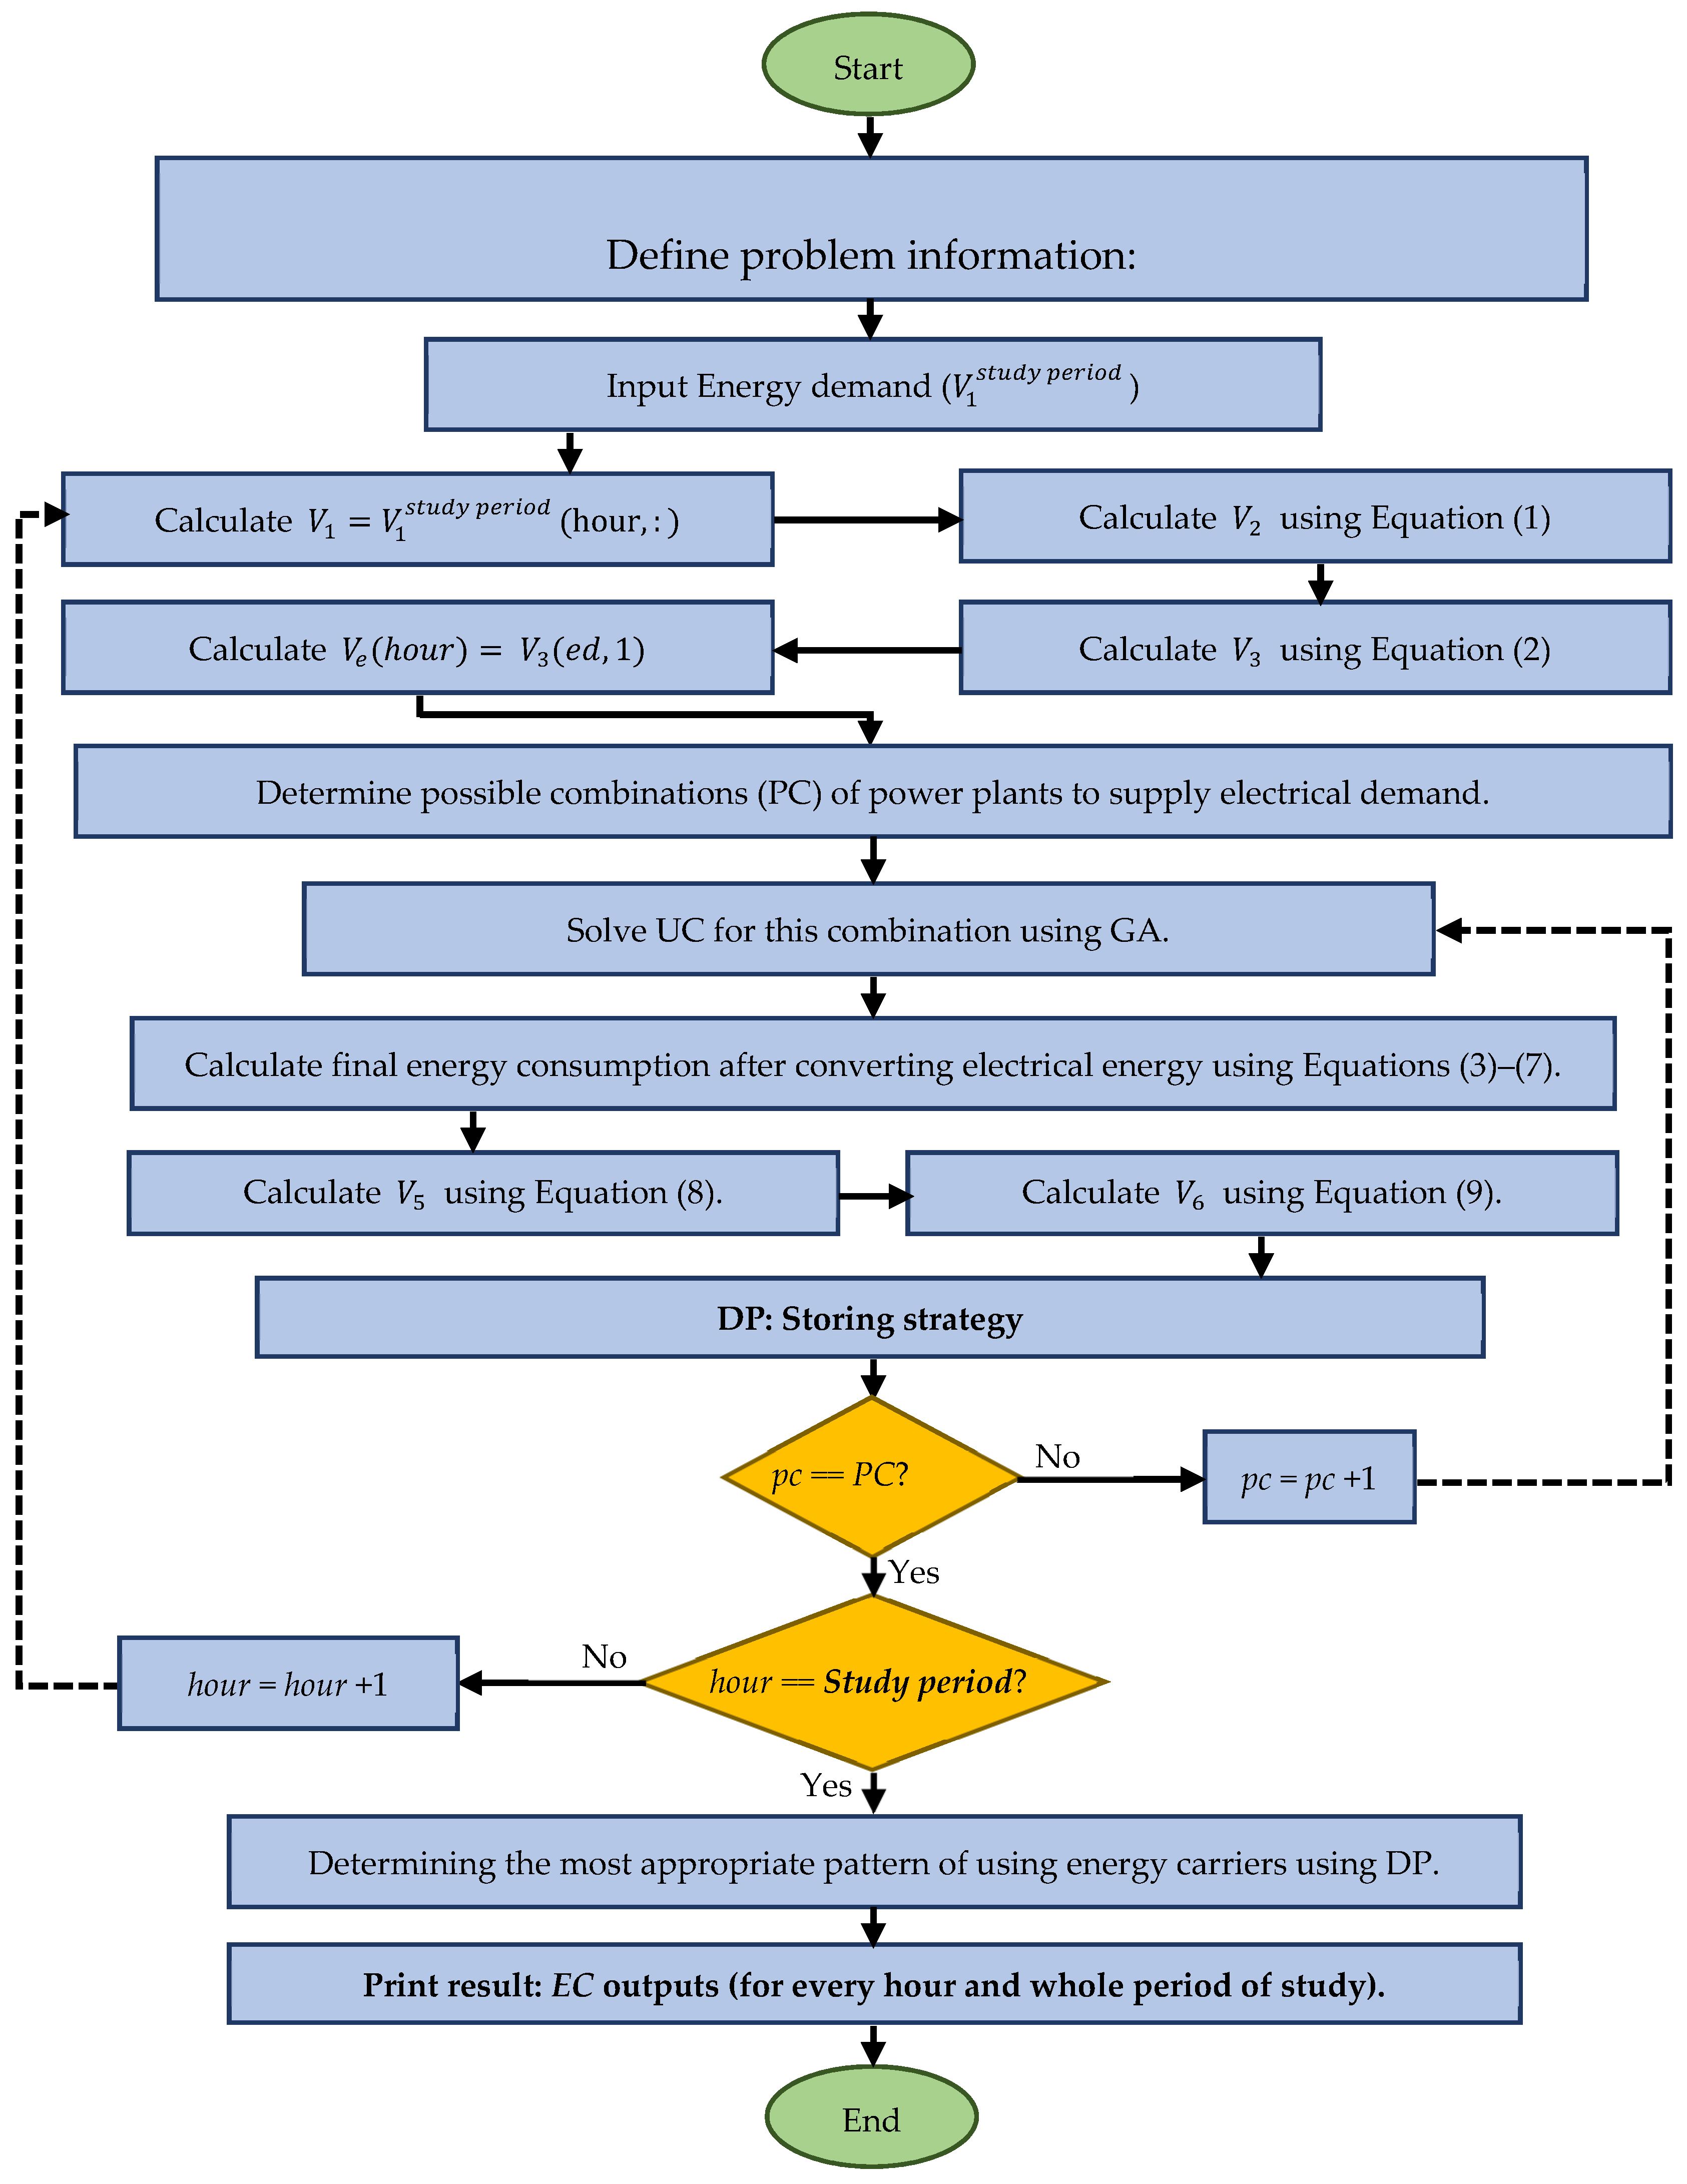
3.5. EC Implementation Steps
The various steps of EC are specified in Algorithm 1. The process of implementing the EC problem using flowchart is also shown in
Figure 4.
| Algorithm 1 Energy commitment (EC) implementation steps |
| START EC |
| 1: | Problem information. |
| 2: | Inputs data |
| 3: | ITER = 1: Study period (24 h) |
| 4: | | . |
| 5: | | calculation using Equation (1). |
| 6: | | calculation using Equation (2). |
| 7: | | and = row number of electrical demand in . |
| 8: | | UC solving |
| 9: | | | Determine possible combinations of power plants to supply electrical demand. |
| 10: | | | pc = 1 |
| 11: | | | | While pc ≤ PC (PC = number of possible combinations). |
| 12: | | | | | Economic dispatch (ED) solving for selected possible combination. |
| 13: | | End UC solving |
| 14: | | | | | calculation using Equations (3)–(6). |
| 15: | | | | | Refinery simulation using Equation (7). |
| 16: | | | | | calculation using Equation (8). |
| 17: | | | | | calculation using Equation (9). |
| 18: | | | | | DP: Storing strategy |
| 19: | | | | | pc = pc + 1 |
| 20: | | | | END While |
| 21: | END ITER |
| 22: | EC outputs (for every hour and whole period of study) |
| 23: | | Determining the most appropriate pattern of using energy carriers |
| 24: | | Import and export of energy carriers |
| 25: | | Cost of energy supply |
| END EC |
3.6. Experimental Setup
The proposed study is simulated on the mentioned energy network for a 24-h study period.
Genetic algorithm has been used as the optimization technique to solve the objective function. The number of chromosomes (population size) of the algorithm is equal to 50, the length of each chromosome is equal to 8, and the number of iterations is 50. The objective function has 8 variables. The 4 variables are related to the on or off status of power plant units and the other 4 variables are related to the amount of production of each of these units. In GA, the length of each chromosome is selected based on the number of problem variables. Therefore, the length of each chromosome is considered to be equal to 8.
4. Simulation Results
DP is done by storing the paths to the maximum number of hours of study modes. The correct strategy is the third case of combined units during the study period. The economic dispatch of electrical energy between the power plants units is specified in
Table 6. The need for energy carriers to provide final energy consumption over 24 h is given in
Table 7. The need for energy carriers in the entire study period is given in
Table 8. The export and import of energy carriers are shown in
Table 2 with respect to the domestic production of energy carriers.
UC is one of the important outputs of EC study, which determines the on/off status and output of units for each hour of the study period.
Table 6 presents the results of the UC. In this table, a power plant with zero production is off. The power plant with a production rate that has been determined is on. In the last column of this table, the value of the objective function for each hour of the study is presented.
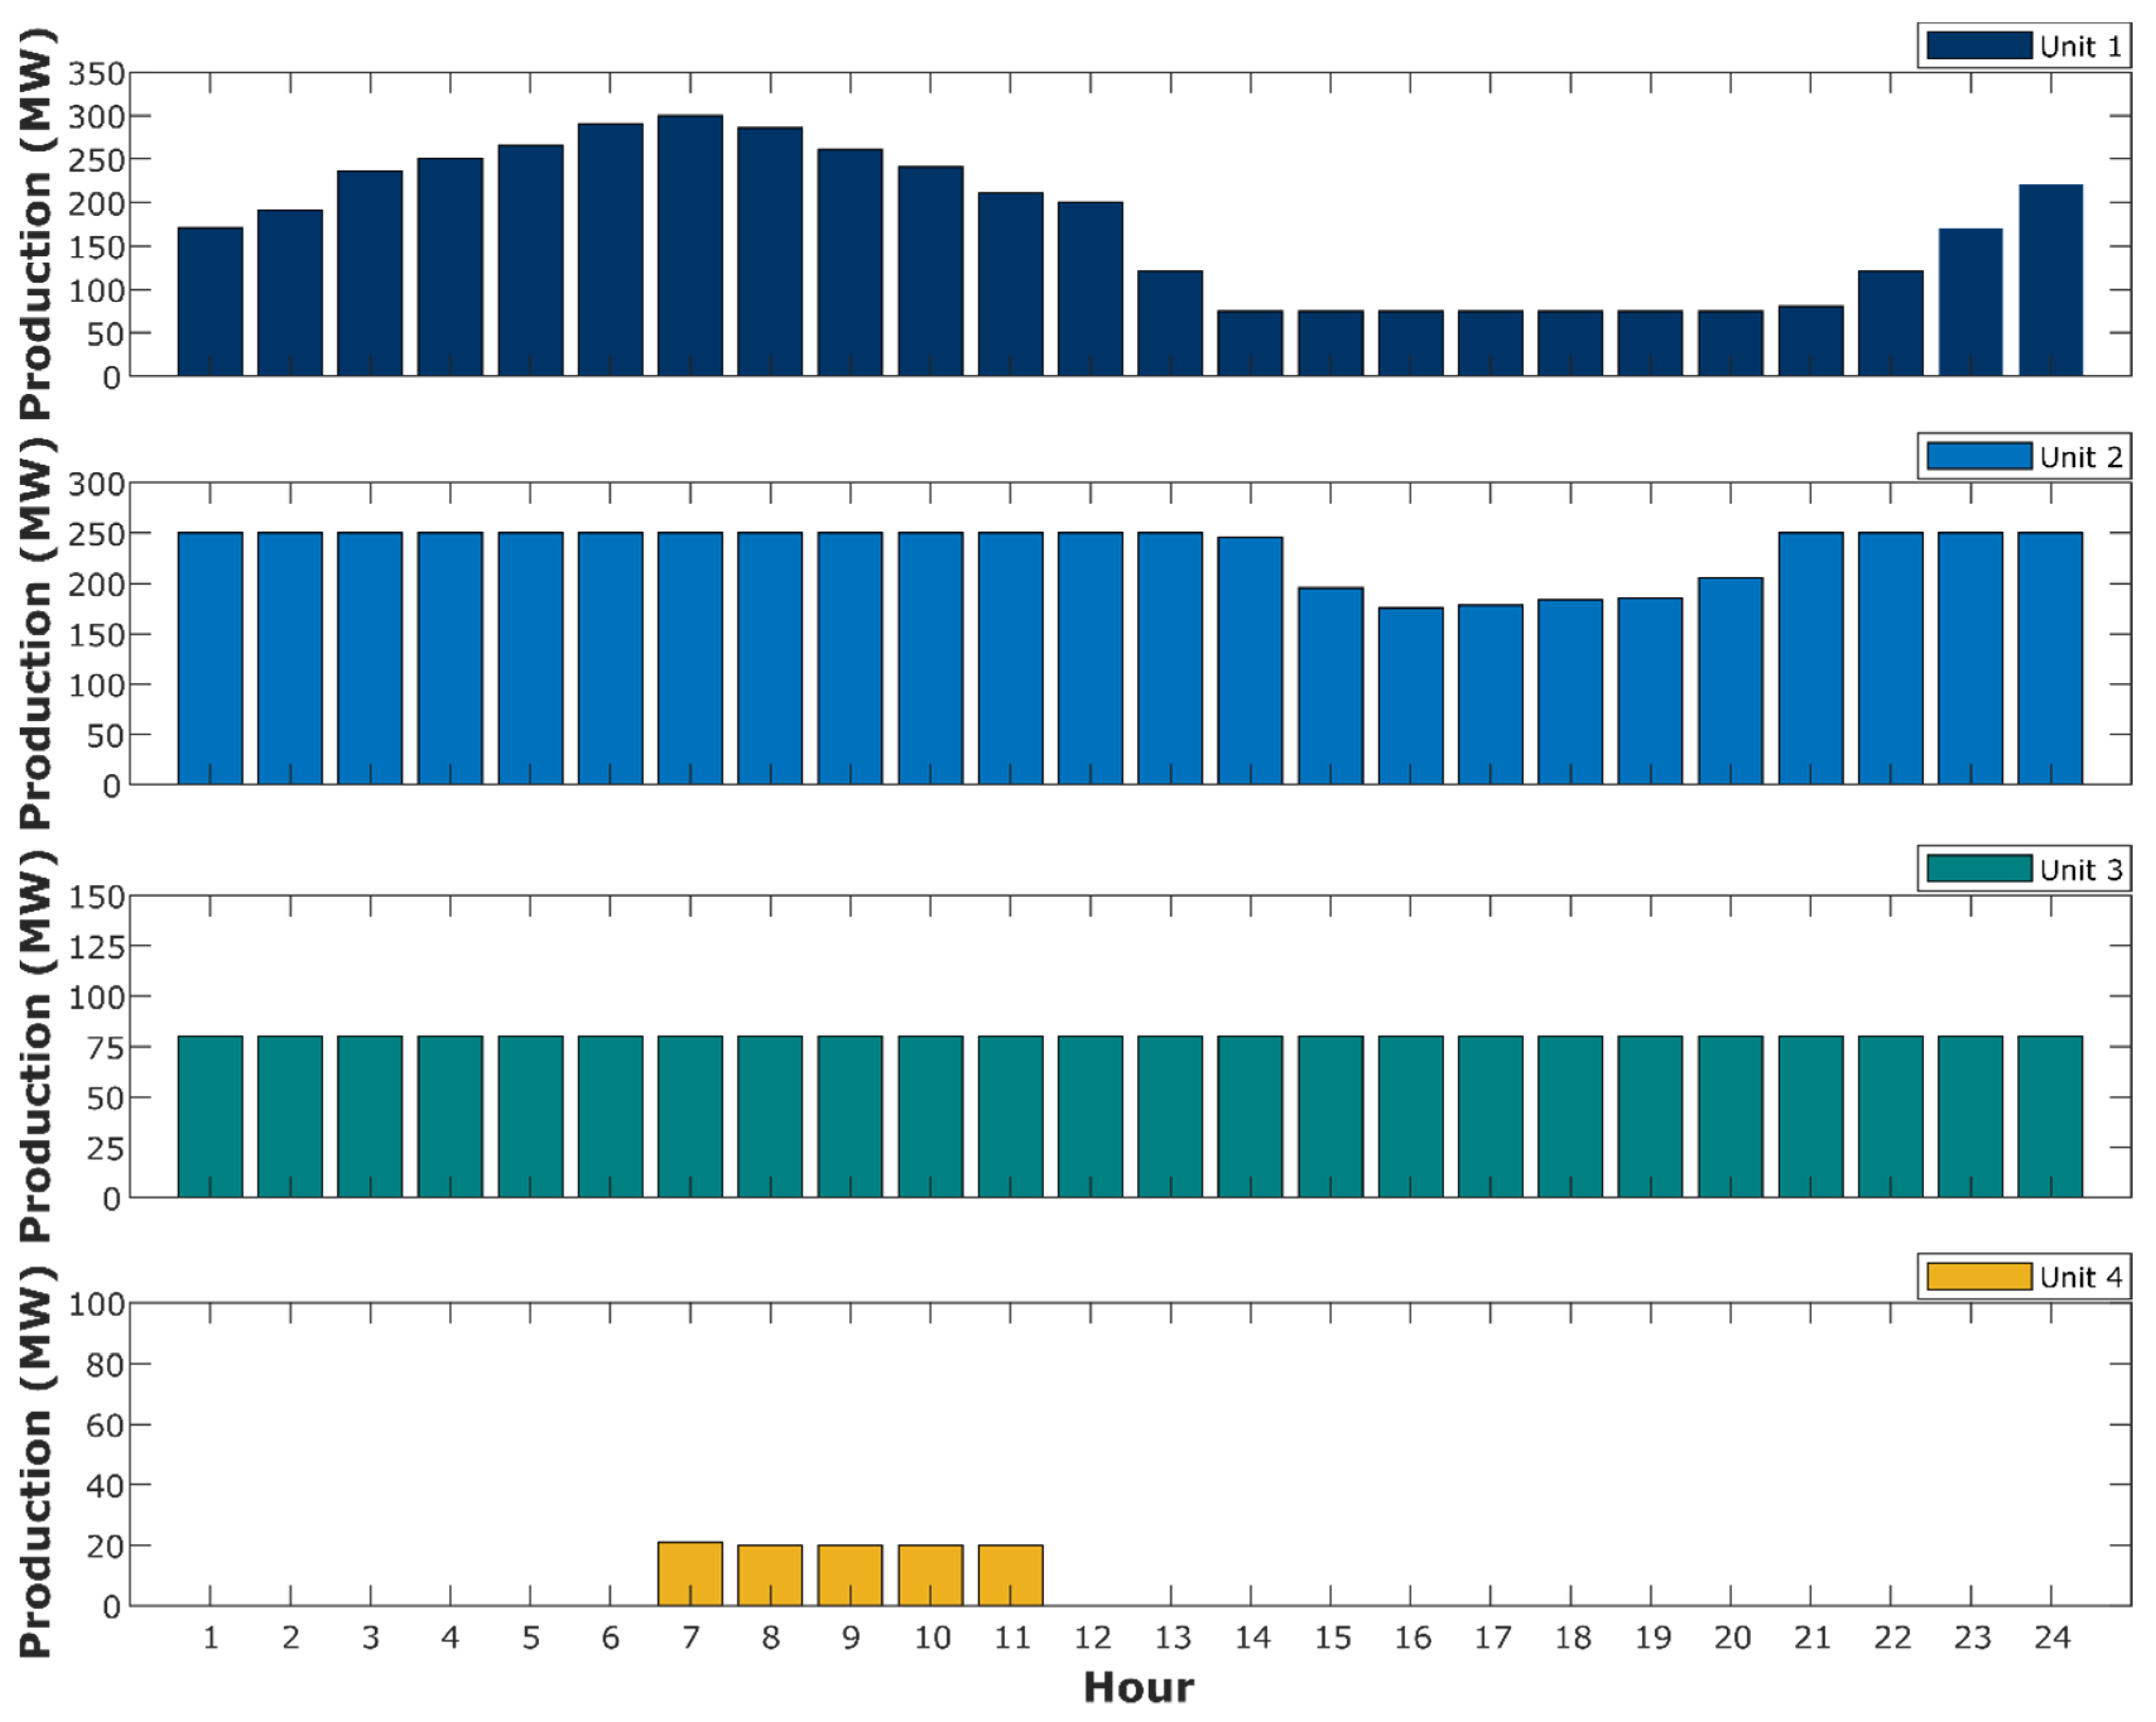
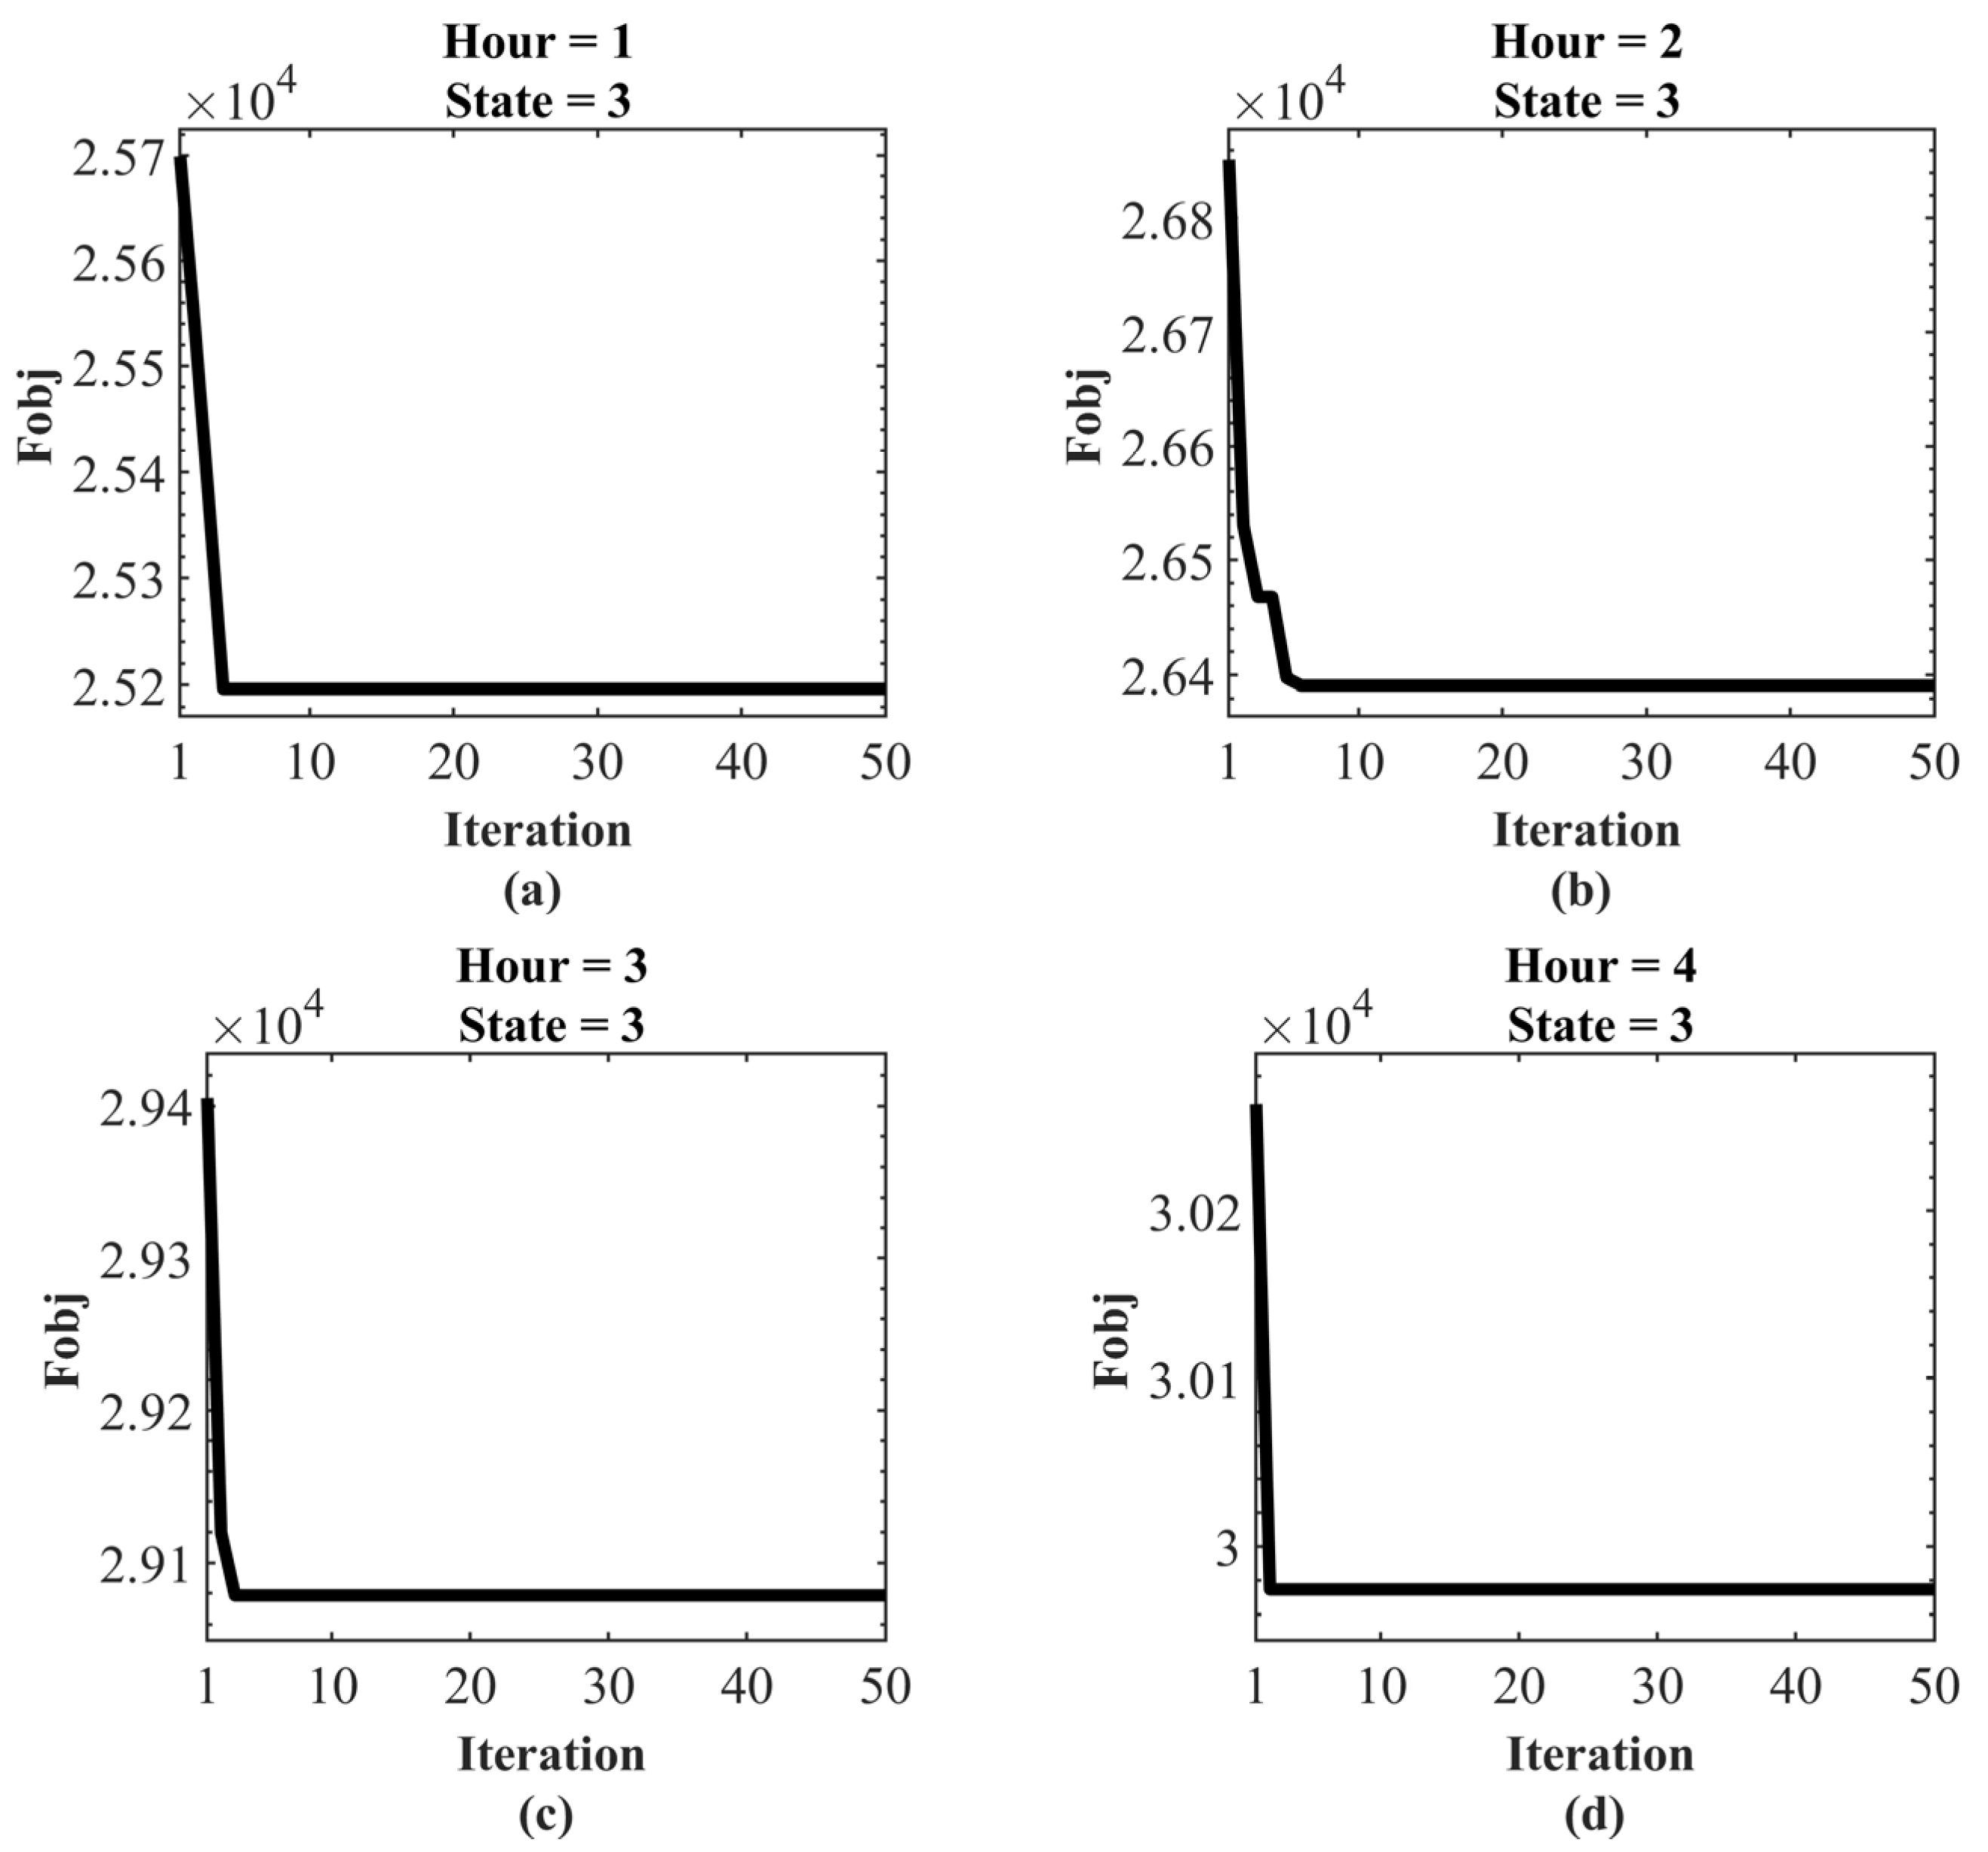
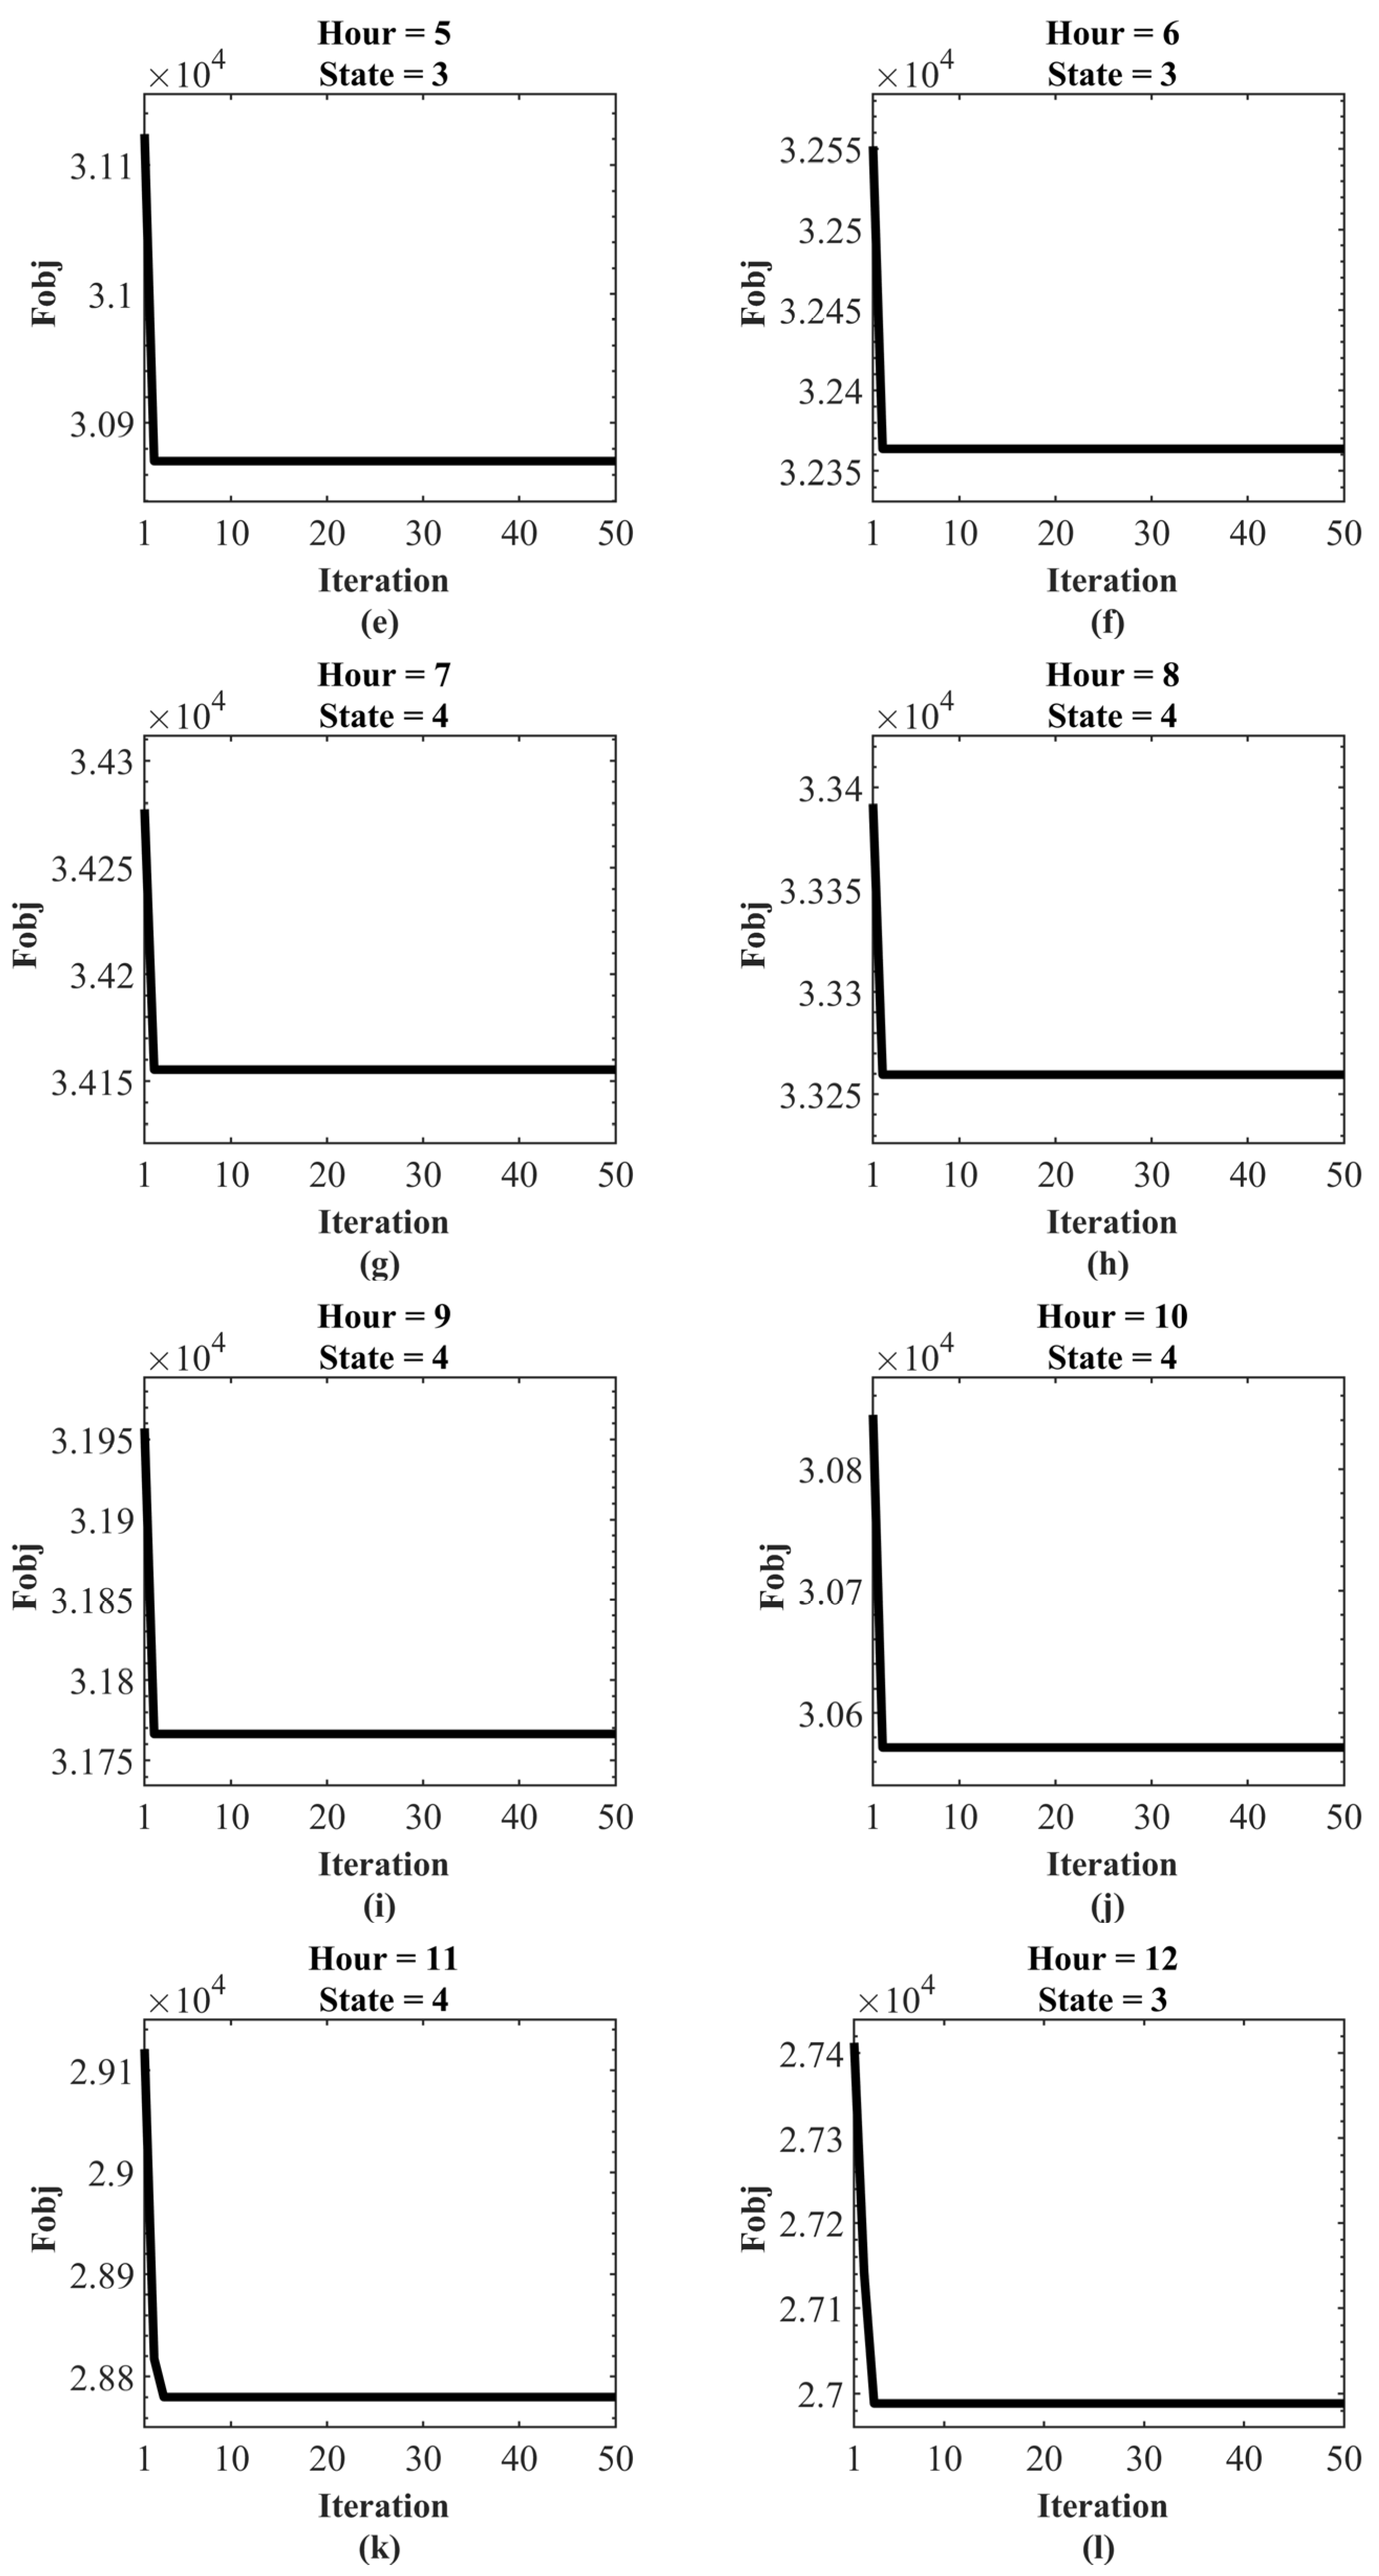
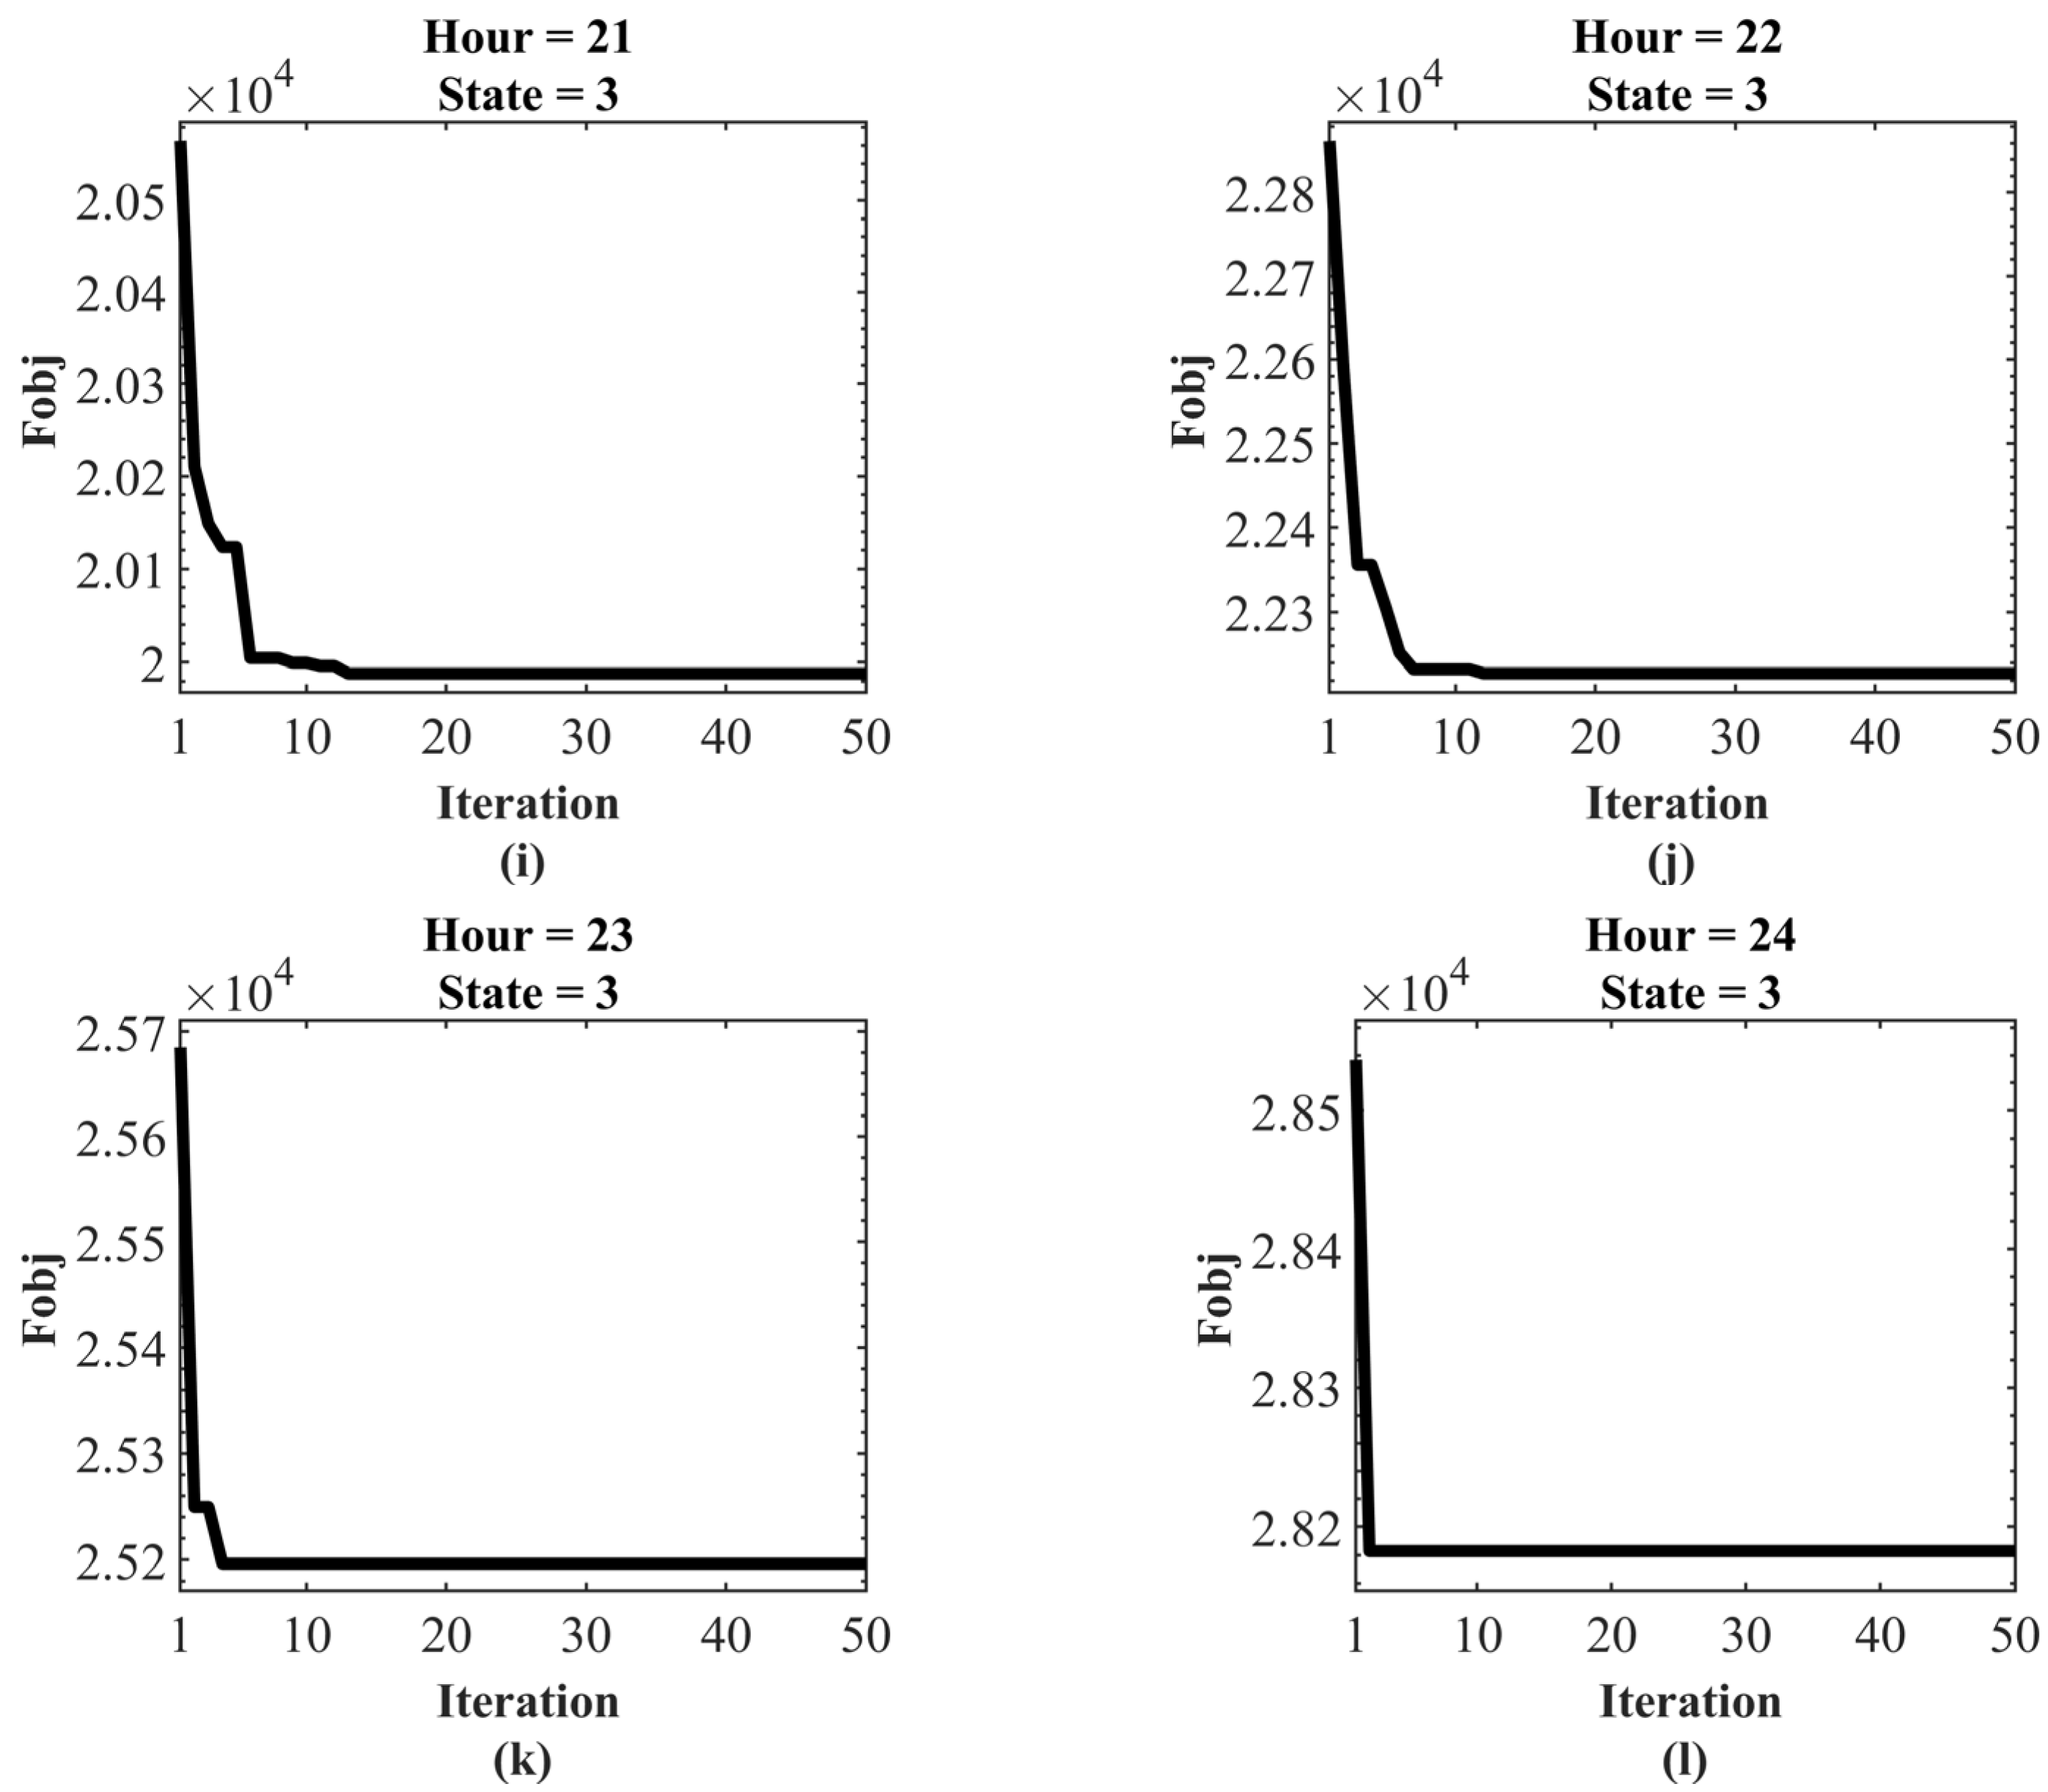
Figure 5 shows the production profiles of the different units for the entire 24-h period. According to this figure, in the seventh hour of the study period, which is related to the highest peak of demand, the fourth unit turns on and then, with the decrease of demand, shut down in the 12th hour of the study period. The processes of achieving an optimal distribution of electrical energy between the units are shown in
Figure 6and
Figure 7.
Figure 6 is for the first to twelfth hours of the study period and
Figure 7 is for the thirteenth to twenty-fourth hours of the study period. In these figures, the convergence curves of the performance of the GA in the optimization of the objective function are shown as the best solution in terms of the iteration of the algorithm. The “state” in these figures shows the number of power plants on.
Another important outcome of the energy commitment study is to determine the appropriate pattern of use of energy carriers, which is presented in
Table 7. In this table, the amount of need for nine energy carriers for each hour of the study period is specified separately. In this table, negative numbers indicate the excess of energy carrier production and positive numbers indicate the remaining need for energy carrier, which is supplied based on its domestic production.
Based on the amount of need for energy carriers per hour of the study period, the total amount of need for energy carriers for the entire study period can be calculated, which is presented in
Table 8. In fact,
Table 8 identifies the need for each energy carrier for the entire 24-h study period. The meaning of negative and positive numbers in this table is similar to
Table 7.
The need for energy carriers is identified in
Table 7 and
Table 8, which must be supply using domestic products. But if domestic production is not enough to supply each of the energy carriers, that energy carrier must be supplied in the form of imports. Energy carriers that have surplus production also enter the export sector. Accordingly, the export and import volumes of different energy carriers as another output of the EC study are presented in
Table 2.


 ,
, 


