Estimating Changes in Habitat Quality through Land-Use Predictions: Case Study of Roe Deer (Capreolus pygargus tianschanicus) in Jeju Island


Division of Environmental Science & Ecological Engineering, Korea University, 145 Anam-ro, Seongbuk-gu, Seoul 02841, Korea
*
Author to whom correspondence should be addressed.
Sustainability 2020, 12(23), 10123; https://doi.org/10.3390/su122310123
Submission received: 13 November 2020
/
Revised: 30 November 2020
/
Accepted: 1 December 2020
/
Published: 4 December 2020
(This article belongs to the Special Issue Development of Green Infrastructure Design for Sustainable Social-Ecological System)
Abstract
:This study predicts future land-use changes and the resulting changes in habitat quality, suggesting a method for establishing land-use management to ensure sustainable wildlife habitats. The conservation effects were verified in terms of wild animal habitat quality according to the designation of protected areas. Land-use change until 2050 was predicted using the Dyna-Conversion of Land Use Change and its effects (Dyna-CLUE) model for Jeju Island, Korea, and the change in the quality of roe deer habitats was predicted using the Integrated Valuation and Environmental Services and Tradeoffs (InVEST) model. Results indicate that, compared to 2030, urbanized area increased by 42.55 km2, farmland decreased by 81.36 km2, and natural area increased by 38.82 km2 by 2050. The average habitat quality on Jeju Island was predicted to decrease from 0.306 in 2030 to 0.303 in 2050. The average habitat quality ranged from 0.477 in 2030 to 0.476 in 2050 in protected areas and 0.281 in 2030 to 0.278 in 2050 outside protected areas. Habitat quality in protected areas was relatively high, and its reduction was limited. Areas with lower habitat quality need approaches such as expanding greenery and improving its quality. By establishing appropriate land-use plans by predicting habitat quality, wildlife habitats can be better maintained and protected, which is a primary goal of green infrastructure.
1. Introduction
Biodiversity is affected by habitat changes, invasive species, climate change, overuse of natural resources, disease spread, nutrient salinity loads, and contamination, among which habitat changes are considered the greatest threats to biodiversity [1]. Jeju Island, which is located in Korea, features high biodiversity, with 7800 species of animals and plants and a natural environment represented by the Halla Mountains, grasslands, the Gotjawal forest, the Oreum volcano, and caves [2]. A total of 4764 land animal species (7 amphibians, 14 reptiles, 4316 insects, 384 birds, and 43 mammals), 155 families, 698 genera, 1841 native plant species, 87 endemic plant species, and endangered wildlife exist in these areas. The biodiversity is excellent, with 122 species of protected wildlife [3].
Currently, the roe deer (Capreolus pygargus tianschanicus) is the only mammal living on Jeju Island; it was endangered in the 1980s due to poaching activities [4]. Many major habitats of roe deer are distributed over mid-mountainous areas (200–600 m above sea level); however, more than 16% of such areas have been urbanized, or are planned to be urbanized, with facilities such as tourist complexes (16 km2), golf courses (9 km2), amusement parks (11 km2), district unit planning areas (46 km2), and promotional district areas (10 km2) [5]. If the urbanization of Jeju Island continues, the roe deer habitats will be reduced and habitat conditions will further deteriorate owing to the island’s spatial restrictions, which may lead to the extinction of roe deer.
Land-use changes are related to various factors such as regional and ecological water cycles, socio–economic conditions, and policy changes; hence, modeling future land use changes is considerably complicated and it involves substantial levels of uncertainty [6,7,8].
Land-use change modeling is based on understanding the relationship between the spatial patterns of land use and the driving factors by using statistical techniques to examine spatiotemporal changes with respect to variations in socio–economic factors [8,9,10]. Based on previous research, the changes in land use and the economic impact of these changes can be ascertained by analyzing the correlation between social and economic variables, by studying the changes in agricultural and forest areas according to land use policies, or based on the changes in land use due to market fluctuations [9,11,12,13,14]. As a land-use change model, the Cellular Automata (CA) model is the most widely used model in spatial analysis research. Future land-use changes can be predicted by combining it with the Markov chain method [15,16]. The Markov method, which has been used in several studies, offers the advantage of calculating geographic information system (GIS) data based on digital images or grids to suitably reflect the changing trend of current land use [15,17]; however, the probability of transition remains constant and is applicable to all locations over time [18]. The CA model, which is a non-linear dynamic model, also has limitations when applied to different scenarios in terms of representing policies or socio–economic factors; this is because it continuously changes the adjacent grid by applying common changes in the time series results. On the other hand, the Dyna-Conversion of Land Use Change and its effects (Dyna-CLUE) is a model that can predict land-use changes by reflecting environmental and socio–economic changes [8,19,20,21,22].
Elderbrock et al. [23], Kim et al. [24], and Benedict et al. [25] defined green infrastructure as an interconnected network of spaces and natural areas that preserves the value and function of natural ecosystems and provide benefits to people and wildlife by maintaining clean air and water. In Europe, green infrastructure is defined as a strategically planned network of areas close to nature, including excellent natural areas designed to protect biodiversity and provide ecosystem services [26]. Green infrastructure is an expanded concept of existing green areas and ecological networks, and it is divided into conservation areas (hubs) and networks (links) [27]. Green infrastructure can afford various functions such as urban climate control, air pollution purification, improvement of water circulation, and provision of living spaces for living organisms.
The purpose of this study was to predict future land-use changes and resulting wildlife habitat quality changes. Based on the results, a method for establishing management directions for providing habitats for wild animals, a primary objective of green infrastructure, is proposed. In addition, the study aims to predict and verify the effects of designated protected areas in terms of habitat quality for wild animals. Thus far, studies focusing on changes in habitat quality according to the change in land-use have estimated changes from the past up to the present [5,28,29,30,31]. If changes in the habitat quality for wild animals can be predicted, it is possible to pre-allocate areas where habitat quality is expected to improve and be maintained as conservation-oriented areas, thereby preventing urbanization is such areas in advance. This will ensure a sustainable habitat for wild animals. This study is different from previous studies in that it predicts land-use changes and analyzes the changes in habitat quality for key species in the region, suggesting directions for land-use management to ensure the sustainable inhabitation of wild animals, before any damage to the habitats.
This study attempts to predict the land-use changes in Jeju Island until 2050 and analyze the resulting changes in habitat quality for roe deer. In addition, the study aims to verify the effectiveness of protected areas by analyzing changes in habitat quality by dividing them into areas within and outside protected areas. In addition, the trend of changes in habitat quality was analyzed by subdividing Jeju Island into watershed units. Based on this, we aim to establish a management direction for each watershed.
2. Materials and Methods
2.1. Site Description
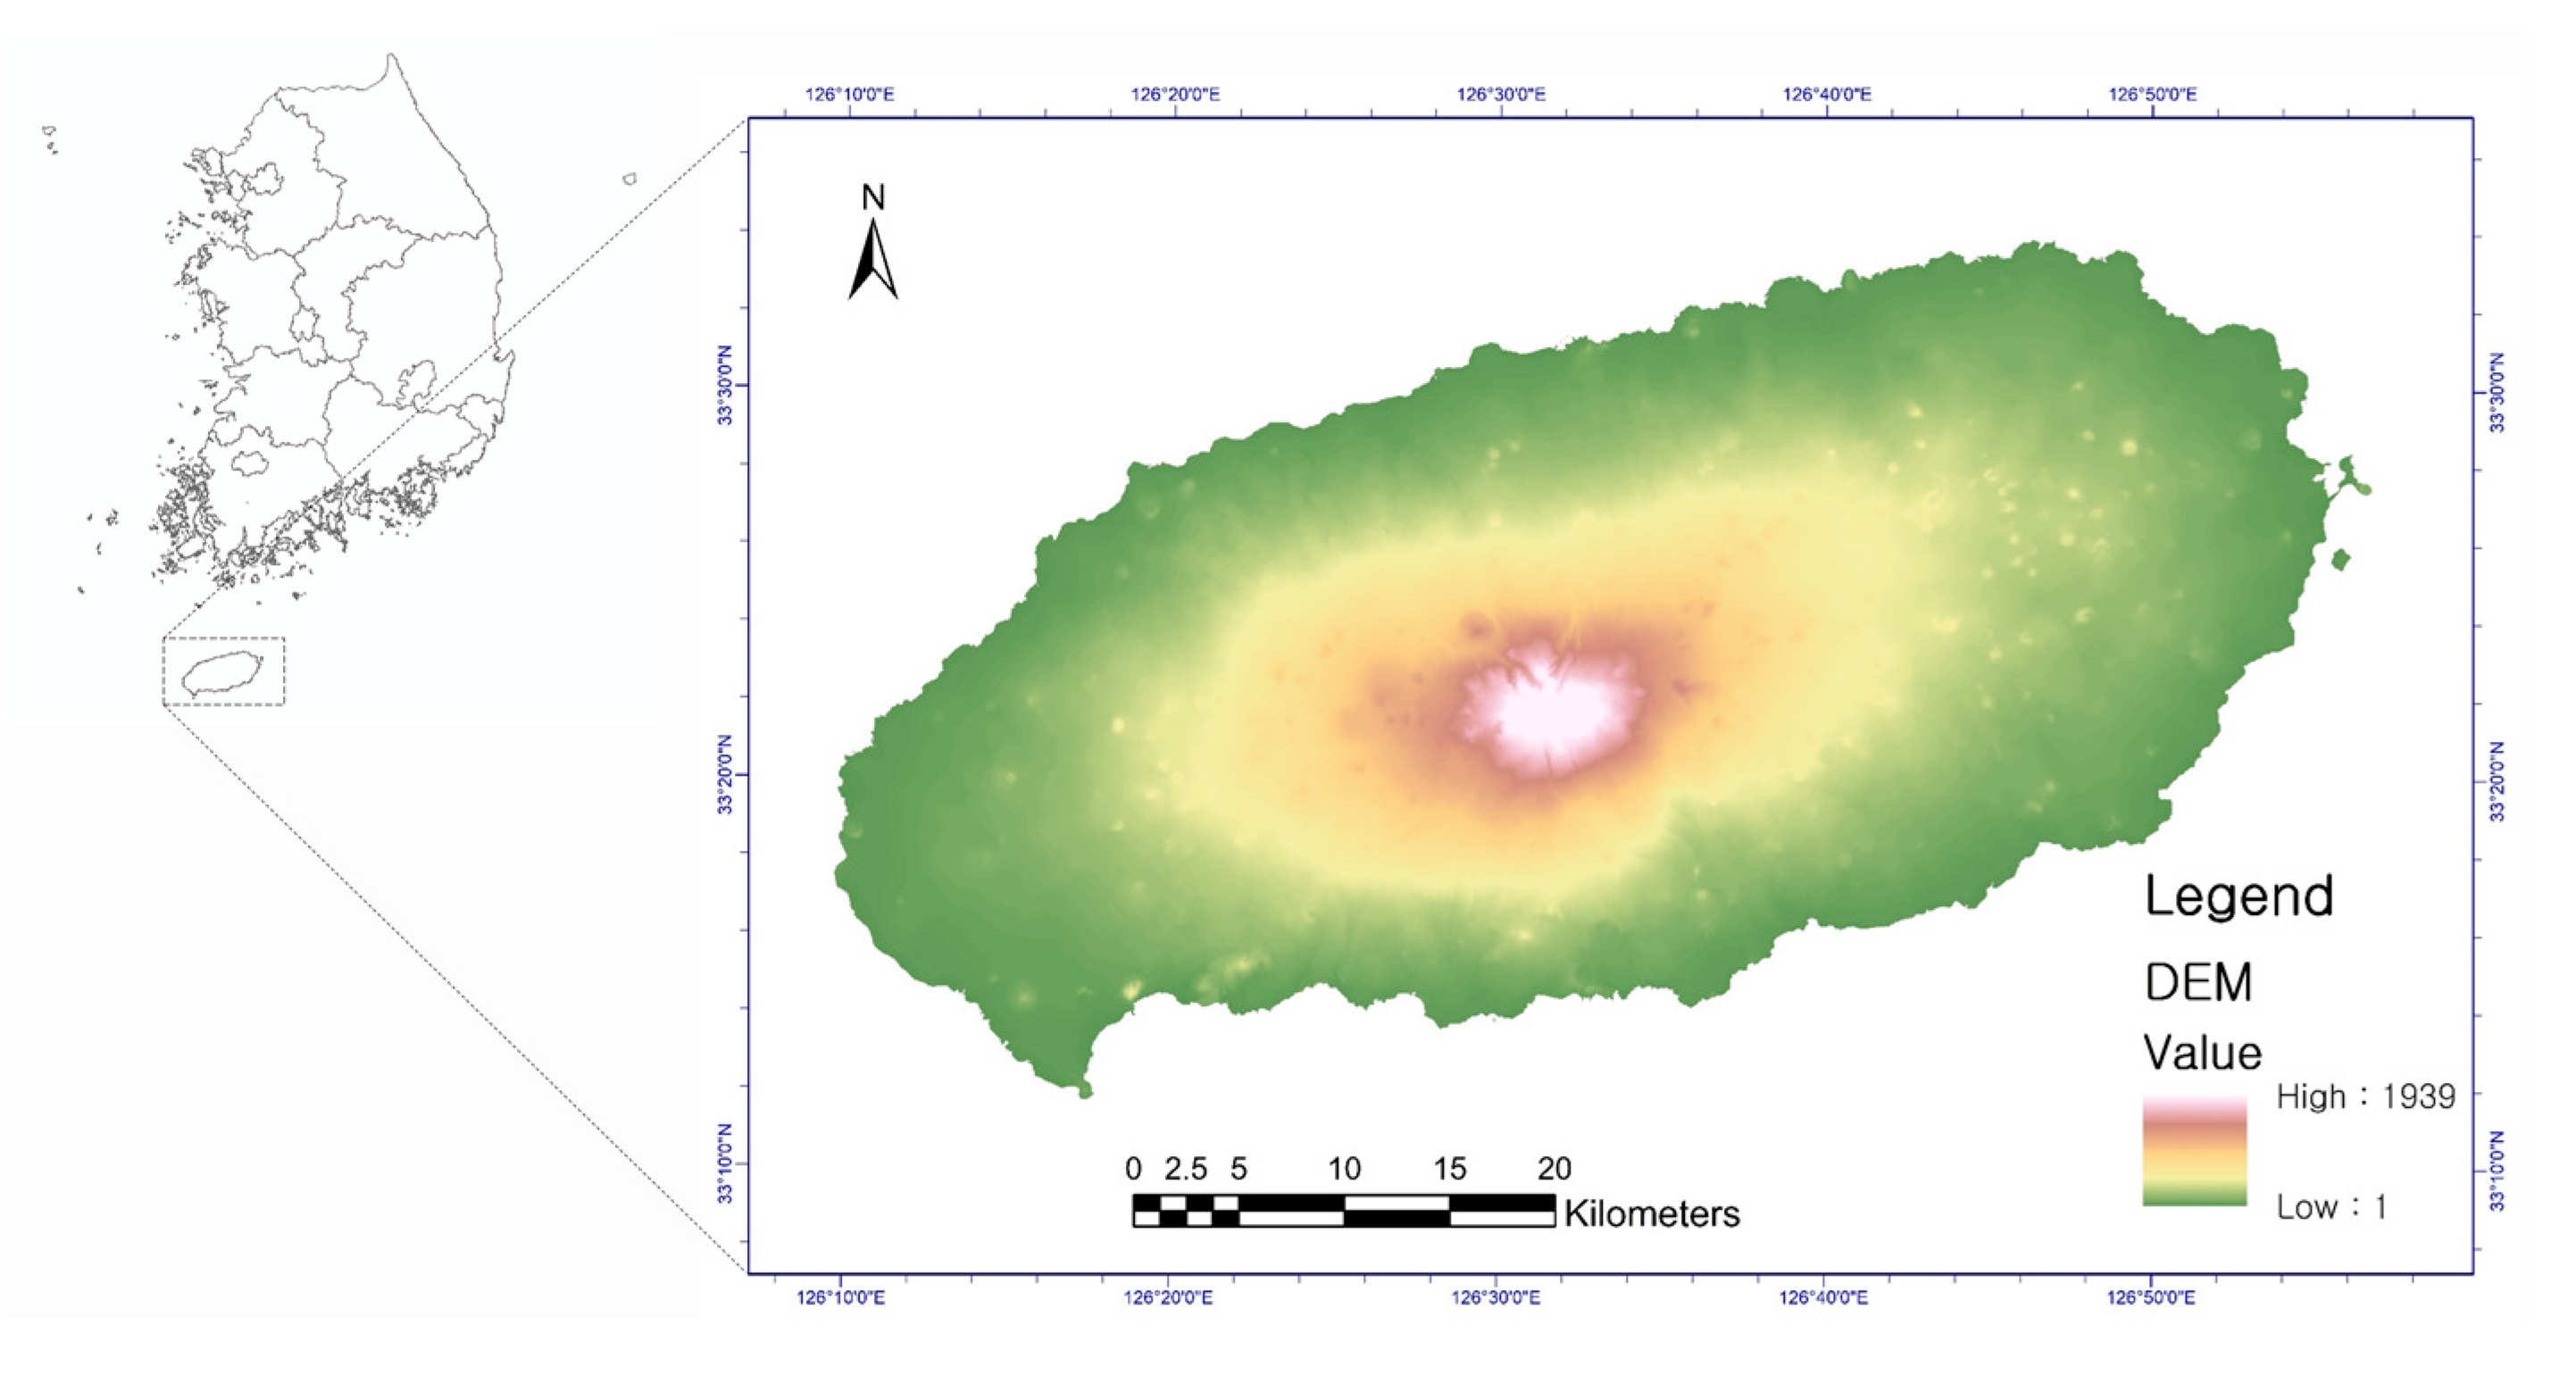
Jeju Island is the largest island on the Korean Peninsula. It is a volcanic island with an area of 1848 km2 (Figure 1). It was declared a UNESCO Biosphere Reserve in 2002, a World Natural Heritage site in 2007, and a Geological Park in 2010 [32]. From Halla Mountain (1939 m above sea level) at the center of the island to the coastal areas (0 m above sea level), the altitude gradually decreases; this region serves as a habitat for various species depending on the altitude. As such, Jeju Island is an area with high environmental and ecological protection value.
2.2. Target Species
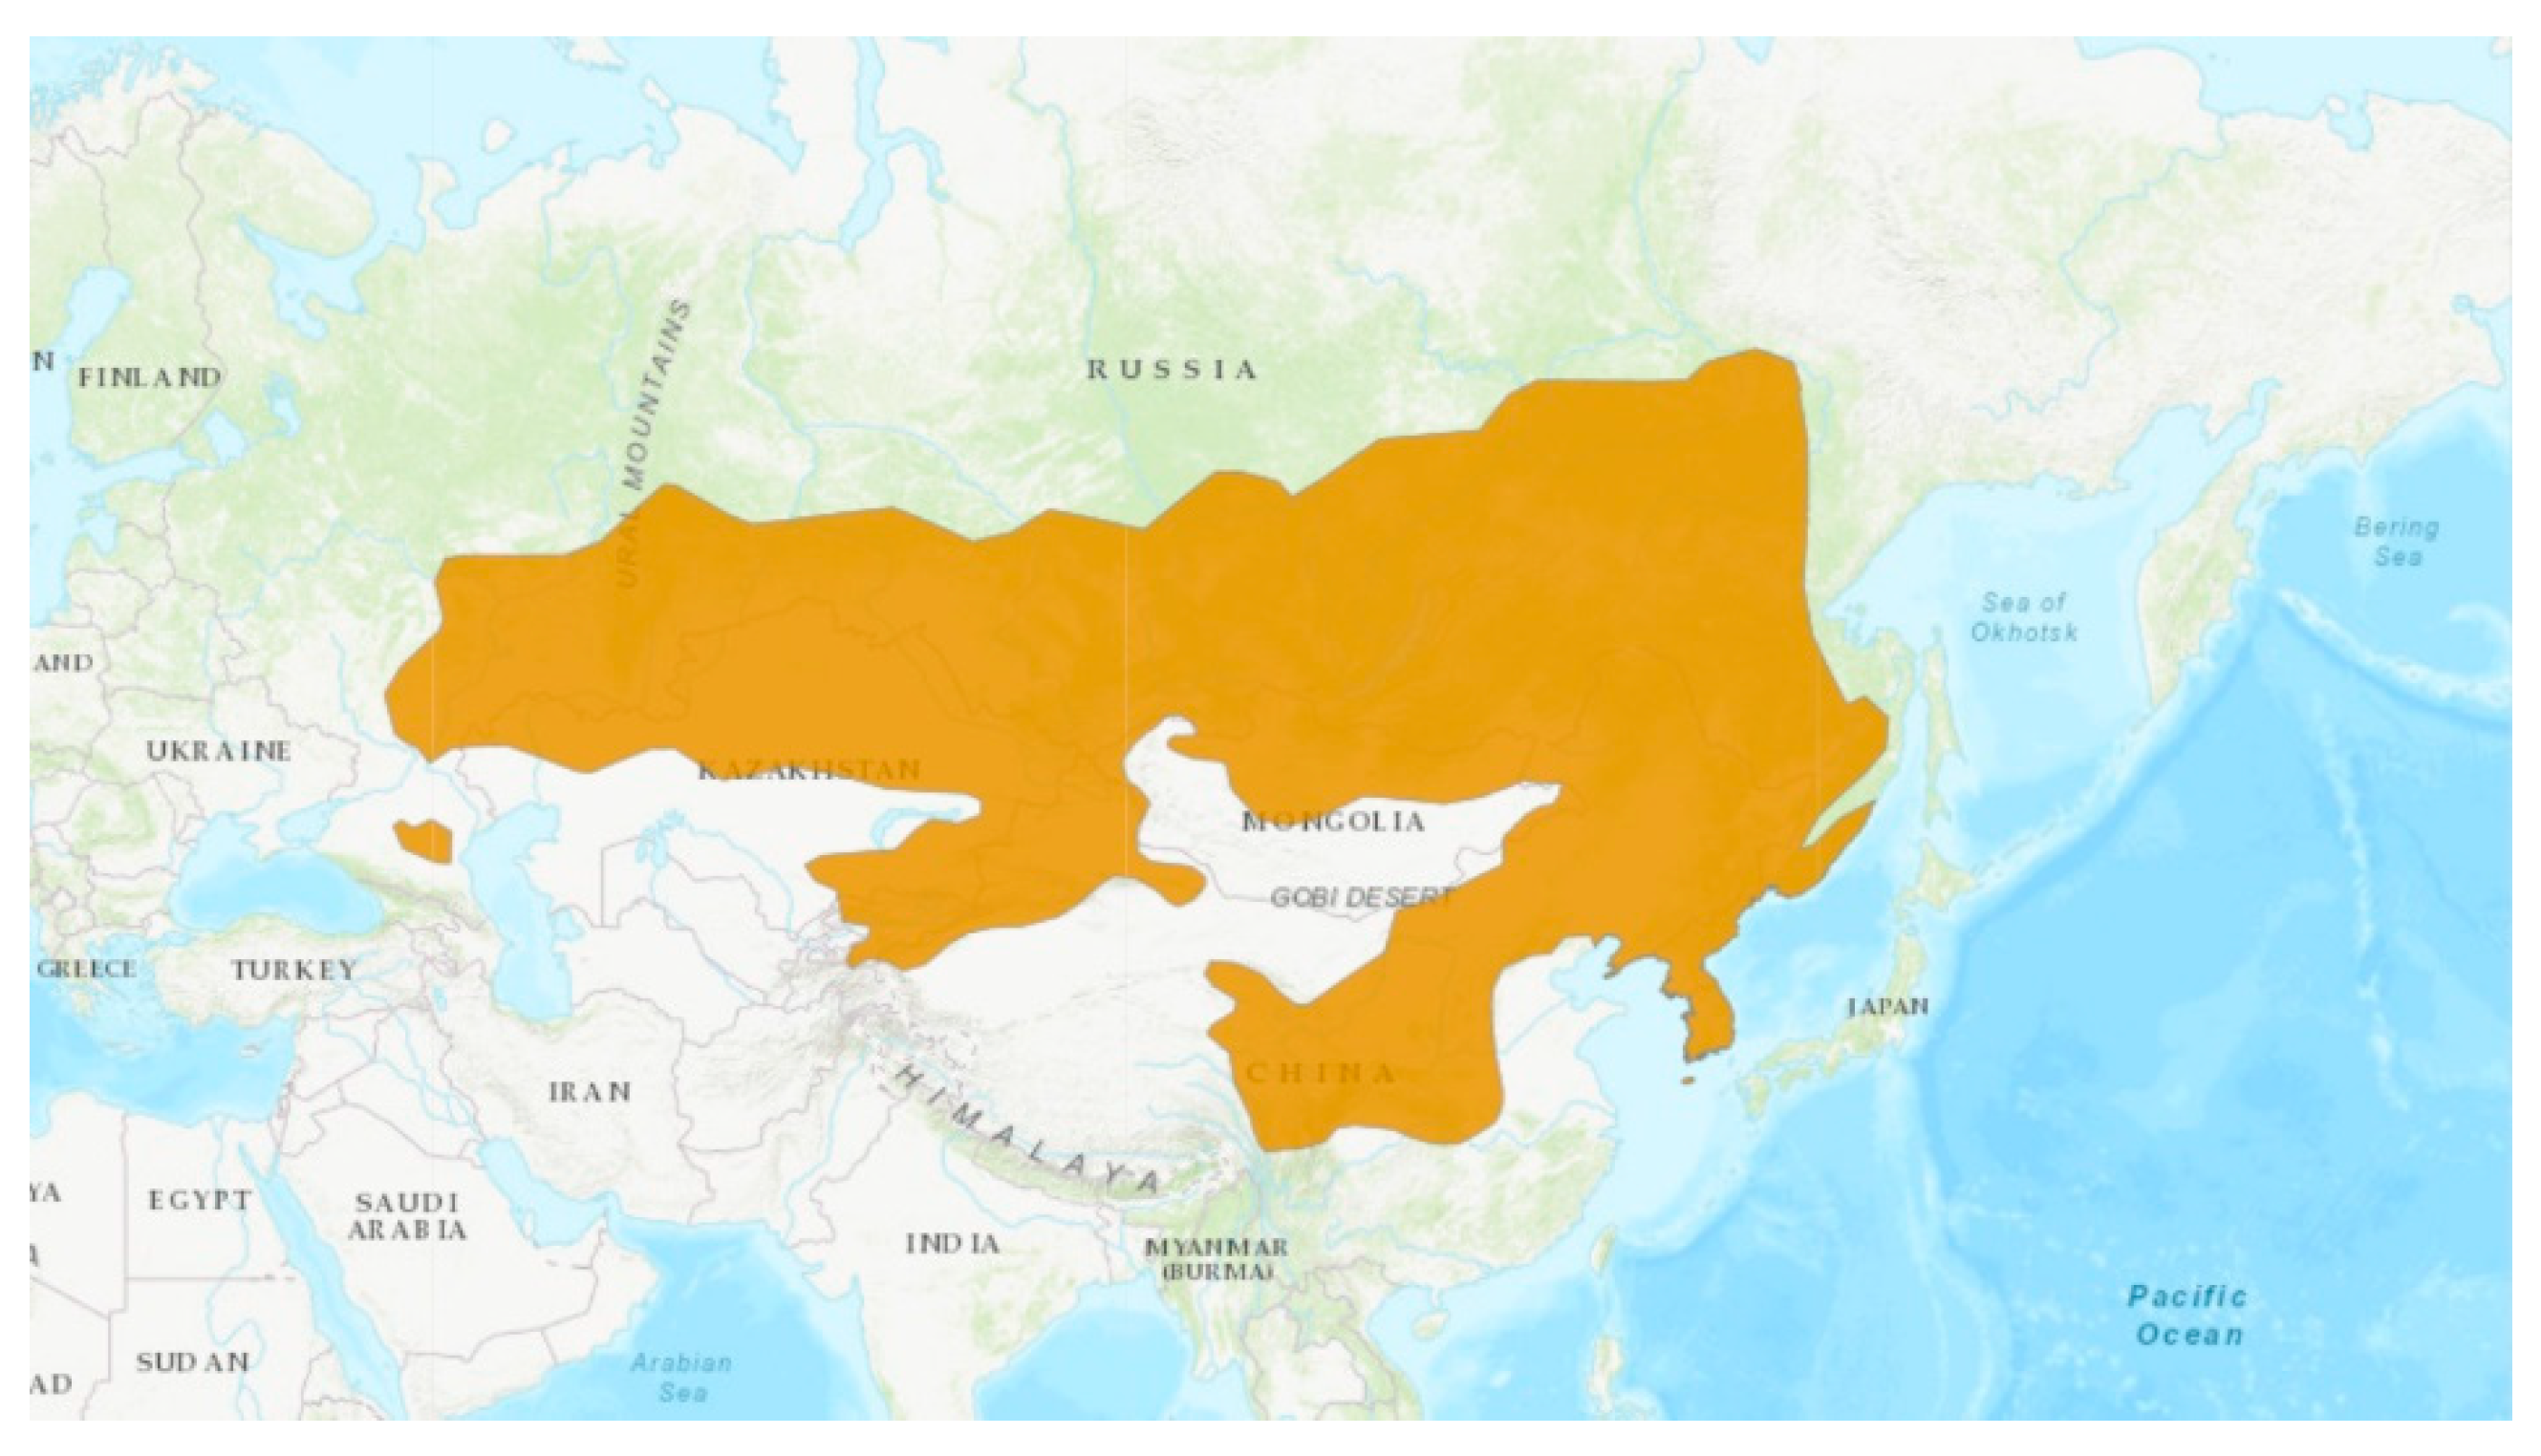
There are two species of roe deer: the European roe deer (Capreolus capreolus), which are widely distributed over Europe, and the Siberian roe deer (Capreolus pygargus), which are distributed across northern Asia [33], including parts of Siberia, Central Asia, Northeast Asia, and Jeju Island (Figure 2). Currently, their population and habitats are decreasing due to logging and hunting; hence, roe deer have been designated as a species of Least Concern (LC) by the International Union for Conservation of Nature (IUCN) [34], and thus, warrant continuous protection. Currently, Jeju Island is the only place in Korea where roe deer live.
2.3. Research Method
2.3.1. Prediction of Land Use Changes
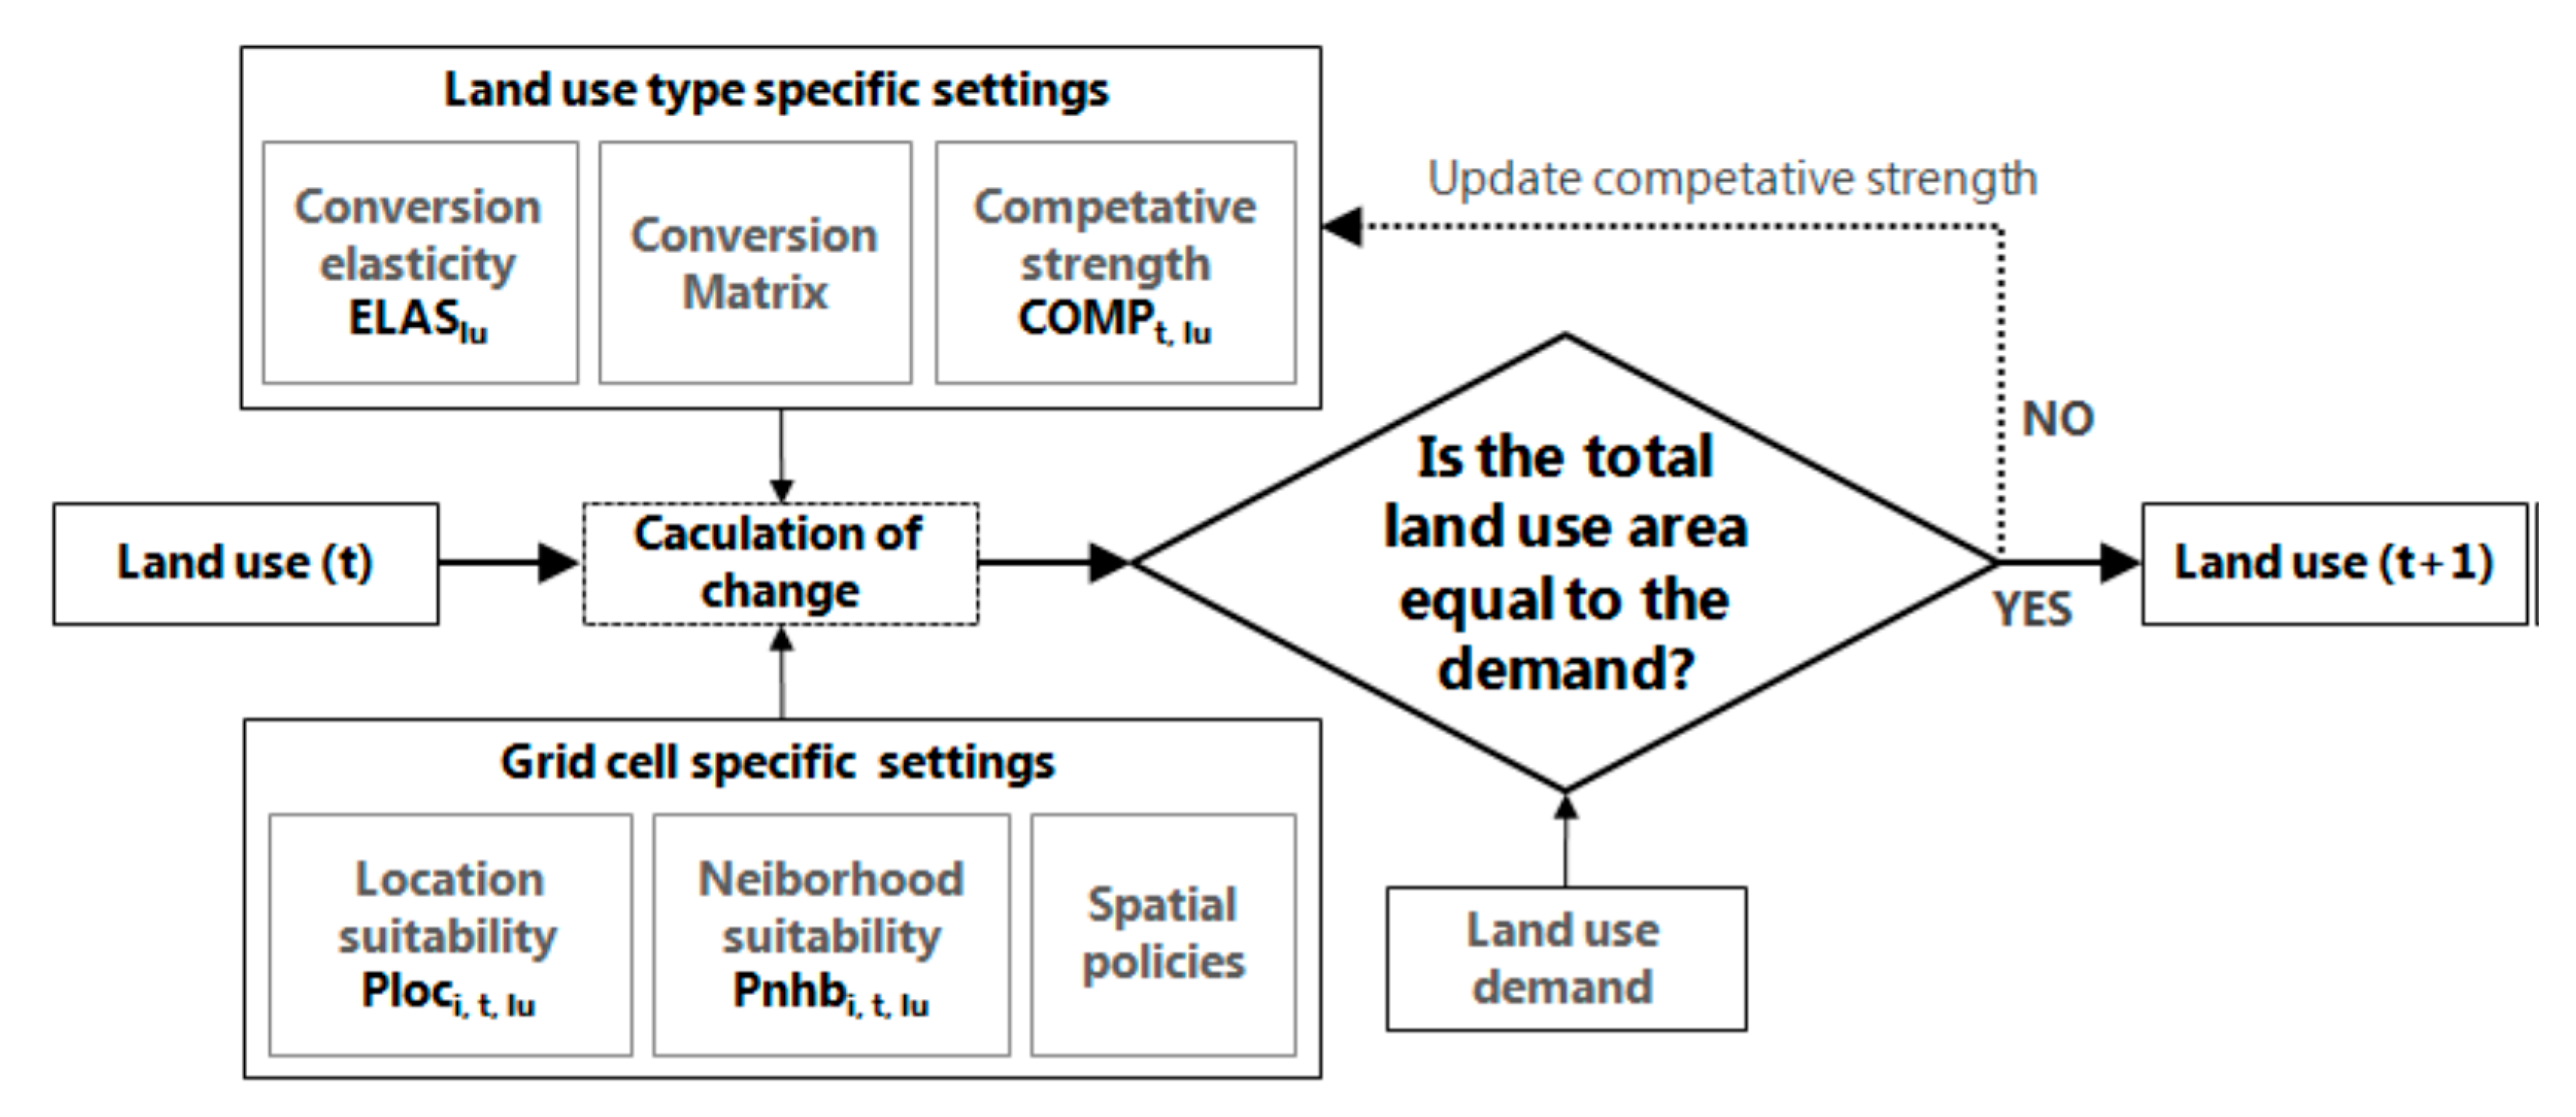
The Dyna-CLUE model was applied to predict land-use changes until 2050. The CLUE model is a land-use change model developed at the University of Wageningen in The Netherlands in 1996. It quantifies the empirical relationship between land-use and driving factors and dynamically simulates the changes in land-use over time and space [8,35]. It was later developed into the CLUE-S model and Dyna-CLUE model [36,37]. The Dyna-CLUE model simulates the changes in land-use through feedback processes that allocate land-use based on the relationship between land-use and driving factors. It also determines land-use changes with respect to the total land-use requirement, considering not only the relationship with the driving factors but also the relationship with the neighboring grids [19].
To drive the CLUE model, a reference map, land-use requirements, location characteristics, spatial policies, restriction data, and land-use type specific conversion settings are required.
The data for driving the land-use change model are shown in Table 1. Land-cover maps produced and distributed by the Ministry of Environment (ME) of Korea were used to calculate the land-use map and land-use requirements. Among the location characteristics data, the DEM provided by the Korea National Geographic Information Institute (NGII) was used as the topographic factor, and the soil map provided by the Ministry of Agriculture, Food and Rural Affairs (MAFRA) of Korea was used as the geological factor. For socio–economic factors, the land-cover map provided by the ME of Korea, digital topographic maps provided by Korea NGII, and the statistical yearbook provided by Jeju Special Self-Governing Province were used.
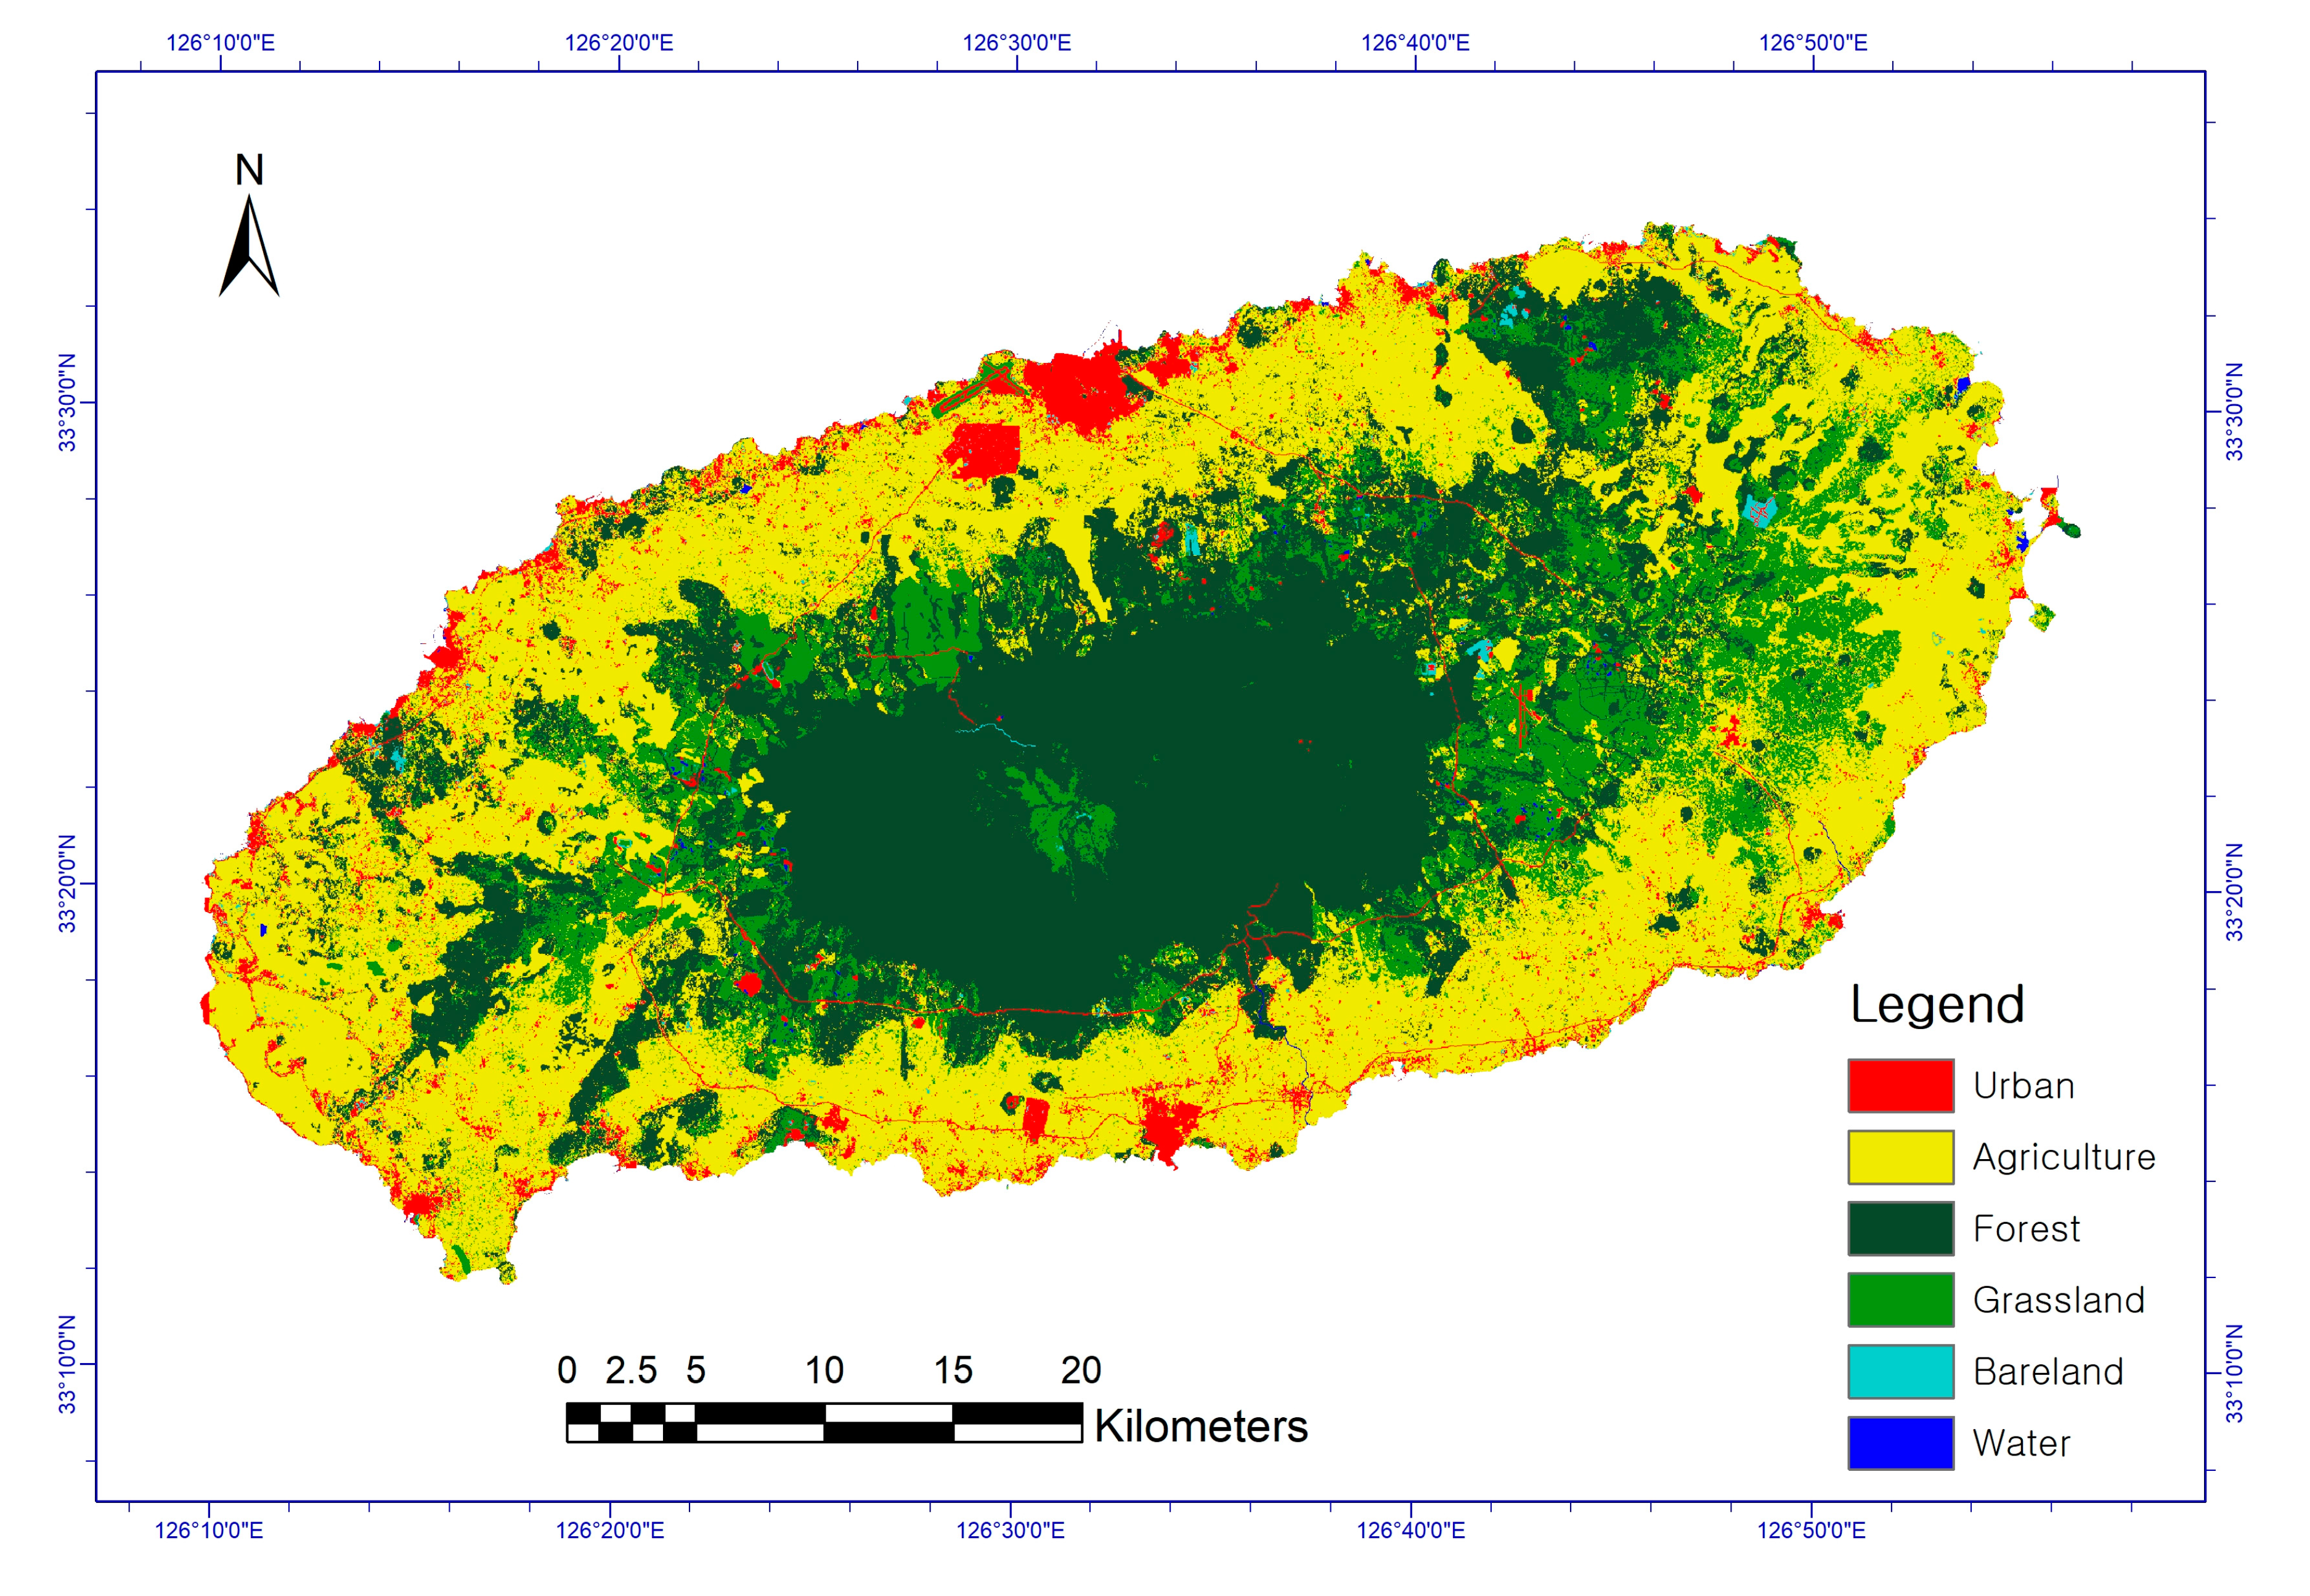
The reference map is a base map for simulating land-use changes, and in this study, the 2010 land-cover map provided by the ME of Korea was used (Figure 3).
Land-use requirements were based on the land-cover map produced by the ME of Korea from 1990 to 2020. According to the trend of change from the past to the present for each land-cover type, the rate of change from the base year (2010) to the land-use area until 2050 was calculated.
Data regarding the location characteristics were obtained based on the relationship between land-use and the land-use change factors, or with the use of the surrounding land. The relationship between land-use and the land-use change factors is represented by a binary logistic Equation (1).
here, . is the probability that the land-use of grid i will change, is the land use change factor, and is the regression coefficient for each land-use change factor [8].
Land-use change factors include biophysical factors such as soil, climate, topography, and socio–economic factors, including population, technology, political structure, and economic conditions [36]. In this study, topographical factors such as elevation, slope, and aspect; geological conditions such as effective soil depth, drainage grade, soil character; and socio–economic factors such as distance from streams, distance from roads, distance from cities, distance from the sea, and population density, were set as factors determining the land-use changes (Table 2). The relationship between land-use and the land-use change factors was analyzed based on the current land-cover map. The regression analysis results between each land-use and the land-use change factor were verified based on the Area Under the Curve (AUC) value through Receiver Operating Characteristic (ROC) analyses. ROC analyses are widely used to evaluate the performance of a model [38]. The AUC value lies between 0.5 and 1.0, and the closer it is to 1, the more descriptive the model is [39]. When the AUC value is 0.7 or higher, the model’s descriptive power is considered appropriate [40].
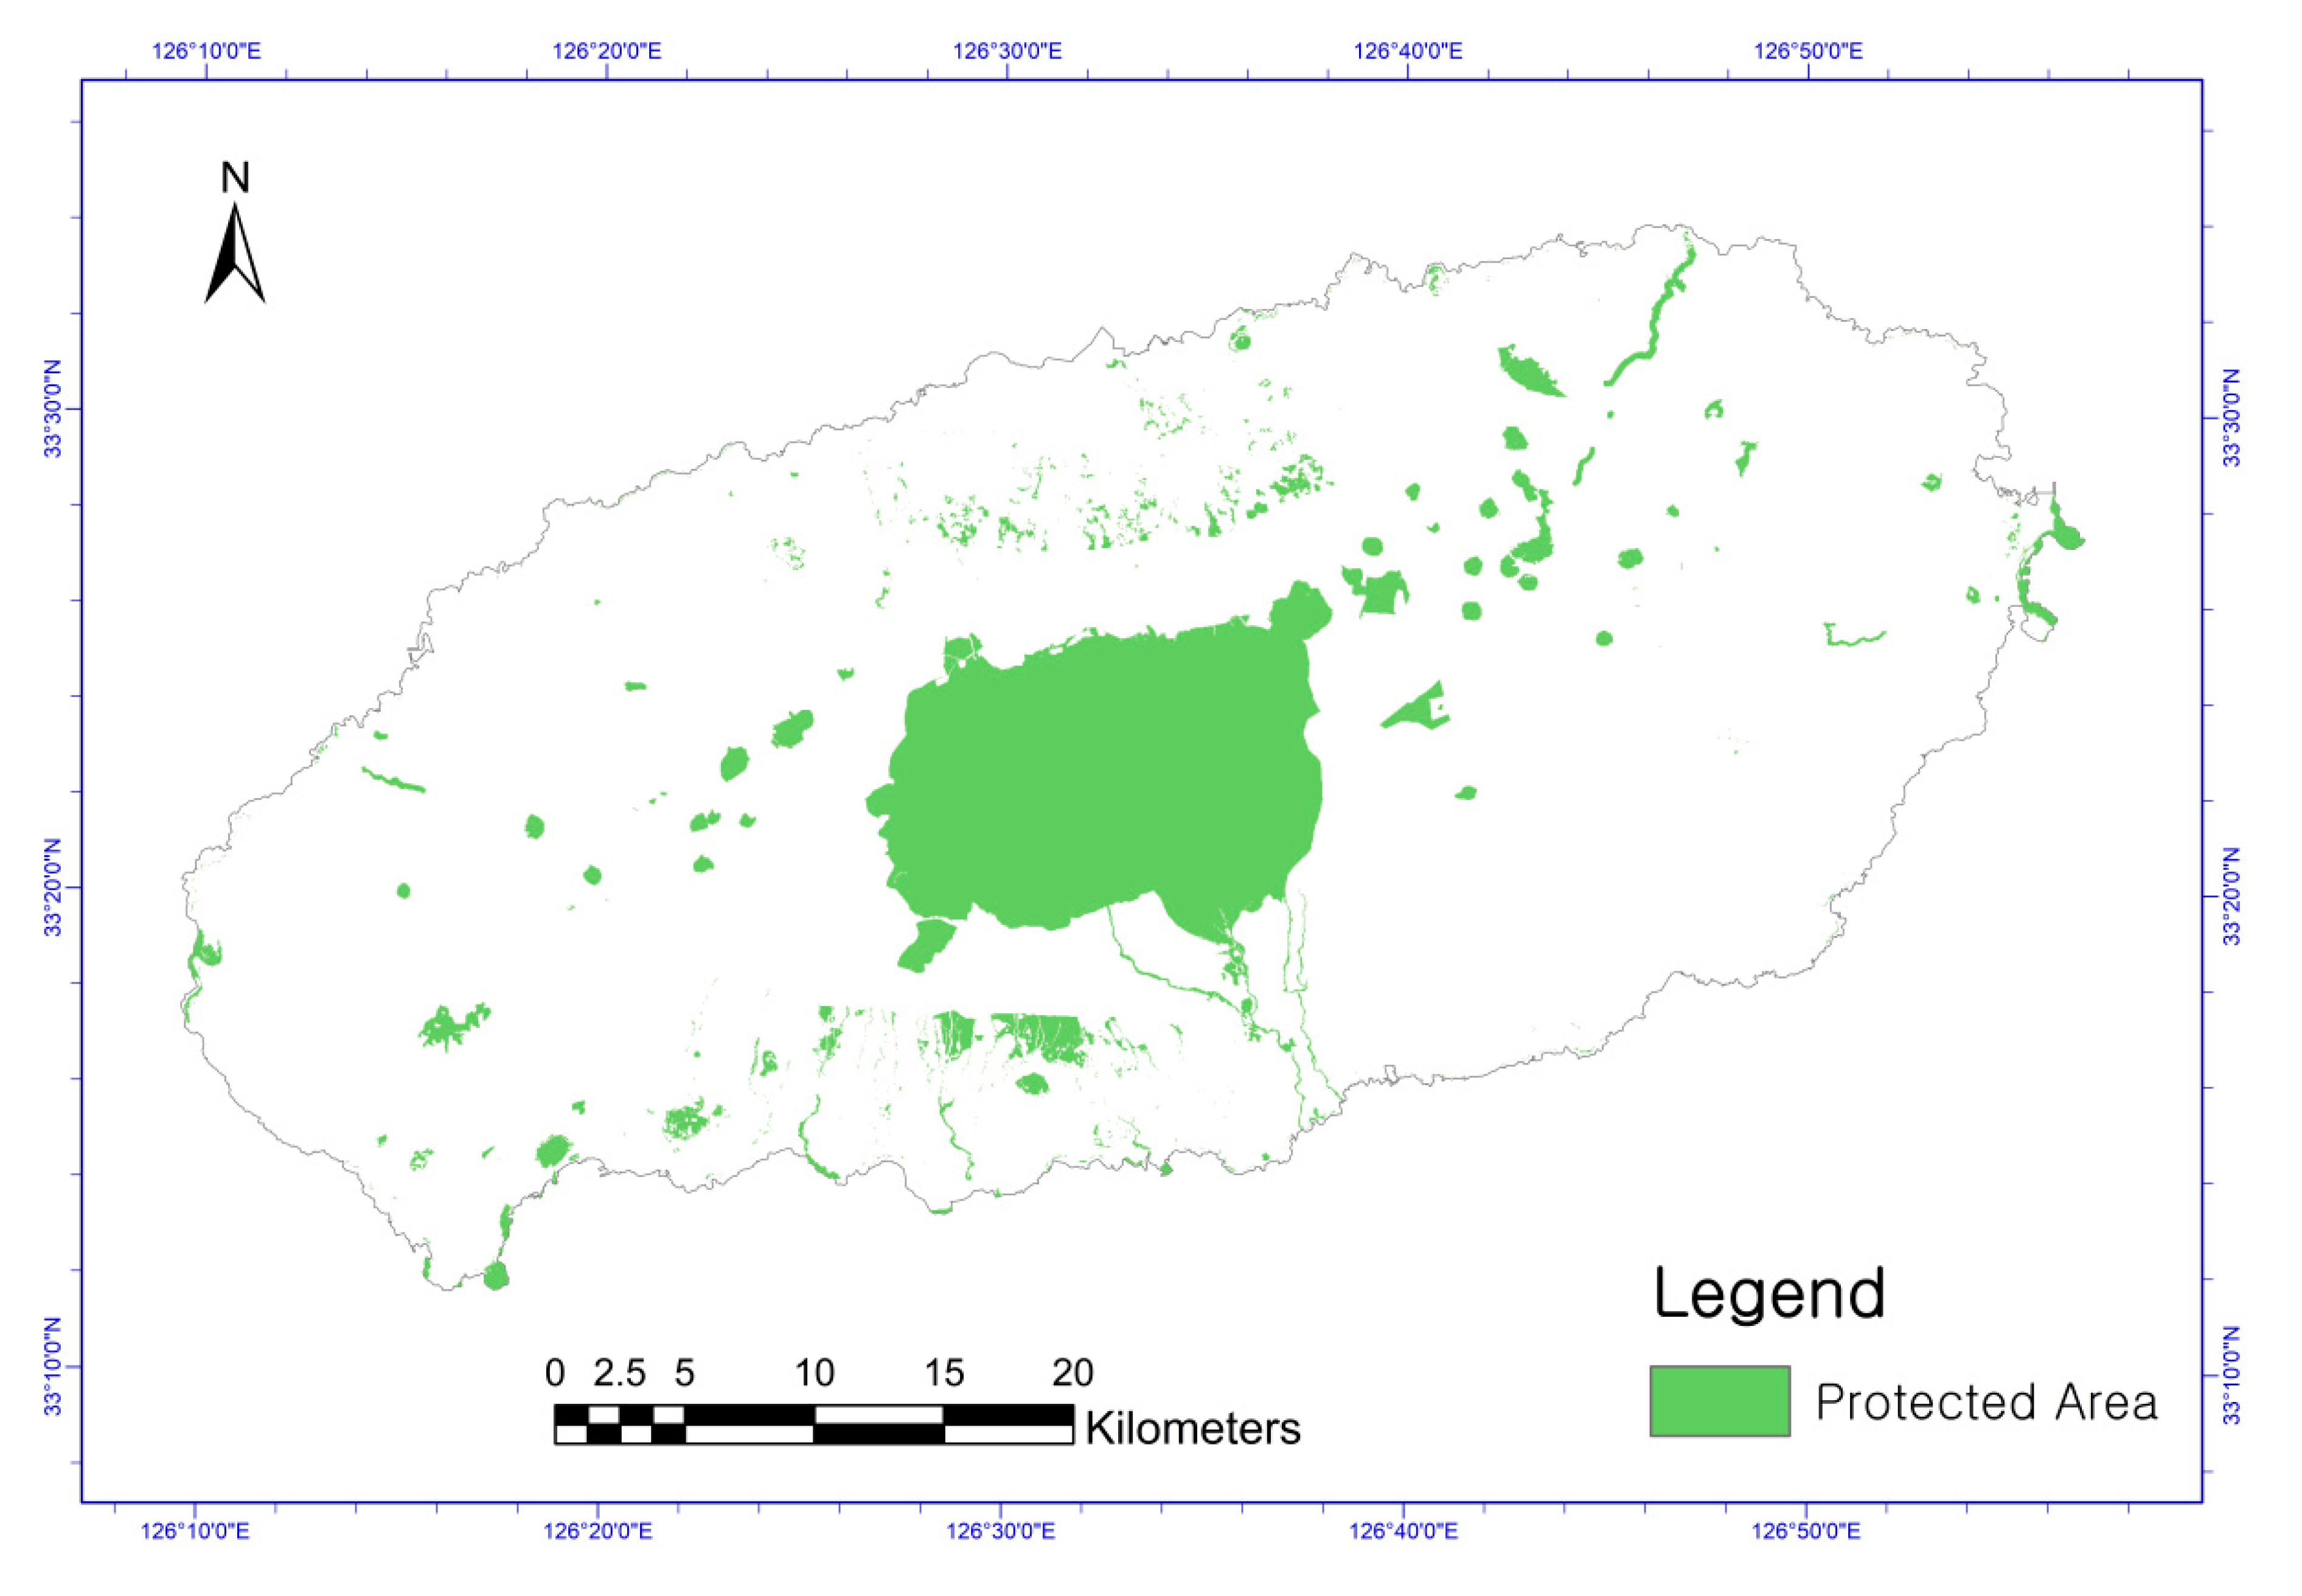
As spatial policies and restriction data, protected areas data were used (natural parks, natural monuments protected areas, wetland protected area, and public forest) (Figure 4).
Specific conversion settings of the land-use type are used to determine the conversion elasticity and conversion matrix. Conversion elasticity is a coefficient that quantifies the degree to which conversion can occur for each land-use; it has a value ranging from 0 to 1. The closer the value is to 1, the lower is the probability of conversion. The conversion matrix determines whether a conversion is possible for each land type; it can have a value of 0 or 1. A value of 0 means that no conversion between land uses is possible, whereas a value of 1 means that conversion is possible. The conversion elasticity was established by analyzing the degree of change with respect to land-use type between 1990 and 2020 (Table 3). Compared to other land-use types, the changes in bare land were relatively more numerous; bare land had the highest conversion probability (0.2), followed by farmland (0.5), grassland (0.7), forest (0.9), urban area (0.9), and water body (1.0), respectively.
The conversion matrix distinguishes whether conversion is possible for each land type and has values of 0 and 1. The conversion matrix was established by analyzing the changes in land-use types over the last 30 years (Table 4). For instance, in the case of farmland, changes from farmland to other land-use types over 30 years were analyzed, and the land-use type to which the farmland was converted was set as the convertible (1); if it was not converted to any other land-use type, the value in the conversion matrix was set as 0. The urban, forest, grassland, and bare land were set up using the same approach. As the water body was assumed to remain unchanged, it was set that only water body could be converted.
Land-use allocation is determined through the following Equation (2):
here, is the total probability that land-use lu exists in grid i, . is the location fit probability according to the land-use change factor, is the probability of fit according to the surrounding grid, is the transition characteristic value, and is the competitive advantage value.
The land-use with the highest total probability is allocated for each grid, and the value of is repeatedly calculated depending on whether the land-use demand for each land-use is satisfied (Figure 5).
Land-use changes were predicted from 2020 to 2050. The predicted land-use map for 2020 was analyzed for accuracy by cross-validating with the 2020 land-cover map produced by the ME of Korea.
2.3.2. Analysis of Change in Roe Deer Habitat Quality According to Land-Use Change
The InVEST model was used to analyze the changes in quality of roe deer habitats. The InVEST model is one of the most widely used models owing to its high field applicability and user convenience; it has been applied in many studies [5,28,29,30,31]. It is a suitable tool for analyzing changes in the quality of habitat in terms of ecosystem service evaluation items, tradeoff analysis, economic valuation, stakeholder engagement, flexibility, and user convenience.
Among the InVEST models, the habitat quality assessment model relies on the proximity of habitats to human land-use and the intensity of land-use [41,42]. Habitat quality is affected by habitat suitability, threats due to habitat quality reduction factors, habitat sensitivity to reduction factors, and access to the habitat. The habitat quality is expressed as a value between 0 and 1; the higher the value, the higher the evaluated quality of the habitat is [43].
The formula for calculating habitat quality is as follows (3) [44]:
here, Qxj is the habitat quality of grid x in habitat type j, and habitat suitability Hj represents the degree of suitability as a habitat for different types of habitats. The value of habitat suitability ranges between 0 and 1. The larger the value, the higher the suitability is. Dxj refers to the degree of reduction in the quality of the habitat in grid x and habitat type j; k is a half-saturation constant, which is half of the maximum reduction degree, and z is a normalized constant (usually 2.5).
By reviewing existing references [4,5,28,29,30,31], the threats to habitats, maximum impact distance, and weights for each factor were derived (Table 5). The main threats to the Jeju roe deer were urban land, farmland, and bare land, which can be termed human activity areas. The roads were designated as a separate threat category, especially because roads were the biggest threat due to accidents with vehicles. According to [4], the maximum impact distance for each factor was set to 200 m, by investigating the response of deer with respect to distance. The averages of the values presented in existing references were used as the weights.
In addition, habitat suitability was calculated based on the rate of discovery of individual roe deer and the habitat traces for each habitat type surveyed in existing reports [45]. Habitat sensitivity was used as the average of the values presented in existing references [5,28,29,30,31] (Table 6).
To classify the degree of accessibility to the habitat, the designation of protected areas was used. It was applied differentially from 0 to 1 according to the degree of legally protected area designation for each grid. The change in the habitat quality for Jeju roe deer from 2030 to 2050 was analyzed.
2.3.3. Spatial Management for Improving and Maintaining Roe Deer Habitats According to Land-Use
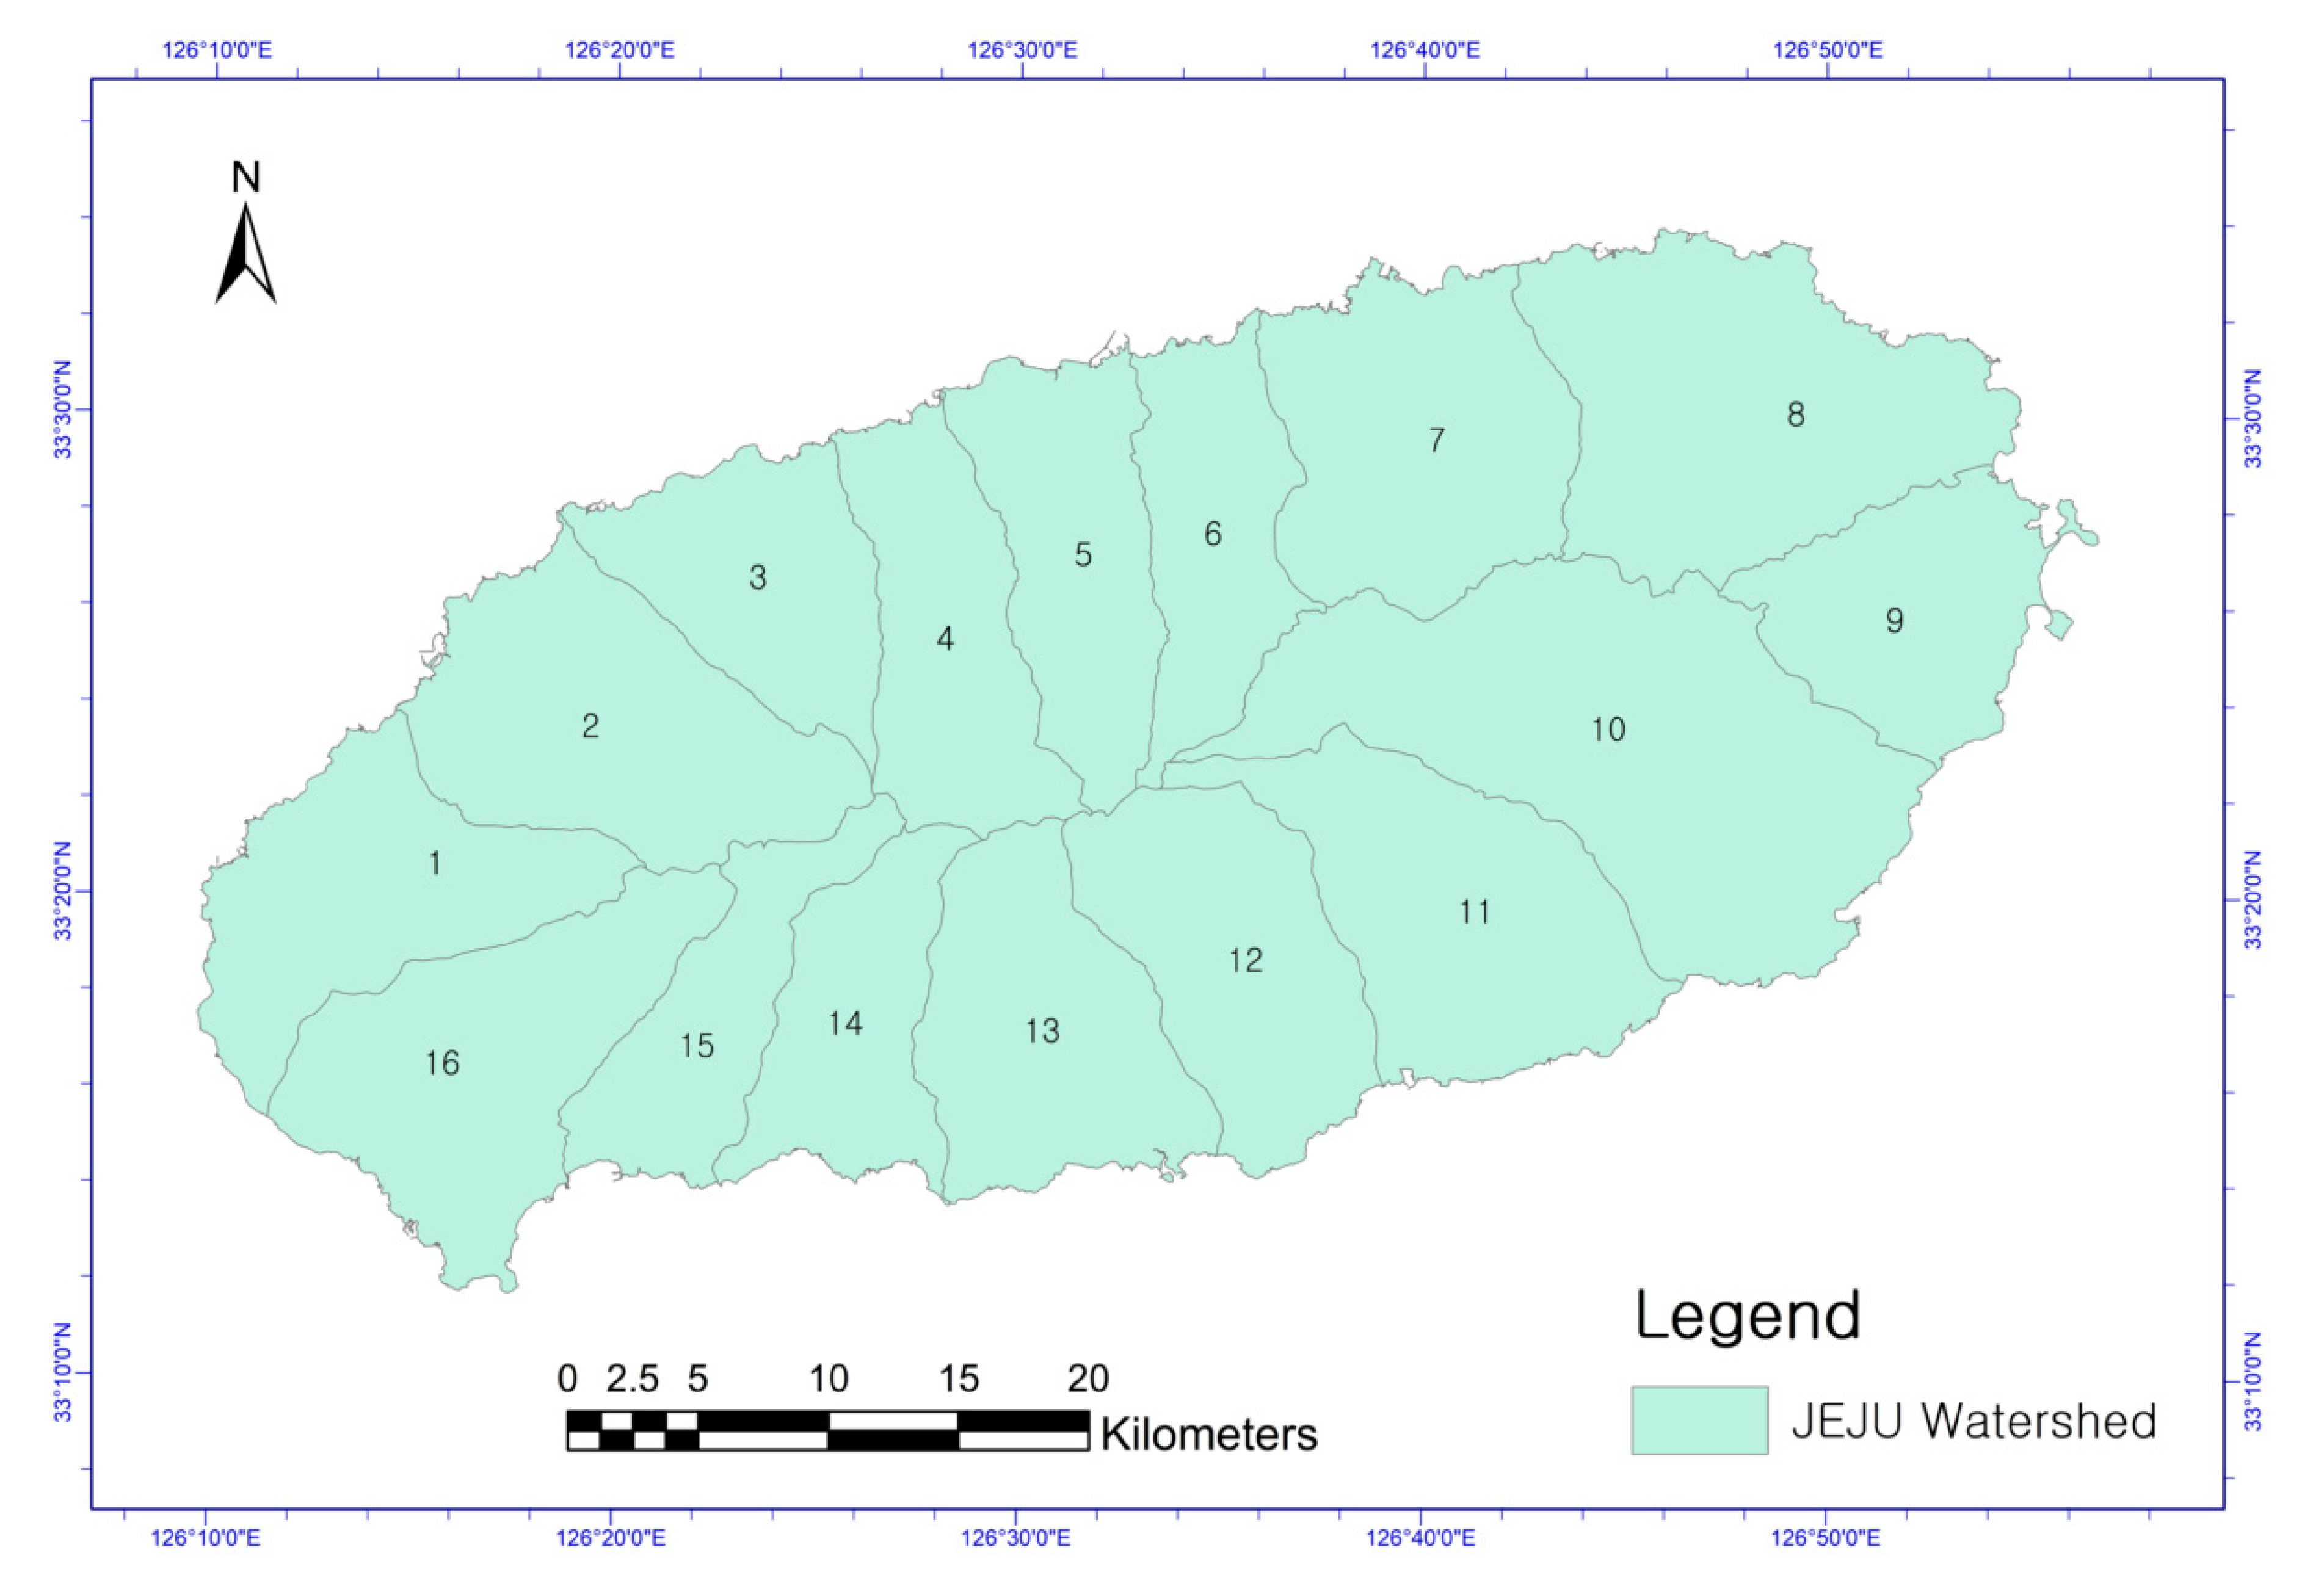
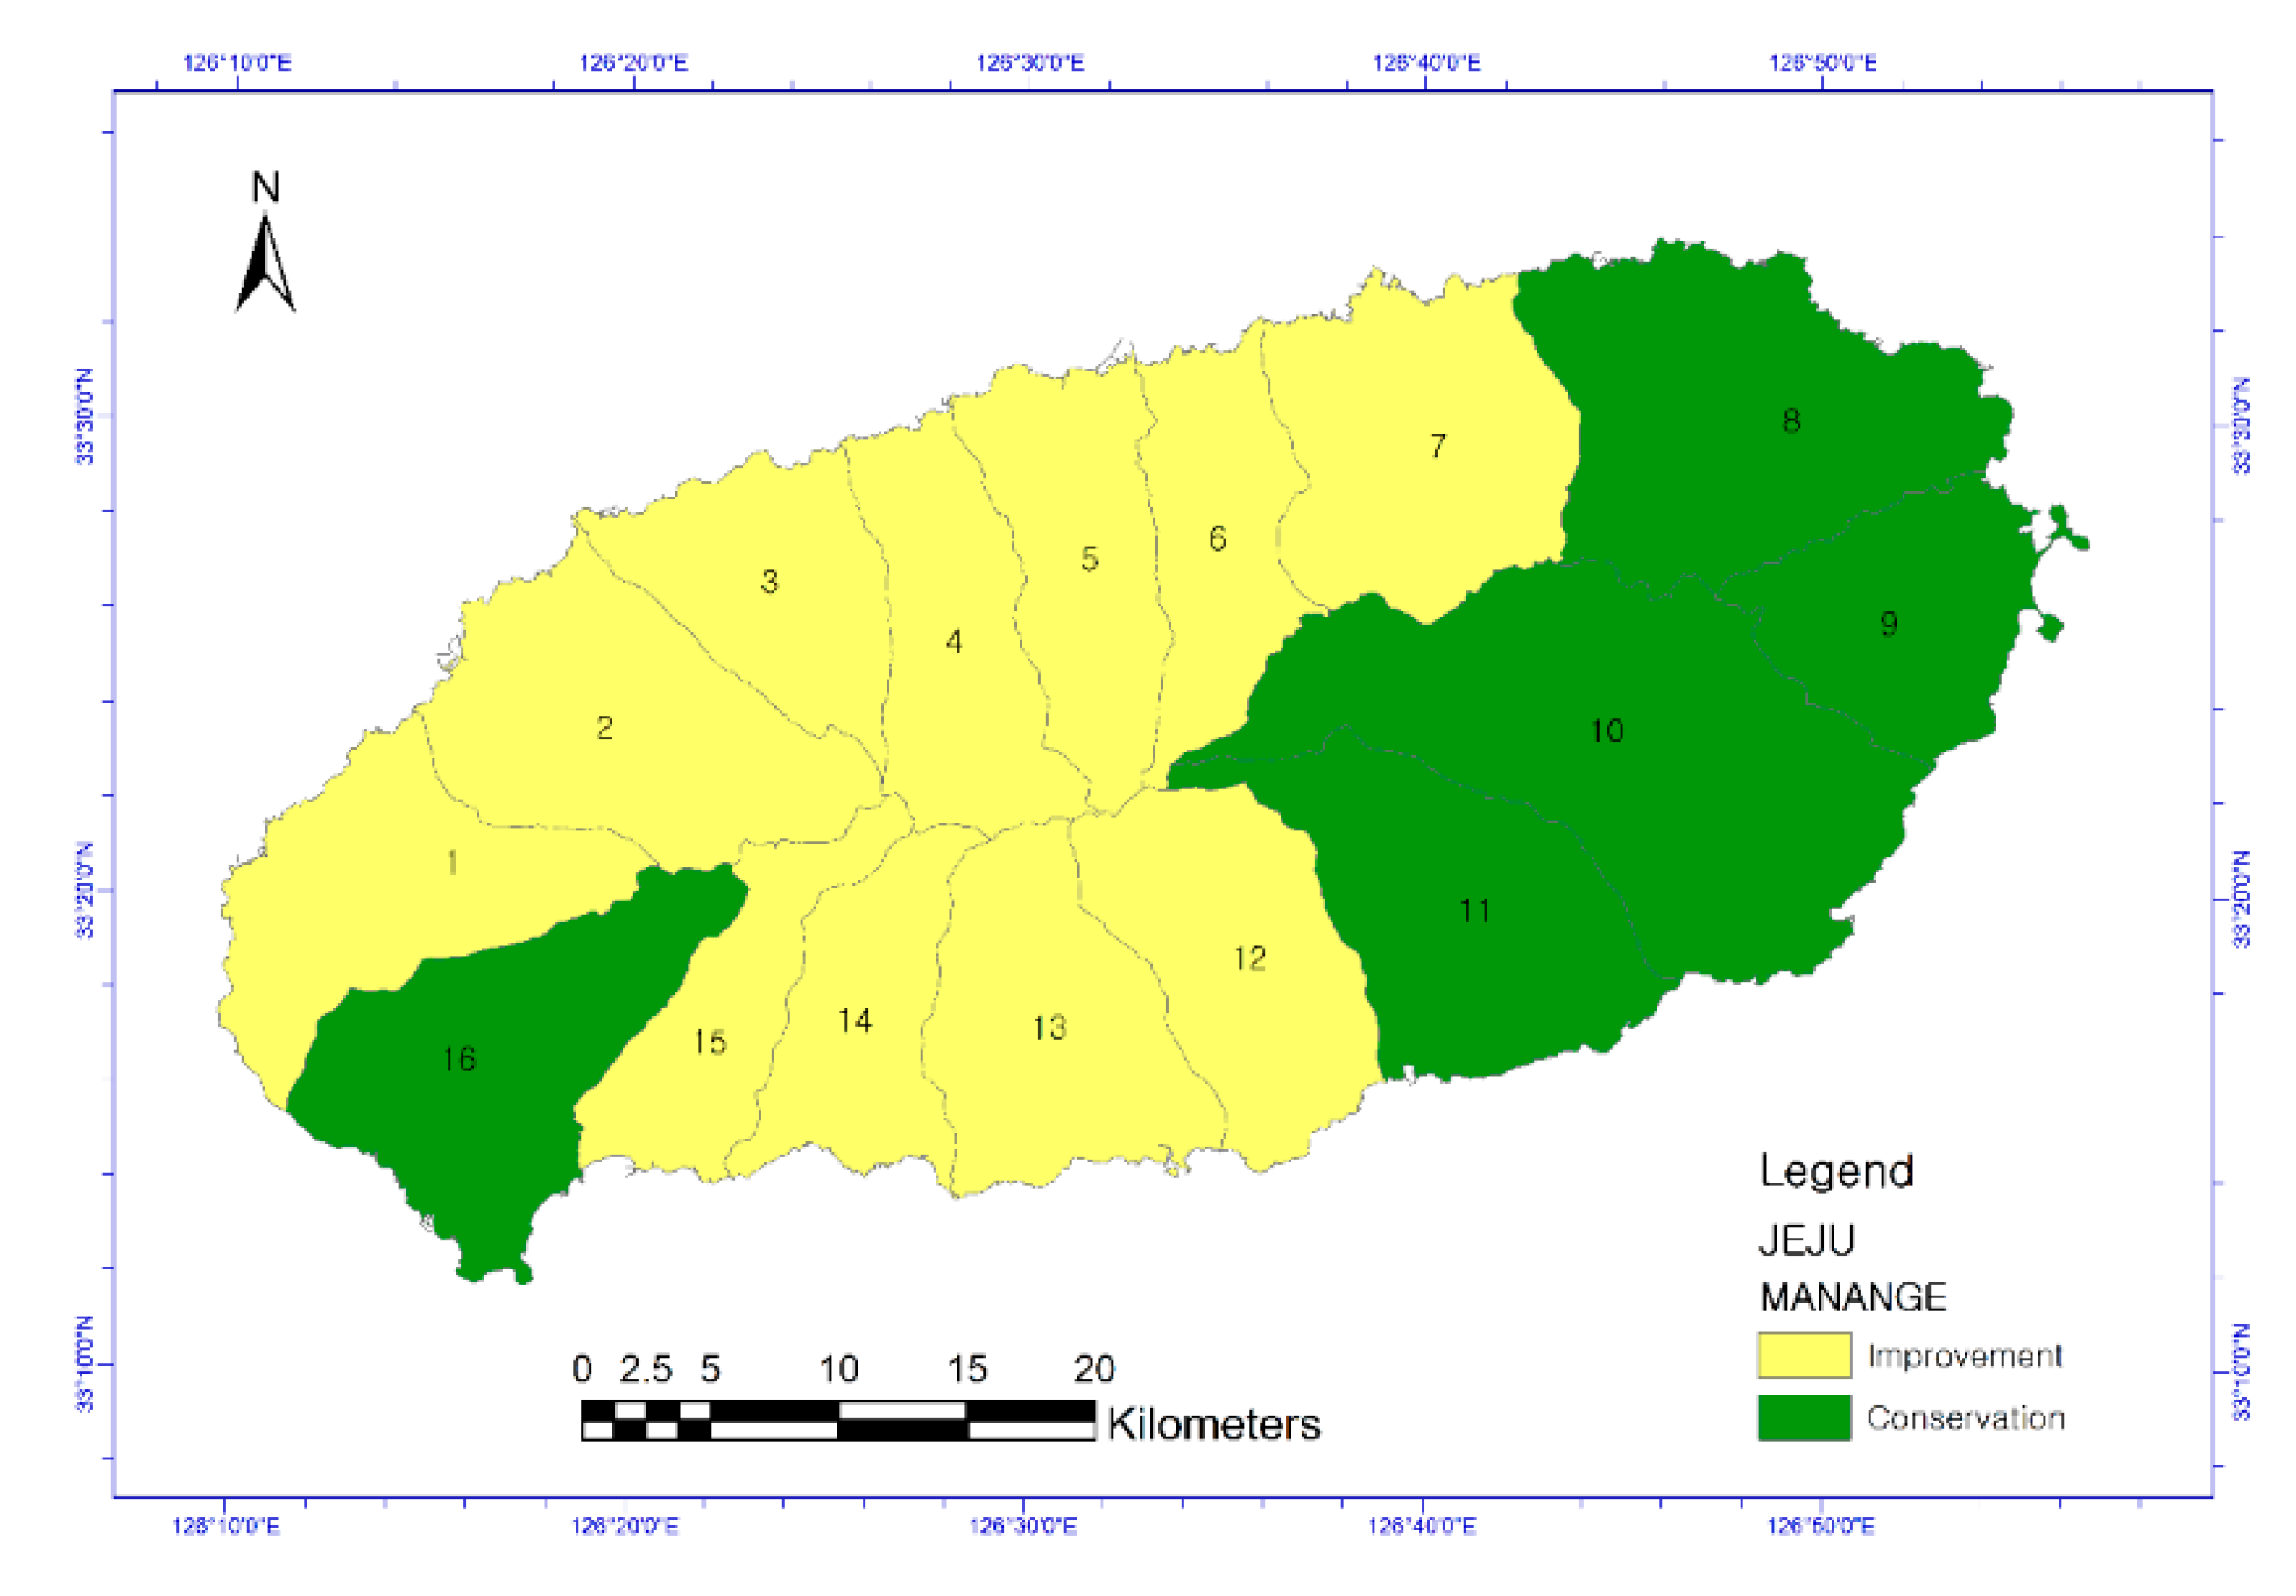
Wild animals prefer to have their own habitats, and they mainly survive within these areas. In the case of large mammals, a watershed was applied as an ecological unit for habitat management [46]. Therefore, in this study, Jeju Island was subdivided into areas according to watersheds (Figure 6). By analyzing the changes in habitat quality based on ecological units by 2050, space management efforts needed to focus on continually suppressing urbanization and preserving greenery in areas where habitat quality is expected to improve and be maintained. In areas where habitat quality is low, space management efforts should focus on continuously expanding and improving greenery.
3. Results
3.1. Land-Use Change Prediction
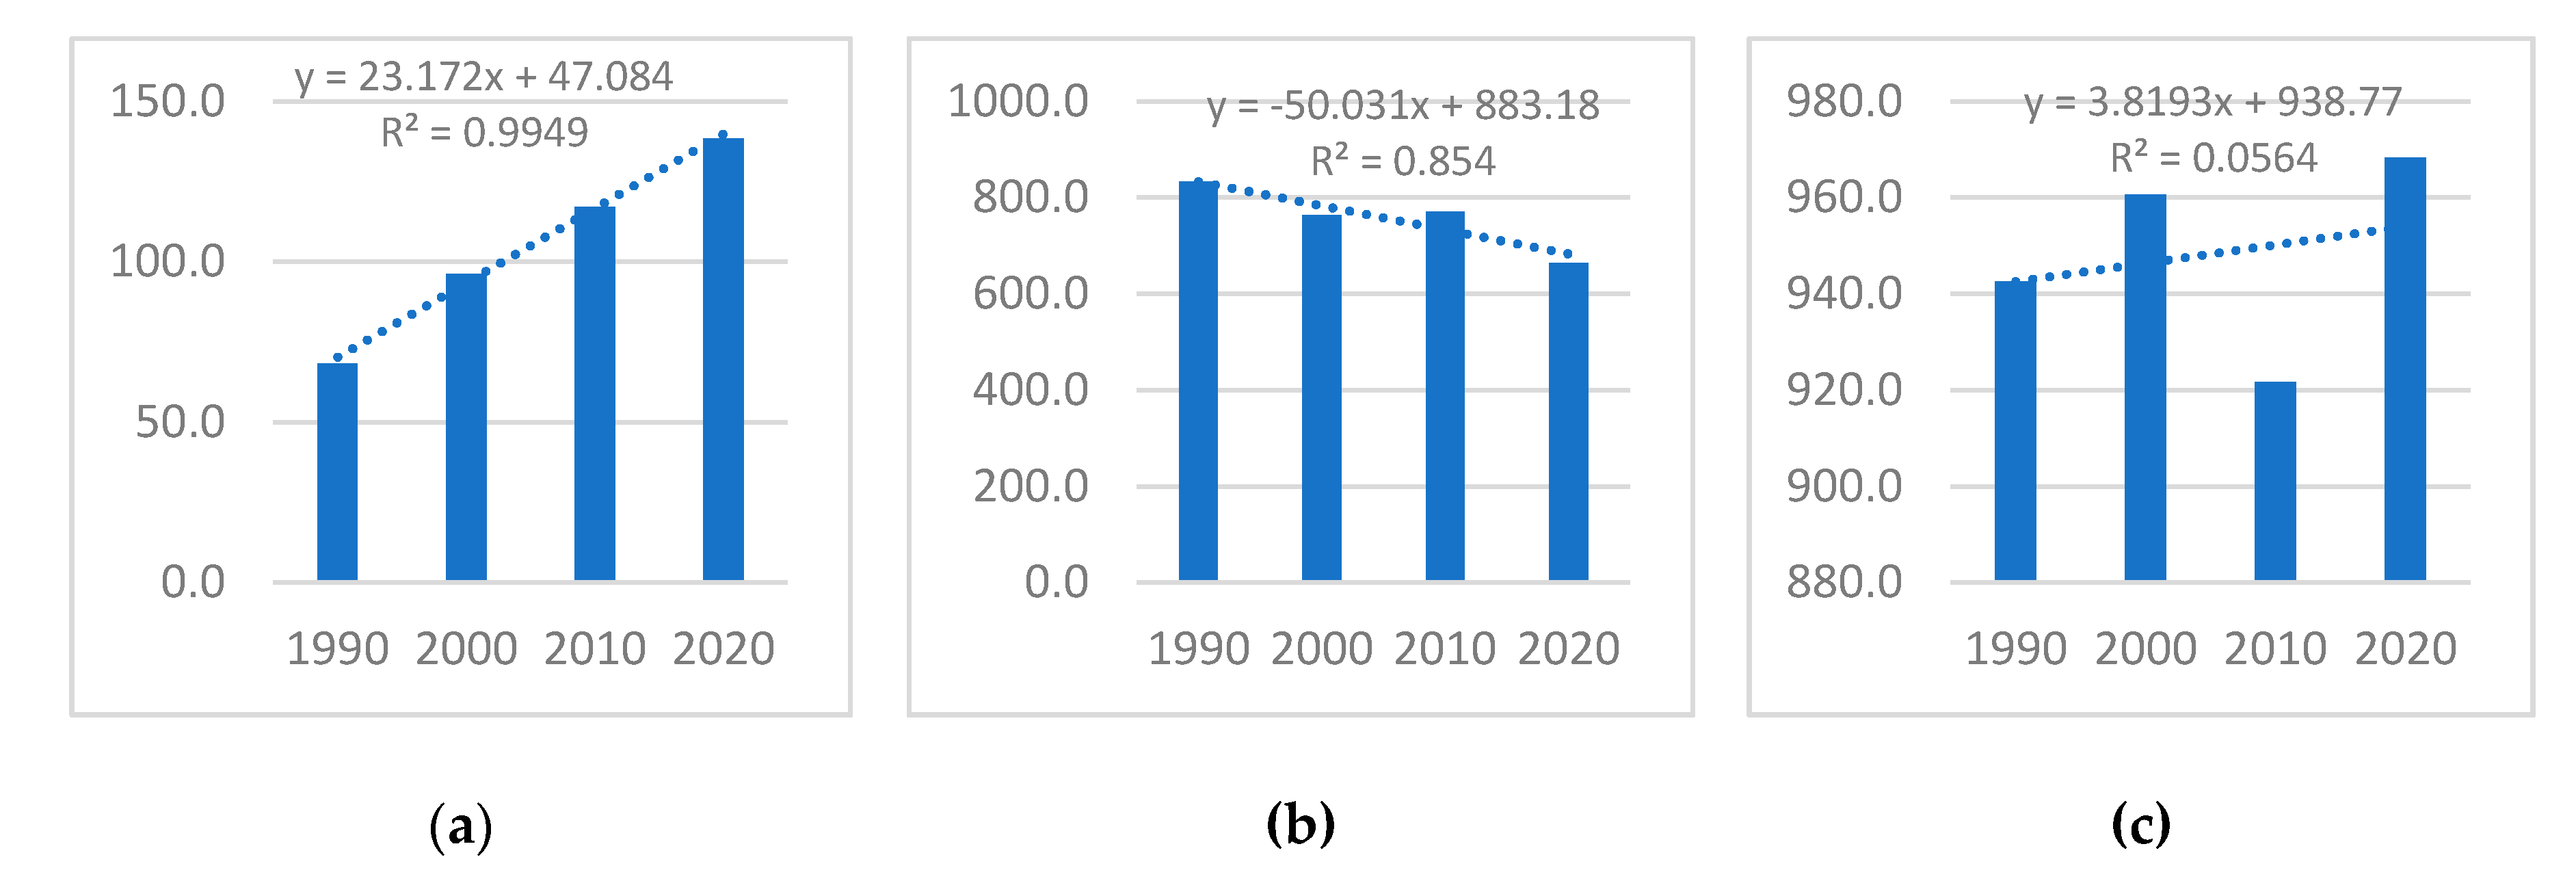
The rate of change from the past to the present for each type of land-cover was calculated from the base year of 2010 up to 2050, according to the trend of land-use change (Table 7, Figure 7). In 2050, as compared to 2010, urbanized areas increased by 79.5%, farmland areas decreased by 27.3%, and natural areas increased by 1.6%. Jeju Island is a volcanic island, and during rainfall, accumulated water drains quickly. Hence, water bodies do not form. As a result, the area of the water body is extremely small compared to the total area (0.3% of the total area). Therefore, it is assumed that the water body does not change.
A logistic regression analysis between each land-use type and land-use change factor was performed to derive the regression coefficient β. To determine the suitability of the derived regression analysis results, the AUC value was obtained using the ROC curve (Table 8). The AUC value of all cover types was 0.8 or higher, indicating that the model was reliable.
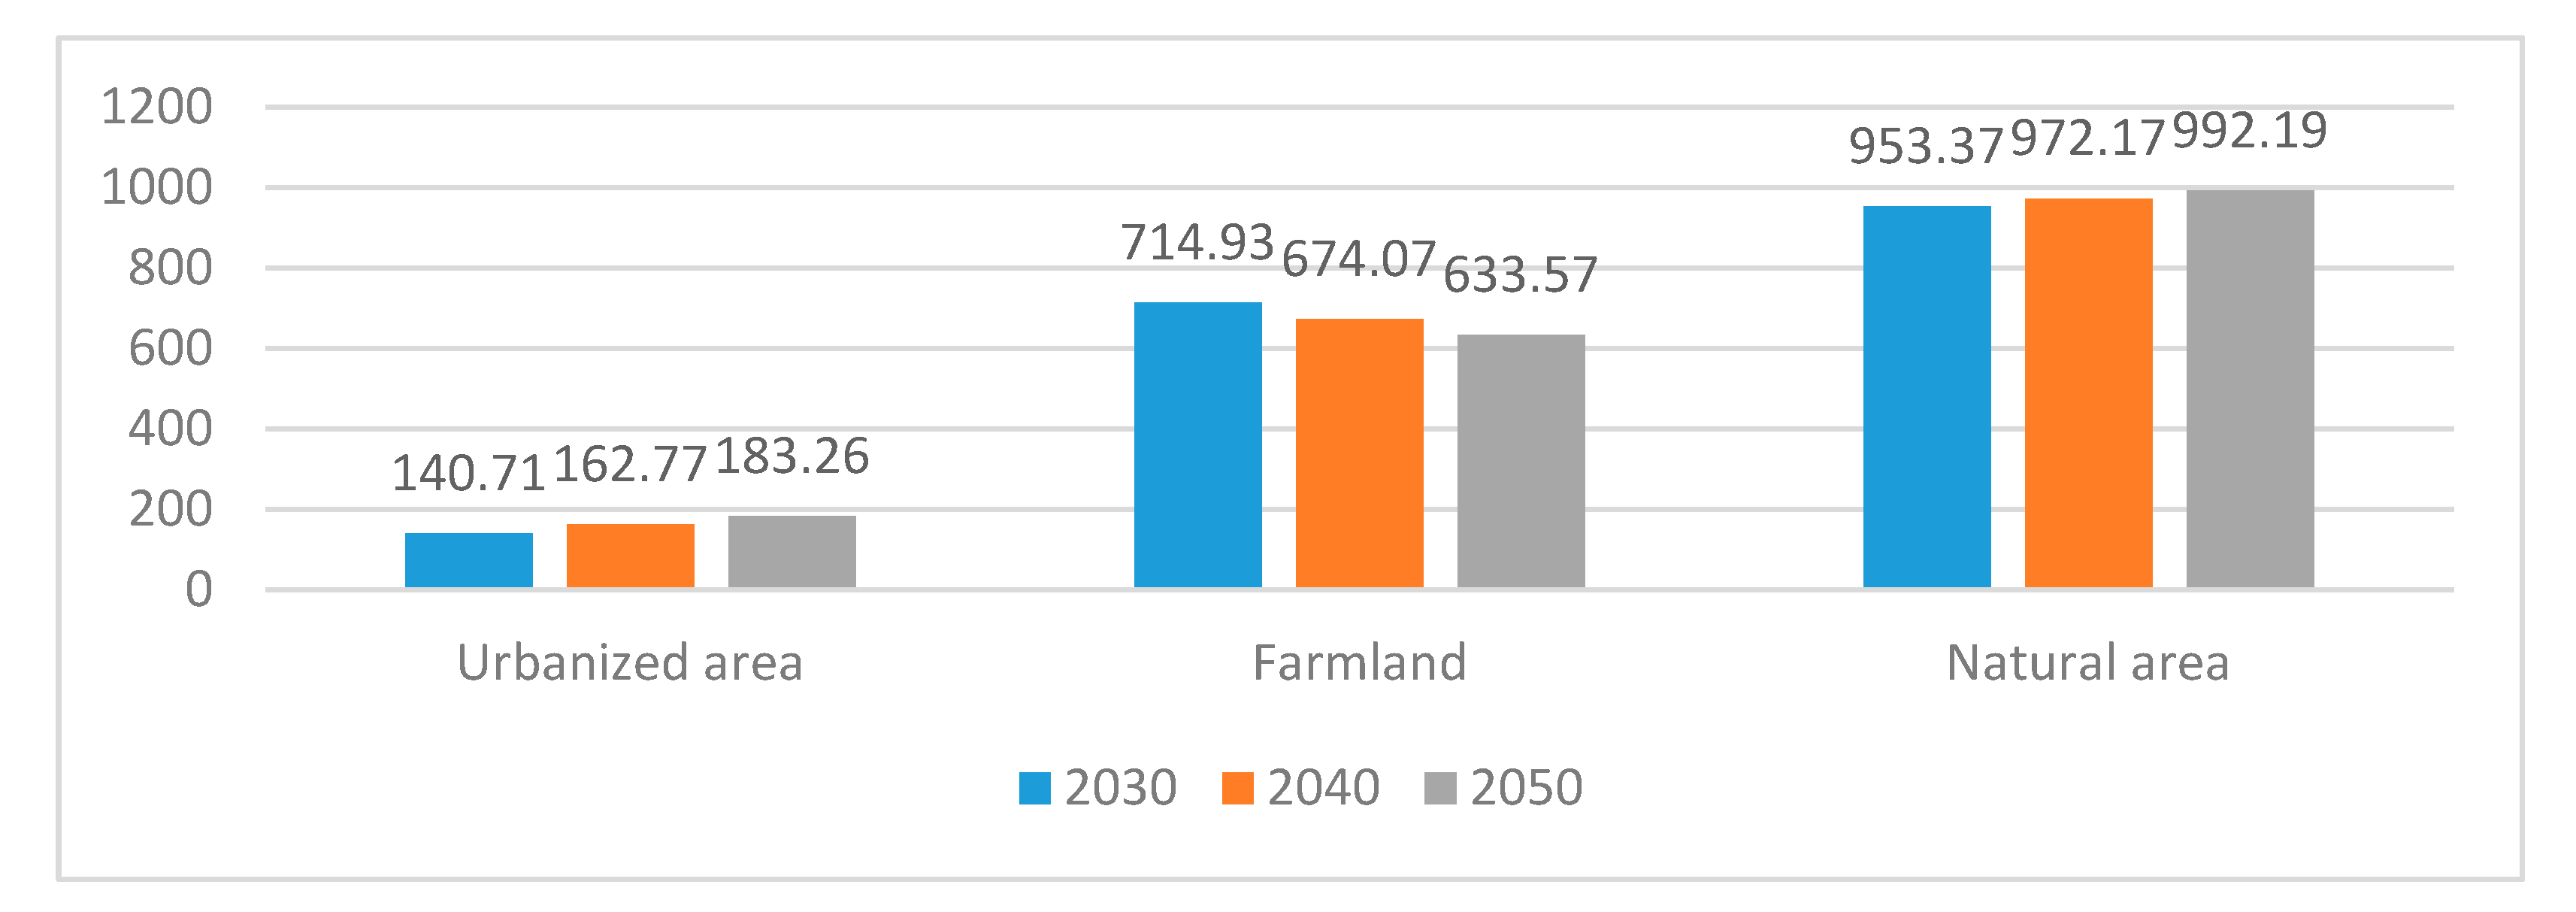
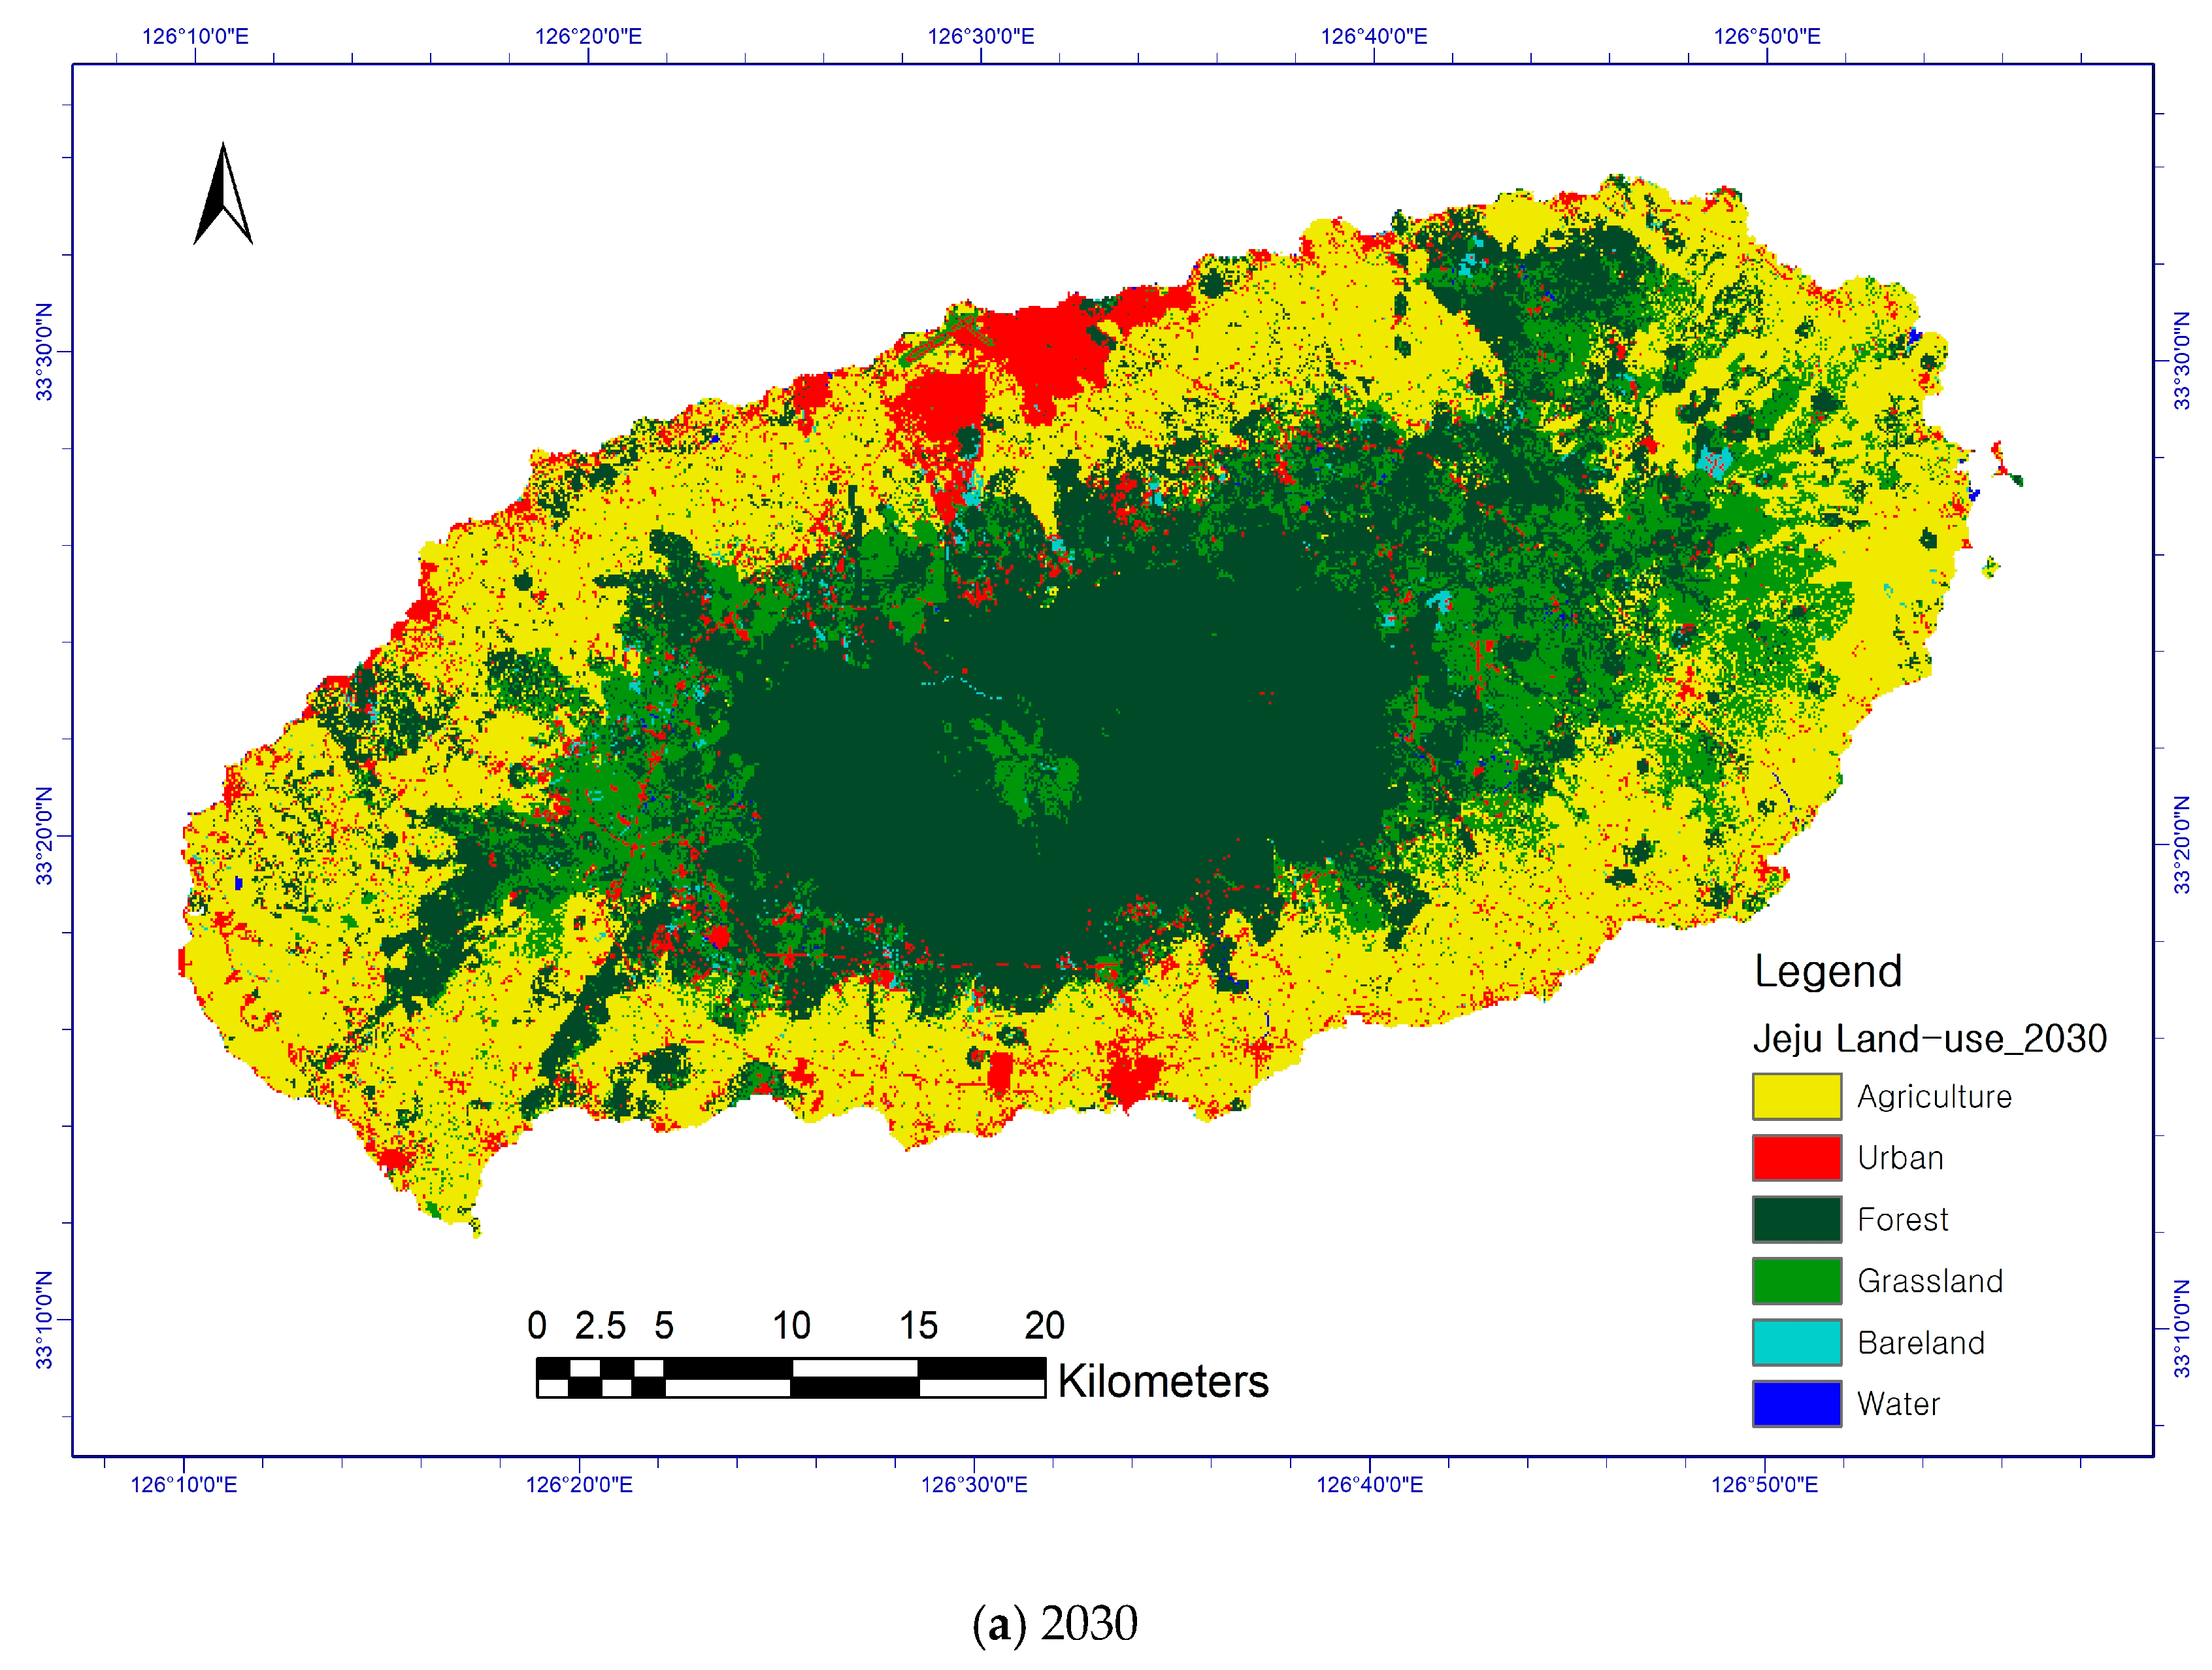
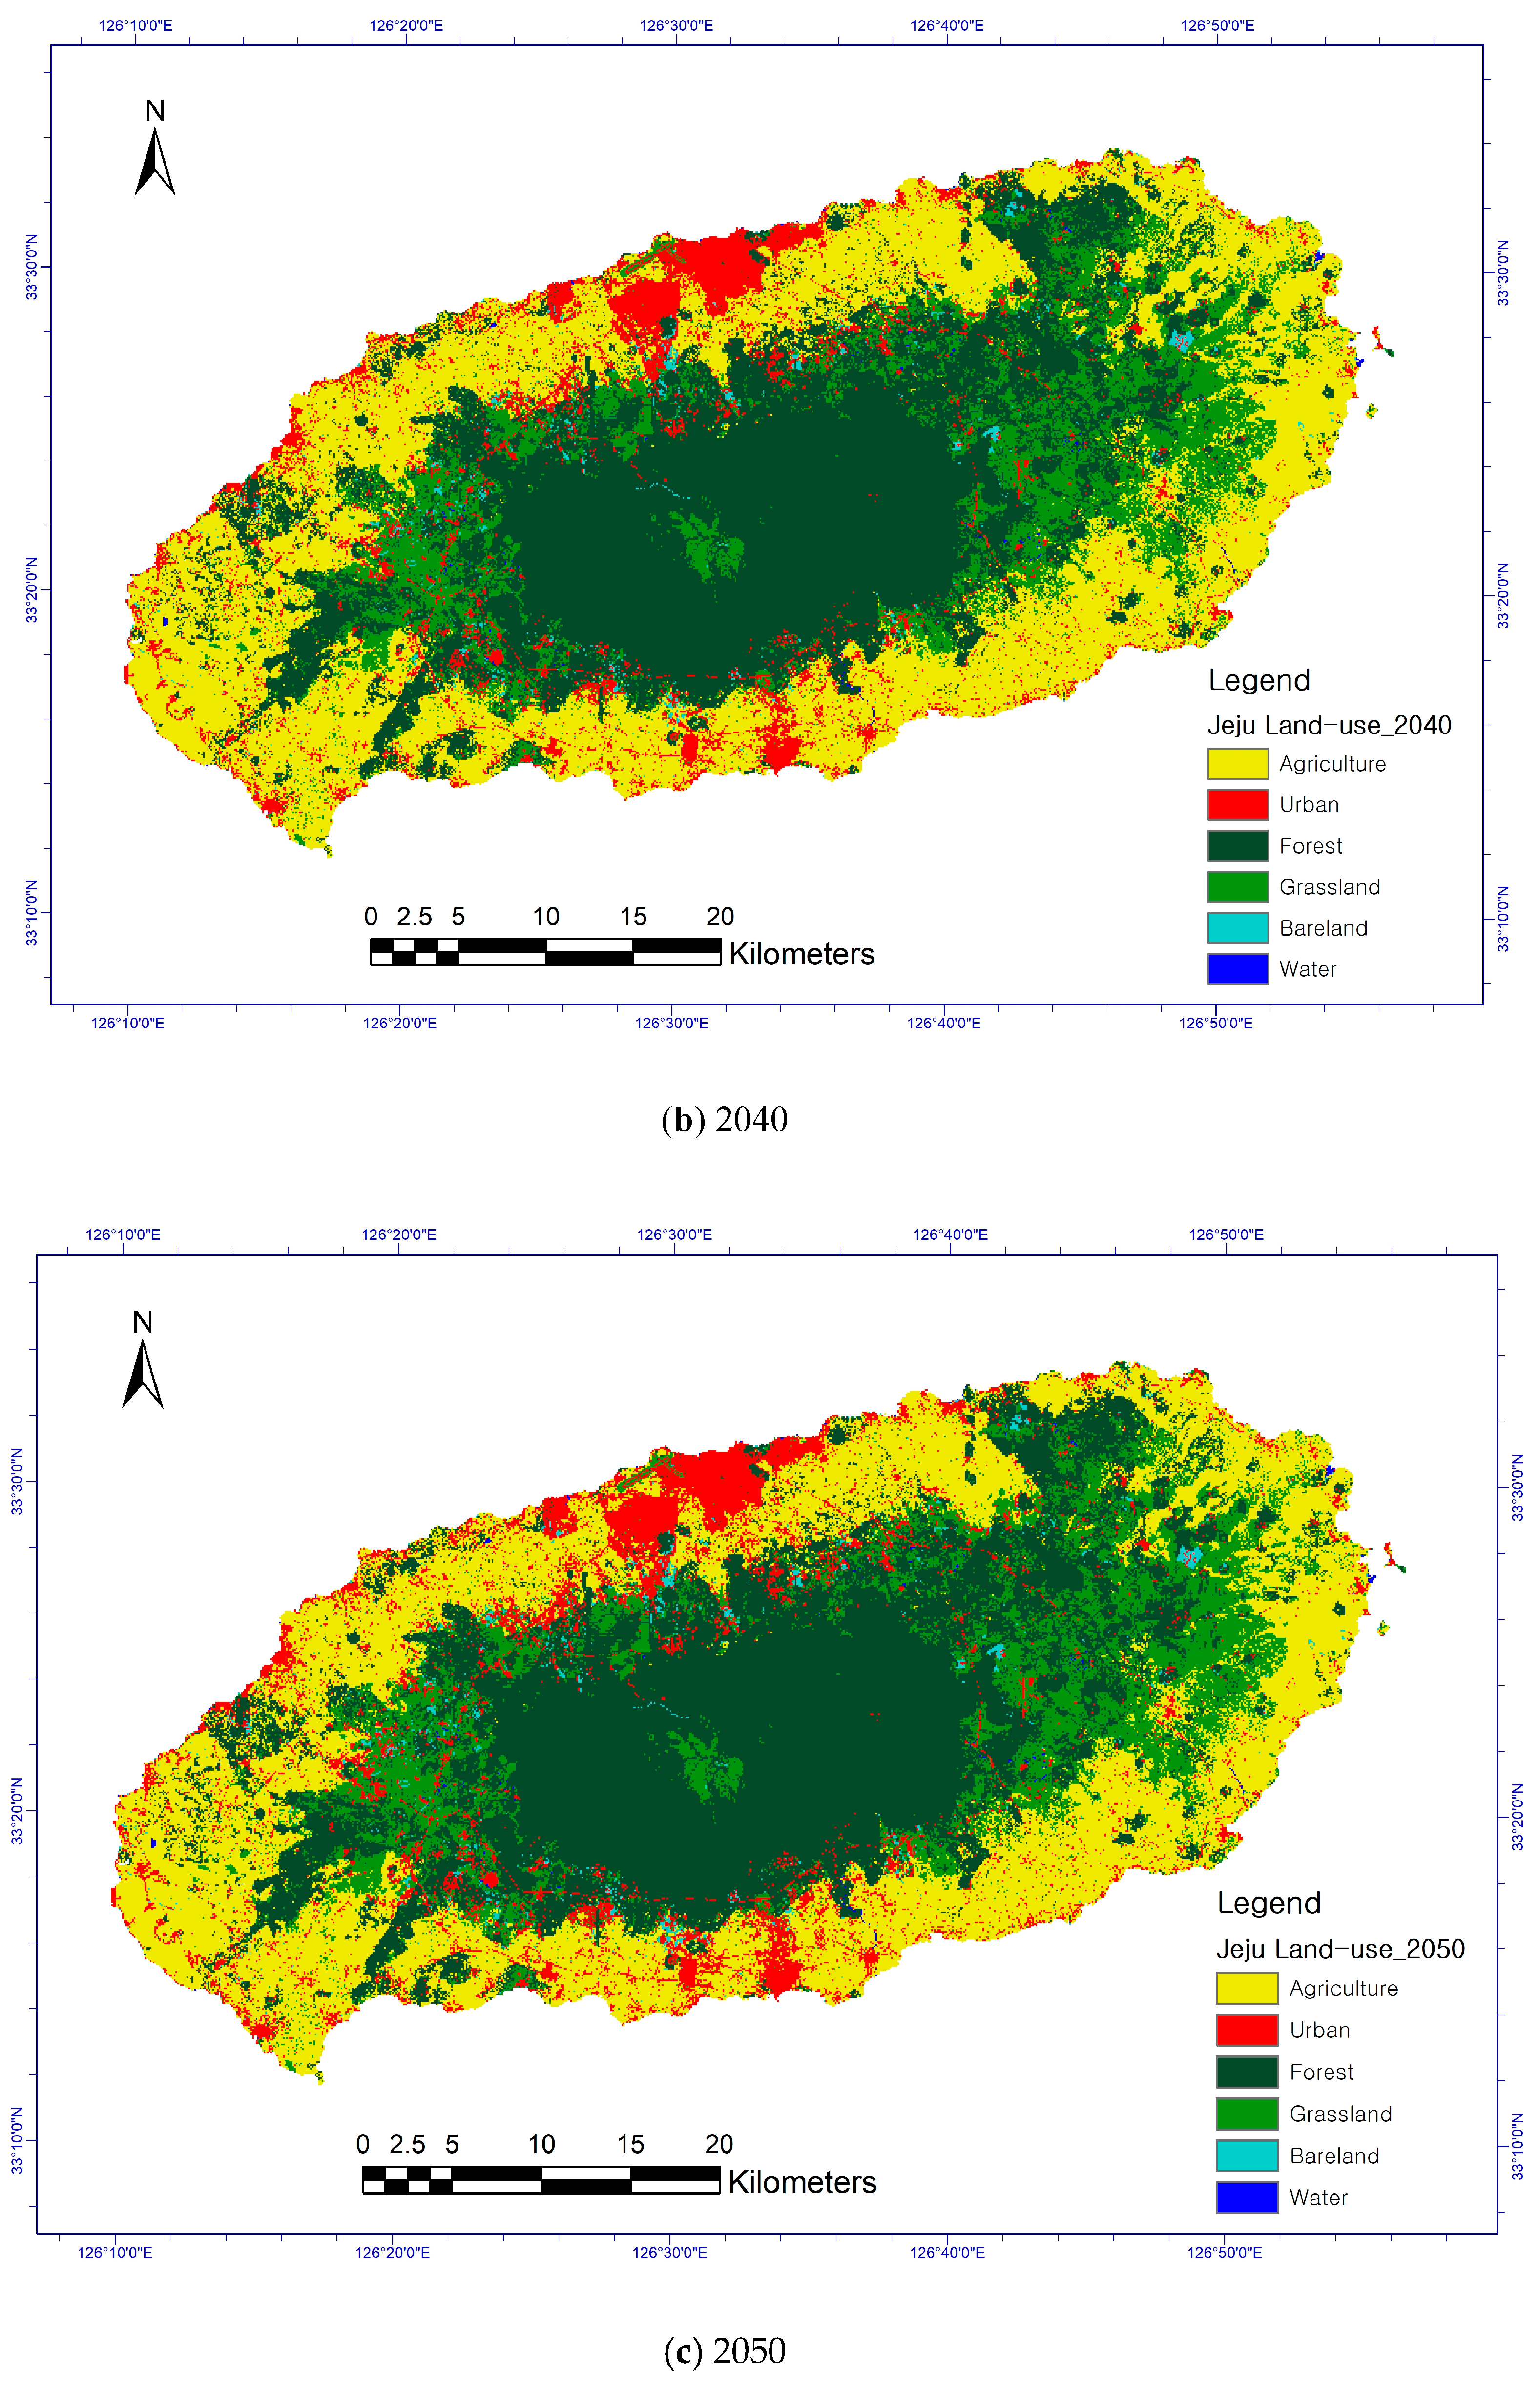
The land-use change in Jeju Island from 2030 to 2050 was predicted (Figure 8 and Figure 9, Table 9). The urbanized area increased by 42.55 km2 (2.35% compared to the area of Jeju Island) by 2050 compared to that in 2030; the farmland decreased by 81.36 km2 (4.50% compared to the area of Jeju Island), and the natural area increased by 38.82 km2 (2.15% compared to the area of Jeju Island).
To verify the accuracy of the land-use prediction results, the 2020 prediction results were obtained according to the current change trend and the 2020 land-cover map cross-validation was conducted (Table 10). The verification indicated an accuracy of 71%. In previous studies, modeling results were deemed valid if the accuracy exceeded 70% [7]; hence, this model was considered valid.
3.2. Jeju Roe Deer Habitat Quality Changes
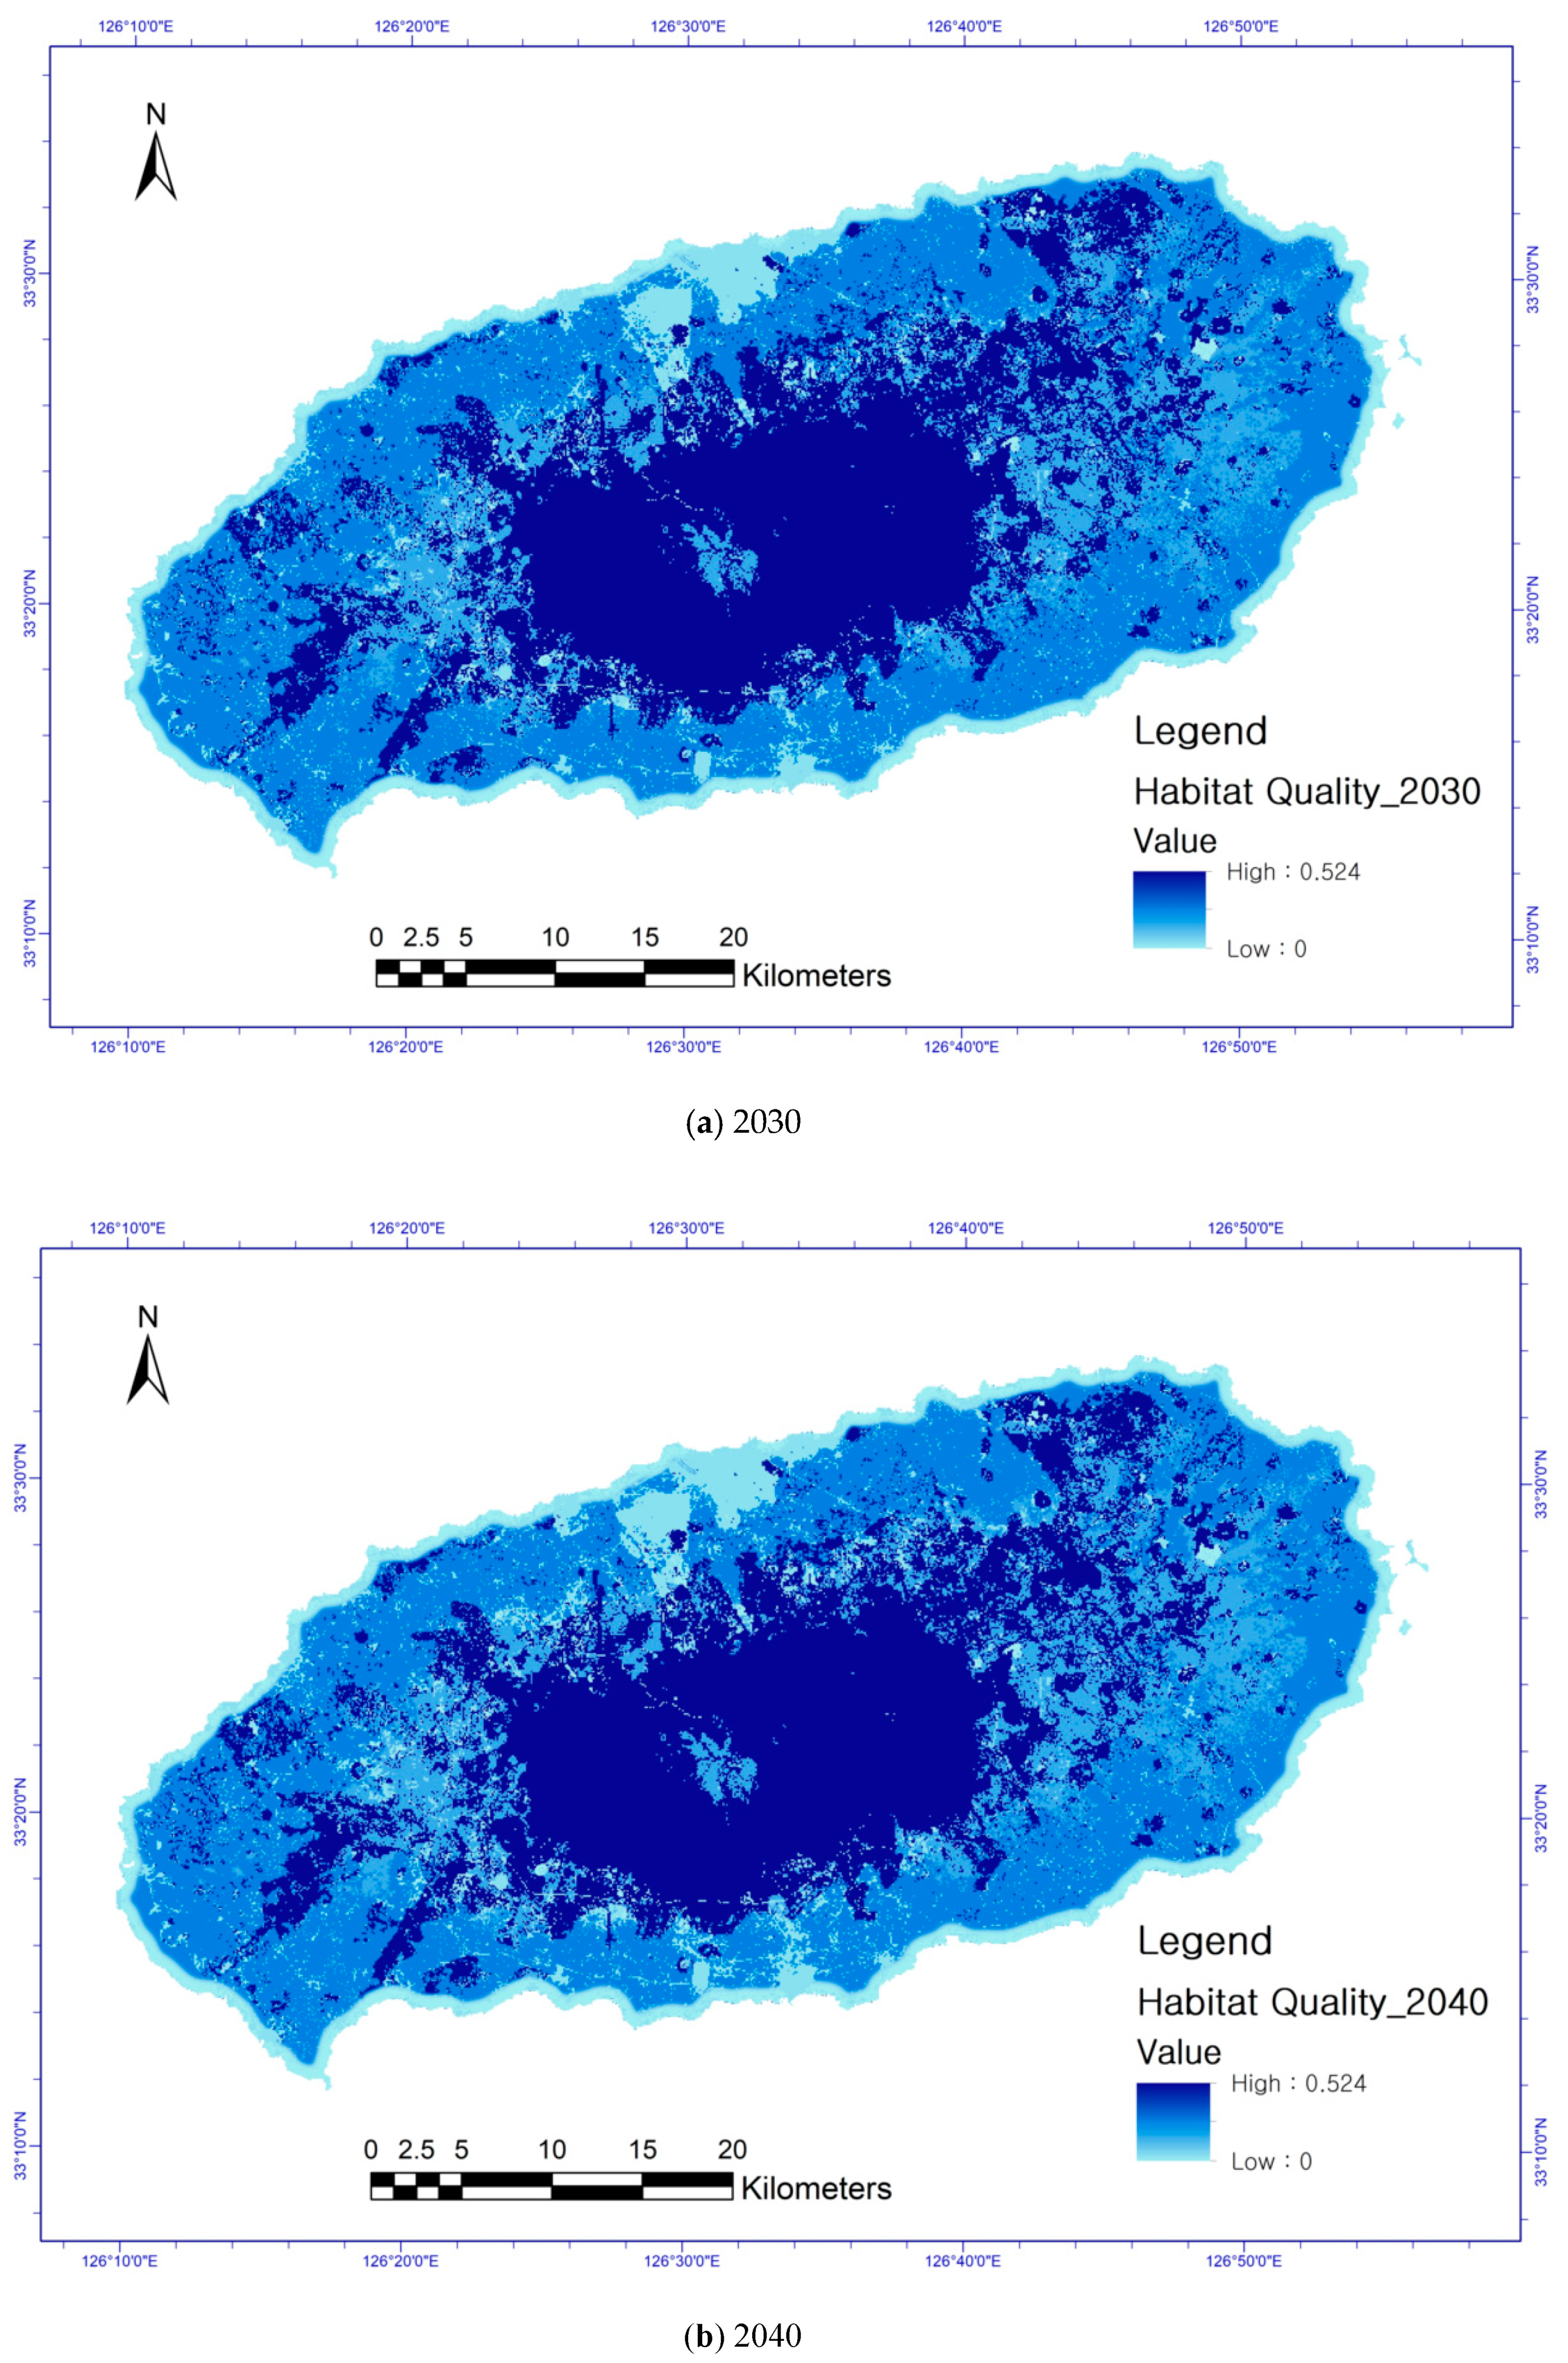
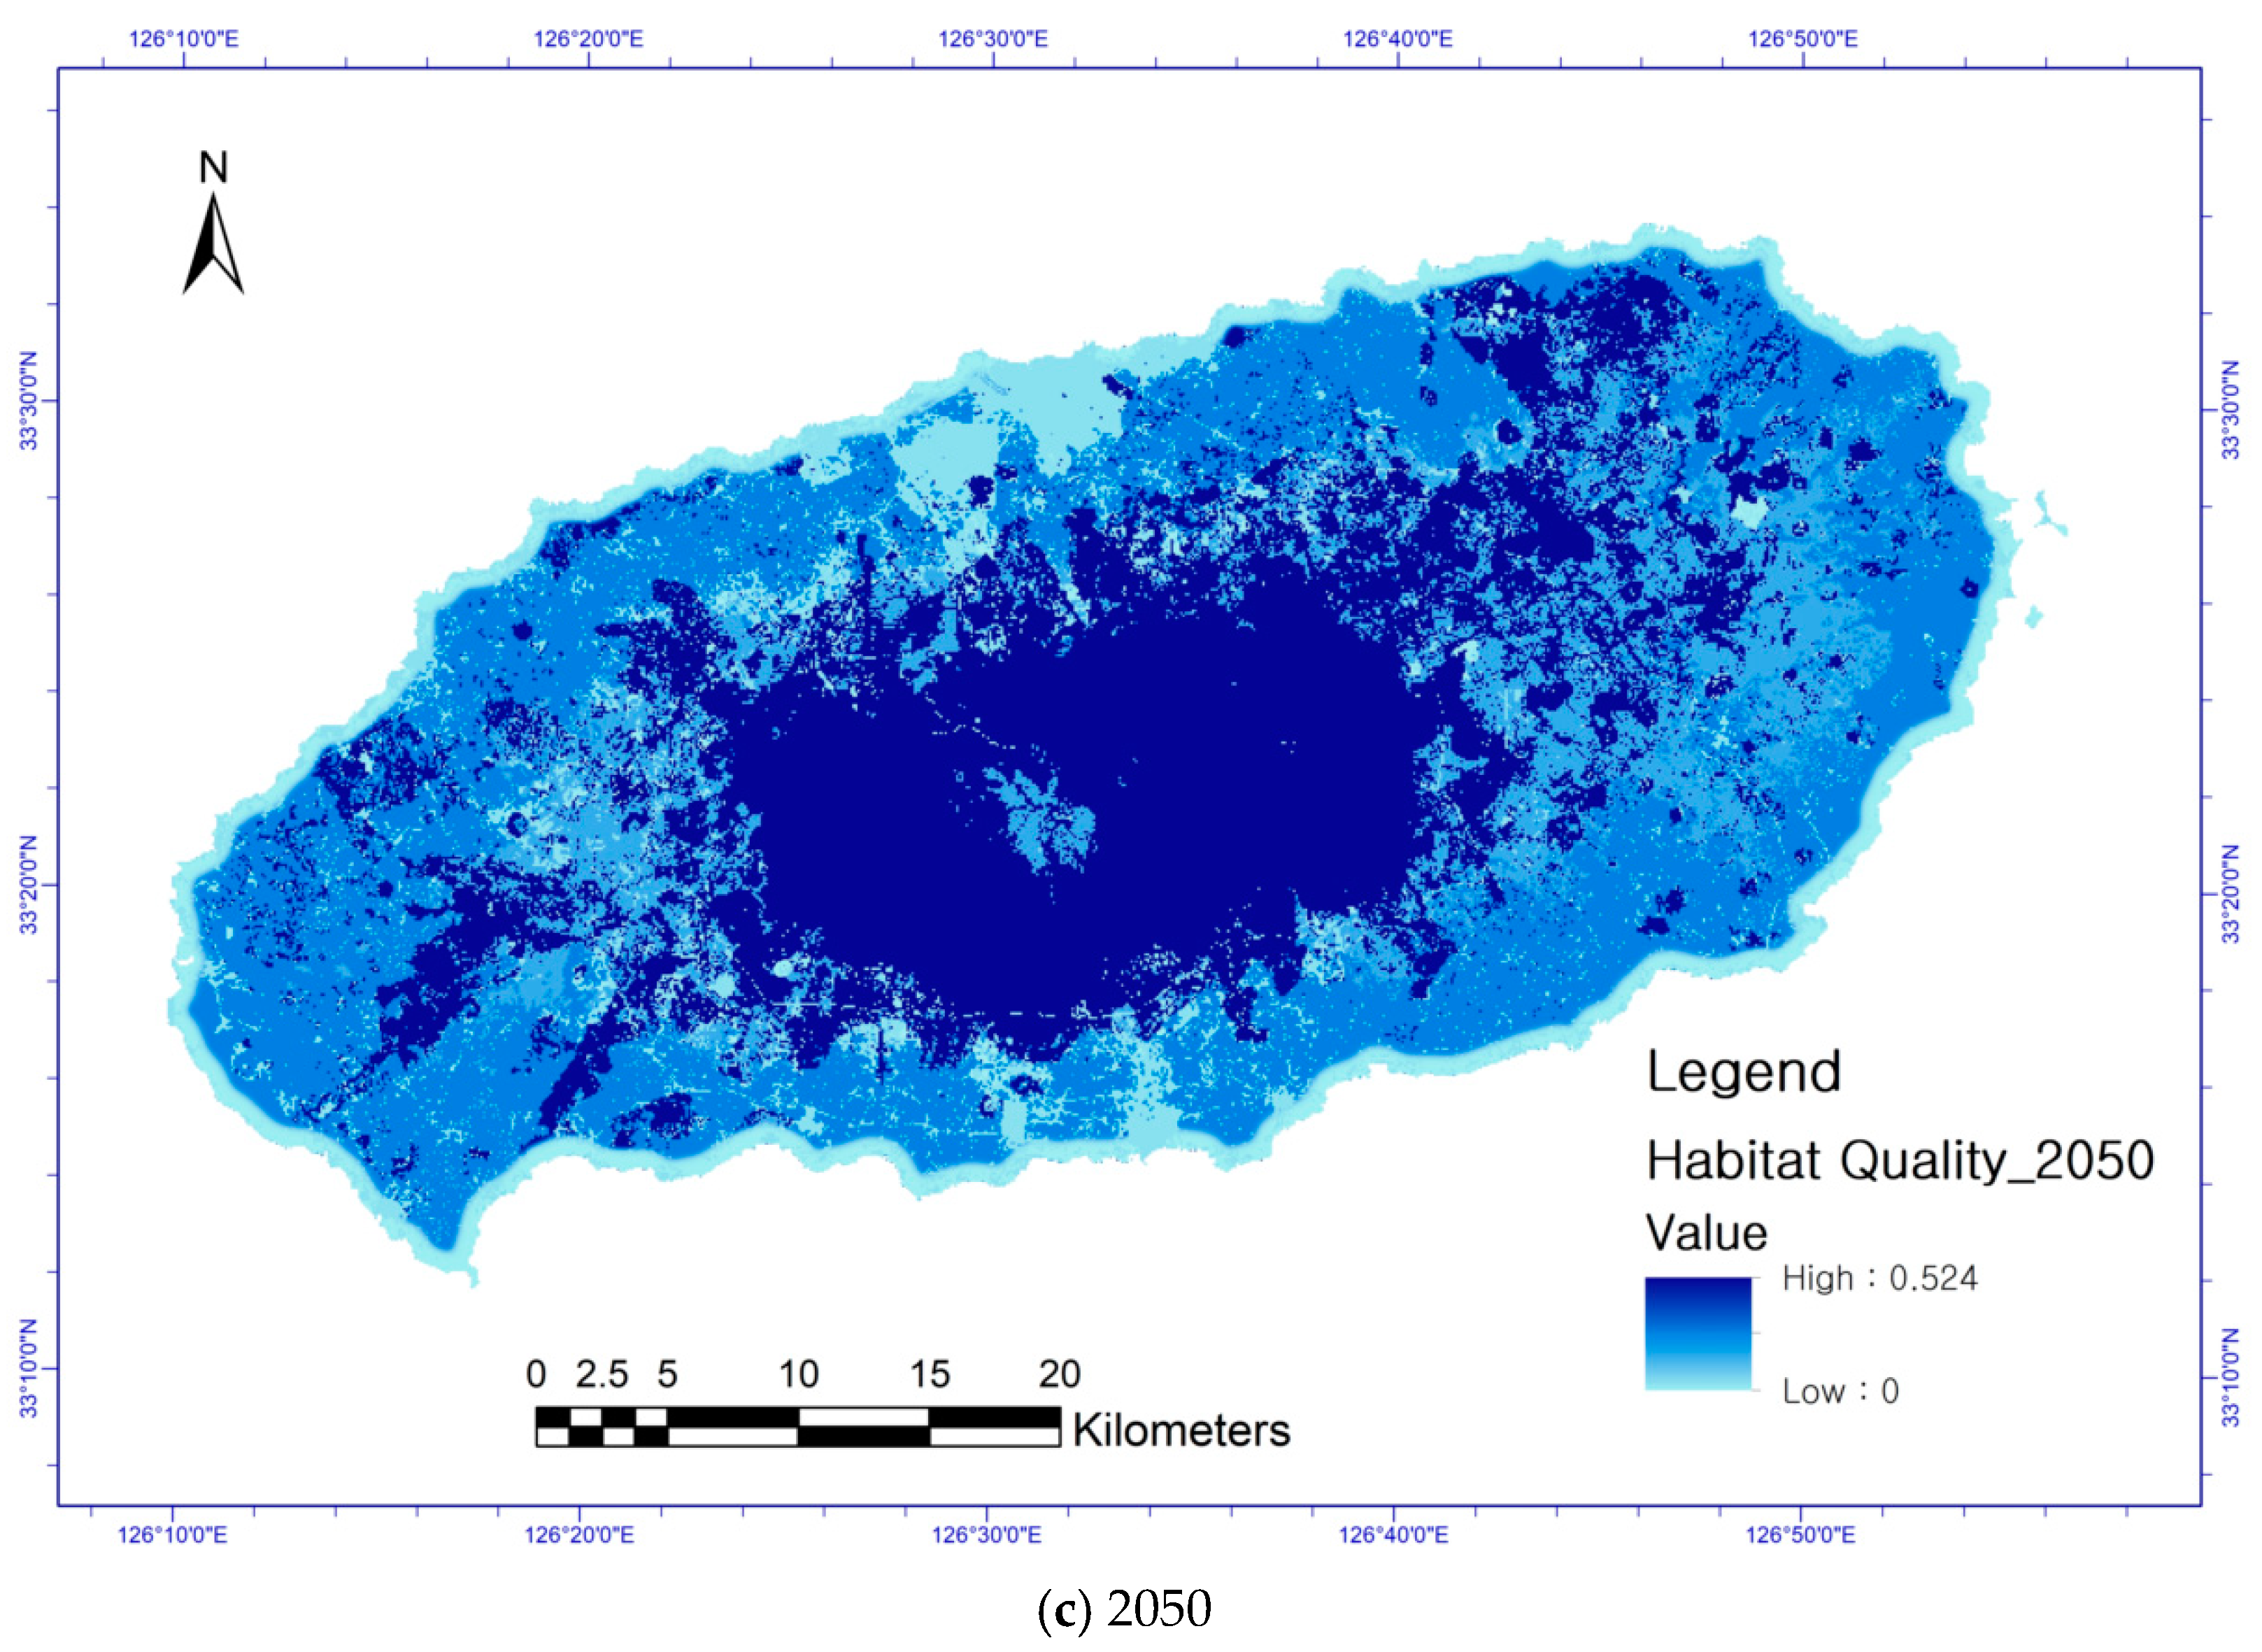
The results of the habitat quality of roe deer in Jeju Island from 2030 to 2050 are shown in Figure 10 and Figure 11 and in Table 11. Habitat quality values are assigned to each grid and displayed as a continuous value. Therefore, to analyze the change in habitat quality, the average habitat quality with respect to the period was calculated. The average value of the habitat quality of Jeju roe deer was predicted to decrease from 0.306 in 2030 to 0.303 in 2050. Habitat quality was predicted from 2030 to 2050 inside and outside the protected areas. It was predicted that the habitat quality within the protected area was high (0.477–0.476), whereas the habitat quality outside the protected area was low (0.281–0.278). Within the protected area, it was noted that the habitat quality was maintained better than that outside the protected area, and the extent of reduction was limited (reduction in protected area: 0.001; reduction outside protected area: 0.003). This shows that the designation of a protected area leads to a relatively high quality of habitat and a small decline in quality.
3.3. Results of Spatial Management for Improving and Maintaining Roe Deer Habitat Quality
The results of the spatial management for each watershed are shown in Figure 12 and Table 12. As a result of setting management goals of improving and maintaining habitat quality of watersheds for roe deer inhabitation, it was predicted that the habitat quality of the eastern watershed (WS 8, 9, 10, 11), where grassland and forests developed, will be maintained. In addition, it was predicted that the habitat quality will be maintained in the western watershed (WS 16), where forests developed. Other watersheds will require green space management to improve habitat quality.
4. Discussion
The results of this study revealed that urbanized and natural areas increased, whereas farmland areas decreased. Urbanization is expected to further accelerate if existing land-use patterns continue. Nevertheless, natural areas are expected to be maintained because many areas are currently designated and managed as protected areas. However, if this protected status is revoked and urbanization is permitted in these areas, the natural area in Jeju Island is expected to decrease rapidly.
Based on the prediction results of land-use change, the habitat quality of roe deer was found to decrease over time. By analyzing changes in the habitat quality within and outside protected areas, it was found that habitat quality within the protected area was high and the rate of decline over time was limited. Therefore, the designation of protected areas is effective in improving and maintaining habitat quality for wildlife. To prevent a decline in habitat quality, designating protected areas can be an alternative solution.
Habitat quality was predicted according to the watersheds in order to establish management directions for each watershed to promote roe deer inhabitation. In the watershed where forests and grasslands developed, habitat quality is predicted to be improved and maintained, although the current green areas need to be continuously preserved and maintained. However, the watersheds where habitat quality decreases require expansion and improvements in the quality of greenery.
It is essential to actively utilize the method of evaluating habitat quality through land-use change predictions when establishing a green infrastructure plan. By using modeling techniques to predict long-term changes in land-use and predict the changes in the habitat quality of key species in cities, long-term green infrastructure plans can be established from the perspective of wildlife inhabitation. This can help land management policy makers develop sustainable land-use plans whereby wildlife and people can co-exist.
This study is meaningful in that it predicts land-use changes, analyzes habitat quality changes, and suggests spatial management directions for improving biological habitats, one of the primary goals of green infrastructure. In the future, if habitat quality changes are predicted and analyzed by considering the environmental factors of various species, a more specific sustainable spatial management direction can be suggested from the perspective of biological habitat preservation and maintenance.
5. Conclusions
This study proposed a method for establishing the direction of land-use management to ensure sustainable wildlife inhabitation in the future. If future land-use changes and the resulting changes in habitat quality are predicted, rather than evaluating habitat quality based on current or past land-use, it becomes possible to prevent the urbanization of areas with good habitat quality in advance. This study predicts the land-use changes in Jeju Island until 2050, which is the largest island in Korea, featuring a high ecological diversity; the study also predicts the changes in habitat quality for roe deer in Korea, which are only found on Jeju Island.
Based on the predicted land-use changes, it was found that urbanized areas and natural areas increased, whereas farmlands decreased. By predicting the changes in the habitat quality of roe deer in accordance with these land-use changes, it was determined that the quality of habitats on Jeju Island, as a whole, would decrease. The changes in habitat quality within and outside protected areas indicated that habitat quality within protected areas was high and the rate of decline over time was limited. To improve and maintain roe deer habitat quality in Jeju Island, conservation is necessary, primarily in watersheds with forests and grasslands. Watersheds with low habitat quality require continuous expansion and quality improvements for green spaces.
This study suggested that in land-use management, it is possible to establish a management direction for sustainable wildlife inhabitation by predicting the changes in the habitat quality in accordance with land-use changes. In addition, this study suggested that the designation of protected areas is effective in terms of habitat quality conservation of wildlife.
Long-term green infrastructure management will be possible if land-use management measures, such as designating protected areas or expanding green spaces, are implemented based on predicted changes in the habitat quality, which was the aim of this study.
Author Contributions
Conceptualization, S.W.J. and D.-j.L.; writing—original draft preparation, D.-j.L.; writing—review and editing, S.W.J. All authors have read and agreed to the published version of the manuscript.
Funding
This research was supported by the Korea Environment Industry & Technology Institute (KEITI) through the Decision Support System Development Project for Environmental Impact Assessment, funded by Korea Ministry of Environment (MOE) (No. 2020002990009).
Conflicts of Interest
The authors declare no conflict of interest.
References
- Yook, G.H.; Kang, M.K.; Kang, W.M.; Ko, I.S.; Bae, S.Y.; Lee, M.K.; Choi, G.H.; Heo, J.O.; Lee, D.W. Biodiversity and Threats Underlying Ecosystem Services and Human Culture. Environ. Stud. 2010, 49, 1–25. [Google Scholar]
- Jeju Special Self-Governing Province. The 2nd Jeju International Free City Comprehensive Plan; Republic of Korea, Jeju Special Self-Governing Province: Jeju Special Self-Governing Province, Korea, 2011.
- Jeon, S.W.; Park, Y.H.; Jang, H.; Kim, E.Y.; Kong, S.J.; Kim, G.H.; Kim, M.K.; Kim, Y.J.; Kim, Y.H.; Kim, J.W.; et al. Master Plan for the Development of the World Environment Capital in Jeju; Korea Environment Institute Research Report; Republic of Korea, Jeju Special Self-Governing Province: Seoul, Korea, 2014; Volume 2020.
- Oh, J.G. Characteristics of Ecological Behaviour of Roe Deer (Capreolus pygargus tianschanicus) in Jeju Island, Korea. Ph.D. Thesis, Graduate School of Korea National University of Education, Chungcheongbuk-do, Korea, 2004. [Google Scholar]
- Lee, H.W.; Kim, C.K.; Hong, H.J.; Noh, Y.H.; Kang, S.I.; Kim, J.H.; Shin, S.C.; Lee, S.J.; Kim, T.Y.; Kang, J.Y.; et al. Development of Decision Supporting Framework to Enhance Natural Capital Sustainability: Focusing on Ecosystem Service Analysis; Korea Environment Institute Research Report; Korea Environment Institute: Sejong, Korea, 2015. [Google Scholar]
- Oh, Y.G.; Choi, J.Y.; Yoo, S.H.; Lee, S.H. Prediction of Land-Cover Change Based on Climate Change Scenarios and Regional Characteristics Using Cluster Analysis. J. Korean Soc. Agric. Eng. 2011, 53, 31–41. [Google Scholar]
- Park, C. Analysis of Potential Reduction of CO2 Emission for Low Carbon Society: Focused on Land Use Change. Master’s Thesis, The Graduate School of Seoul National University, Seoul, Korea, 2009. [Google Scholar]
- Verburg, P.H.; Soepboer, W.; Veldkamp, A.; Limpiada, R.; Espaldon, V.; Mastura, S.S. Modeling the Spatial Dynamics of Regional Land Use: The CLUE-S Model. Environ. Manag. 2002, 30, 391–405. [Google Scholar] [CrossRef] [PubMed]
- Zhao, C.; Jensen, J.L.R.; Weaver, R. Global and Local Modeling of Land Use Change in the Border Cities of Laredo, Texas, USA and Nuevo Laredo, Tamaulipas, Mexico: A Comparative Analysis. Land 2020, 9, 347. [Google Scholar] [CrossRef]
- Guerrero-Morales, J.; Fonseca, C.R.; Goméz-Albores, M.A.; Sampedro-Rosas, M.L.; Silva-Gómez, S.E. Proportional Variation of Potential Groundwater Recharge as a Result of Climate Change and Land-Use: A Study Case in Mexico. Land 2020, 9, 364. [Google Scholar] [CrossRef]
- Rai, R.; Zhang, Y.; Paudel, B.; Li, S.; Khanal, N.R. A Synthesis of Studies on Land Use and Land Cover Dynamics during 1930–2015 in Bangladesh. Sustainability 2017, 9, 1866. [Google Scholar] [CrossRef] [Green Version]
- Deal, B.; Schunk, D. Spatial Dynamic Modeling and Urban Land Use Transformation: A Simulation Approach to Assessing the Costs of Urban Sprawl. Ecol. Econ. 2004, 51, 79–95. [Google Scholar] [CrossRef]
- Brown, D.G.; Pijanowski, B.C.; Duh, J.D. Modeling the Relationships between Land Use Land Cover on Private Lands in the Upper Midwest, USA. J. Environ. Manag. 2002, 59, 247–263. [Google Scholar] [CrossRef] [Green Version]
- Lambin, E.F.; Rounsevell, M.D.A.; Geist, H.J. Area Agricultural Land-Use Models Able to Predict Changes in Land-Use Intensity? Agric. Ecosyst. Environ. 2000, 82, 321–331. [Google Scholar] [CrossRef]
- Samat, N.; Mahamud, M.A.; Tan, M.L.; Maghsoodi Tilaki, M.J.M.; Tew, Y.L. Modelling Land Cover Changes in Peri-Urban Areas: A Case Study of George Town Conurbation, Malaysia. Land 2020, 9, 373. [Google Scholar] [CrossRef]
- Benenson, I.; Torrens, P.M. Modeling Urban Land-Use with Cellular Automata. In Geosimulation: Automatabased Modeling of Urban Phenomena; Benenson, I., Torrens, P.M., Eds.; John Wiley & Sons, Ltd.: Hoboken, NJ, USA, 2004; pp. 91–151. [Google Scholar]
- Araya, Y.H.; Cabral, P. Analysis and Modeling of Urban Land Cover Change in Setubal Sesimbra, Portugal. Remote Sens. 2010, 2, 1549–1563. [Google Scholar] [CrossRef] [Green Version]
- Lee, Y.J.; Kim, S.J. Surveying and Geo-Spatial Information Engineering: A Modified CA-Markov Technique for Prediction of Future Land Use Change. J. Korean Soc. Civ. Eng. 2007, 27, 809–817. [Google Scholar]
- Gong, J.; Hu, Z.; Chen, W.; Liu, Y.; Wang, J. Urban expansion dynamics and modes in metropolitan Guangzhou, China. Land Use Policy 2018, 72, 100–109. [Google Scholar] [CrossRef]
- Kwon, P.J.; Ryu, J.C.; Lee, D.J.; Han, J.H.; Sung, Y.S.; Lim, K.J.; Kim, K.S. Comparative Analysis of Land Use Change Model at Gapcheon Watershed. J. Korean Soc. Water Environ. 2016, 32, 552–561. [Google Scholar] [CrossRef] [Green Version]
- Ryu, J.C.; Ahn, K.H.; Han, M.D.; Hwang, H.S.; Choi, J.W.; Kim, Y.S.; Lim, K.J. Evaluation and Application of CLUE-S Model for Spatio-Temporal Analysis of Future Land Use Change in Total Water Pollution Load Management System. J. Korean Soc. Water Environ. 2014, 30, 418–428. [Google Scholar] [CrossRef] [Green Version]
- Verburg, P.H.; De Koning, G.H.J.; Kok, K.; Veldkamp, A.; Bouma, J. A Spatial Explicit Allocation Procedure for Modelling the Pattern of Land Use Change Based upon Actual Land Use. Ecol. Model. 1999, 116, 45–61. [Google Scholar] [CrossRef]
- Elderbrock, E.; Enright, C.; Lynch, K.A.; Rempel, A.R. A Guide to Public Green Space Planning for Urban Ecosystem Services. Land 2020, 9, 391. [Google Scholar] [CrossRef]
- Kim, H.W.; Tran, T. An Evaluation of Local Comprehensive Plans toward Sustainable Green Infrastructure in US. Sustainability 2018, 10, 4143. [Google Scholar] [CrossRef] [Green Version]
- Benedict, M.A.; McMahon, E.T. Green Infrastructure: Linking Landscapes and Communities; Island Press: Washington, DC, USA, 2006. [Google Scholar]
- European Commission. Building a Green Infrastructure for Europe; Publication Office of the European Union: Luxembourg, 2013; p. 23. [Google Scholar]
- Kang, J.E.; Lee, M.J.; Koo, Y.S.; Jo, K.W.; Lee, J.W. Urban Renewal Strategy for Adapting to Climate Change: Use of Green Infrastructure on Flood Mitigation; Korea Environment Institute Research Report; Korea Environment Institute: Sejong, Korea, 2011. [Google Scholar]
- Li, F.; Wang, L.; Chen, Z.; Clarke, K.C.; Li, M.; Jiang, P. Extending the SLEUTH Model to Integrate Habitat Quality into Urban Growth Simulation. J. Environ. Manag. 2018, 217, 486–498. [Google Scholar] [CrossRef] [Green Version]
- Limin, B.; Chunliang, X.; Xinghua, F.; Daqian, L. Influence of Urbanization on Regional Habitat Quality: A Case Study of Changchun City. Habitat Int. 2019, 93. Available online: http://www.ncbi.nlm.nih.gov/pubmed/102042 (accessed on 2 July 2020).
- Sun, X.; Jiang, Z.; Liu, F.; Zhang, D. Monitoring Spatio-Temporal Dynamics of Habitat Quality in Nansihu Lake Basin, Eastern China, from 1980 to 2015. Ecol. Indic. 2019, 102, 716–723. [Google Scholar] [CrossRef]
- Xu, L.; Chen, S.S.; Xu, Y.; Li, G.; Su, W. Impacts of Land-Use Change on Habitat Quality During 1985–2015 in the Taihu Lake Basin. Sustainability 2019, 11, 3513. [Google Scholar] [CrossRef] [Green Version]
- Kim, T.Y.; Song, C.H.; Lee, W.K.; Kim, M.I.; Lim, C.H.; Jeon, S.W.; Kim, J.S. Habitat Quality Valuation Using InVEST Model in Jeju Island. J. Korean Soc. Environ. Restor. Technol. 2015, 18, 1–11. [Google Scholar] [CrossRef] [Green Version]
- Kim, B.S.; Oh, J.G.; Oh, H.S. The Current Number of Its Individuals and Management Plan of Roe Deer (Capreolus pygarus tianschanicus Satunin) Inhabiting Mt. Halla (Hallasan), Jeju Island, Korea. Korean J. Environ. Ecol. 2007, 21, 366–373. [Google Scholar]
- IUCN Red List of Threatened Species. Available online: http://www.iucnredlist.org (accessed on 27 August 2020).
- Veldkamp, A.; Fresco, L.O. CLUE: A Conceptual Model to Study the Conversion of Land Use and Its Effects. Ecol. Model. 1996, 85, 253–270. [Google Scholar] [CrossRef]
- Kim, J.H.; Park, J.H.; Song, I.H.; Song, J.H.; Jun, S.M.; Kang, M.S. Analysis of Land Use Change Using RCP-Based Dyna-CLUE Model in the Hwangguji River Watershed. J. Korean Soc. Rural Plan. 2015, 21, 33–49. [Google Scholar]
- Verburg, P.H.; Overmars, K.P. Combining Top-down and Bottom-Up Dynamics in Land Use Modeling: Exploring the Future of Abandoned Farmlands in Europe with the Dyna-CLUE Model. Landsc. Ecol. 2009, 24, 1167–1181. [Google Scholar] [CrossRef]
- Mas, J.F.; Filho, B.S.; Pontius, R.G.; Gutiérrez, M.F.; Rodrigues, H. A Suite of Tools for ROC Analysis of Spatial Models. I.S.P.R.S. Int. J. Géo Inf. 2013, 2, 869–887. [Google Scholar]
- Fawcett, T. An Introduction to ROC Analysis. Pattern Recognit. Lett. 2006, 27, 861–874. [Google Scholar] [CrossRef]
- Phillips, S.J.; Dudík, M. Modeling of Species Distributions with Maxent: New Extensions and a Comprehensive Evaluation. Ecography 2008, 31, 161–175. [Google Scholar] [CrossRef]
- Forman, R. Road Ecology: Science and Solutions; Island Press: Washington, DC, USA, 2003. [Google Scholar]
- Mckinney, M.L. Urbanization, Biodiversity, and Conservation. BioScience 2002, 52, 883–890. [Google Scholar] [CrossRef]
- Hall, L.S.; Krausman, P.R.; Morrison, M.L. The Habitat Concept and a Plea for Standard Terminology. Wildl. Soc. Bull. 1997, 25, 173–182. [Google Scholar]
- Tallis, H.; Ricketts, T.; Guerry, A.; Wood, S.; Sharp, R.; Chaplin-Kramer, R. In VEST User’s Guide. The Natural Capital Project; Stanford University: Stanford, CA, USA, 2018. [Google Scholar]
- Ministry of the Environment of Korea. National Survey on Natural Environment (2nd, 3rd, 4th); Ministry of Environment: Sejong, Korea, 2003; 2011; 2017.
- Seo, C.W. Wild Boar (Sus Scrofa Coreanus HEUDE) Habitat Modeling Using GIS and Logistic Regression. Ph.D. Thesis, The Graduate School of Seoul National University, Seoul, Korea, 2000. [Google Scholar]
Figure 1.
Study Site.

Figure 2.
Distribution area of the Siberian roe deer [34].
Figure 2.
Distribution area of the Siberian roe deer [34].

Figure 3.
2010 Jeju Island land-cover map.

Figure 4.
Jeju protected area map.

Figure 5.
Land-use allocation process [36].
Figure 5.
Land-use allocation process [36].

Figure 6.
Jeju Island watershed map.

Figure 7.
Land-use trend analysis graphs in (a) Urbanized areas, (b) Farmland, and (c) Natural areas.
Figure 7.
Land-use trend analysis graphs in (a) Urbanized areas, (b) Farmland, and (c) Natural areas.

Figure 8.
Area change by land-use type in 2030–2050 (unit: km2).

Figure 9.
Land-use maps in (a) 2030, (b) 2040, and (c) 2050.


Figure 10.
Changes in roe deer habitat quality by space for 2030–2050 (average value).

Figure 11.
Jeju deer habitat quality map for (a) 2030, (b) 2040, and (c) 2050.


Figure 12.
Classification of management directions by watershed.


Table 1.
Data sources for driving land-use change model.
| Data | File Format | Resolution | Creation Year | Source |
|---|---|---|---|---|
| Land-cover map | Raster | 30 m | 1990–2020 | Ministry of Environment (ME) of Korea |
| Digital Elevation Model (DEM) | IMG | 30 m | 2020 | National Geographic Information Institute (NGII) of Korea |
| Digital topographic map | dxf | 2020 | National Geographic Information Institute (NGII) of Korea | |
| Soil map | Shape | 2020 | Ministry of Agriculture, Food and Rural Affairs (MAFRA) of Korea | |
| Statistical yearbook | Excel | 2019 | Jeju Special Self-Governing Province |
Table 2.
Land-use change factors.
| Division | Change Factors | Source |
|---|---|---|
| Topography | Elevation | Digital Elevation Model (DEM) |
| Slope | ||
| Aspect | ||
| Geology | Effective soil depth | Soil map |
| Drainage grade | ||
| Soil character | ||
| Social economy | Distance from streams | Land-cover map |
| Distance from roads | ||
| Distance from cities | ||
| Distance from sea | Digital topographic map | |
| Population density | Statistical yearbook |
Table 3.
Default values of conversion elasticity.
| Farmland | Urban | Forest | Grassland | Bare Land | Water | |
|---|---|---|---|---|---|---|
| Value | 0.5 | 0.9 | 0.9 | 0.7 | 0.2 | 1.0 |
Table 4.
Default values of the conversion matrix.
| Farmland | Urban | Forest | Grassland | Bare land | Water | |
|---|---|---|---|---|---|---|
| Farmland | 1 | 1 | 0 | 1 | 1 | 0 |
| Urban | 0 | 1 | 0 | 0 | 1 | 0 |
| Forest | 1 | 1 | 1 | 1 | 1 | 0 |
| Grassland | 1 | 1 | 1 | 1 | 1 | 0 |
| Bare land | 1 | 1 | 0 | 0 | 1 | 0 |
| Water | 0 | 0 | 0 | 0 | 0 | 1 |
Table 5.
Threats to roe deer.
| Threat Factors | Maximum Impact Distance (km) | Weight | Decreasing Trend with Distance |
|---|---|---|---|
| Urban | 0.2 | 0.814 | Exponential |
| Roads | 0.2 | 0.465 | Linear |
| Farmland | 0.2 | 0.68 | Linear |
| Bare land | 0.2 | 0.7 | Exponential |
Table 6.
Sensitivity of habitat to threats.
| Habitat Type | Habitat Suitability | Threat Factors | |||
|---|---|---|---|---|---|
| Urban | Road | Farmland | Bare Land | ||
| Urban | 0.029 | 0.000 | 0.000 | 0.000 | 0.000 |
| Farmland | 0.273 | 0.482 | 0.263 | 0.240 | 0.400 |
| Forest | 0.524 | 0.850 | 0.530 | 0.765 | 0.700 |
| Grassland | 0.155 | 0.550 | 0.408 | 0.415 | 0.500 |
| Bare land | 0.004 | 0.326 | 0.150 | 0.250 | 0.350 |
| Water | 0.014 | 0.856 | 0.513 | 0.738 | 0.650 |
Table 7.
Area by land-use type from 2010 to 2050 and rate of change by type in 2010.
| Year | Urbanized (Urban + Bare Land) | Farmland | Natural (Forest + Grassland) | |||
|---|---|---|---|---|---|---|
| Area (km2) | Change Rate (%) | Area (km2) | Change Rate (%) | Area (km2) | Change Rate (%) | |
| 2010 | 116.6 | 733.1 | 950.2 | |||
| 2020 | 139.8 | 19.9 | 683.1 | −6.8 | 954.0 | 0.4 |
| 2030 | 162.9 | 39.7 | 633.0 | −13.6 | 957.9 | 0.8 |
| 2040 | 186.1 | 59.6 | 583.0 | −20.5 | 961.7 | 1.2 |
| 2050 | 209.3 | 79.5 | 533.0 | −27.3 | 965.5 | 1.6 |
Table 8.
Regression analysis results between each land-use type and land-use change factors (β values).
Table 8.
Regression analysis results between each land-use type and land-use change factors (β values).
| Land-Use Change Factor | Land-Use Type | |||||
|---|---|---|---|---|---|---|
| Urban | Farmland | Forest | Grassland | Bare Land | Water | |
| Aspect | 0.000246 | 0.000313 | 0.000339 | - | 0.000374 | −0.000995 |
| Slope | −0.054018 | −0.062016 | 0.113731 | −0.073059 | −0.030213 | −0.188145 |
| Elevation | 0.003425 | −0.005112 | 0.000876 | - | − | 0.002451 |
| Distance from roads | −0.023111 | −0.002209 | 0.001042 | - | −0.001137 | - |
| Distance from streams | −0.000230 | 0.000381 | 0.000189 | - | −0.000463 | −0.005207 |
| Distance from cities | −0.008269 | −0.001199 | 0.001129 | - | −0.002053 | −0.000670 |
| Distance from sea | −0.000148 | −0.000036 | 0.000098 | 0.000176 | 0.000041 | −0.000170 |
| Population density | 0.023501 | −0.044447 | −0.008532 | −0.001005 | 0.007420 | - |
| Effective soil depth | 0.096881 | 0.266295 | −0.218660 | −0.152839 | −0.049740 | - |
| Drainage grade | - | −0.151377 | - | - | 0.076155 | 0.193253 |
| Soil character | −0.037741 | - | 0.110120 | 0.226939 | - | - |
| Constant | 0.187266 | 1.267142 | −2.986911 | −3.212232 | −3.182950 | −2.830859 |
| Area Under the Curve (AUC) value | 0.915 | 0.921 | 0.931 | 0.823 | 0.819 | 0.858 |
Table 9.
Area and ratio of land-use by 2030, 2040 and 2050.
| Land-Use | 2030 | 2040 | 2050 | |||
|---|---|---|---|---|---|---|
| Area (km2) | Ratio (%) | Area (km2) | Ratio (%) | Area (km2) | Ratio (%) | |
| Urbanized Area | 140.71 | 7.78 | 162.77 | 9.00 | 183.26 | 10.13 |
| Used Area | 127.13 | 7.03 | 146.90 | 8.12 | 165.51 | 9.15 |
| Barren | 13.58 | 0.75 | 15.87 | 0.88 | 17.76 | 0.98 |
| Farmland | 714.93 | 39.52 | 674.07 | 37.26 | 633.57 | 35.02 |
| Natural Area | 953.37 | 52.70 | 972.17 | 53.74 | 992.19 | 54.85 |
| Forest | 670.85 | 37.08 | 684.50 | 37.84 | 698.46 | 38.61 |
| Grassland | 280.21 | 15.49 | 285.36 | 15.77 | 291.41 | 16.11 |
| Water | 2.31 | 0.13 | 2.31 | 0.13 | 2.31 | 0.13 |
Table 10.
2020 Cross-verification result of 2020 land-use change model results and land-cover map.
| Total | Farmland | Urban | Forest | Grassland | Bare Land | Water | |
|---|---|---|---|---|---|---|---|
| Accuracy (%) | 71.0 | 86.3 | 41.5 | 76.8 | 48.9 | 12.0 | 39.6 |
Table 11.
Average value of Jeju roe deer habitat quality.
| Region | 2030 | 2040 | 2050 | ||||||
|---|---|---|---|---|---|---|---|---|---|
| Min. | Max. | Mean | Min. | Max. | Mean | Min. | Max. | Mean | |
| Total | 0 | 0.524 | 0.306 | 0 | 0.524 | 0.304 | 0 | 0.524 | 0.303 |
| Within protected area | 0 | 0.524 | 0.477 | 0 | 0.524 | 0.477 | 0 | 0.524 | 0.476 |
| Outside protected area | 0 | 0.524 | 0.281 | 0 | 0.524 | 0.279 | 0 | 0.524 | 0.278 |
Table 12.
Average habitat quality results and management direction for each watershed.
| Region | 2030 | 2040 | 2050 | Habitat Quality Change | Management Direction |
|---|---|---|---|---|---|
| Total | 0.306 | 0.304 | 0.303 | Decrease | Improvement |
| WS 1 | 0.255 | 0.254 | 0.252 | Decrease | Improvement |
| WS 2 | 0.292 | 0.291 | 0.291 | Decrease | Improvement |
| WS 3 | 0.273 | 0.267 | 0.263 | Decrease | Improvement |
| WS 4 | 0.343 | 0.342 | 0.341 | Decrease | Improvement |
| WS 5 | 0.302 | 0.298 | 0.295 | Decrease | Improvement |
| WS 6 | 0.353 | 0.349 | 0.346 | Decrease | Improvement |
| WS 7 | 0.314 | 0.310 | 0.308 | Decrease | Improvement |
| WS 8 | 0.273 | 0.273 | 0.274 | Increase | Conservation |
| WS 9 | 0.216 | 0.217 | 0.217 | Increase | Conservation |
| WS 10 | 0.310 | 0.312 | 0.314 | Increase | Conservation |
| WS 11 | 0.334 | 0.334 | 0.334 | Maintain | Conservation |
| WS 12 | 0.382 | 0.380 | 0.376 | Decrease | Improvement |
| WS 13 | 0.345 | 0.338 | 0.331 | Decrease | Improvement |
| WS 14 | 0.337 | 0.335 | 0.334 | Decrease | Improvement |
| WS 15 | 0.336 | 0.335 | 0.335 | Decrease | Improvement |
| WS 16 | 0.258 | 0.259 | 0.259 | Increase | Conservation |
Publisher’s Note: MDPI stays neutral with regard to jurisdictional claims in published maps and institutional affiliations. |
© 2020 by the authors. Licensee MDPI, Basel, Switzerland. This article is an open access article distributed under the terms and conditions of the Creative Commons Attribution (CC BY) license (http://creativecommons.org/licenses/by/4.0/).
Share and Cite
MDPI and ACS Style
Lee, D.-j.; Jeon, S.W. Estimating Changes in Habitat Quality through Land-Use Predictions: Case Study of Roe Deer (Capreolus pygargus tianschanicus) in Jeju Island. Sustainability 2020, 12, 10123. https://doi.org/10.3390/su122310123
AMA Style
Lee D-j, Jeon SW. Estimating Changes in Habitat Quality through Land-Use Predictions: Case Study of Roe Deer (Capreolus pygargus tianschanicus) in Jeju Island. Sustainability. 2020; 12(23):10123. https://doi.org/10.3390/su122310123
Chicago/Turabian StyleLee, Dong-jin, and Seong Woo Jeon. 2020. "Estimating Changes in Habitat Quality through Land-Use Predictions: Case Study of Roe Deer (Capreolus pygargus tianschanicus) in Jeju Island" Sustainability 12, no. 23: 10123. https://doi.org/10.3390/su122310123
Note that from the first issue of 2016, this journal uses article numbers instead of page numbers. See further details here.