Walking toward Metro Stations: the Contribution of Distance, Attitudes, and Perceived Built Environment


1
Escuela de Arquitectura Temuco, Facultad de Humanidades, Universidad Mayor, Av. Alemania 281, Temuco 4780000, Chile
2
Academic Researcher, Universidad Católica del Maule, San Miguel 3605, Talca, Chile
3
Department of Urban Studies, Apadana Institute of Higher Education, Shiraz 7187985443, Iran
*
Author to whom correspondence should be addressed.
Sustainability 2020, 12(24), 10291; https://doi.org/10.3390/su122410291
Submission received: 17 September 2020
/
Revised: 15 November 2020
/
Accepted: 16 November 2020
/
Published: 9 December 2020
(This article belongs to the Special Issue Walkable living environments)
Abstract
:Walking as an active means of travel is important as a sustainable mode of transport. Moreover, the level of walking in the surrounding areas of metro stations would contribute to maintaining the minimum rate of physical activity and, therefore, inhabitants’ general health. This study examined the impacts of walking attitude, walking distance, and perceived built environment on walking behavior for reaching the metro stations in Shiraz, Iran. Three metro stations were selected and a quantitative approach was used to examine the objectives. It was found that the average walking distance is less than the average in developed countries, such as the United States. People walked more when there was a shorter distance between their starting points and the metro stations. The contribution of walking attitudes and several built environment attributes to walking behavior was demonstrated. Finding the contribution of aesthetic attributes, such as accessibility to parks and housing types of the starting points of the walking trips, to walking for transport are taken into account as the novelties of this study. Policy makers of this city may apply the findings of this study—especially around the metro stations—to improve the average walking distance as well as walking behavior.
1. Introduction
Private cars are the dominant travel mode in the cities of Iran and these cities suffer from high vehicle traffic congestion and lack of route infrastructure to support daily growing numbers of vehicles. At the same time, walking as an active mode of travel is important as a sustainable mode of transport. According to the ecological model, walking is influenced by a variety of factors including socio-economic factors, built environment, and others [1].
Travel behavior studies have demonstrated the link between the built environment and walking as an active mode of travel [2,3,4,5,6,7,8] (Section 2.1). These studies mostly focused on macro scale related factors (the scale of neighborhood and bigger), such as density and diversity, and rarely studied the impacts of design related factors, such as the impact of quality of the pedestrian environment on walking for transport [9,10]. For instance, Southworth [11] stated that urban design has rarely been an integral part of transport planning and numerous research studies in different contexts are required to understand and generalize the role of design factors on promoting walking for transport. In addition, some of these studies investigated the use of walking based on certain types of origin/destinations; for instance, walking to/from work, school and shopping [12], but less attention has been paid to the impact of the type of origin/destination on walking behavior.
In addition to transport studies, which have examined walking as an active mode of travel, the impact of built environment attributes on walking was more broadly investigated in studies on physical activity and public health, which considered walking as one of the most common types of daily physical activity (Section 2.2). The majority of these studies considered walking based on its purpose, whether walking for recreation and/or utilitarian walking (walking for transport). According to these studies, the built environment attributes influencing walking for transport include neighborhood walkability score, functional aspects, such as the presence of sidewalks, residential density, land use mix–access, street connectivity, traffic safety, and personal security [13,14,15,16,17]. In regards to the context of this study, Bahrainy et al. [18] found that transport walking is only influenced by the steepness of sidewalks. In addition, the contribution of attitudes toward walking as associated with walking for transport was indicated by previous studies [12,19]. Most of these studies—which are involved with the impacts of design and aesthetic related factors on walking behavior—have used perceptual assessment of environmental attributes. For instance, Smith [20] found that perceptions have slightly higher explanatory power than objective measures, especially in relation to aesthetic attributes in models of walking behavior. This shows the importance of perceptual assessment in design related factors with regards to walking for transport.
The metro system started to work in the city of Shiraz a few years ago to reduce the traffic congestion of the transport system. The short pathways between rail transit stations, such as metro stations, and their adjacent land uses are the areas that people use to walk in during their daily transport; and, thus, would contribute to maintaining the minimum rate of physical activity and, therefore, inhabitants’ general health. In addition, the influence of environmental factors on walking behavior around the metro stations has been studied in detail in a western context, but generally it has been rarely studied in the context of developing nations and Iran. This situation confirms the importance of the surrounding areas of metro stations in highlighting the contribution of environmental attributes, especially perceived design related attributes to walking behavior both to and from the rail transit stations. Previous studies indicated that shorter time, as well as distance, is the first path choice criteria of pedestrians in these areas [21]. These studies also showed the contribution of built environment features such as safety, mixed land use, street connectivity, and urban design qualities, such as legibility of the pedestrians’ path choice in parallel to the contribution of shorter time and distance [21,22,23,24] (Section 2.3). Due to the importance of walking attitudes and walking with others in relation to walking behavior, these factors are also considered in this research.
Furthermore, regarding the importance of time and distance for path choice and walking behavior, it is important to understand how far the pedestrians walk to and from the metro stations. Agrawal et al. [21] found that Americans walked an average of half a mile to the rail stations. Moreover, Sun et al. [24] found that the walking time from the metro station to a destination was 8 min in the context of China. Generally, the average walking distance has been rarely surveyed in the context of developing nations and Iran; thus, there is a need for it to be examined in this context.
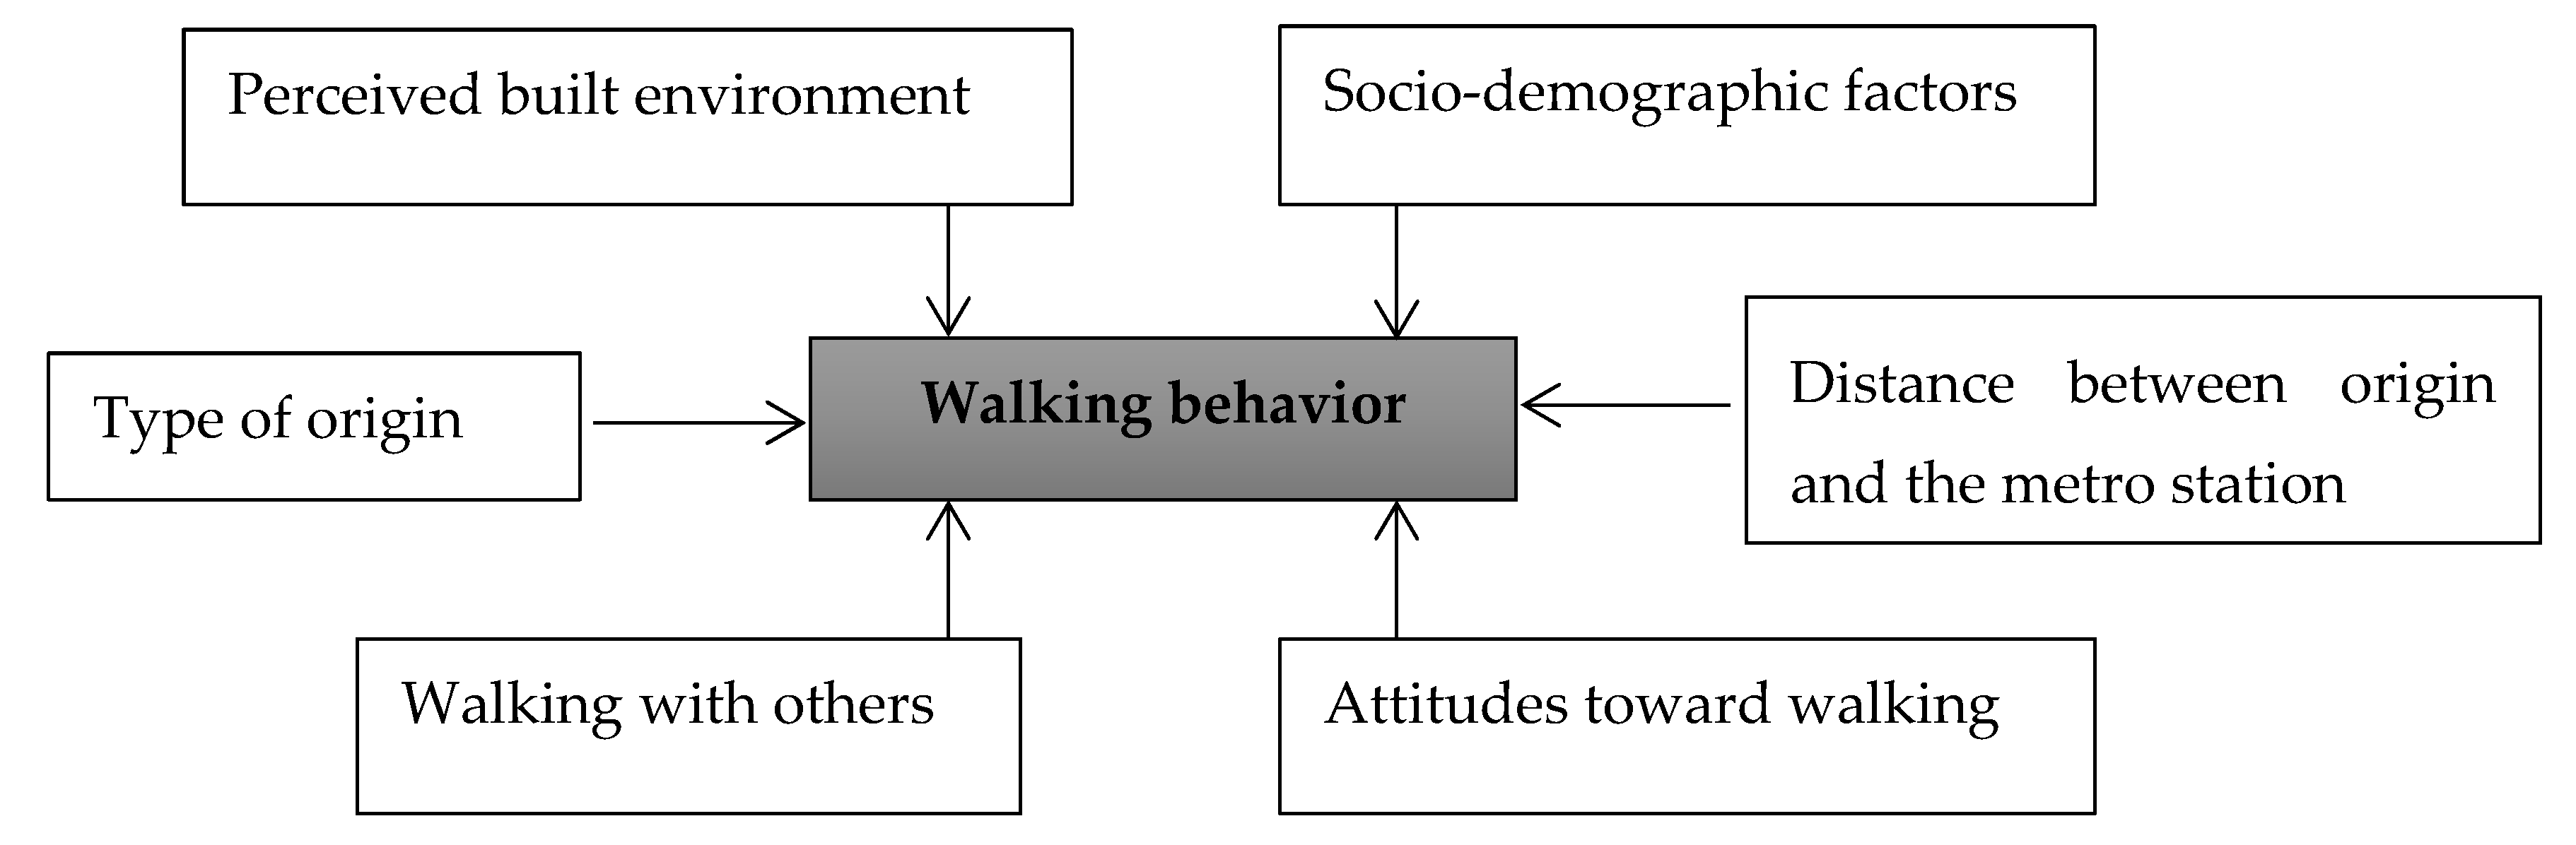
Accordingly, this study examines the impact of sociodemographic factors, perceived built environment, walking attitudes, and walking with others on walking for transport to reach the metro stations in Shiraz, Iran. In addition, the average walking distance to metro stations is measured as well. The conceptual framework of this research is shown in Figure 1. The questions of this research are as follows:
Do the sociodemographic factors, walking attitudes, perceived built environment, distance between origin and destination, and walking with others, contribute to walking for transport to reach the metro station?
Does the type of starting points in the walking trips to reach the metro stations influence the walking behavior?
What is the average walking distance to reach the metro stations in this city?
2. Literature Review
2.1. Walking as an Active Mode of Travel and Its Contributing Environmental Factors
Most of the studies on active travel have used the utility-maximizing concept. Oakes et al. [25] stated that the population and employment density have an impact on walking by increasing traffic congestion and making it more convenient to walk. In contrast, Sarker et al. [26], who explored the actual walking distance to public transport stations, found that respondents living in low-density areas walk longer than residents living in nearby inner city areas to reach the public transport stations. The positive impact of measure of land uses, including population/residential and/or employment density and mixed land use, on walking as an active mode of transport is consistent among the majority of travel behavior studies [6,8,27,28,29]. Kamruzzaman et al. [30] mentioned that mixed land use with facilitating participation in local activities contributes to reducing the necessity of using vehicles to participate in distant activities.
A transportation system including factors of pedestrian environment, such as ease of street crossing, presence of sidewalk, sidewalk width, sidewalk continuity, well connected street network, street density, and topography, also have positive effects on walking as an active mode of travel [25,27,30,31]. Well connected street network and increasing the number of alternative routes both contribute to proximity of destinations and a more efficient travel patterns [25]. Street connectivity together with path continuity—including minimal obstacles for walking movement and no necessity to cross major roads—contributes towards increasing walking as an active mode of travel [32].
According to Handy [10], higher accessibility means that more destinations are found nearby, which makes non-motorized travel more feasible. Accessibility, which reflects both the locations of land uses and characteristics of the transportation system, measured differently through distance to particular destinations whether straight-line distance [33] or network distance [34], number of public transit stations in neighborhood [35], and the number of potential destinations in the selected areas [3,35]. In this regard, access to workplaces, shops, services, and public transport showed a significant correlation with walking as an active mode of travel [3,8,27,30,35].
Few studies on travel behavior, which focus on walking, include measures of design and pedestrian environment/path context. Several aspects were found to be related to path context, such as visual interest, visibility of landmarks along the pathways, views of public gardens, design of the street, transparency of fronting structures, visible activity, street trees, and lighting [11,34]. Handy et al. [34] used perceived environmental attributes, such as safety, shade, houses, scenery, traffic, people, and stores. They found that certain design guidelines, including continuous sidewalks between residential and commercial areas, providing ample street trees, and reducing traffic in residential areas, make walking and shopping locally more attractive choices. Kitamura et al. [7] found that the quality of the residential neighborhood is generally insignificant in relation to the number of trips. Ewing and Handy [9] operationalized the measurement of five urban design qualities including imageability, enclosure, human scale, transparency, and complexity based on their related physical features and showed their contribution to overall walkability and walking behavior. In addition, the role of walking attitudes on walking for transportation have been broadly indicated in the studies that focused on walking as an active travel mode [7,12,30,36].
2.2. Utilitarian Walking (Walking for Transport) in Physical Activity and Public Health Studies
Most of the environmental factors that were found to be associated with walking for transport in the studies on physical activity and public health are the same as those that were found in the travel behavior studies focusing on walking as an active mode of travel.
Access to a variety of destinations, such as shops, services, and work, and mixed land use are the most important built environment attributes that contribute to walking for transport [13,17,31,37,38,39,40,41,42]. Access to public transport is the next factor associated with walking for transport [13,41]. Residential density was also found to correlate with walking for transport [15,16,17]. Street connectivity was also associated with environmental factors, which broadly contributed to utilitarian walking [13,15,31]. Walking facilities, such as the presence of sidewalks, sidewalk quality, and benches were also broadly stated as a factor associated with walking for transport [13,31,37,40]. In regards to this context, Bahrainy et al. [18] found that transport walking is only influenced by steepness of sidewalks. Presence of bicycle lanes was also associated with utilitarian walking [38,40]. Safety, including both traffic safety and personal security was also broadly stated as relating to walking for transport [13,15,31,37,38,43,44]. This is while the aesthetic attributes of the walking environment are a factor that is rarely stated as relating to utilitarian walking in previous studies [13,15].
Furthermore, the neighborhood walkability score was significantly correlated with walking for transport [14,15,45,46]. However, these studies have used different built environment attributes to measure the walkability index [47]. The environmental factors mostly used to measure walkability index in these studies include accessibility of destinations (stores, park, and beach), mixed land use, street connectivity, comfort, traffic safety, personal security, and pleasantness [47]. Finally, the contribution of attitudes toward walking, such as enjoyment, importance, and positive experience in the past [12,19,48], and walking environment, such as social contact [13,38] were indicated to be associated with walking for transport.
2.3. Walking to/from Metro Stations and Its Related Built Environment Factors
Agrawal et al. [21] studied route choices and walking trips of pedestrians to five rail transit stations in California and Oregon. They found that minimizing the distance walked was the most important factor influencing their choice of route, followed by safety factors as the second most important criterion. Aesthetic elements of the built environment, on the other hand, were rarely contributing factors towards choice. Sun et al. [24] examined the influence of local environmental characteristics on walking access at six metro stations in three distinctly different physical settings in Beijing, China. Based on this research, better connectivity, pedestrian-friendly designs, and higher building coverage ratio around the metro station promote easier walking access and have the potential to capture more metro riders. Kim et al. [22] focused on analyzing the associations between pedestrian traffic volume in the streets and characteristics of built environments, particularly at the street and neighborhood levels around metro stations in Seoul. They found that pedestrians near to metro stations tended to walk in wider streets whereas narrower streets were preferred by people in areas further from the metro stations. In that study, street connectivity and mixed land use were the most consistent predictors of pedestrian traffic volume [22].
In regards to walking time and distance to and from destinations in daily transport, Agrawal et al. [21] found that Americans walk an average of half a mile to the rail stations. Kim [49], who surveyed the walking distance from Glen Park and Rockridge BART stations in the San Francisco Bay Area to the final destinations, found that pedestrians walked 548 m on average and up to 1100 m, exceeding ¼ mile (400 m). Sun et al. [24] found that the walking time from the metro station to a destination was 8 min in the context of China. Millward et al. [50] surveyed the average walking distance to different destinations for a medium-sized North American city and found that most walks are shorter than 600 m, and very few exceed 1200 m.
3. Materials and Methods
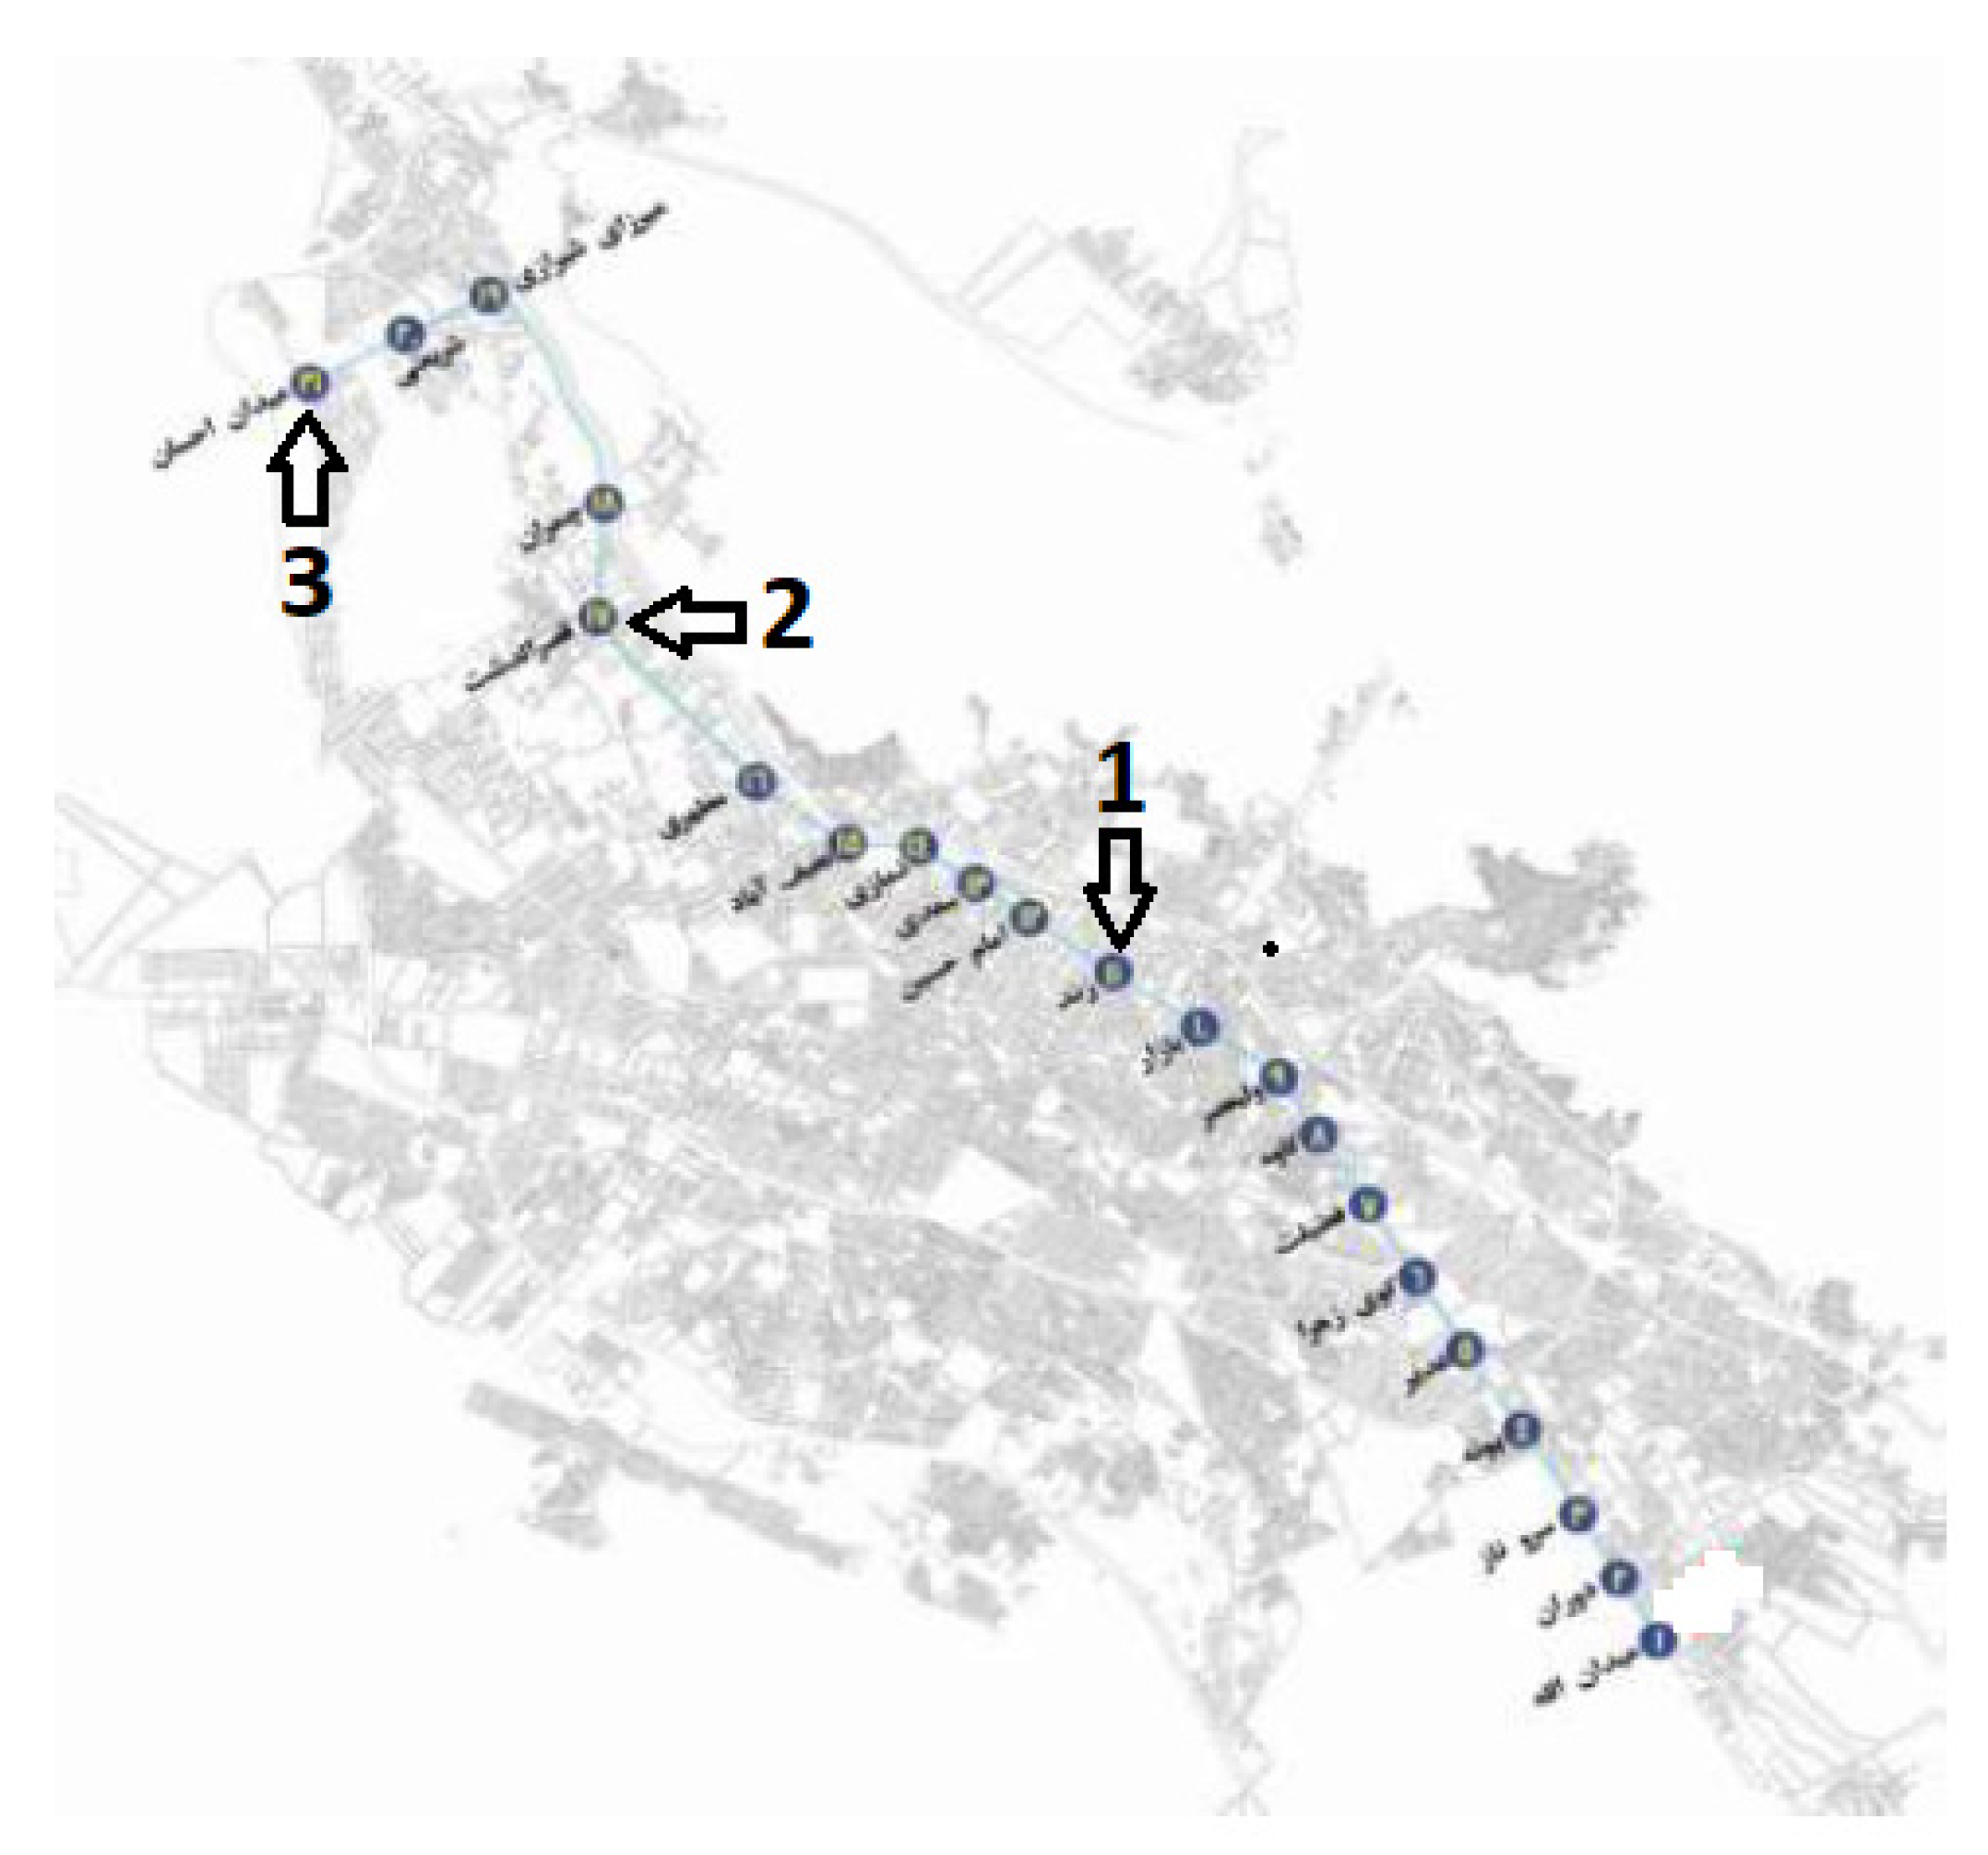
Shiraz is a historic city with a temperate climate that has evolved during different periods. It is generally made up of three distinct parts, including the central business district (CBD), the subcenter districts, and the inner-suburban areas. The metro system of Shiraz has a total of six lines out of which four lines are under construction and line 1, being the main line, was constructed and came into operation some years ago (Figure 2). This line connects Ehsan metro station to Allah Square station.
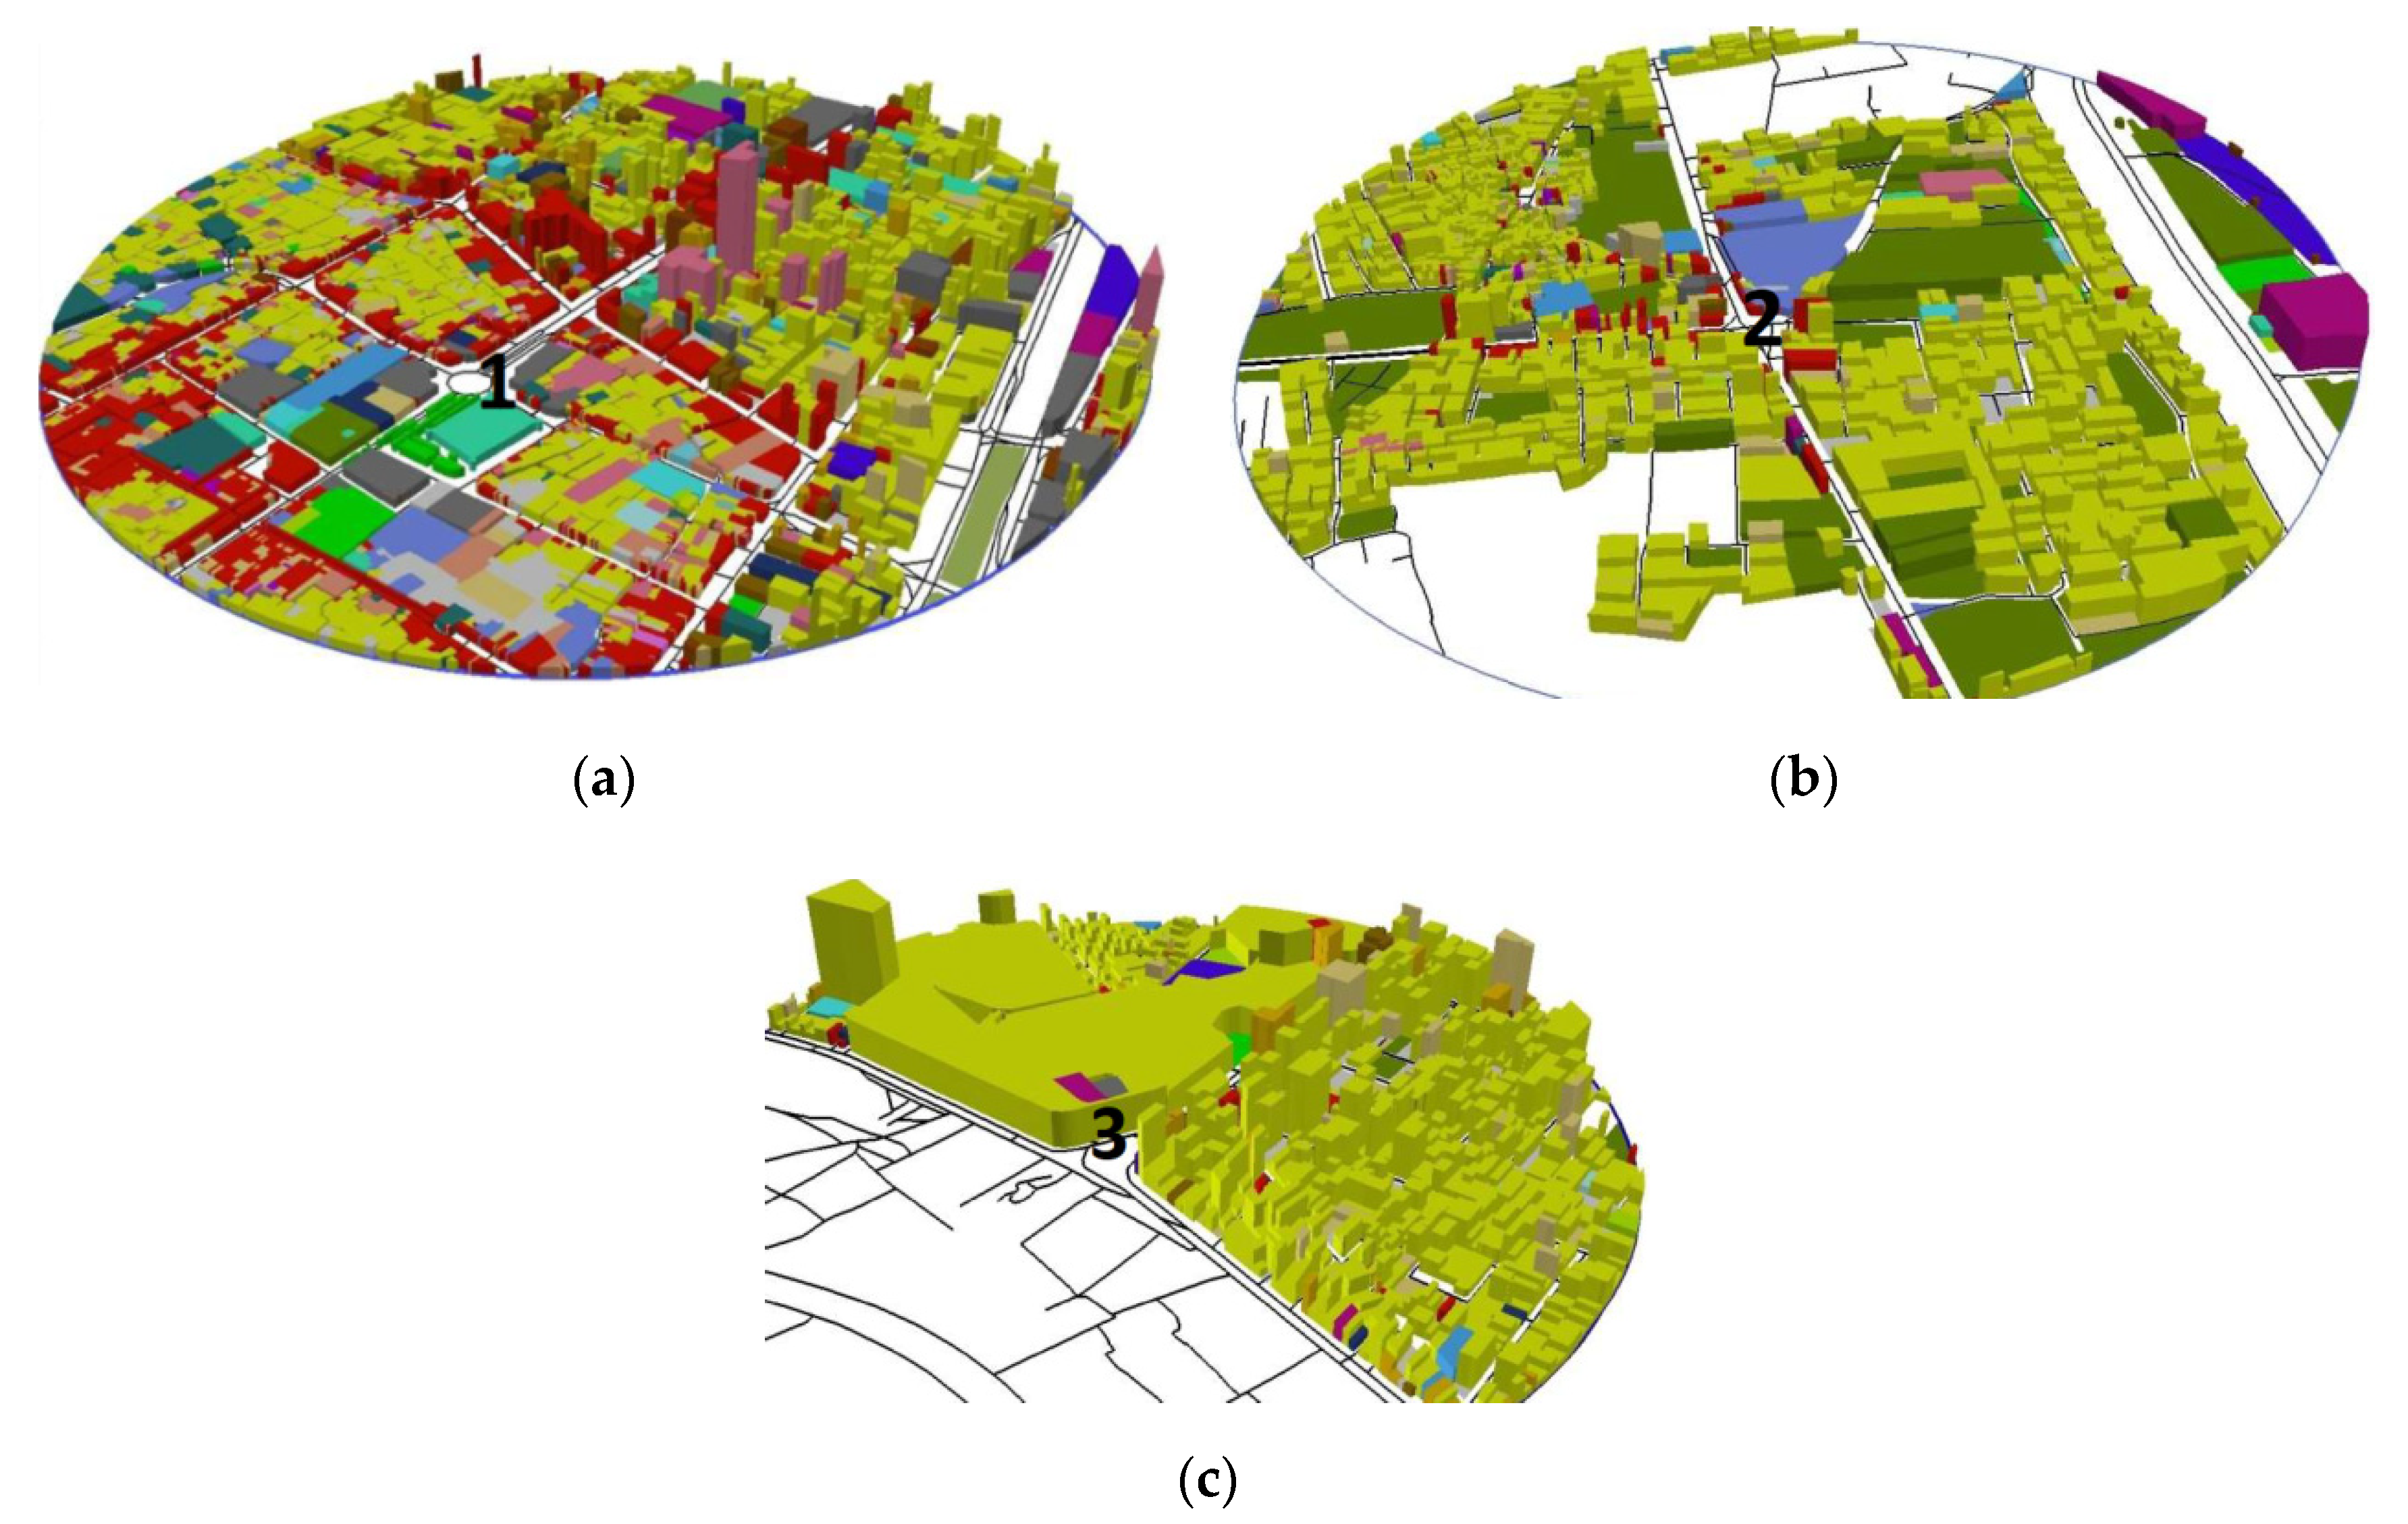
Two criteria were used to select the metro stations for this study (Table 1). Firstly, due to considering the built environment and origin land uses of walking trips, related to walking behavior in this study, the types of urban texture around the metro stations in terms of the factors influencing walking behavior, including land use diversity, block density, and intersection density, were studied and classified (Table 1). In regards to the land use diversity, this study evaluates seven types, including residential, commercial and services, parks and green spaces, educational, public (health and sport), cultural-religious, and industrial land uses. By identifying and categorizing types of urban texture around all the metro stations of the city (radius of 700 m from the stations), we tried to include all types of identified urban textures in the final selected stations as much as possible (Table 1). This is especially necessary since the findings of the study are to be generalized to all the metro stations’ surrounding areas in the city. The second criterion was the selection of the metro stations based on the comparative numbers of pedestrians trying to reach them (Table 1). In fact, regarding the focus of the study on walking behavior around the metro stations, they were to be selected in a way that shows the high level of people who walk to reach them. In this regard, the walking levels of pedestrians in all of the metro stations were observed, and those with the highest level of pedestrians’ walking to reach the metro stations were selected (Table 1). Based on these criteria, three metro stations—Zandiyeh metro station in zone 2 of Shiraz Municipality, Ghasrodasht metro station in zone 1 of Shiraz municipality, and Ehsan metro station in zone 6 of Shiraz municipality—were selected (Figure 2). The surrounding areas of these metro stations are shown in Figure 3. In these figures, the locations of the metro stations are indicated by numbers 1, 2, and 3.
A sample of 395 people was selected through considering the total numbers of train passengers who entered the selected metro stations during one week based on the Cochran formula. Table 2 shows the number of pedestrians who entered each of the selected metro stations and the determined number of respondents for each station. The respondents were selected based on the metro stations where they arrived. Then, if they agreed to participate in the study, they were followed by the research team until their destinations on the train so that the questionnaires were completed in the presence of the research team. The respondents were also over 16 years of age and a mixture of male and female. To examine the real distance of the respondents’ walk to the metro stations, they were asked to clarify the starting point and the routes and sidewalks that they took to reach the metro stations. In cases where it was difficult to trace the information on a map, the research team helped to carry it out with the assistance of the respondents. Then, the walking routes of the respondents were transferred to GIS and the metric distance of each walking trip was measured.
A survey questionnaire was used to measure the sociodemographic factors, perceived built environment attributes, level of walking with others, walking attitudes, and level of walking to the metro station on a 5-point Likert scale (from 1 = strongly disagree, to 5 = strongly agree). Neighborhood Environment Walkability Scale (NEWS) was used to measure the built environment attributes [51]. Selected items were modified to make them more applicable to the context of this city. In fact, they were revised according to the design attributes and qualities presented in the context. For instance, certain questions regarding path context and design qualities were added and some questions were omitted due to the absence of measurable factors in the context. The content validity of the survey questionnaire was examined by some experts in the field after the modifications made based on the feedback.
Perceived built environment characteristics were measured for traffic safety, personal security, functional aspects of walking, aesthetic aspects of walking environment, accessibility, and certain urban design qualities related to the context, such as legibility and enclosure. Walking attitudes were measured using a 5-item scale extracted from previous studies in the field [52,53]. In addition, the International Physical Activity Questionnaire (IPAQ) was used as the basis for measuring the level of walking of respondents to the selected metro stations [38]. In the survey questionnaire, respondents were asked to mention the number of walking trips they made during the last 7 days to the selected metro stations and the estimated time (minutes) taken for each walking trip. Finally, in regards to the question on types of starting point, the prominent types of land use taken from the maps of the selected areas were analyzed to be used for the different categories. The respondents were also asked to clarify the nature of their destination after leaving the metro stations.
SPSS software version 23.0 was used to analyze the data. To measure the questionnaire’s reliability Cronbach’s Alpha was used. The Cronbach’s Alpha reliability coefficient was 0.902, which shows a high level of questionnaire reliability. Confirmatory factor analysis was used to identify the latent factors behind the groups of items, which measured the environmental attributes. In addition, to enter the types of starting point as the nominal variable in the regression analysis, it was transformed to several dummy variables. Finally, to predict a dependent variable from the independent variables, multiple regression analysis was applied and it was adjusted for sociodemographic variables as potential confounders.
4. Results
Table 3 shows the descriptive analysis of the indigenous and exogenous variables along with the study areas. In regards to socioeconomic characteristics, most of the respondents (65.3%) are between 19 to 29 years old. Most of the respondents are male (62.5%) as compared to female (37.5%). Likewise, most of the respondents are among a low-income group since 58% of the respondents receive less than ten million Rials. The majority of the respondents (73.4%) do not have private cars and most of them graduated with a Bachelor’s degree (41.3%). The majority of the types of starting point are from educational land uses: schools, colleges, and universities (37%), followed by offices (18.7%) and houses (16.5%). Likewise, most of the destination types after leaving the metro stations are dedicated to educational land uses (29.6%) followed by houses (15.6%) and commercial land uses (15.6%). This shows that transport trips to/from educational land uses are the main type for pedestrians who walk to/from the metro stations in this city. In addition, most of the respondents walk with others (66.6%). Moreover, finally the average mean of the inclusive items of the walking attitudes (3.92) shows that a majority of the respondents have the tendency to walk.
Confirmatory factor analysis was used to identify the latent factors behind groups of items, which measured the environmental attributes. (Maximum likelihood, 63.73% variance explained, KMO = 593). As a result of this process, nine main perceived environmental factors were identified: (1) “Aesthetic, comfort, and convenience aspects”; (2) “Traffic safety”; (3) “Functional aspects and facilities along the path (physical comfort)”; (4) “Accessibility to shops and public transport (convenient environment)”; (5) “Personal security”; (6) “ Continuity of walking movement together with sense of comfort”; (7) “The width of the sidewalks”; (8) Legibility along the path; and (9) “Enclosure along the street” (see Table 4). Almost all the new factors and their inclusive items except the factor of “Aesthetic, comfort, and convenience aspects” follow the constructions of the factors used in the previous studies and the Neighborhood Environment Walkability Scale (NEWS), which was used as the basis to measure the perceived environmental factors in this research. “Aesthetic, comfort, and convenience aspects” includes the items that show the aesthetic attributes, including attractive natural sights and buildings, variety of views and litter free paths, a comfort aspect including the shade from trees and buildings, and three convenience aspects including presence of alternative walking routes, presence of parks as well as other recreational areas and possibility of seeing human activities inside the buildings. This new factor is interesting, as it combines several aesthetic, comfort, and convenience aspects of walking environment. This shows the similar functions of these attributes in regards to walking for transport. These factors and their inclusive items are shown in Table 4.
Table 5 shows the results of the multiple regression analysis. The results indicate that the model is adequate to explain the relationship. R2 (0.336) shows that the independent variables of this study exhibit an explicative power of almost 0.336 to predict the dependent variable (walking behavior). In this regard, the sociodemographic factors, including monthly income (β = −0.143, p = 0.002) and owning private cars (β = 0.190, p = 0.000) showed significant correlations with walking behavior. The respondents with more monthly income walk less and those who do not have private cars walk more in the selected areas.
Walking attitudes showed the highest significant positive correlation with walking behavior from among the independent variables of this study (β = 0.289, p = 0.000). In addition, the distance between starting points and metro stations showed a significant negative correlation with walking behavior (β = −0.185, p = 0.000). Indeed, people with more positive attitudes toward walking walk more, and less distance between starting points and metro stations also contributes to more walking by pedestrians.
Housing type was determined as the basis in the process of transforming the origin types to dummy variables. It was found that people walk significantly more from the housing type when it is compared with the educational types of starting point (β = −0.122, p = 0.05). The other types of destinations did not show a significant contribution to walking behavior when compared to the housing types of starting points.
In regards to the impact of perceived environmental attributes on walking behavior, aesthetic, comfort, and convenience aspects (β = 0.111, p = 0.05), traffic safety (β = 0.120, p = 0.01), and personal security (β = 0.101, p = 0.05) showed significant positive correlations with walking behavior. These associations show that the increases/decreases in these environmental attributes contribute to an increase/decrease in walking behavior in the selected areas.
Finally, Table 6 shows the metric distance between the starting points and the metro stations. According to this table, the mean of the metric distance between the starting point and the metro stations is 336 m. The minimum distance is 14 m and the maximum distance is 1598 m. The majority of the walking trips are less than 700 m in which the numbers of walking trips significantly decrease for more than 700 m distance between starting points and the metro stations.
5. Discussion and Conclusions
People with lower monthly income walk more to the metro stations. This finding is consistent with the previous studies mentioning that lower household income was associated with more walking for transport and vice versa [54,55]. In addition, people who have private cars walk less when compared to those who do not have a private car. This finding is also consistent with the finding of previous studies, which found that people with lower car ownership walk more for transport [6,38,56]. This finding shows that in such a city, with a high level of private cars and traffic congestion, policy makers need to focus on decreasing the level of car ownership in order to strengthen walking behavior.
As expected in consistency with other studies’ findings, distance showed a significant negative correlation with the walking level of the respondents [21]. People walk more frequently over a shorter walking distance and vice versa. The average walking distance in this context is 336 m. This is apparently less than the average walking distance in developed countries. For instance, the average walking distance to rail stations is half a mile (805 m) in the US [21] and to other destinations in San Francisco and other cities of the US it is from 548–600 m up to 1100–1200 m in a few cases [48,50]. This shows that people normally walk less in this context. Transport policy makers need to work on improving the average walking level in this city with certain motivational programs promoting active travel. Such programs would contribute to a gradual shift away from private cars to a more active mode of transport and solve the problem of traffic congestion in this city. Moreover, walking attitudes were found by this research to have a significant impact on walking for transport. This is supported by the results of previous studies [12,19].
This research found a significant positive correlation between the factor of “aesthetic, comfort, and convenience aspects of the walking environment” with walking for transport. The subcriteria of this perceived factor are indeed classified into three categories of aesthetic aspects, including attractiveness of natural sights and buildings, variety of views, litter free paths, and transparency of facade; comfort aspect including shading by trees and buildings and convenient aspects made by presence of alternative routes and presence of parks. In terms of the availability of alternative routes as one of the convenience aspects, the finding of this study supports previous studies, which found an association between street connectivity and walking for transport [25,27,30,31]. Likewise, shade as a comfort aspect of walking supports the results of previous studies on the necessity of climatic and thermal comfort in relation to pedestrians’ movement in an urban setting [57,58,59]. This finding is also justified by the hot climate of this city, which raises the importance of thermal and climatic comfort in public places.
In terms of other convenience aspects, including accessibility to parks as found in this research, previous studies found the association between accessible destination types, such as workplaces, shops, services, and public transport and walking for transport [3,27,30,31,35]. Moreover, to our knowledge, these studies did not find an association between recreational types of destinations, such as parks, and walking for transport.
Likewise, in regards to aesthetic attributes of the walkways, our finding is contrary to findings of other studies. While the contribution of aesthetic attributes to walking for recreation has been broadly demonstrated by previous studies [12,31,37,60,61], previous studies have rarely mentioned the association between aesthetic attributes and walking for transport [39]. Indeed, according to the relevant studies there is a low association of aesthetic attributes such as attractiveness of views and natural landscape with walking to/from the transit stations [21].
The findings of these aesthetic and recreational aspects in regards to walking for transport in this study are the novelties of this research and may be related to certain cultural aspects in this city. The city of Shiraz is famous as the cultural capital of Iran. Many world famous poets have lived in this city and people of this city have paid much attention to the cultural and recreational aspects of their lives. In this regard, the aesthetic attributes and the convenience aspects, such as access to parks, play a role in the level of walking toward the metro stations. In such a context, people tend to take shorter daily walking trips and the average walking distance is less than the global average, improvement of such aesthetic and recreational attributes along the sidewalks contributes to an increase in the level of walking.
In addition, the significant correlation between traffic safety and walking behavior as it was found in this research is strongly supported by previous studies [14,15,21,31,37,39]. The priority in the transport system of this city has been given to private cars and street development and not pedestrian movement. Private high-speed cars are observed in different types of streets even in the local alleys. That is why little attention has been given to improve the pedestrian crossings in this city. In addition, there is a lack of traffic calming devices such as speed humps, traffic lights for pedestrians, and crosswalks and they are only found at the main junctions. Moreover, motorcycles sometimes use sidewalks to bypass the traffic congestion. This was included as a safety related indicator in this study. This situation contributes to the emergence of traffic safety as the main concern of pedestrians, especially while crossing the streets. Moreover, this is the main reason for traffic safety as a factor with a significant positive correlation with walking for transport. The safety related criteria included in this research need to be improved to enhance walking around the metro stations. Moreover, this improvement in traffic safety also requires training drivers to respect pedestrians, which means working on certain cultural and educational aspects in relation to the transport system. It is the duty of transport policy makers to concentrate on such aspects.
Furthermore, personal security showed a significant positive correlation with walking behavior. Personal security includes factors such as visual connectivity between buildings and their adjacent public places, the number of people on the sidewalks, and sufficient illumination of sidewalks. This finding supports the results of previous studies, which found a correlation between personal security and walking for transport [31,62]. It can be inferred that the main reason for personal security as a significant factor is due to a high level of crime density especially in the surrounding areas of one of the selected metro stations called Zandiyeh, which is located in the center of the city [63]. The studies on criminology indicated a higher crime density in the city centers [64]. According to studies on criminology, the presence of people impacts dynamic surveillance, and the possibility of controlling public places from buildings impacts stationary surveillance. The theory of defensible space of Newman [65] supports the necessity for stationary surveillance and the theory of virtual community of Hillier [66] supports the necessity for dynamic surveillance. Thus, both these types of surveillance have been shown to be related to personal security and were, therefore, included in this study. Moreover, the contribution of lighting to personal security has been indicated by previous studies as well [67,68,69]. Finally, our observation also led us to mention that the lighting situation around the metro stations is not suitable. Thus, it should be improved around the metro stations. This should, therefore, be improved in order to enhance personal security and walking behavior around the metro stations.
One of the novelties of this research was the consideration of the influence of the starting points on walking behavior. Previous studies examined walking behavior based on certain types of starting point/destination; for instance, walking to/from work, school, and shopping [12], but less attention has been paid to the impact of the type of starting point/destination on walking behavior.
Among different types of starting point, only the combination of housing type versus educational type showed a significant contribution to walking behavior. People walk significantly more from the housing type when compared with educational types of starting point. Land use diversity was one of the subcriteria in choosing the metro stations, and the metro stations were selected in a way to encompass all types of stations in terms of land use diversity. Thus, the selected metro stations are representative of the whole existing metro stations in terms of land use diversity. In this regard, this result could be expanded to all the existing metro stations in this city. This result shows that the compositions of housing and educational types of starting point contribute to walking for transport. Educational types are the most common type of starting points in the selected areas (37%) followed by recreational (18.7%) and housing types (65%). Furthermore, considering the types of destination after leaving the metro station showed that educational type destinations is the most frequent destination type (29.6%) followed by housing type (15.6%). Moreover, the sum of these two types of land use covers 45.2% of the total types of destination. This shows that the trips between educational land uses (school, college and university) and housing are the most common type of transport trips to/from the metro stations in this city. Moreover, people walk more from housing types to metro stations in the compositions of these two types of land uses in the selected areas. Considering that most of the data collection time was during the morning, one interpretation is that the students are more energetic when they start their morning walking trips toward the metro stations from their home. Moreover, this gives them a motivation to walk more. The contribution of types of starting point towards walking for transport could be further investigated by future studies to give a better picture of such interrelationships.
It was stated that people walked more over shorter walking distances. In addition, the average walking distance to the metro stations found in this research is less than the average in other developed countries, such as the United States. Thus, it needs to be significantly improved. On the other hand, the contributions of several sociodemographic factors as well as psychological and environmental attributes to walking for transport were found in this study. The policy makers of this city could apply the findings of this study especially in the walking environment around the metro stations in order to improve the walking behavior and increase the average walking distances to/from the metro stations.
Author Contributions
Conceptualization, M.P.; methodology, M.P. and A.K.F.; formal analysis, M.P.; investigation, M.P.; data curation, M.M.K.; writing—original draft preparation, M.P. and A.K.F.; writing—review and editing, M.P. and A.K.F.; supervision, M.P. and A.K.F. All authors have read and agreed to the published version of the manuscript.
Funding
This research received no external funding.
Acknowledgments
We are grateful for the support from the School of Architecture, Temuco, Universidad Mayor. We would also like to thank Javier Arangua Calzado, Director of the School of Architecture, Temuco, Universidad Mayor; Elizabeth Wagemann Farfán, Research Coordinator of the School of Architecture, Universidad Mayor; and Gonzalo Verdugo Navarrete, Regional Vice Chancellor, Temuco Headquarters, Universidad Mayor, for their supports in finalizing this article.
Conflicts of Interest
The authors declare no conflict of interest.
References
- Sallis, J.F.; Cervero, R.; Ascher, W.; Henderson, K.A.; Kraft, M.K.; Kerr, J. An ecological approach to creating active living communities. Annu. Rev. Public Health 2006, 27, 297–322. [Google Scholar] [CrossRef] [PubMed] [Green Version]
- Bagley, M.N.; Mokhtarian, P.L.; Kitamura, R. A methodology for the disaggregate, multi-dimensional measurement of neighborhood type. Urban Stud. 2002, 39, 689–704. [Google Scholar]
- Cervero, R.; Duncan, M. Walking, bicycling, and urban landscapes: Evidence from the San Francisco Bay Area. Am. J. Public Health 2003, 93, 1478–1483. [Google Scholar] [PubMed]
- Cervero, R.; Radisch, C. Travel choices in pedestrian versus automobile oriented neighborhoods. Transp. Policy 1996, 3, 127–141. [Google Scholar]
- Duncan, M.J.; Winkler, E.; Sugiyama, T.; Cerin, E.; duToit, L.; Leslie, E.; Owen, N. Relationships of land use mix with walking for transport: Do land uses and geographical scale matter? J. Urban Health 2010, 87, 782–795. [Google Scholar]
- Greenwald, M.J.; Boarnet, M.G. Built environment as determinant of walking behavior: Analyzing nonwork pedestrian travel in Portland, Oregon. Transp. Res. Rec. J. Transp. Res. Board 2001, 33–42. [Google Scholar] [CrossRef] [Green Version]
- Kitamura, R.; Mokhtarian, P.L.; Laidet, L. A micro-analysis of land use and travel in five neighborhoods in the San Francisco Bay Area. Transportation 1997, 24, 125–158. [Google Scholar]
- Kockelman, K.M. Travel behavior as function of accessibility, land use mixing, and land use balance: Evidence from San Francisco Bay Area. Transp. Res. Rec. 1997, 1607, 116–125. [Google Scholar]
- Ewing, R.; Handy, S. Measuring the unmeasurable: Urban design qualities related to walkability. J. Urban Des. 2009, 14, 65–84. [Google Scholar] [CrossRef]
- Handy, S. Critical Assessment of the Literature on the Relationships among Transportation, Land Use, and Physical Activity. In Does the Built Environment Influence Physical Activity? Examining the Evidence; National Academies: Washington, DC, USA, 2005. [Google Scholar]
- Southworth, M. Designing the walkable city. J. Urban Plan. Dev. 2005, 131, 246–257. [Google Scholar] [CrossRef]
- Chan, E.T.H.; Schwanen, T.; Banister, D. The role of perceived environment, neighbourhood characteristics, and attitudes in walking behaviour: Evidence from a rapidly developing city in China. Transportation 2019. [CrossRef] [Green Version]
- Van Cauwenberg, J.; van Holle, V.; Simons, D.; Deridder, R.; Clarys, P.; Goubert, L.; Nasar, J.; Salmon, J.; Bourdeaudhuij, I.; Deforche, B. Environmental factors influencing older adults’ walking for transportation: A study using walk-along interviews. Int. J. Behav. Nutr. Phys. Act. 2012, 9, 85. [Google Scholar] [CrossRef] [PubMed] [Green Version]
- Jack, E.; McCormack, G.R. The associations between objectively-determined and self-reported urban form characteristics and neighborhood-based walking in adults. Int. J. Behav. Nutr. Phys. Act. 2014, 11, 71. Available online: http://www.ijbnpa.org/content/11/1/71 (accessed on 19 November 2020). [PubMed] [Green Version]
- Kerr, J.; Emond, J.A.; Badland, H.; Reis, R.; Sarmiento, O.; Carlson, J.; Natarajan, L. Perceived neighborhood environmental attributes associated with walking and cycling for transport among adult residents of 17 cities in 12 countries: The IPEN study. Environ. Health Perspect. 2016, 124, 290–298. [Google Scholar] [CrossRef] [PubMed] [Green Version]
- Pelclová, J.; Frömel, K.; Bláha, L.; Zając-Gawlak, I.; Tlučáková, L. Neighborhood environment and walking for transport and recreation in central European older adults. Acta Gymnica 2012, 42, 49–56. [Google Scholar]
- Saelens, B.; Handy, S. Built Environment Correlates of Walking: A Review. Med. Sci. Sports Exerc. 2008, 40, S550–S566. [Google Scholar] [CrossRef] [Green Version]
- Bahrainy, H.; Khosravi, H.; Aliakbari, F.; Khosravi, F. The Impact of built environment on walkability, case study: North-West of Shiraz. Arman. Arch. Urban Dev. 2015, 8, 105–117. [Google Scholar]
- Yang, Y.; Diez-Roux, A.V. Adults’ daily walking for travel and leisure: Interaction between attitude toward walking and the neighborhood environment. Am. J. Health Promot. 2017, 31, 435–443. [Google Scholar]
- Smith, A.D.L. The Relationship between Neighborhood Environment and Walking Behavior: The Influence of Perceptions. Ph.D. Thesis, University of Maryland, College Park, MD, USA, 2008. [Google Scholar]
- Agrawal, A.W.; Schlossberg, M.; Irvin, K. How far, by which route and why? A spatial analysis of pedestrian preference. J. Urban Des. 2008, 13, 81–98. [Google Scholar] [CrossRef]
- Kim, T.; Sohn, D.W.; Choo, S. An analysis of the relationship between pedestrian traffic volumes and built environment around metro stations in Seoul. KSCE J. Civ. Eng. 2017, 21, 1443–1452. [Google Scholar]
- Paydar, M.; Kamani Fard, A. Perceived legibility in relation to path choice of commuters in central business district. Urban Des. Int. 2016, 21, 213–235. [Google Scholar] [CrossRef]
- Sun, G.; Zacharias, J.; Ma, B.; Oreskovic, N. How do metro stations integrate with walking environments? Results from walking access within three types of built environment in Beijing. Cities 2016, 56, 91–98. [Google Scholar] [CrossRef]
- Oakes, J.M.; Forsyth, A.; Schmitz, K.H. The effects of neighborhood density and street connectivity on walking behavior: The Twin Cities walking study. Epidemiol. Perspect. Innov. 2007, 4, 16. [Google Scholar] [PubMed] [Green Version]
- Sarker, R.; Mailer, M.; Sikder, S. Walking to a public transport station: Empirical evidence on willingness and acceptance in Munich, Germany. Smart Sustain. Built Environ. 2019, 9, 38–53. [Google Scholar] [CrossRef] [Green Version]
- Frank, L.D.; Schmid, T.L.; Sallis, J.F.; Chapman, J.; Saelens, B.E. Linking objectively measured physical activity with objectively measured urban form: Findings from SMARTRAQ. Am. J. Prev. Med. 2005, 28, 117–125. [Google Scholar]
- Frank, L.D.; Pivo, G. Impacts of mixed use and density on utilization of three modes of travel: Single-occupant vehicle, transit, and walking. Transp. Res. Rec. 1995, 1466, 44–52. [Google Scholar]
- Krizek, K. Residential relocation and changes in urban travel: Does neighborhood—Scale urban form matter? J. Am. Plan. Assoc. 2003, 69, 265–281. [Google Scholar]
- Kamruzzaman, M.D.; Washington, S.; Baker, D.; Brown, W.; Giles-Corti, B.; Turrell, G. Built environment impacts on walking for transport in Brisbane, Australia. Transportation 2014. [Google Scholar] [CrossRef] [Green Version]
- Pikora, T.; Giles-Corti, B.; Bull, F.; Jamrozik, K.; Donovan, R. Developing a framework for assessment of the environmental determinants of walking and cycling. Soc. Sci. Med. 2003, 56, 1693–1703. [Google Scholar] [CrossRef]
- Saelens, B.; Sallis, J.; Frank, L. Environmental correlates of walking and cycling: Findings from the transportation, urban design, and planning literatures. Ann. Behav. Med. 2003, 25, 80–91. [Google Scholar]
- McCormack, E.; Rutherford, S.G.; Wilkinson, M. Travel impacts of mixed land use neighborhoods in Seattle, Washington. Transp. Res. Rec. J. Transp. Res. Board 2001, 1780, 25–32. [Google Scholar]
- Handy, S.L.; Clifton, K.J.; Fisher, J. The Effectiveness of Land Use Policies as a Strategy for Reducing Automobile Dependence: A Study of Austin Neighborhoods; Southwest Region University Transportation Center, Center for Transportation Research, University of Texas at Austin: Austin, TX, USA, 1998. [Google Scholar]
- Cervero, R. Mixed land-uses and commuting: Evidence from the American housing survey. Transp. Res. A 1996, 30, 361–377. [Google Scholar]
- Etminani-Ghasrodashti, R.; Paydar, M.; Hamidi, S.H. University-related travel behavior: Young adult’s decision-making in Iran. Sustain. Cities Soc. 2018, 43, 495–508. [Google Scholar] [CrossRef]
- Giles-Corti, B.; Donovan, R.J. Socioeconomic status differences in recreational physical activity levels and real and perceived access to a supportive physical environment. Prev. Med. 2002, 3, 601–611. [Google Scholar]
- Inoue, S.; Ohya, Y.; Odagiri, Y.; Takamiya, T.; Kamada, M.; Okada, S.; Oka, K.; Kitabatake, Y.; Nakaya, T.; Sallis, J.; et al. Perceived neighborhood environment and walking for specific purposes among elderly Japanese. J. Epidemiol. Jpn. Epidemiol. Assoc. 2011, 21, 481–490. [Google Scholar] [CrossRef] [Green Version]
- Suminski, R.R.; Poston, W.S.C.; Petosa, R.L.; Stevens, E.; Katzenmoyer, L.M. Features of the neighborhood environment and walking by U.S. adults. Am. J. Prev. Med. 2005, 28, 149–155. [Google Scholar]
- Yun, H.Y. Environmental factors associated with older adult’s walking behaviors: A systematic review of quantitative studies. Sustainability 2019, 11, 3253. [Google Scholar] [CrossRef] [Green Version]
- Zapata-Diomedi, B.; Veerman, J.L. The association between built environment features and physical activity in the Australian context: A synthesis of the literature. BMC Public Health 2016, 16, 484. [Google Scholar] [CrossRef] [Green Version]
- Paydar, M.; Ramezani, S. The effects of sense of progression and cognitive distance on path choice and walking behavior while aiming to reach destination. Am. J. Eng. Appl. Sci. 2010, 3. [Google Scholar] [CrossRef]
- Paydar, M.; Kamani-Fard, A. El temor a la delincuencia y la percepción de inseguridad en el entorno urbano. Argos 2015, 32, 179–195. Available online: http://ve.scielo.org/scielo.php?script=sci_arttext&pid=S0254-16372015000200011&lng=es&nrm=iso (accessed on 14 November 2020).
- Paydar, M.; Kamani, F.A.; Etminani-Ghasrodashti, R. Perceived security of women in relation to their path choice toward sustainable neighborhood in Santiago, Chile. Cities 2017, 60, 289–300. [Google Scholar] [CrossRef]
- Craig, C.L.; Brownson, R.C.; Cragg, S.E.; Dunn, A.L. Exploring the effect of the environment on physical activity: A study examining walking to work. Am. J. Prev. Med. 2002, 23, 36–43. [Google Scholar] [PubMed]
- Saelens, B.; Sallis, J.F.; Black, J.; Chen, D. Preliminary evaluation of neighborhood-based differences in physical activity: An environmental scale evaluation. Am. J. Public Health 2003, 93, 1152–1158. [Google Scholar]
- Blečić, I.; Congiu, T.; Fancello, G.; Trunfio, G.A. Planning and design support tools for walkability: A guide for urban analysts. Sustainability 2020, 12, 4405. [Google Scholar]
- Paydar, M.; Kamani, F.A.; Khaghani, M. Pedestrian walkways for health in Shiraz, Iran, the contribution of attitudes, and perceived environmental attributes. Sustainability 2020, 12, 7263. [Google Scholar] [CrossRef]
- Kim, H. Walking distance, route choice, and activities while walking: A record of following pedestrians from transit stations in the San Francisco Bay area. Urban Des. Int. 2015, 20. [Google Scholar] [CrossRef]
- Millward, H.; Spinney, J.; Scott, D. Active-transport walking behavior: Destinations, durations, distances. J. Transp. Geogr. 2013, 28, 101–110. [Google Scholar] [CrossRef]
- Cerin, E.; Conway, T.L.; Saelens, B.E.; Frank, L.D.; Sallis, J.F. Cross-validation of the factorial structure of the Neighborhood Environment Walkability Scale (NEWS) and its abbreviated form (NEWS-A). Int. J. Behav. Nutr. Phys. Act. 2009, 6, 32. [Google Scholar] [PubMed]
- Joh, K.; Nguyen, M.T.; Boarnet, M.G. Can built and social environmental factors encourage walking among individuals with negative walking attitudes? J. Plan. Educ. Res. 2012, 32, 219–236. [Google Scholar]
- Handy, S.; Cao, X.; Mokhtarian, P. Correlation or causality between the built environment and travel behavior? Evidence from Northern California. Transp. Res. Part D Transp. Environ. 2005, 10, 427–444. [Google Scholar]
- Rind, E.; Shortt, N.; Mitchell, R.; Richardson, E.A.; Pearce, J. Are income-related differences in active travel associated with physical environmental characteristics? A multi-level ecological approach. Int. J. Behav. Nutr. Phys. Act. 2015, 12, 73. [Google Scholar] [CrossRef] [PubMed] [Green Version]
- Owen, N.; Cerin, E.; Leslie, E.; Du Toit, L.; Coffee, N.; Frank, L.; Bauman, A.; Hugo, G.; Saelens, B.; Sallis, J. Neighborhood walkability and the walking behavior of Australian adults. Am. J. Prev. Med. 2007, 33, 387–395. [Google Scholar] [CrossRef] [PubMed]
- Cerin, E.; Lesie, E.; Owen, N. Explaining socio-economic status differences in walking for transport: An ecological analysis of individual, social and environmental factors. Soc. Sci. Med. 2009, 68, 1013–1020. [Google Scholar]
- Mouada, N.; Zemmouri, N.; Meziani, R. Urban morphology, outdoor thermal comfort and walkability in hot, dry cities: Case study in Sidi Okba, Algeria. Int. Rev. Spat. Plan. Sustain. Dev. 2019, 7, 117–133. [Google Scholar] [CrossRef]
- Vanky, A.; Verma, S.; Courtney, T.; Santi, P.; Ratti, C. Effect of weather on pedestrian trip count and duration: City-scale evaluations using mobile phone application data. Prev. Med. Rep. 2017, 8. [Google Scholar] [CrossRef]
- Vasilikou, C.; Nikolopoulou, M. Outdoor thermal comfort for pedestrians in movement: Thermal walks in complex urban morphology. Int. J. Biometeorol. 2020, 64, 277–291. [Google Scholar] [CrossRef] [Green Version]
- Ball, K.; Bauman, A.; Leslie, E.; Owen, N. Perceived environmental aesthetics and convenience, and company are associated with walking for exercise among Australian adults. Prev. Med. 2001, 33, 434–440. [Google Scholar]
- Nehme, E.; Oluyomi, A.; Calise, T.; Kohl, H. Environmental correlates of recreational walking in the neighborhood. Am. J. Health Promot. 2016, 30, 139–148. [Google Scholar] [CrossRef]
- Lynch, G.; Atkins, S. The influence of personal security fears on women’s travel patterns. Transportation 1988, 15, 257–277. [Google Scholar] [CrossRef]
- Taghvayi, M.; Zarrabi, A.; Ahmadi, H.; Beykmohammadi, H.; Moghani, B. Spatial distribution of crime in eight areas of Shiraz. J. Geogr. Reg. Dev. 2012, 10, 18. [Google Scholar] [CrossRef]
- Ceccato, V.; Oberwittler, D. Comparing spatial patterns of robbery: Evidence from a Western and an Eastern European city. Cities 2008, 25, 185–196. [Google Scholar] [CrossRef]
- Newman, O. Creating Defensible Space; Department of Housing and Urban Development, Office of Policy Development and Research: Washington, DC, USA, 1996. Available online: https://www.huduser.gov/publications/pdf/def.pdf (accessed on 19 November 2020).
- Hillier, B. Space Is the Machine: A Configurational Theory of Architecture; Cambridge University Press: Cambridge, UK, 1999. [Google Scholar]
- Little, J.; Panelli, R.; Kraack, A. Women’s fear of crime: A rural perspective. J. Rural. Stud. 2005, 21, 151–163. [Google Scholar]
- Pain, R.; MacFarlane, R.; Turner, K.; Gill, S. When, where, if, and but: Qualifying GIS and the effect of street lighting on crime and fear. Environ. Plan. A 2005, 38, 2055–2074. [Google Scholar]
- Waters, J. Perceptions of Personal Safety on University Campuses. Ph.D. Thesis, University of Glamorgan, Glamorgan, UK, 2006. [Google Scholar]
Figure 1.
The conceptual framework.

Figure 2.
Line 1 of the metro system of Shiraz and the selected metro stations for this study, including (1) Zandiyeh metro station; (2) Ghasrodasht metro station, and (3) Ehsan metro station.
Figure 2.
Line 1 of the metro system of Shiraz and the selected metro stations for this study, including (1) Zandiyeh metro station; (2) Ghasrodasht metro station, and (3) Ehsan metro station.

Figure 3.
Surrounding area of Zandiyeh metro station (a), Ghasrodasht metro station (b), and Ehsan metro station (c).
Figure 3.
Surrounding area of Zandiyeh metro station (a), Ghasrodasht metro station (b), and Ehsan metro station (c).

Table 1.
The criteria, subcriteria, and their types in all the existing metro stations for selecting the metro stations for this study.
Table 1.
The criteria, subcriteria, and their types in all the existing metro stations for selecting the metro stations for this study.
| Criterion | Sub-Criterion | The Metro Stations | 1 | 2 | 3 | 4 | 5 | 6 | 7 | 8 | 9 | 10 | 11 | 12 | 13 | 14 | 15 | 16 | 17 | 18 | 19 | 20 | 21 |
|---|---|---|---|---|---|---|---|---|---|---|---|---|---|---|---|---|---|---|---|---|---|---|---|
| 1. Urban Texture related to land use and Built environment | Land use diversity | Type | T1 | T1 | T3 | T1 | T2 | T1 | T1 | T3 | T1 | T1 | T3 | T3 | T2 | T1 | T3 | T2 | T1 | T2 | T2 | T1 | T1 |
| Intersection density | Type | T1 | T1 | T1 | T3 | T3 | T1 | T2 | T1 | T1 | T1 | T2 | T2 | T1 | T3 | T1 | T2 | T1 | T3 | T1 | T1 | T1 | |
| Block Density | Type | T1 | T1 | T1 | T3 | T3 | T1 | T2 | T1 | T1 | T1 | T2 | T2 | T1 | T3 | T1 | T2 | T1 | T3 | T1 | T1 | T1 | |
| 2. Number of pedestrians | Type | T1 | T3 | T1 | T2 | T1 | T2 | T2 | T1 | T3 | T2 | T1 | T1 | T2 | T3 | T2 | T1 | T2 | T2 | T2 | T3 | T2 | |
| Final metro stations | Metro station 1 (Ehsan), Metro station 5 (Ghasrodasht) and Metro station 11 (Zandiyeh) | ||||||||||||||||||||||
Table 2.
Total number of passengers who arrived at the metro stations during one week and the determined number of respondents in each metro station.
Table 2.
Total number of passengers who arrived at the metro stations during one week and the determined number of respondents in each metro station.
| Metro Station | Total Number of Passengers Who Entered during One Week | The Selected Numbers of Respondents |
|---|---|---|
| Ehsan metro station | 27,194 | 99 |
| Ghasrodasht metro station | 21,018 | 89 |
| Zandiyeh metro station | 56,883 | 207 |
| All the selected metro station | 105,095 | 395 |
Table 3.
Descriptive statistics of sociodemographic variables, walking attitudes, and level of walking with others (N = 395).
Table 3.
Descriptive statistics of sociodemographic variables, walking attitudes, and level of walking with others (N = 395).
| Description of Variable | Frequency | Percentage | Mean | |
|---|---|---|---|---|
| Age (years old) | 1 = 16 to 18 | 24 | 6.1 | 2.34 |
| 2 = 19–29 | 258 | 65.3 | ||
| 3 = 30–39 | 68 | 17.2 | ||
| 4 = 40–49 | 40 | 10.1 | ||
| 5 = 50–59 | 3 | 0.8 | ||
| 6 = 60–69 | 1 | 0.3 | ||
| 7 = More than 70 | 1 | 0.3 | ||
| Gender | 1 = Male | 247 | 62.5 | 1.37 |
| 2 = Female | 148 | 37.5 | ||
| Monthly income (Rial, currency of Iran) | 1 = Less than ten million | 229 | 58 | 1.71 |
| 2 = Ten–twenty | 61 | 15.4 | ||
| 3 = Twenty–thirty | 62 | 15.7 | ||
| 4 = Thirty–forty | 25 | 6.3 | ||
| 5 = More than forty million | 18 | 4.6 | ||
| Owning private car | 1 = Yes | 104 | 26.3 | 1.74 |
| 2 = No | 290 | 73.4 | ||
| Education | 1 = High school | 11 | 2.8 | 3.21 |
| 2 = Diploma | 82 | 20.8 | ||
| 3 = Bachelor | 163 | 41.3 | ||
| 4 = Master | 90 | 22.8 | ||
| 5 = Ph.D. | 49 | 12.4 | ||
| Type of starting point | 1 = Housing | 65 | 16.5 | |
| 2 = Commercial | 27 | 6.8 | ||
| 3 = Office | 33 | 8.4 | ||
| 4 = Recreational | 74 | 18.7 | ||
| 5 = Educational | 146 | 37 | ||
| 6 = Others | 50 | 12.7 | ||
| Type of destination after leaving the metro station | 1 = Housing | 62 | 15.6 | |
| 2 = Commercial | 62 | 15.6 | ||
| 3 = Office | 29 | 7.3 | ||
| 4 = Recreational | 51 | 12.9 | ||
| 5 = Educational | 117 | 29.6 | ||
| 6 = Cultural | 22 | 5.5 | ||
| 7 = Religious | 23 | 5.8 | ||
| 8 = Sport | 21 | 5.3 | ||
| 9 = Industrial | 8 | 2 | ||
| You usually walk along this route with others | 1 = Strongly disagree | 46 | 11.6 | 3.69 |
| 2 = Disagree | 32 | 8.1 | ||
| 3 = Neither agree nor disagree | 54 | 13.7 | ||
| 4 = Agree | 128 | 32.4 | ||
| 5 = Strongly agree | 135 | 34.2 | ||
Walking attitudes:
| 1 = Strongly disagree | 3.92 | ||
| 2 = Disagree | ||||
| 3 = Neither agree nor disagree | ||||
| 4 = Agree | ||||
| 5 = Strongly agree |
Table 4.
Factor analysis of perceived built environment attributes.
| Loadings | Environmental Attributes | Components |
|---|---|---|
| Aesthetic, comfort and convenience aspects | There are many attractive natural sights (such as landscaping, views). | 0.782 |
| There are attractive buildings/homes around the sidewalks. | 0.749 | |
| The variety of views and buildings along the sidewalks make the walking enjoyable. | 0.655 | |
| It is possible to see and perceive human activities inside the buildings beyond the edge of the streets. | 0.626 | |
| Trees and buildings give shade for the sidewalks, which make the walking more comfortable especially during hot season. | 0.622 | |
| There are many alternative routes for getting from my starting point to the metro station (I don’t have to go the same way every time.). | 0.599 | |
| Parks and other similar recreational spaces are easily accessible in my walking trip. | 0.486 | |
| The path is generally free from litter. | 0.432 | |
| Traffic safety | Traffic calming devices to control the speed of cars such as speed humps exist at crossing locations. | 0.765 |
| Drivers generally give priority to pedestrians to cross the streets. | 0.762 | |
| Crosswalks exist at most of the junctions, which increase the safety of pedestrians. | 0.741 | |
| Most drivers do not exceed the indicated speed limits while driving. | 0.560 | |
| Motorcyclists rarely use the sidewalks, which increases the safety of the pedestrians. | 0.502 | |
| Functional aspects and facilities along the path (physical comfort) | There are enough seating areas and benches along the walkways. | 0.740 |
| There are enough trash bins along the sidewalks. | 0.703 | |
| The sidewalks are well maintained (paved, even, and not a lot of cracks). | 0.588 | |
| There is a grass/dirt strip that separates the streets from the sidewalks. | 0.581 | |
| Accessibility to shops and public transport (convenient environment) | Newsstand kiosks are available for partial purchases along this sidewalk. | 0.726 |
| Stores are easily accessible during my walking trips. | 0.714 | |
| Public transit stops such as train or buses are easily accessible during my walking trip. | 0.559 | |
| There are many four-way intersections along my walking trip. | 0.361 | |
| Personal security | I see and speak to other people when I am walking. | 0.794 |
| Walkers can be easily seen by people in their homes. | 0.673 | |
| I feel secure from crime while walking during the day. | 0.514 | |
| This sidewalk is well lit at night. | 0.468 | |
| Continuity of walking movement together with sense of comfort | Less uneven surfaces on this sidewalk make it easier to walk. | 0.800 |
| Fewer physical barriers made for instance by cars and motorcycles along my traced sidewalks made the walking easier for me. | 0.798 | |
| The width of the sidewalks | The width of the sidewalks is generally suitable for walking. | 0.656 |
| Legibility along the path | The signs indicating the metro station are legible which makes it easy to reach. | 0.798 |
| The metro station is visible during walking. | 0.771 | |
| Enclosure along the street | The ratio of the height of the buildings to the width of the street is attractive. | 0.822 |
Table 5.
The results of adjusted multiple regression analysis (N = 395).
| Variables | Standard Coefficient | t | p-Value |
|---|---|---|---|
| Sociodemographic variables | |||
| Gender (1. male 2. female) | 0.041 | 0.931 | 0.35 |
| Age (1–5 from young to elderly) | 0.050 | 1.077 | 0.28 |
| Monthly income (1–4 from low to high) | −0.143 | −3.169 | 0.002 ** |
| Education (1–4 from low before-diploma to high (doctor) | −0.062 | −1.368 | 0.17 |
| Owning private car (1. Yes; 2: No) | 0.190 | 4.208 | 0.000 ** |
| Walking with others | |||
| Do you usually walk with friends or family? | 0.024 | 0.520 | 0.60 |
| Types of origin land use as compared to housing type | |||
| Commercial (commercial:1; housing: 0) | −0.052 | −1.020 | 0.30 |
| Office (Office:1; housing: 0) | −0.030 | −0.575 | 0.56 |
| Recreational (Recreational:1; housing: 0) | −0.041 | −0.720 | 0.47 |
| Educational (Educational:1; housing: 0) | −0.122 | −1.938 | 0.05 * |
| Health (health: 1; housing: 0) | −0.060 | −1.097 | 0.27 |
| Attitudes toward walking | 0.289 | 6.153 | 0.000 ** |
| Distance between starting points and metro stations (The meters walked) | −0.185 | −4.111 | 0.000 ** |
| Perceived built environment components | |||
| Aesthetic, comfort and convenience aspects | 0.111 | 1.882 | 0.05 * |
| Traffic safety | 0.120 | 2.543 | 0.01 ** |
| Functional aspects and facilities along the path (physical comfort) | 0.006 | 0.122 | 0.90 |
| Accessibility to shops and public transport (convenient environment) | 0.037 | −0.671 | 0.50 |
| Personal security | 0.101 | 1.928 | 0.05 * |
| Continuity of walking movement together with sense of comfort | 0.027 | 0.560 | 0.57 |
| Legibility along the path | 0.004 | 0.093 | 0.92 |
| The width of the sidewalks | 0.067 | 1.411 | 0.15 |
| Enclosure along the street | 0.065 | 1.431 | 0.15 |
* p < 0.05; ** p < 0.01. Dependent variable: minutes of walking to the metro stations per week; R square: 0.336.
Table 6.
Descriptive statistics of meter distance to metro stations (N = 395).
| Distance to Metro Stations (m) | 0–100 | 101–200 | 201–300 | 301–400 | 401–500 | 501–600 | 601–700 | 701–800 | 801–900 | 901–1000 | 1001–1100 | 1101–1200 | 1201–1300 | 1301–1400 | 1401–1500 | 1501–1600 |
|---|---|---|---|---|---|---|---|---|---|---|---|---|---|---|---|---|
| Frequency | 48 | 64 | 47 | 80 | 45 | 42 | 35 | 6 | 4 | 6 | 2 | 1 | 4 | 7 | 2 | 2 |
| Percent % | 12.1 | 16.2 | 11.8 | 20.2 | 11.3 | 10.6 | 8.8 | 1.5 | 1 | 1.5 | 0.5 | 0.2 | 1 | 1.7 | 0.5 | 0.5 |
| Mean | 336 (m) | |||||||||||||||
| Minimum | 14 (m) | |||||||||||||||
| Maximum | 1598 (m) | |||||||||||||||
Publisher’s Note: MDPI stays neutral with regard to jurisdictional claims in published maps and institutional affiliations. |
© 2020 by the authors. Licensee MDPI, Basel, Switzerland. This article is an open access article distributed under the terms and conditions of the Creative Commons Attribution (CC BY) license (http://creativecommons.org/licenses/by/4.0/).
Share and Cite
MDPI and ACS Style
Paydar, M.; Fard, A.K.; Khaghani, M.M. Walking toward Metro Stations: the Contribution of Distance, Attitudes, and Perceived Built Environment. Sustainability 2020, 12, 10291. https://doi.org/10.3390/su122410291
AMA Style
Paydar M, Fard AK, Khaghani MM. Walking toward Metro Stations: the Contribution of Distance, Attitudes, and Perceived Built Environment. Sustainability. 2020; 12(24):10291. https://doi.org/10.3390/su122410291
Chicago/Turabian StylePaydar, Mohammad, Asal Kamani Fard, and Mohammad Mehdi Khaghani. 2020. "Walking toward Metro Stations: the Contribution of Distance, Attitudes, and Perceived Built Environment" Sustainability 12, no. 24: 10291. https://doi.org/10.3390/su122410291
Note that from the first issue of 2016, this journal uses article numbers instead of page numbers. See further details here.