Article

Quantitative Attribution of Runoff Attenuation to Climate Change and Human Activity in Typical Mountainous Areas: An Enlightenment to Water Resource Sustainable Utilization and Management in North China

1
State Key Laboratory of Simulation and Regulation of Water Cycle in River Basin, China Institute of Water Resources and Hydropower Research, Beijing 100038, China
2
College of Hydrology and Water Resources, Hohai University, No.1 Xikang Road, Nanjing 210098, China
*
Author to whom correspondence should be addressed.
Sustainability 2020, 12(24), 10395; https://doi.org/10.3390/su122410395
Submission received: 19 November 2020 / Revised: 8 December 2020 / Accepted: 9 December 2020 / Published: 12 December 2020

Abstract

:
The influence of climate change and human activities on hydrological elements has increased along with increasing dependence on water resources. Therefore, quantitative attribution of hydrological elements has received wide attention. In this study, the double mass curve (DMC) is used to assess the abrupt change point of the hydrological data series, based on which the periods with/without large-scale human activities causing runoff attenuation are separated. The land use transition matrix is then employed to analyze the land use types at different historical stages, and the sensitivities of the runoff attenuation to different land use/cover change (LUCC) categories are quantified. A soil and water assessment tool (SWAT) model that considers the underlying surface is constructed with six designed scenarios of different climate and LUCC conditions. Taking three typical mountainous basins in North China as the study area, the quantitative contributions of climate change and human activities to the water resources are identified. The results of the study have brought enlightenment to the water resource sustainable utilization and management in North China, and the methodologies can be transferred to runoff attribution analysis in water shortage areas.

1. Introduction

Climate change and human activity are the driving factors affecting the hydrological cycle and water resource evolution, and the hydrological effect has become the focus of global change research. The hydrological cycle is an important component of the climate system. The impacts of climate change on elements of the hydrological cycle will inevitably lead to temporal and spatial changes in water resources. Climate variability includes changes in precipitation and potential evaporation, which jointly affect the runoff of a catchment [1]. At the same time, the impacts of human activities on the hydrological cycle of a catchment are also increasingly significant, which are mainly manifested (i) in changes in the underlying surface conditions caused by land use/cover changes and the construction of large-scale water conservancy projects and (ii) in direct water extraction from surface and underground water, thus affecting the mechanism of runoff generation and concentration in the basin. Therefore, analyzing the hydrological responses to climate change and human activities at the watershed scale are vital to gain a deep understanding of the hydrological cycle, to facilitate sustainable development of water resources, and to improve the stability of the ecosystem [2]. The impact of human activities on runoff mainly results from changes in basin characteristics, whereas climate change changes not only the basin characteristics but also the hydrological inputs [3].
The attribution of runoff change refers to how to judge the driving mechanism of runoff change and to establish a relationship model between runoff and the corresponding driving factors, so as to explore the dominant factors affecting the change. At present, runoff in many areas is decreasing owing to the complex interactions between climate change, human activity, and hydrological processes. In China, the runoff of many major rivers is decreasing, especially in the Haihe River Basin and the Yellow River Basin [4,5]. Compared with the two major rivers in China, the contribution of human activity in the Yellow River Basin is much higher than that in the Yangtze River Basin. The relative impacts of climate change and human activity in the Yangtze River Basin are 90.9% and 9.1%, respectively, whereas those in the Yellow River Basin are 42.9% and 57.1%, respectively [6].
In North China, there is a serious shortage of water resources [7] and observations show that there is a significant downward trend in the runoff amount. The observed decline in precipitation was only 5.40%, whereas the decline in runoff was up to 53.91% between 1960 and 1990 in the Haihe River Basin. Runoff is steadily declining because of climate change and human activity, in which the impact of human activity accounts for more than 60% of the total [8]. During the most recent thirty years, the runoff in mountain areas has decreased dramatically [9,10], and the groundwater level in the plain areas has also decreased seriously [11,12,13]. This not only places restrictions on the socioeconomic development of the region but also poses considerable threat to the ecosystem and environmental health in regions downstream [10]. An insignificant change in precipitation and a significant decline in runoff occur in five of the eight sub-catchments in northern China. In addition, analysis has found that the high percent of agricultural land and related agricultural water use for human activities are the most probable factors [10]. However, some researchers believe that the artificial exploitation and utilization of water resources is the main reason for runoff decline in northern China [14]. It is considered that the impacts of climate change and human activity on the runoff are not completely isolated. The climate variation mainly originates from the decrease of precipitation, and the land cover change mostly resulted from the increase of vegetation. The major reason for vegetation increase is afforestation, but it also partly due to the climate variation, especially temperature increases [15].
Determining the cause for the change in runoff is essential to understanding the hydrologic processes. It will also provide a theoretical basis for projections of water availability and the adaptive management of water resources [16,17,18]. In recent decades, the determination of the driving factors and their influences on the runoff have been the primary foci of hydrological researches [19,20,21]. A large amount of work has been performed to quantify the impacts of climate change and human activities on runoff, including using hydrological models [22,23,24,25], trend analysis [26], linear regression [27], artificial neural networks [28], or the Budyko-based method [29,30,31].
Conducting analyses at different scales (from the component parts to the whole) can help us better understand the responses of runoff to climate change and human activity, thus providing a theoretical basis for future water resources management. Mountains, which are the source of the water basin, can conserve and regulate water resources. Therefore, it is very important to study the cause of runoff attenuation in mountain areas. This will have a positive effect in terms of adapting to climate change and taking corresponding water resources management measures in the future. Many scholars have studied the causes of runoff attenuation in mountainous areas. Climate and CO2 concentration changed in the mountainous areas of the Haihe River basin [32]. The CLM4 was used to quantify the spatiotemporal changes in runoff. Changes in precipitation, solar radiation, air temperature, and wind speed account for 56%, −14%, 13%, and −5% of the overall decrease in annual runoff, respectively. Investigating the mechanism of runoff variation is of great significance for the sustainable utilization of water resources. Wang et al. revealed that land-use changes had a greater effect on runoff than climate variability since 1979 in the Haihe Basin mountainous area of North China. Meanwhile, forests have the most effective impact on runoff reduction, followed by grassland or farmland [33]. In addition, in the Luanhe River basin, research indicated that human activities were the major factors in decreasing runoff, which contributed more than 60%, and the influence of LUCC on runoff was mainly due to the conversion between grassland and cropland [34]. Also, some scholars have studied the causes of runoff attenuation in other regions. He et al. studied changes in mountainous runoff in three inland river basins [35]. The contributions of precipitation to runoff change in the upper reaches are 50%, 58%, and 37%, and that of the underlying surface is approximately 50%, 42%, and 64% in the Shule River basin, Hei River basin, and Shiyang River.
It has great significance to evaluate and identify the contributions among driving factors, which could help carry out better regional water resource management regulations and sustainable utilization. In this study, three typical mountainous watersheds in North China were chosen as the study area. The double mass curve is used to assess the abrupt change point of the hydrological data series from 1956 to 2015, based on which the periods with/without large-scale human activities causing runoff attenuation are separated. The land use transition matrix is then employed to analyze the land use types at different historical stages, and the sensitivities of the runoff attenuation to different land use/cover change (LUCC) categories are quantified. A distributed hydrological model that considers the underlying surface change is constructed based on the soil and water assessment tool (SWAT) model.
Through the ingenious design of six scenarios with various climate and LUCC conditions, the impacts of climate change and human activities on runoff are distinguished and their contributions to the runoff attenuation are quantified. Finally, according to attribution analysis of the runoff attenuation in the mountainous areas of North China, some enlightenments to water resources sustainable utilization and management are put forward. The methodologies are briefly described in Section 2. The results of the runoff change point, the sensitivity analysis to LUCC, and the quantitative attribution of the runoff attenuation are provided in Section 3. The discussion and conclusions are presented in Section 4 and Section 5, respectively.

2. Materials and Methods

2.1. Study Area

Three typical and small watersheds in the mountainous area of North China are selected to analyze the causes of runoff attenuation. These are the Luan River Mountainous Basin (LRMB), Chaobai River Mountainous Basin (CRMB), and Yongding River Mountainous Basin (YRMB), as shown in Figure 1. With the development of the economy, water demand is increasing while precipitation is decreasing in LRMB. Especially since 1999, the area has been dried for years and the contradiction between supply and demand of water resources is more prominent. Chaobai River is one of the four major rivers in the north of Haihe River Basin (HRB). The characteristics of precipitation in CRMB are large interannual variation, uneven distribution in one year and different regions, heavy rainfall intensity, and short duration. Affected by seasons, precipitation is mainly concentrated in the flood season (June to September), accounting for about 85% of the total precipitation. Yongding River is also a main river in the north of HRB. It has poor water resource in YRMB, which is far lower than the average annual precipitation of 535 mm in HRB, and its development and utilization degree is more than 80%. Affected by the factors of groundwater level decline and resource development, the underlying surface changes dramatically. All three belong to the HRB. The HRB, encompassing Beijing, Tianjin, Shijiazhuang, and 23 other large— and medium—sized cities, is the political, economic, cultural, and transportation center of China. Moreover, the shortage of water resources and associated environmental issues have become the greatest challenges to further development.

2.2. Methodologies

2.2.1. The Double Mass Curve to Determine the Runoff Change Point

The double mass curve (DMC) is a simple and widely used hydrological method, shown by Equations (1) and (2). In the N-year observation period, there are observation values X i and Y i . For variables X and Y, their cumulative values are calculated in chronological order, and new year-by-year cumulative sequences X i and Y i are obtained. The DMC is based on in the same period; if the given data is proportional, the continuous cumulative values of one variable and another variable are a straight line with a fixed slope in the Cartesian coordinate system; if the slope changes, then the year corresponding to the abrupt change point of the slope is the time when the cumulative relationship between the two variables changed suddenly. In the Cartesian coordinate system, the relationship between the two variables is established and the regression analysis is carried out. The DMC can be used to assess the consistency of the hydrological processes and to derive the runoff changes caused by human activities [36]. In this study, the DMC method is used to divide the base period and the impact period of the runoff, which indicates the change point of the runoff affected by climate change and human activity. Then, the method is used to determine the change point of the underlying surface due to the variation in vegetation coverage.
X i = i = 1 N X i
Y i = i = 1 N Y i

2.2.2. Sensitivity Analysis of the Runoff Attenuation to LUCC

(1)
Transition Matrix
The transition matrix method is selected to analyze the land use types of different historical stages in typical areas. The transition matrix of land use is a two-dimensional matrix based on the transformation relationship of land cover status at different times in the same area. Through analysis of the transition matrix, we can obtain the scenario of mutual transformation between different land types at two time phases. It describes the location and area of LUCC in different years. In this study, six types of land use are selected for analysis: urban construction, forest, water, farmland, grassland, and unused land. The general form of the transition matrix is as follows:
S i j = [ S 11 S 12   S 1 n S 21 S 22   S 2 n   S n 1 S n 2   S n n ]
where S represents the area; n represents the number of land use types before and after the transition; i and j represent the land use types before and after the transition, respectively; and S i j represents the area of land type i before the transition to land type j after the transition. Each row of elements in the matrix represents the flow direction of the i land use type transferring to another, and each column represents the source of j land use after transferring.
(2)
Sensitivity Analysis
As long as there is a functional relationship between two variables, we can use elasticity to express the sensitivity of the dependent variable to a change in the independent variable. In order to discuss the runoff response under different land use types, the elastic analysis method is used to define the runoff sensitivity coefficient; thus, the sensitivity of runoff to land use type is studied. By comparing the change proportion of the dependent variable with that of the independent variable, the sensitivity of runoff to various land use types is assessed. If the runoff sensitivity coefficient is greater than one, it indicates that a smaller change in the independent variable can cause a greater change in the dependent variable. It is considered that the dependent variable is sensitive to change in the independent variable, i.e., the smaller the change in land use type, the greater the change in runoff. Otherwise, it is considered that the dependent variable is not sensitive to the independent variable, i.e., a change in land use type causes little change in runoff. The calculation equation for the runoff sensitivity coefficient is as follows:
S i j = | ( R i + 1 R i ) / R i ( L ( i + 1 ) j L i j ) / L i j | = | R i / R i L i j / L i j |
where S i j is the sensitivity coefficient of runoff relative to j land use types; R i + 1 and R i are the runoffs of the (i+1) and i phases, respectively; and L ( i + 1 ) j and L i j are the j land use types that affect runoff change in the (i+1) and i phases, respectively.

2.2.3. The SWAT Model with Designed Scenarios

The hydrological model is an important theoretical basis for simulating watershed hydrological processes and for understanding watershed hydrological laws. The Soil and Water Assessment Tool (SWAT) is a hydrological model that can simulate the quantity and quality of surface water and groundwater in small to large basins [37,38]. SWAT has a strong hydrological and physical mechanism which can predict the long-term impacts of climate change and human activity on hydrological processes for different soil conditions, land use types, and management measures. The model has been widely used for various main basins at home and abroad [39,40]. The input data of SWAT include DEM, land use, soil, weather, etc. SWAT first divides the watershed into subbasins, and then further divides each subbasin into hydrological response units (HRUs), each of which represents a unique combination of land use, soil, and topography. Taking HRU as the basic unit, the hydrological elements of each subbasin are simulated and summarized and the runoff reached the outlet through the river [40]. In this paper, runoff is simulated over different periods and under different influencing factors based on SWAT. The relative contributions of climate factors and underlying surface factors (vegetation coverage and others) are distinguished according to runoff simulation results in different scenarios.
(1)
Model Building
The input data of SWAT are DEM, land use, soil, weather, etc. A high-resolution DEM (resolution of 30 m × 30 m) is used as the input data to extract the river network and to divide the subbasins. The data comes from the mirror website of the Computer Network Information Center of the Chinese Academy of Sciences (http://datamirror.csdb.cn). The high-resolution 30 × 30 m Landsat TM image is adopted. The land use is reclassified and encoded based on the ArcGIS. The spatial distributions of soil types are obtained from 1:1,000,000 soil vector data. Based on the soil profiles of Hebei Province and the soil database of China (http://www.soil.csdb.cn/), a linear interpolation is used to convert the “soil particle size grading” to the U.S. standard (SWAT uses the U.S. standard of USDA). Parameters such as soil bulk density, effective field water capacity, and saturated hydraulic conductivity are estimated by the soil–plant–atmosphere–water (SPAW) model developed by Washington State University. The meteorological and hydrological data include daily precipitation, maximum and minimum temperature, relative humidity, solar radiation, and wind speed. Each HRU adopts the data of the nearest meteorological station. This study is an analysis of the Thiessen polygon based on the meteorological stations provided by the China Meteorological Science Data (http://cdc.cma.gov.cn).
(2)
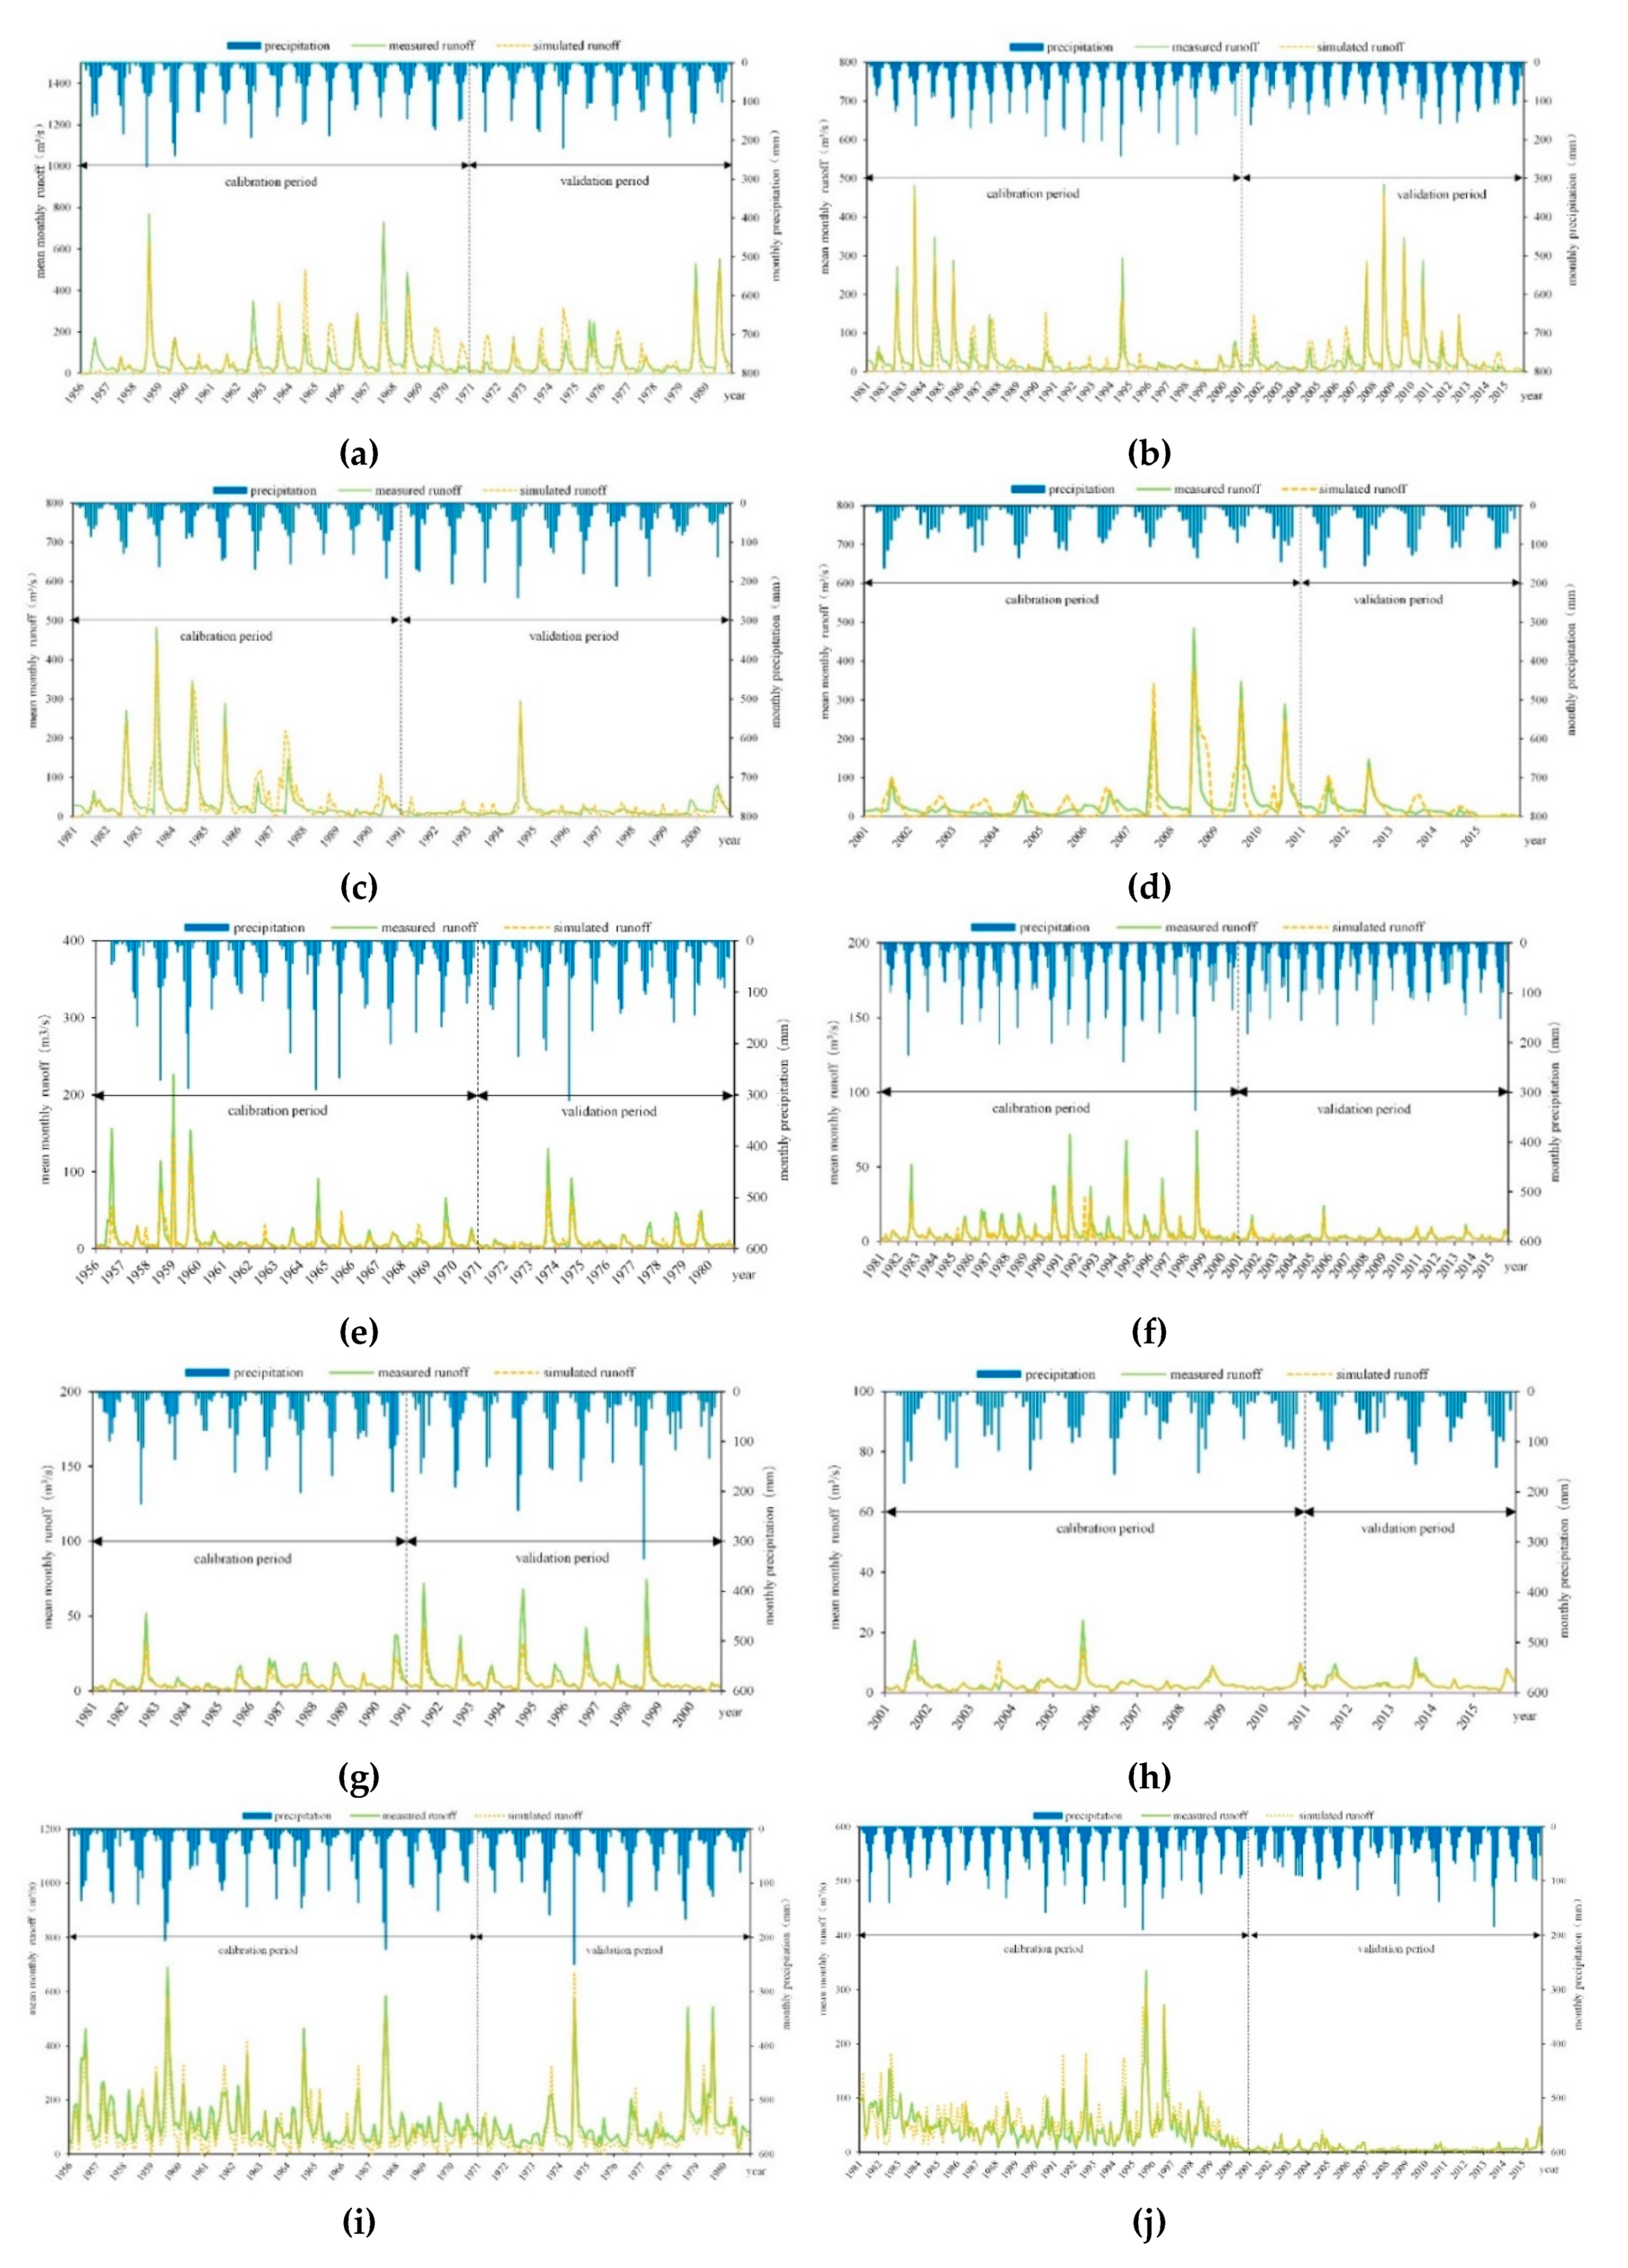
Calibration and Validation
The main purpose of parameter calibration is to evaluate the reliability of the simulation. The validity of the model is often assessed by the degree of coincidence during the validation period. In this study, the applicability of SWAT to simulate the runoff in the three mountain basins is estimated by two indices, i.e., the relative error (RE) and the Nash–Sutcliffe efficiency coefficient (NSE). The calculation formulas for these are as follows:
RE = i = 1 N ( S i Q i ) i = 1 N Q i × 100 %
NSE = 1 i = 1 N ( Q i S i ) 2 i = 1 N ( Q i Q ¯ ) 2
where Q i and S i are the measured and simulated runoff (m3/s), respectively; N is the length of the series; and Q ¯ is the average of the measured runoff (m3/s).
Different scenarios are set up according to the analysis results of change point and LUCC. The relative contributions of climate change and human activities (vegetation coverage and other factors) to runoff attenuation are quantitatively separated on the basis of the runoff simulated by SWAT and the corresponding calculation equations. The specific process is as follows: firstly, DMC is used to divide the base period and the influence period in order to find the two change points for runoff attenuation. One of them is the change point < 1 > caused by climate change and human activities, and the other is the change point < 2 > of vegetation coverage. Then, according to the change point < 1 >, 1956–2015 is divided into two series, which are the base period and the influence period of human activities. Three scenarios are set up. The climate conditions and land use in the base period are set as scenario I, those in the influence period are set as scenario II, and the climate conditions in the influence period and land use in the base period are set as scenario III. SWAT is employed to simulate runoff. Finally, according to Equations (7) and (8), the contributions of climate change and human activities to runoff attenuation are quantitatively separated. Similarly, according to the change point < 2 >, 1981–2015 is divided into two series, namely the base period and the influence period of vegetation coverage, and another three scenarios are set. The climate conditions and land use in the base period are set as scenario IV, those in the influence period are set as scenario V, and the climate conditions in the influence period and land use in the base period are set as scenario VI. Finally, according to Equations (9) and (10), the contribution of vegetation coverage to runoff attenuation is quantitatively separated.

3. Results

3.1. Change Point of the Runoff Aattenuation

The DMC method is used to identify the change point and to divide the base period and the influence period of the model simulation. First, the change point of the 1956–2015 series is divided and the average cumulative precipitation and average cumulative runoff in the three mountain basins for 1956–2015 are calculated. The relationship curves between the cumulative precipitation and cumulative runoff are drawn, and the change point between climate change and human activity is identified. According to Figure 2a, the change points between climate change and human activity in the LRMB, CRMB, and YRMB are found to be 1980, 1980, and 1981, respectively. Second, the DMC method is used to distinguish the change point in the underlying surface due to vegetation coverage variations. In other words, the cumulative precipitation–runoff curves are drawn for LRMB and CRMB from 1981 to 2015 and for YRMB from 1982 to 2015, as shown in Figure 2b. The change points in vegetation coverage for LRMB, CRMB, and YRMB are 2000, 1998, and 1999, respectively.
Based on the change points of the runoff series, 1980 is uniformly determined as the change point of the human activities, i.e., the annual runoff series of these representative stations are divided into periods of 1956–1980 and 1981–2015. Meanwhile, 2000 is determined as the change point of the underlying surface, i.e., the annual runoff series are further divided into periods of 1981–2000 and 2001–2015.

3.2. Sensitivity of the Runoff Attenuation to LUCC

3.2.1. Land Use/Cover Change (LUCC)

After classification processing, the land use data in 1980, 2000, and 2015 are divided into six types: urban construction, forest, water, farmland, grassland, and unused land for statistical analysis. The land use transfer matrices are obtained by ArcGIS. The specific conversion areas of the land use types can be seen in Table 1.
According to the transition matrix, from 1980–2015, the areas of urban construction land, water, and farmland increased while the areas of forest, grassland, and unused land decreased in LRMB. Among these, the increases in the areas of farmland and urban construction land were the largest and the decrease in the area of forest was the largest. According to the transition matrix of land use for 1980–2000 and 2000–2015, the areas of urban construction and farmland continued to increase while the area of forest continued to decrease. The areas of water and grassland decreased during 1980–2000 and increased during 2000–2015. In contrast, the area of unused land increased during 1980–2000 and decreased during 2000–2015.
From 1980 to 2015, the areas of urban construction land and water increased; the area of farmland decreased significantly; and the areas of forest, grassland, and unused land change little in CRMB. According to the land use transition matrices for 1980–2000 and 2000–2015, the area of urban construction land continued to increase while the area of farmland continued to decrease. The areas of forest, water, and grassland increased during 1980–2000 but decreased during 2000–2015. The area of unused land did not change.
From 1980 to 2015, the areas of urban construction land, forest, and grassland increased while the areas of water, farmland, and unused land decreased in YRMB. Among these, the largest increase was for urban construction land while the largest decrease was for farmland. According to the land use transition matrices for 1980–2000 and 2000–2015, the area of urban construction land continued to increase while the areas of farmland and water continued to decrease. The area of forest decreased during 1980–2000 but increased during 2000–2015. The areas of grassland and unused land show the opposite trend, i.e., increasing during 1980–2000 and decreasing during 2000–2015.

3.2.2. Sensitivity Analysis

The change rates of the runoff and various land use types (i.e., urban construction land, forest, water, farmland, grassland, and unused land) in the three mountain watersheds in 1980, 2000, and 2015 were calculated. The runoff sensitivity coefficient of the different land use types in 1980–2000 and 2001–2015 was obtained using the above Equation (4). There are only four resulting values of less than one, i.e., the urban construction land and unused land in LRMB in 2001–2015, and the urban construction land in CRMB in 1980–2000 and 2001–2015; therefore, the responses of their changes to runoff are low. However, the other values are greater (or far greater) than one, indicating that the LUCC exhibits a high response to runoff.
By drawing figures of the sensitivity coefficient of the six land use types to runoff in the three watersheds during 1980–2000 and 2001–2015, the impact of land use type on runoff can be seen more clearly. In Figure 3, blue represents the runoff sensitivity coefficient in LRMB, gray represents the runoff sensitivity coefficient in CRMB, and green represents the runoff sensitivity coefficient in YRMB. The darker colors represent the sensitivity coefficient during 1980–2000, and the lighter colors represent the sensitivity coefficient during 2001–2015. On the whole, the runoff sensitivity coefficient of forest and grassland is largest, that of water and farmland is intermediate, and that of urban construction land and unused land is lowest. If the analysis is divided by watershed, the sensitivity of runoff to land use types is YRMB > LRMB > CRMB, indicating that the runoff in YRMB is the most sensitive to changes in land use type. If the analysis is divided by stage, the runoff sensitivity coefficient from 1980 to 2000 is significantly greater than that from 2001 to 2015, i.e., the impact of LUCC on runoff is greater before 2000.

3.3. Quantitative Attribution of the Runoff Attenuation

Based on the calibrated SWAT model, the relative contribution of human activity and climate change to runoff is quantitatively analyzed by the hydrological simulation method in the three mountain basins from 1956 to 2015. In this study, the long series is divided into a base period (i.e., with less disturbance by human activities: 1956–1980) and a human activity influence period (1981–2015). It is considered that the runoff changes are caused by climate change and human activity and that they are independent of each other. First, the climate conditions and land use in the base period are set as scenario I, and the annual average natural runoff R 1 in the base period is simulated and calculated. Second, the climate conditions and land use in the influence period are set as scenario II, and the annual average natural runoff R 2 in the influence period is simulated and calculated. Finally, the climate conditions in the influence period and land use in the base period are set as scenario III, and the annual average natural runoff R 3 is simulated and calculated. The relative contributions of human activity and climate change to natural runoff are calculated by the following equations:
η H   = / R 3 R 2 / / R 3 R 2 / + / R 3 R 1 / × 100 %
η C = / R 3 R 1 / / R 3 R 2 / + / R 3 R 1 / × 100 %
where η H and η C are the contributions of human activity and climate change to the runoff change, respectively.
The impacts of human activity on runoff can be divided into two categories: direct impacts caused by water resources development and utilization, and indirect impacts caused by changes in the underlying surface. With regard to the underlying surface changes, for the whole basin, vegetation coverage is the main factor influencing underlying surface change. Through the DMC, 2000 is selected as the abrupt change year of the underlying surface. The climatic conditions and land use in the base period (1981–2000) are set as scenario IV to simulate and calculate the average annual natural runoff R 4 . Next, the climate conditions and land use in the influence period (2001–2015) are set as scenario V to simulate and calculate the annual average natural runoff R 5 . Finally, the climate conditions in the influence period and land use in the base period are set as scenario VI to simulate and calculate the annual average natural runoff R 6 . The contributions to natural runoff of vegetation coverage and other factors related to human activity are calculated using the following equations:
η V = / R 6 R 5 / / R 6 R 5 / + / R 6 R 4 / × 100 %
η O = / R 6 R 4 / / R 6 R 5 / + / R 6 R 4 / × 100 %
where   η V and   η O are the relative contributions of vegetation coverage and other human activity factors to the runoff change, respectively.
The climate conditions and land uses under the various scenarios are shown in Table 2. In scenario I, the period from 1956 to 1970 is selected as the model calibration period and the period from 1971 to 1980 is selected as the validation period. In scenario II, the period from 1981 to 2000 is selected as the calibration period and the period from 2000 to 2015 is selected as the verification period. In scenario IV, the period from 1981 to1990 is selected as the model calibration period and the period from 1991 to 2000 is selected as the verification period. In scenario V, the period from 2001 to 2010 is selected as the model calibration period and the period from 2011 to 2015 is selected as the verification period. The simulated runoff corresponding to the same period of climate conditions and land use can be verified by the measured runoff, and four parameter sets are generated, which are parameter sets 1 (scenario I), parameter sets 2 (scenario II), parameter sets 3 (scenario IV), and parameter sets 4 (scenario V). When selecting parameter sets in other scenarios, the parameter sets used in different periods of climate conditions and land use follow the same parameter sets of the same land use, that is, scenario III is selected as parameter sets 1 calibrated by scenario I and scenario VI is selected as parameter sets 3 calibrated by scenario IV. The rivers of the three mountain basins and the selected hydrological stations of the SWAT model are shown in Figure 4. The monthly runoff values of each hydrological station in the three mountain basins are adopted, i.e., taking the month as the analysis scale.
The simulation results from SWAT are checked against the flow at the Xiabancheng station in LRMB, at Dage station in CRMB, and at Xiangshuibao station in YRMB. Table 3 and Figure 5 show the simulation results under the different scenarios. The trend changes in the simulated runoff and the measured runoff are relatively consistent. The NSE is mostly in the range of 0.6–0.8, indicating that the SWAT model produced good simulation results with high reliability. The impacts of climate change, human activity, and vegetation coverage on runoff are calculated using Equations (7)–(10). Comparing the two stages (1956–1980 and 1981–2015), based on the attribution analysis for the runoff evolution, it can be seen from Table 4 that human activity is the main factor leading to runoff attenuation, with a relative contribution of 65.22% in LRMB, 67.52% in CRMB, and 61.83% in YRMB. Moreover, the contribution of climate change is 34.78% in LRMB, 32.48% in CRMB, and 38.17% in YRMB. Further analysis shows that the impact of vegetation coverage on runoff reduction is 66.86% in LRMB, 68.71% in CRMB, and 58.86% in YRMB. Therefore, the change in vegetation coverage due to human activity is the main factor influencing runoff reduction, which plays a positive role in runoff reduction.
Based on our analysis of the causes of runoff attenuation at three small watersheds in mountainous areas of North China, the relative contribution of climate change to runoff attenuation is approximately 40%, whereas that of human activity is approximately 60%. For human activity, vegetation coverage is the dominant factor, accounting for approximately 60% of this component. As far as the mountainous areas of North China are concerned, the impact of human activity on runoff is mainly reflected in the change in the underlying surface characteristics. Based on an analysis of the change in land use types, it can be seen that the rapid development of agricultural activities and urbanization in the influence period have had a certain impact on the underlying surface conditions in the study area. The planting trees and grass to intercept precipitation, to increase evaporation, to improve soil structure, and to enhance filtering capacity can reduce runoff, and a significant increase in vegetation coverage can also lead to the enhancement of water storage, thus reducing runoff.

3.4. An Enlightenment to Water Resource Sustainable Utilization and Management

In general, with the increase of human activities over the past 30 years, the underlying surface conditions in the mountainous areas of North China have changed significantly. The excessive development and utilization of water resources has aggravated runoff attenuation. With the increased countermeasures in soil and water conservation, vegetation coverage has increased and the evaporation and transpiration of natural vegetation have increased accordingly; in turn, this has had a certain impact on the runoff in mountainous areas. Considering that the present annual water consumption in North China has far exceeded the water resources carrying capacity, it is urgent to learn some lessons from this study for future water resource sustainable utilization and management. According to the quantitative attribution results of runoff attenuation in typical mountainous areas in this study, the following four enlightenments to water resource sustainable utilization and management in North China are put forward, which have significance for the protection and sustainable development of watershed water resources.
(1)
The sustainable development and utilization of water resources should be formed with the promotion of a water-saving concept in North China. It is necessary to implement a total amount control and quota management of water consumption to strengthen the publicity of water saving, conservation, and protection and to further increase punishment of illegal cases involving water.
(2)
We should pay attention to the soil and water conservation countermeasures. By expanding the forest coverage, increasing the interception and infiltration, the amount of groundwater can be increased. The purpose of controlling soil desertification and reducing soil erosion can be achieved by restoring vegetation and by constructing water conservation areas.
(3)
Efficient water-saving irrigation should be developed, and the utilization efficiency of water resources should be improved. It is advised that steps be taken at once, such as closing wells, reducing irrigation areas, and preventing water pollution strictly. In addition, it is suggested to optimize the allocation of water resources, to vigorously develop efficient water-saving irrigation, and to improve utilization efficiency, which includes adjusting the agricultural structure, reducing high-water consumption crops, and increasing low water-consumption economic crops.
(4)
We must protect water resources and strengthen the reform of water use and management. It can be carried out in the following aspects: (a) reduce the discharge of industrial wastewater; (b) standardize the distribution of agriculture, animal husbandry, and forestry and strictly control the discharge of chemical fertilizer, pesticide, wastewater and other pollution sources; (c) reduce the direct discharge of living garbage, which should be classified through recycling and treated in time; and (d) establish water resources protection zones. Only by curbing from the source, actively handling in the middle, and finally seriously repairing can we better solve the problem of water resources and ensure the sustainable utilization of water resources.

4. Discussion

In this paper, the double mass curve (DMC) is used to divide the change point of runoff attenuation, and then, the transfer matrix is employed to calculate the different land use/cover change (LUCC) from 1980 to 2015. Compared with previous studies, the following additional research work have been done. The sensitivity of runoff attenuation to each land use type was analyzed. Six different climate conditions and land use scenarios were cleverly set up. Based on the distributed hydrological model SWAT, runoff under six scenarios was simulated by the hydrological simulation method. According to the results of simulated runoff and the correlation of six scenarios, the attribution of runoff attenuation to climate change and human activities in typical mountainous areas of North China are quantified by formula and some preliminary research results are obtained. Finally, on the basis of the results, some enlightenments to water resource sustainable utilization and management are put forward.
Compared with the results of other researchers in this region, the conclusions are found to be consistent. The human activity is also found to be the main factor influencing the runoff decreases in the Zhangjiafen and Guantai watersheds of HRB [5]. This is in accordance with Liu et al. [41] and Wang et al. [42] but is in discordance with Ma et al. [22], who points out that climate change accounts for 51%–55% of the decrease in the inflow to the Miyun Reservoir. This is mainly a consequence of the different abrupt years, different time series datasets, different hydrological models, etc. The earlier the selection of the change point, the lower the relative contribution of climate change and the higher the relative contribution of human activities.
There are still some uncertainties in this study, which can be attributed to four main reasons. First, the contributions of climate change and human activity to runoff reduction are analyzed under the assumption that the runoff in the base period is not affected by human activities. However, this may not have been the case due to the farmland irrigation and LUCC as well as to the operation of dams and reservoirs, although with less intensity. Second, the precipitation data used for model building and the runoff data used in the calibration and validation stages are all measured data, which inevitably has errors. In addition, the use of just a few stations cannot truly represent the whole study area. Furthermore, there are unavoidable errors in the calibration of the model parameters. Although the SWAT model performs fairly well, the simulated runoff is slightly different from the measured runoff. Such unavoidable errors may have led to inaccurate simulated results. Finally, the impacts of human activity and climate change on runoff are complex, and the interaction between them is difficult to define. Moreover, different human activities may accumulate or offset each other. Nevertheless, the conclusions on the contribution trends of climate change and human activity to runoff attenuation are sound and reasonable. How to quantify the impact of various human activities, the interaction between climate change and human activities, and the quantitative uncertainty of the attribution analysis will be further discussed in future research. There are still technical difficulties to be solved in future research, e.g., improving the model structure to increase the accuracy of the hydrological model in terms of describing physical mechanisms. It is also of great significance to improve the coupling technology of the climate and hydrological models to forecast the future climate, so as to better cope with climate change and to implement corresponding water resource management countermeasures.

5. Conclusions

Based on the characteristics of the hydrological and meteorological elements in three typical mountainous areas of North China, the DMC method is used to test the change point of the runoff series. The quantitative identification method based on the SWAT model is used to study the driving mechanisms, laws, and attenuation causes of runoff attenuation in the study area. The relative contributions of climate change and human activity (mainly vegetation coverage) are then quantified. It is considered that the changes in the natural runoff are the results of the joint impact of climate change and human activity, and the relative contribution of the vegetation coverage is separated out from the other human activities.
The results show that the runoff in the mountainous areas of North China have been on an obvious declining trend, and climate change is not the only reason. The LUCC caused by human activities, such as soil and water conservation measures, changes in the vegetation coverage, increases in the surface water supply, and changes in the crop varieties, all have profound impacts on the evolution of the water cycle in varying degrees. For the three selected typical study areas, human activities account for more than 60% of the total. The vegetation coverage plays a major role among the human activities, and its contribution rate is more than 60% except for the YRMB, which is 58.86%. Therefore, for human activities, the vegetation coverage is the main factor and has played a positive role in runoff reduction. The results of this study have brought an enlightenment to water resource sustainable utilization and management in North China, and the methodologies can be transferred to runoff attribution analysis in water shortage areas.

Author Contributions

Conceptualization, Y.J., J.L. and C.L.; data curation, Y.J. and W.W.; formal analysis, Y.J., C.L. and Y.W.; investigation, C.L.; methodology, Y.J. and J.L.; resources, Y.J.; software, Y.J. and W.W.; supervision, J.L. and C.L.; Validation, J.L. and Y.W.; visualization, Y.J. and W.W.; writing—original draft, Y.J.; writing—review and editing, Y.J., J.L., C.L. and F.Y. All authors have read and agreed to the published version of the manuscript.

Funding

This study was supported by the Major Science and Technology Program for Water Pollution Control and Treatment (2018ZX07110001), the National Key Research and Development Project (2017YFC1502405), the National Natural Science Foundation of China (51822906), and the IWHR Research and Development Support Program (WR0145B732017).

Conflicts of Interest

The authors declare no conflict of interest.

References

  1. Budyko, M.I. Climate and Life; Academic Press: London, UK, 1974. [Google Scholar]
  2. Wu, J.; Miao, C.; Wang, Y.; Duan, Q.; Zhang, X. Contribution analysis of the long-term changes in seasonal runoff on the Loess Plateau, China, using eight Budyko-based methods. J. Hydrol. 2017, 545, 263–275. [Google Scholar] [CrossRef]
  3. Jiang, C.; Xiong, L.; Wang, D.; Liu, P.; Guo, S.; Xu, C. Separating the impacts of climate change and human activities on runoff using the Budyko-type equations with time-varying parameters. J. Hydrol. 2015, 522, 326–338. [Google Scholar] [CrossRef]
  4. Wang, J.; Hong, Y.; Gourley, J.; Adhikari, P.; Li, L.; Su, F. Quantitative assessment of climate change and human impacts on long-term hydrologic response: A case study in a sub-basin of the Yellow River, China. Int. J. Climatol. 2010, 30, 2130–2137. [Google Scholar] [CrossRef]
  5. Bao, Z.; Zhang, J.; Wang, G.; Fu, G.; He, R.; Yan, X.; Jin, J.; Liu, Y.; Zhang, A. Attribution for decreasing streamflow of the Haihe River basin, northern China: Climate variability or human activities? J. Hydrol. 2012, 461, 117–129. [Google Scholar] [CrossRef]
  6. Chu, H.; Wei, J.; Qiu, J.; Li, Q.; Wang, G. Identification of the impact of climate change and human activities on rainfall-runoff relationship variation in the Three-River Headwaters region. Ecol. Indic. 2019, 106, 105516. [Google Scholar] [CrossRef]
  7. Lu, S.; Wu, B.; Wei, Y.; Yan, N.; Wang, H.; Guo, S. Quantifying impacts of climate variability and human activities on the hydrological system of the Haihe River Basin, China. Environ. Earth Sci. 2015, 73, 1491–1503. [Google Scholar] [CrossRef]
  8. Wang, W.; Shao, Q.; Yang, T.; Peng, S.; Xing, W.; Sun, F.; Luo, Y. Quantitative assessment of the impact of climate variability and human activities on runoff changes: A case study in four catchments of the Haihe River basin, China. Hydrol. Process. 2013, 27, 1158–1174. [Google Scholar] [CrossRef]
  9. Bao, Z.; Zhang, J.; Liu, J.; Wang, G.; Yan, X.; Wang, X.; Zhang, L. Sensitivity of hydrological variables to climate change in the Haihe River basin, China. Hydrol. Process. 2012, 26, 2294–2306. [Google Scholar] [CrossRef]
  10. Yang, Y.; Tian, F. Abrupt change of runoff and its major driving factors in Haihe river Catchment, China. J. Hydrol. 2009, 374, 373–383. [Google Scholar] [CrossRef]
  11. Changming, L.; Jingjie, Y.; Kendy, E. Groundwater exploitation and its impact on the environment in the North China plain. Water Int. 2001, 26, 265–272. [Google Scholar] [CrossRef]
  12. Bluemling, B.; Yang, H.; Mosler, H.-J. Adoption of agricultural water conservation practices—A question of individual or collective behaviour? The case of the North China Plain. Outlook Agric. 2010, 39, 7–16. [Google Scholar] [CrossRef]
  13. Zhang, S.; Meng, X.; Hua, D.; Chen, J.; Li, J.; Zhang, Y.; Xia, J. Water shortage risk assessment in the Haihe river Basin, China. J. Resour. Ecol. 2011, 2, 362–369. [Google Scholar]
  14. Ren, L.; Wang, M.; Li, C.; Zhang, W. Impacts of human activity on river runoff in the northern area of China. J. Hydrol. 2002, 261, 204–217. [Google Scholar] [CrossRef]
  15. Xu, X.; Yang, D.; Yang, H.; Lei, H. Attribution analysis based on the Budyko hypothesis for detecting the dominant cause of runoff decline in Haihe basin. J. Hydrol. 2014, 510, 530–540. [Google Scholar] [CrossRef]
  16. Haasnoot, M.; Kwakkel, J.H.; Walker, W.E.; Ter Maat, J. Dynamic adaptive policy pathways: A method for crafting robust decisions for a deeply uncertain world. Glob. Environ. Chang. 2013, 23, 485–498. [Google Scholar] [CrossRef] [Green Version]
  17. Feng, K.; Tian, J. Complex adaptive system on water resources allocation system. J. Appl. Sci. 2013, 13, 1530–1536. [Google Scholar]
  18. Rakhimova, M.; Liu, T.; Bissenbayeva, S.; Mukanov, Y.; Gafforov, K.S.; Bekpergenova, Z.; Gulakhmadov, A. Assessment of the impacts of climate change and human activities on runoff using climate elasticity method and general circulation model (GCM) in the Buqtyrma river Basin, Kazakhstan. Sustainability 2020, 12, 4968. [Google Scholar] [CrossRef]
  19. Hejazi, M.I.; Moglen, G.E. Regression-based approach to low flow prediction in the Maryland Piedmont region under joint climate and land use change. Hydrol. Process. 2007, 21, 1793–1801. [Google Scholar] [CrossRef]
  20. LABAT, D. Evidence for global runoff increase related to climate warming. Adv. Water Resour. 2004, 27, 631–642. [Google Scholar] [CrossRef]
  21. Bissenbayeva, S.; Abuduwaili, J.; Shokparova, D.; Saparova, A. Variation in runoff of the Arys river and Keles river watersheds (Kazakhstan), as influenced by climate variation and human activity. Sustainability 2019, 11, 4788. [Google Scholar] [CrossRef] [Green Version]
  22. Ma, H.; Yang, D.; Tan, S.K.; Gao, B.; Hu, Q. Impact of climate variability and human activity on streamflow decrease in the Miyun reservoir catchment. J. Hydrol. 2010, 389, 317–324. [Google Scholar] [CrossRef]
  23. Wen, D.; Cui, B.; Liu, Z.; Zhang, K. Relative effects of human activities and climate change on the river runoff in an arid basin in northwest China. Hydrol. Process. 2014, 28, 4854–4864. [Google Scholar]
  24. Wu, J.; Miao, C.; Zhang, X.; Yang, T.; Duan, Q. Detecting the quantitative hydrological response to changes in climate and human activities. Sci. Total Environ. 2017, 586, 328–337. [Google Scholar] [CrossRef] [PubMed]
  25. Li, S.; Yang, G.; Wang, H. The runoff evolution and the differences analysis of the causes of runoff change in different regions: A case of the Weihe river basin, Northern China. Sustainability 2019, 11, 5295. [Google Scholar] [CrossRef] [Green Version]
  26. Hao, X.; Chen, Y.; Xu, C.; Li, W. Impacts of climate change and human activities on the surface runoff in the Tarim river basin over the last fifty years. Water Resour. Manag. 2008, 22, 1159–1171. [Google Scholar] [CrossRef]
  27. Ahn, K.H.; Merwade, V. Quantifying the relative impact of climate and human activities on streamflow. J. Hydrol. 2014, 515, 257–266. [Google Scholar] [CrossRef]
  28. Liu, D.; Chen, X.; Lian, Y.; Lou, Z. Impacts of climate change and human activities on surface runoff in the Dongjiang river basin of China. Hydrol. Process. 2010, 24, 1487–1495. [Google Scholar] [CrossRef]
  29. Mwangi, H.M.; Julich, S.; Patil, S.D.; McDonald, M.A.; Feger, K.-H. Relative contribution of land use change and climate variability on discharge of upper Mara River, Kenya. J. Hydrol. Reg. Stud. 2016, 5, 244–260. [Google Scholar] [CrossRef] [Green Version]
  30. Li, Y.; Liu, C.; Yu, W.; Tian, D.; Bai, P. Response of streamflow to environmental changes: A Budyko-type analysis based on 144 river basins over China. Sci. Total Environ. 2019, 664, 824–833. [Google Scholar] [CrossRef]
  31. Berghuijs, W.R.; Larsen, J.R.; Van Emmerik, T.H.; Woods, R.A. A global assessment of runoff sensitivity to changes in precipitation, potential evaporation, and other factors. Water Resour. Res. 2017, 53, 8475–8486. [Google Scholar] [CrossRef] [Green Version]
  32. Lei, H.; Yang, D.; Huang, M. Impacts of climate change and vegetation dynamics on runoff in the mountainous region of the Haihe River basin in the past five decades. J. Hydrol. 2014, 511, 786–799. [Google Scholar] [CrossRef]
  33. Wang, D.; Yu, X.; Jia, G.; Wang, H. Sensitivity analysis of runoff to climate variability and land-use changes in the Haihe Basin mountainous area of north China. Agric. Ecosyst. Environ. 2019, 269, 193–203. [Google Scholar] [CrossRef]
  34. Wu, L.; Zhang, X.; Hao, F.; Wu, Y.; Li, C.; Xu, Y. Evaluating the contributions of climate change and human activities to runoff in typical semi-arid area, China. J. Hydrol. 2020, 590, 125555. [Google Scholar] [CrossRef]
  35. He, Y.; Jiang, X.; Wang, N.; Zhang, S.; Hu, Y. Changes in mountainous runoff in three inland river basins in the arid Hexi Corridor, China, and its influencing factors. Sustain. Cities Soc. 2019, 50, 101703. [Google Scholar] [CrossRef]
  36. Zhang, W.; Yan, Y.; Zheng, J.; Li, L.; Dong, X.; Cai, H. Temporal and spatial variability of annual extreme water level in the Pearl river Delta region, China. Glob. Planet. Chang. 2009, 69, 35–47. [Google Scholar] [CrossRef]
  37. Dixon, B.; Earls, J. Effects of urbanization on streamflow using SWAT with real and simulated meteorological data. Appl. Geogr. 2012, 35, 174–190. [Google Scholar] [CrossRef]
  38. Teshager, A.D.; Gassman, P.W.; Secchi, S.; Schoof, J.T.; Misgna, G. Modeling agricultural watersheds with the soil and water assessment tool (SWAT): Calibration and validation with a novel procedure for spatially explicit HRUs. Environ. Manag. 2016, 57, 894–911. [Google Scholar] [CrossRef] [Green Version]
  39. Yu, F.; Shi, Z.; Li, B.; Yang, J.; Peng, H. Discussion on SWAT model and its application. Water Sci. Eng. Technol. 2008, 5, 4–9. (in Chinese). [Google Scholar]
  40. Zhang, L.; Nan, Z.; Yu, W.; Zhao, Y.; Xu, Y. Comparison of baseline period choices for separating climate and land use/land cover change impacts on watershed hydrology using distributed hydrological models. Sci. Total Environ. 2018, 622, 1016–1028. [Google Scholar] [CrossRef]
  41. Liu, C.; Xia, J. Water problems and hydrological research in the Yellow river and the Huai and Hai river basins of China. Hydrol. Process. 2004, 18, 2197–2210. [Google Scholar] [CrossRef]
  42. Wang, G.; Xia, J.; Chen, J. Quantification of effects of climate variations and human activities on runoff by a monthly water balance model: A case study of the Chaobai River basin in northern China. Water Resour. Res. 2009, 45, W00A11. [Google Scholar] [CrossRef] [Green Version]
Figure 1. Digital elevation model (DEM) of study area.
Sustainability 12 10395 g001
Figure 2. Cumulative precipitation–runoff curves for Luan River Mountainous Basin (LRMB), Chaobai River Mountainous Basin (CRMB), and Yongding River Mountainous Basin (YRMB) during 1956–2015 and 1981–2015. Notes: (a) LRMB during 1956–2015; (b) LRMB during 1981–2015; (c) CRMB during 1956–2015; (d) CRMB during 1981–2015; (e) YRMB during 1956–2015; and (f) YRMB during 1981–2015.
Sustainability 12 10395 g002
Figure 3. Sensitivity coefficient of different LUCCs to runoff.
Sustainability 12 10395 g003
Figure 4. Rivers and hydrological stations.
Sustainability 12 10395 g004
Figure 5. Simulation results under different scenarios. Notes: (a) LRMB during 1956–1980; (b) LRMB during 1981–2015; (c) LRMB during 1981–2000; (d) LRMB during 2001–2015; (e) CRMB during 1956–1980; (f) CRMB during 1981–2015; (g) CRMB during 1981–2000; (h) CRMB during 2001–2015; (i) YRMB during 1956–1980; (j) YRMB during 1981–2015; (k) YRMB during 1981–2000; and (l) YRMB during 2001–2015.
Sustainability 12 10395 g005aSustainability 12 10395 g005b
Table 1. Land Use/Cover Change (LUCC) from 1980–2015.
Land Use TypesLRMBCRMBYRMB
Area Change From 1980–2000 (km2)1980–2000 (%)Area Change from 2000–2015 (km2)2000–2015 (%)Area Change from 1980–2000 (km2)1980–2000 (%)Area Change from 2000–2015 (km2)2000–2015 (%)Area Change from 1980–2000 (km2)1980–200 0(%)Area Change from 2000–2015 (km2)2000–2015 (%)
urban construction52.087.89183.4525.82608.1652.21525.7129.65311.3823.71565.6134.80
forest−202.33−1.03−85.63−0.4432.120.31−31.22−0.30−172.08−1.59183.971.73
waters−7.48−0.958.271.0794.6424.57−31.33−6.53−38.13−4.21−24.31−2.80
farmland301.752.2727.800.20−757.73−10.41−442.15−6.78−346.98−1.37−620.62−2.49
grassland−207.16−1.1355.870.3122.820.46−21.01−0.43231.661.56−83.42−0.55
unused land63.143.13−189.75−9.130.000.000.000.0014.134.88−21.22−6.99
Table 2. Setting conditions for six different scenarios.
ScenariosClimate ConditionsLand UseCalibration PeriodValidation PeriodParameter Sets
I1956–19801956–19801956–19701971–19801
II1981–20151981–20151981–20002001–20152
III1981–20151956–1980//1
IV1981–20001981–20001981–19901991–20003
2001–20152001–20152001–20102011–20154
2001–20151981–2000//3
Table 3. Runoff simulation results.
ScenariosLRMBCRMBYRMB
Measured Runoff (108 m³)Simulated Runoff (108 m³)RE (%)NSEMeasured Runoff (108 m³)Simulated Runoff (108 m³)RE (%)NSEMeasured Runoff (108 m³)Simulated Runoff (108 m³)RE (%)NSE
I17.9716.28−9.450.533.612.84−21.130.7634.7325.85−25.580.78
II8.938.18−8.150.781.601.27−20.840.774.465.5524.300.73
III8.9313.46//1.602.33//4.4618.10//
IV8.819.7210.340.652.111.52−27.900.7414.8013.02−11.980.60
9.028.98−0.440.660.970.85−11.400.802.082.4115.80.0.71
9.0210.45//0.972.08//2.088.66//
Table 4. Attribution of runoff attenuation.
Influence FactorsLRMBCRMBYRMB
Variation (108 m³)Rate (%)Variation (108 m³)Rate (%)Variation(108 m³)Rate (%)
Natural Runoff (total)−8.1049.74−4.2841.55−20.3078.53
Climate Change−2.8234.78−1.3932.48−7.7538.17
Human ActivitiesVegetation Coverage−1.4766.86−1.9968.71−6.2458.86
Other human Activity Factors−3.8133.14−0.9031.29−6.3141.14
Subtotal−5.2865.22−2.8967.52−12.5561.83
Publisher’s Note: MDPI stays neutral with regard to jurisdictional claims in published maps and institutional affiliations.

