2. Distribution Channels of Agricultural Goods
One of the important elements of competitiveness in agriculture is distribution of agricultural products. Features of products themselves determine the distribution features of agricultural products. Some agricultural product distribution features are: regional feature of circulation distribution link, dispersion features of produce distribution link, specified distribution facilities, integrative feature of delivery and trade [
4].
For organic food producers (processors), the main distribution channels in most EU countries are direct sales, specialized organic food product stores and supermarkets. Agricultural organic product distribution channels can be divided into direct (farm sales, box schemes, farmers’ markets, etc.), indirect (wholesale, retail) and emerging distribution channels (HoReCa and public institutions) [
5].
One of the main problems in the HoReCa sector are the high logistics costs (a consequence of the very small size of orders and very frequent deliveries). Moreover, there is the impossibility of offering a homogeneous level of services throughout the country and there are the elevated costs associated with the order–delivery–payment cycle [
6].Competing manufacturers, who sell their products through retailers, tackle the issue of a strategic distribution channel design, namely, whether to establish an integrated distribution channel or a decentralized one. That is an important topic for managers and economists due to its important role in the performance of manufacturers [
7].
Decentralized distribution channels are often inefficient because firms act according to their own objectives rather than for the benefit of the channel. Suboptimal decisions at different levels are caused by lack of alignment between individual firm and channel objectives, as individual firms fail to consider the externalities of their decisions on the other firms in the system [
8].
Channel design is often not a free variable when it comes to rounding up the marketing mix with pricing decisions and product design. Product design and pricing might be constrained by a fixed channel design because rapid innovation or short product life cycles render channel redesign relatively inflexible as a responsive variable, even when channel structure is regulated neither directly nor indirectly by law. It is common to find different-quality products matched to different channel designs in such cases [
9].
Many manufacturers depend on intermediate parties to sell their products to customers. A distribution channel is often not fully coordinated because different parties along a distribution channel may not share the same interest. The double marginalization phenomenon is an example of this, where successive parties along a distribution channel price a product to maximize individual profits. This self-interested pricing behavior causes the final price of the product to be higher than if the parties were vertically integrated. Other marketing and operational decisions may be affected by a distribution channel structure, in addition to a price decision. Product quality is one such decision. The exact product features and price depend on local market conditions and distribution system [
10].
Firms have to make multiple decisions when selling products to consumers, including what the quality of the product will be, what quantity to produce, and what price to charge to consumers. In many instances, these decisions involve a channel partner and have to be made under demand uncertainty. The product quality and quantity have to be decided before the beginning of the selling season and cannot be adjusted subsequently. As the season unfolds, the retail price is typically decided and is responsive to the demand uncertainty realization [
11].
Over the past two decades, many researchers have focused on the relationship between the adoption of distribution channels and potential benefits for farmers [
3,
4,
12,
13,
14,
15,
16,
17,
18]. Studies have examined ways the new distribution channels affect farmers and their readiness to accept new models of distribution [
19,
20,
21,
22,
23,
24,
25,
26]. Many scholars have questioned a farm’s participation in supermarket supply chains. On one hand, supermarket chains and exporters have introduced new opportunities to farmers, such as credit access, transport, training and adoption of new technologies, while selling to supermarkets increases household productive asset holdings [
27], but on the other, there is evidence that when supermarkets are contractual buyers, the likelihood of payment delays by a supermarket rises with the increase of a number of village suppliers [
28]. At the same time, switching on supermarket supply chains requires building of trust, and many farmers may be waiting to enter until they observe the outcomes of their neighbors [
12]. Тhe situation is even more complicated when it comes to the international market. Ramaseshan and Patton suggest that even small businesses with a high volume of exports, and managers with a high international orientation and family heritage, should refrain from using direct international distribution channels because of the high investments, managerial skills and risks associated with integration, while, on the other hand, where the requirement of service is important and high, direct channels may be more appropriate [
29].
Farmers’ markets, as an objective necessity, especially when selling products with a low value per unit, are a specific distribution channel of agricultural products. In Serbia, farmers’ markets account for a high share of sales of vegetables (5-year average—76.32%), dairy products (5-year average—19.01%), and fruits and grapes (5-year average—39.01%), while their share related to other product groups is insignificant. A specific feature of sales at farmers’ markets is that mainly fresh products of relatively high quality are sold, with customers having a habit of choosing, tasting, etc. Under the influence of farmers’ markets, individual farms sooner or later specialize in producing specific groups of agricultural products and place them on those markets. The economic position of those farms is better because comparative advantages (proximity of market, i.e., farmers’ market, infrastructure, natural conditions, etc.) are well utilized. The impact of farmers’ markets on pricing is significant, as prices are defined in a classical manner, namely, depending on demand and supply. The notable difference between wholesale prices and those at a farmers’ market influences the decision of producers to sell their products on their own. It is important to note than the entire difference in these prices does not belong to sellers, namely producers, because sales at a farmers’ market require certain transportation costs, although they are somewhat lower for a producer than for trading organizations [
3].
The often mentioned solution for connecting producers and consumers is Alternative Food Networks (AFNs). Their development can be traced back to social movements in the 1960s and can be linked to an intention to delocalize food production and consumption [
13,
19]. Feenstra explains that “rooted in particular places, AFNs aim to be economically viable for farmers and consumers, use ecologically sound production and distribution practice, and enhance social equity and democracy for all members of the community” [
30]. As an alternative model to the more standardized industrial mode of food supply [
30], AFNs develop a hybridized network of producers, consumers and other participants in the distribution process. Corsi and Mazzocchi underline that direct sales can take several forms, such as sales on farm, online sales “pick your own” model, which, in addition, can be integrated into other farm activities, such as rural/agricultural tourism or educational farm [
13]. Beside these, there are other alternative models such as consumer groups that engage with producers in Community-Supported Agriculture [
13].
Exploring the drivers for the development of AFNs in Lombardy (Italy), Corsi and Mazzocchi find that AFNs are more likely to exist where farms are small and oriented to organic farming and typical certified production [
13]. Their results also show that the number of AFNs increases when the average income and age are higher [
13]. However, as they underline, the development of AFNs is not just a matter of farmers’ choice; it is also a result of interaction between farmers oriented to quality production and consumers willing to pay more for environmentally friendly local products [
13]. Aubert and Enjolras questioned the relationship between environment-friendly practices, such as organic farming and the adoption of short food supply chains (SFSC) at farm level, focusing on farms specializing in wine-growing and arboriculture [
31]. They demonstrated that farmers who adopt an organic farming label are more likely to sell their products through short supply chains, while farmers who sell their products using this channel are more likely to implement environment-friendly practices [
31]. In addition, the study confirms that environment-friendly practices are more likely to be implemented by younger producers who are furthermore better educated and claim to work more on their farm.
Another strategy which has been attracting scholars’ attention during the past two decades is the adoption of web marketing (WM). Arisen from farms’ digitization and access to the Internet, WM has triggered a new understanding of distribution possibilities. Development of the Internet infrastructure for farms is stated by the European policy agenda as an important goal for the European Union. Giampietri and Trestini define WM as “the body of marketing activities using the web to study the market and develop new business relationship, i.e., e-commerce (e.g., strategies, promotion/advertising, distribution, sales, customers’ monitoring and support), specifically through social media, e-mail, trade platforms, online shop, and own website” [
30]. Recognizing the importance and contemporary demands for a farm’s digitization, Giampietri and Trestini explore the factors that drive farmers’ intention to adopt web marketing. They find that the positive predictors are a high level of perceived usefulness of WM and a high level of perception that the use of WM is effortless [
30]. They also find the significant and positive connection between recognized reliability and profitability of WM and intention to use it [
30]. On the other hand, they have found no significant effect for the technological and financial readiness, and the perceived lack of resources, as opposed to the literature [
30]. Moreover, they also found that lower intention is connected to the greater size of a farm, that women are more likely to adopt WM, and that farms located in rural areas are more likely to gain visibility in the market through technology adoption [
30].
Internet and new technologies can be a powerful marketing tool on many levels. Calisti, Proietti and Marchini constructed a simulation with an agent-based model, reproducing the local food consumption market, aiming to investigate how a new, small food retailing shop interacts with this market [
32]. The model simulated the opening of a farmers’ market in a hypothetical urban area that reflects the population density of a medium-sized town in central Italy. The intent was to reproduce the current status of consumption for food products within a certain territorial context and given time period, as well as to investigate how consumers’ behavior changes with the opening of the new shop. As a result, they could predict changes in consumers’ habits, the economic positioning of new, small shops and their best location, providing the information which is of considerable interest not just for farmers’ markets but also for policymakers.
In recent years, in addition to the traditional sales channel, consumers have increasingly been opting for purchasing products from the Internet channel (direct channel), which has become an important way of product sales. More and more companies are redesigning or rebuilding their distribution channel structure with the change in customer or consumer buying behavior. On one hand, the mixed channel structure, which consists of the traditional sales channel and the Internet channel (direct channel), can achieve better customer coverage and penetration, while on the other, it may also lead to conflict, competition and imbalance between different distribution channels. How can one design a distribution channel strategy in different types of distribution channels in a three-echelon supply chain, consisting of one manufacturer, one retailer and a final customer? Nowadays, there are three potential systemic problems: how to design different types of distribution channels structure in a three-echelon supply chain (direct channel, retail channel and mixed channel), how to influence a manufacturer’s product quality decision and quality prevention strategy, a retailer’s product pricing decision and quality inspection strategy and a customer’s product demand decision, how to influence a manufacturer’s and retailer’s expected profits function and a final consumer surplus, and how to determine a product quality control strategy [
33].
Paciarotti and Torregiani explored the strength and weakness connected to the implementation of local food logistic services, designed to facilitate and enable the use of local food among restaurants [
32]. They suggest that the main barriers for purchasing local food to restaurants, such as limited product availability, the lack in information flow between farmers and restaurateurs, and logistic barriers, can be faced by introducing a coordinated logistics system, a local food service aimed at promoting and enabling local food consumption among restaurant, without undermining the short food supply chain principles [
32]. Paciarotti and Torregiani proposed the creation of a local food service designed according to the characteristics of a cloud computing system, by which the actors would directly interact within the system without the interference of additional intermediaries. Three distribution models were proposed: (A) the first involves both the collection of food products among farmers and their distribution to customers, (B) the second model provides only the deliveries to customers, while the products are transported directly from the producers to the cross-docking hub, and (C) the hybrid model in which the products could be both collected by the hub carrier and delivered to the platform by the producers and then distributed by the logistics service [
32].
The case study considered the municipality of Senigallia and the close rural area in the Marches Region, Central Italy, where a total of 60 restaurateurs and 100 owners of micro and small-sized farms have been interviewed. The results indicate that the main users seem to appreciate the services proposed by the new system and to agree to the connected organizational change required, such as the use of IT [
32]. Even though both producers and restaurateurs showed an overall interest in joining the distribution system, authors suggest that an awareness-raising campaign promoting a deeper understanding regarding scope and operation mode of logistic-service should increase their motivation and dissolve some doubts [
32].
Very often, the readiness of farmers to accept new channels of distribution is not enough. Each such change requires additional time, efforts, knowledge and experience, and, in many cases, adoption of new production models or technology. At the same time, as research suggests, adaptation to modern markets by small farmers in developing economies is a risky process, which, despite offering insurance against some kinds of risks, could exacerbate other risks or entail new risks of their own [
14], or may lead them into a position to pay too much for contractual insurance against price variation [
34].
Therefore, the paper will apply the AHP model for meeting various decision-making criteria when selecting the most efficient distribution channel, all with the aim of improving small farm business operations in Serbia.
3. Materials and Methods
The paper focuses on defining indicators of supply of agricultural products, measuring their distribution channels. The Analytical Hierarchy Process (AHP) is applied in this study to determine the best distribution channel of agricultural products from small farms. The objective is to set up a framework for tackling multiple criteria, including intuitive, quantitative and qualitative aspects. The AHP model was developed in 1972, as a practical approach to solving relatively complex tasks [
35]. Decision-making through hierarchy structure, from a general objective to criteria, sub-criteria and alternatives at subsequent levels, enables a range of simple comparisons and rankings. The obtained results are synthesized, providing analysts with reaching the best possible decision, and then with clearly explaining the final choice [
36]. Throughout the procedure, consistency of decision-making by decision-makers and value and weight are assessed. Owing to its simplicity and applicability, the AHP model has been one of the most popular methods with regard to multicriteria decision making for decades. It has become the favorite decision-making tool in research in various areas because it helps decision-makers select relevant factors for a specific problem they tackle.
The main advantage of the AHP model lies in providing the opportunity for interactive design of a problem via a hierarchy structure (preliminary decision-making), where hierarchy elements are (then) assessed in pairs (objective, criteria, alternatives), gradually from the top to the bottom, in order to synthesize all the values and define weight vectors of all hierarchy structure elements. More precisely, the AHP model enables an analysis of the executed assessment and calculated rankings of each hierarchy level. From the aspect of methodology, the AHP model defragments a problem within a hierarchy structure, where criteria and alternatives, whose rankings lead to an objective, namely, problem solving, are assessed. The scientific context of the AHP model is additionally supported by the fact that the method has been thoroughly studied, analyzed and improved, that numerous scientific papers and conferences have been focused on this model and that these models are studied at universities around the world [
36,
37,
38,
39,
40].
The method is simply structured and applied in several steps. After defining elements in a structure, elements of the hierarchy structure are compared in pairs. Their mutual relevance is graded using Saaty’s scale of relative importance in the following manner of distribution:
The overall decision-making process in this example of selecting the most acceptable distribution channel for a small farm when it markets its agricultural products is based on designing a matrix (square matrix
A, matrix elements
aij). Matrix elements are calculated using Saaty’s scale of relative importance (
Table 1) by relating elements at one hierarchy level within the hierarchy structure of the AHP model in pairs with elements at an immediately higher hierarchy level, where the indicator of element importance is
i (
i = 1, 2,…, n) and the element is
j (
j = 1, 2,..., n). By analyzing elements in pairs, uncertainties in regard to decision-making are neutralized. In fact, an uncertainty may appear and is often a by-product of any decision-making in regard to the existence of slight changes in decision-makers’ assessments. Therefore, it is vital to apply Saaty’s scale of relative importance in such decision-making procedures.
The AHP model methodology is simple and presented via a hierarchically structured decision-making model, consisting of several consecutive and related hierarchy levels. At the top of the hierarchy structure is an objective, under it criteria, followed by sub-criteria (there can be multiple, depending on requirements of an analysis). Alternatives are at the bottom of the hierarchy structure (our example is presented below). The objective is never compared with other elements of the hierarchy structure. Under it are the criteria, which are mutually compared (pairs are formed). They are then compared one with another against the first element immediately above. After the criteria are defined, the next step is to assess alternatives against each criterion. Thus all the necessary elements of the hierarchy structure are provided and the so-called network problem presentation is designed. It serves to define solutions of the set objective, namely, the problem. The values obtained in this manner form a matrix and are entered in the matrix order. The matrix diagonal values are 1, the matrix values are entered above, in the upper triangle, while their reciprocal values are added below, in the lower triangle of the matrix. The eigenvalue method is applied for comparing the paired elements, where weight vectors of the entered elements are set through a linear system:
where
A is the comparison matrix and it is consistent (
nxn dimension),
ω is the eigenvector,
λ is eigenvalue and
e is the unit vector.
In his eigenvalue theory, Saaty (1990) states that when
where
λmax is the main eigenvalue of the matrix A, the matrix A may be inconsistent, but still reciprocal. The actual opinion of the experts may be questioned. This problem is resolved by eigenvectors (
ω), then a matrix with all entries is designed (
ωi/
ωj), in order to obtain the approximation of the matrix A with the consistent matrix. The inconsistency in the entire matrix may be obtained with one number
λmax − n, measuring a deviation of results from the consistency-driven approximation.
The next phase of the model includes several steps. In the first one, local priority vectors are synthesized by applying the aggregation model of distribution [
35]:
In order to assess consistency of the results, it is necessary to calculate the maximum eigenvalue of the comparison matrix first (λmax). The maximum eigenvalue of the comparison matrix represents the benchmark of local priority vectors for all the criteria.
Why is it important to calculate consistency when decision-makers make decisions? When assessing values or ratios at different levels of a hierarchy structure, identification of consistency helps in measuring and eliminating mistakes in experts’ judgement in regard to evaluation and decision-making. Therefore, the next step is to calculate a consistency rate—the
CR parameter (with the threshold of 0.1).
where
RI is the random index (matrix consistency index of n randomly generated pairs). The calculated values of the random index are presented in
Table 2.
What does this threshold mean? If the consistency rate is lower than 0.1 (CR < 0.1), the eigenvalue vector assessment is accepted. If it is higher than 0.1 (CR > 0.1), it is necessary to improve consistency by a re-evaluation within the matrix. In other words, it is necessary to repeat the comparison of rules using the eigenvalue method. The final values of the consistency index are ranked. The best-ranked value represents the solution to the decision-making problem.
5. Results of the AHP Method Application
The process of assessing the criteria and the alternatives was executed by independent, professional experts in the area of agribusiness and agriculture. Those are reputable scholars and university lecturers, with relevant references in agricultural production, quality of agricultural products and placement of agricultural products in foreign markets. In the area of an in-depth analysis, other relevant experts may be engaged with regard to local regulations, state incentives, activities of cooperative societies, etc.
The research was modified and adjusted to the needs of the project “The role of small agricultural farms in the sustainable development of the agri-food sector in Central and Eastern Europe.” The aim of this research is to analyze the sustainable development of small farms and the food safety analysis of small farms in Poland, Romania, Moldova, Lithuania and Serbia in the period 2019–2021. The survey on a sample of 550 small farms was conducted in Serbia during the period June–September 2019. The survey covered several areas that are important for examining the management and development of small farms in Serbia, namely: socio-economic, environmental, farm-market relationship and risk management, food safety and farm vitality (succession).
The research and development work under the Project was carried out in stages. The first was the diagnosis of the functioning of small farms, based on the available literature of the subject, reports, studies and existing databases. In the second step, it was conducted survey on a group of 550 farms in Serbia in order to create a database and build a hierarchy of sustainability in accordance with the sustainability index (Right Balance). In the last stage, 16 most-balanced entities (“Top 16”) were selected from the group of all farms in order to conduct an in-depth study using interview.
The surveys were conducted by expert interviewers, highly educated individuals from those regions in which the survey was conducted. The sample included small registered farms, which are registered in accordance with the regulations of the Republic of Serbia. The survey was conducted on the entire territory of the Republic of Serbia—in Vojvodina (Northern Serbia), in western Serbia and central and eastern Serbia.
The survey provided data on farm-related income, the source and amount of off-farm income, type of farm work and characteristics for themselves and their family. Out of 301,028 registered agricultural farms in Serbia, the survey covered 550 small farms. The average age of household owners in the sample is 54 years for men and 56 years for women. Observed by gender, the holders of small farms are 84% men and 16% women. Holders of agricultural holdings in 42% of cases have completed secondary school, about 3% have completed secondary agricultural school, 5% have some faculty or university. As many as 49% of farm owners acquired knowledge in agriculture from their ancestors. Of all small farms, 49.1% are classed under cereals (northern Serbia—Vojvodina), while 26.7% are mixed farms, and other small farms are engaged only in the processing of milk, fruit, wood, and livestock.
Depending on the specific question, the respondent had several possible answers (multiple choice questions and open ended questions). We received the most expected answers from the field of socio-economic questions. Problems were noticed in the field of food security and succession because of the direct question about their food security problems due to financial reasons. The duration of the interviews was between 1.5 and 3.0 h—depending on the available time, and the size and scope of the farm’s activities.
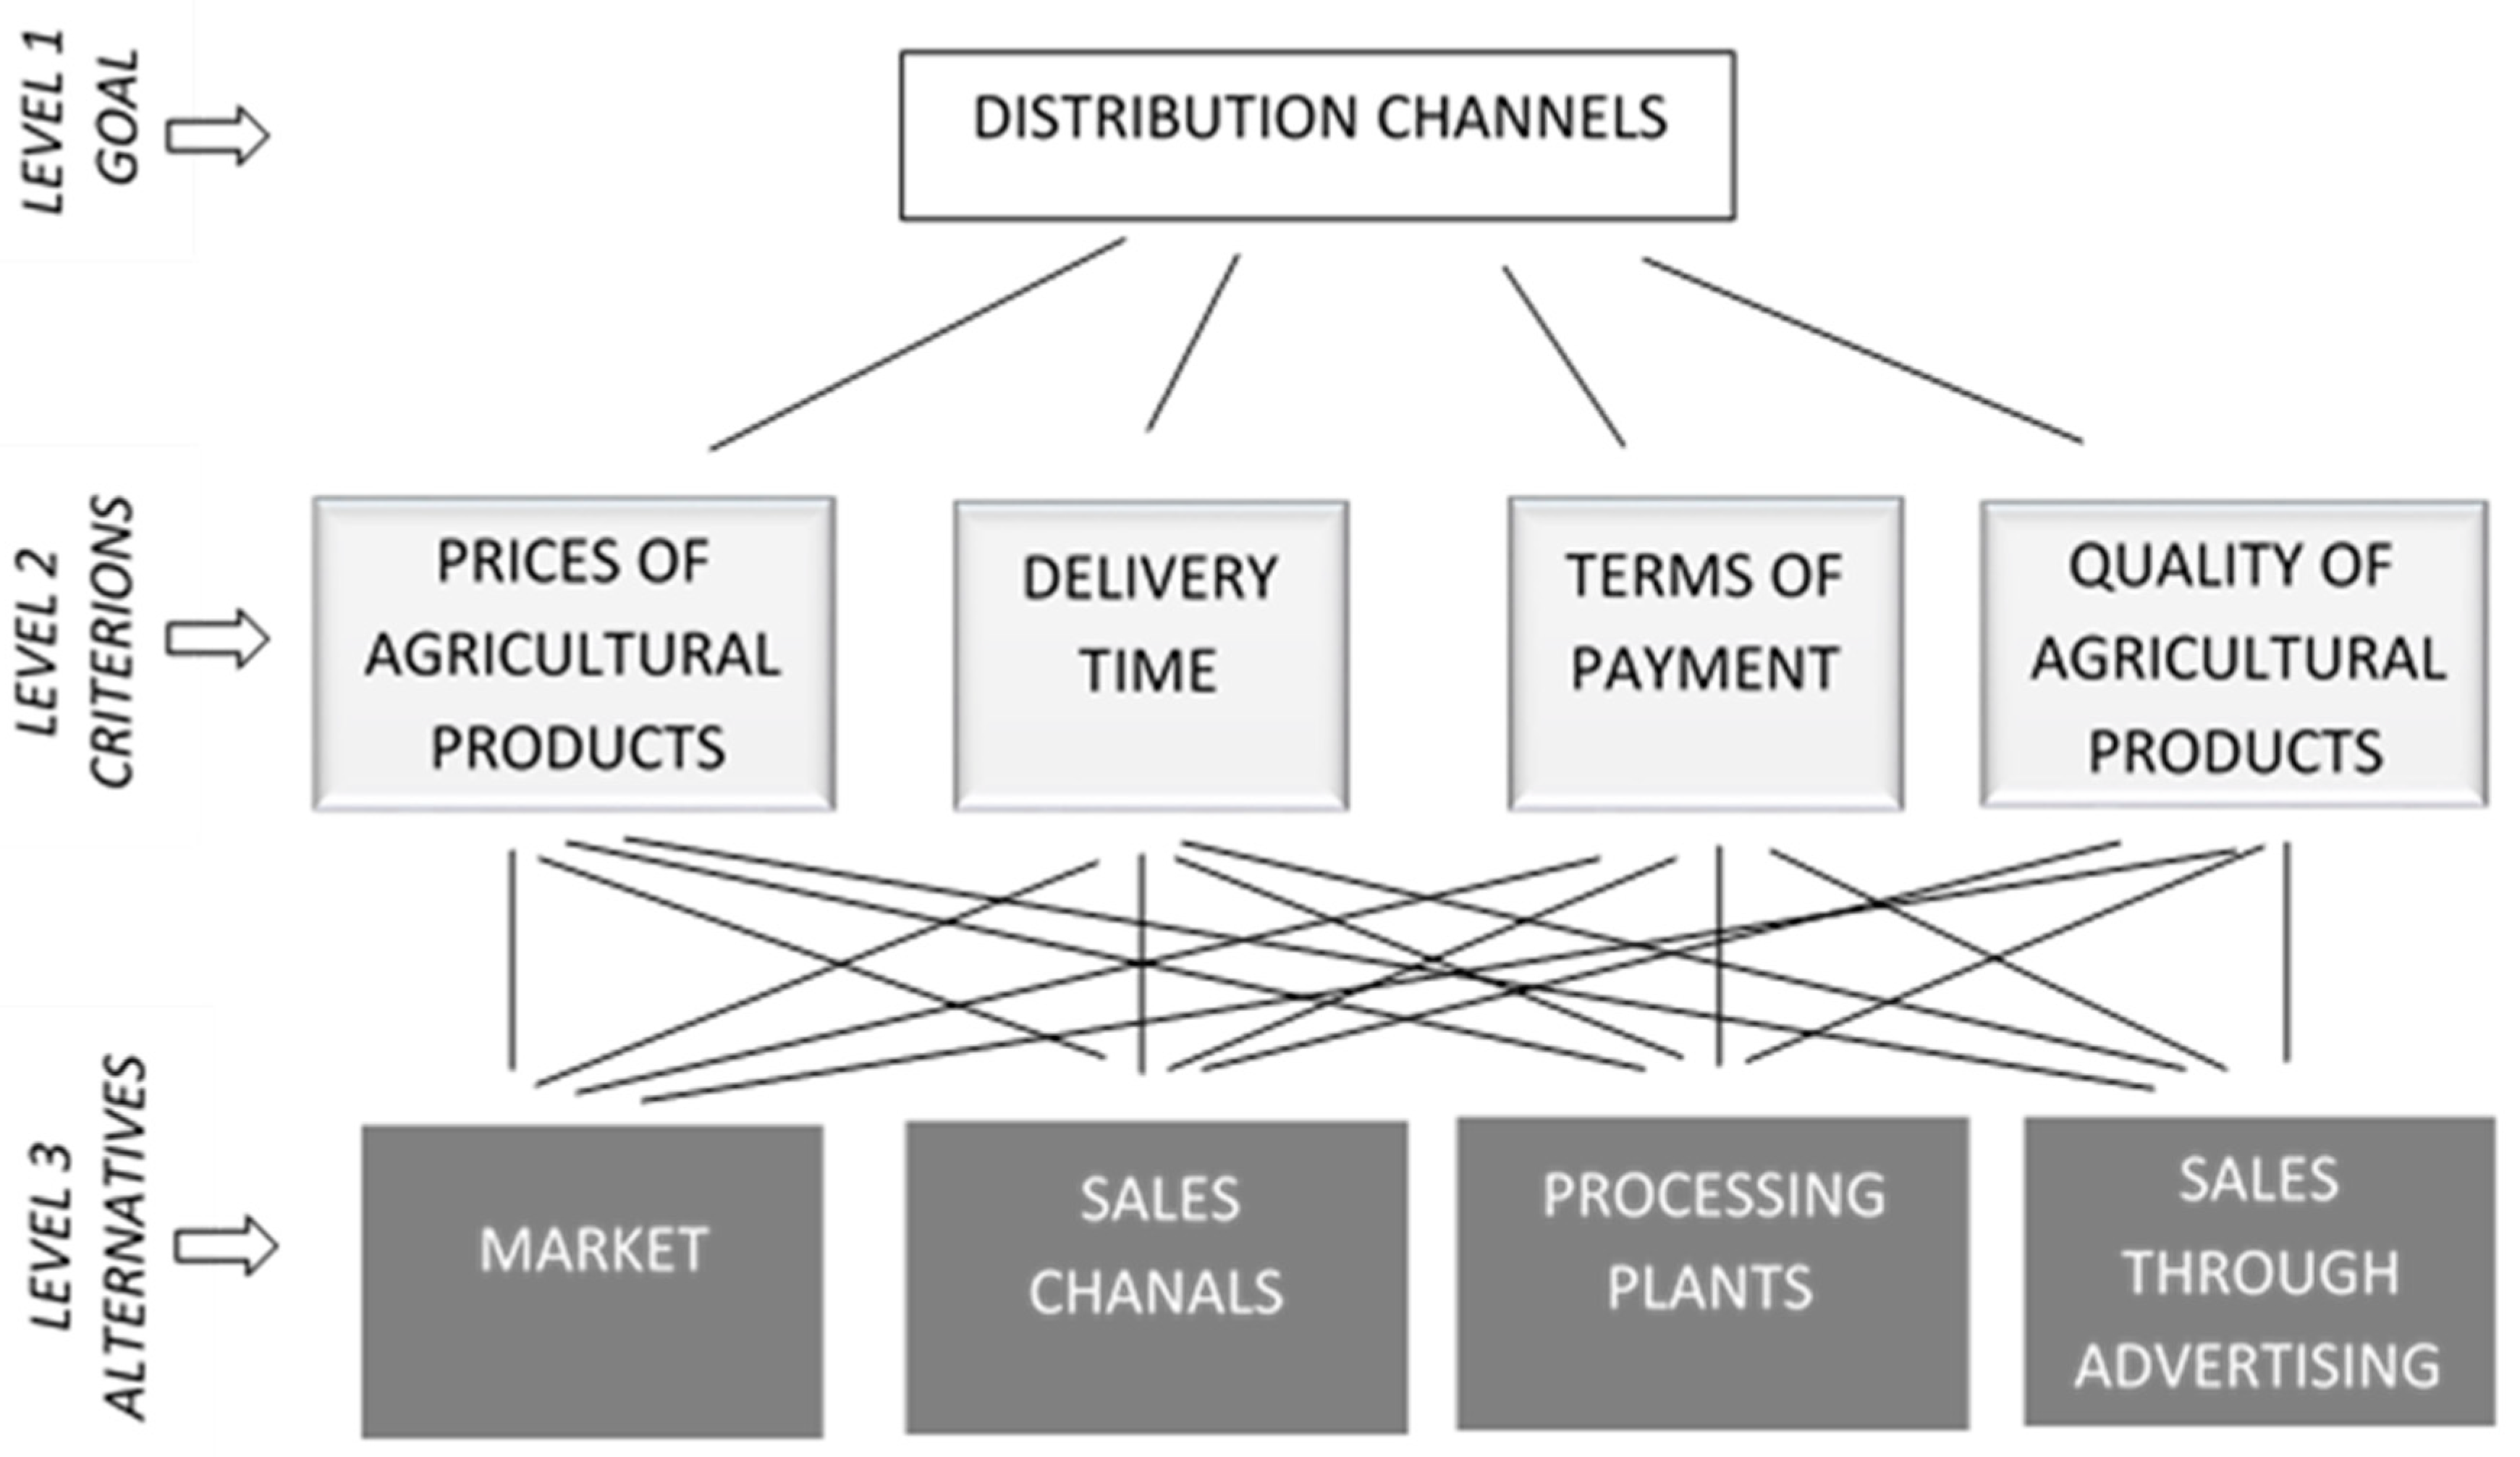
During the face-to-face interviews, the answers were noted on questionnaire forms. The final data from the survey were entered into a database. The results from this survey were used to develop simpler and more precise problem-solving and decision-making processes for improving the farms’ operations by using the AHP model. Let us look at the AHP model hierarchy structure for selecting the most efficient distribution channel for agricultural products first. We started by defining the objective. The decision-makers then defined the criteria (four criteria). The criteria were then compared to the set objective. After that, the alternatives (four alternatives) were defined at the next hierarchy level. Finally, the obtained result was interpreted from the economic aspect. The decision-making procedure via hierarchy levels is complex. The criteria are evaluated (using the abovementioned Saaty nine-point scale). Those criteria provide weight coefficients, which are necessary for assessing and selecting the distribution channel for a small farm. In the next phase, the variants are evaluated against each criterion, namely, each of the four alternatives is assessed against the four considered decision-making criteria. Each variant obtains its eigenvalue. The final phase consists of making the decision and selecting the best alternative. The distribution channel with the highest value rank will be the most favorable solution for a small farm.
After selecting and defining the criteria, the decision-makers made the pairwise comparison of the criteria against the objective (using Saaty’s scale). Then they performed the pairwise comparison of the alternatives against each of the defined criteria.
After the pairwise comparison of all the distribution channels against the prices of agricultural products and the definition of weight vectors for the criterion of price of agricultural products, the most relevant alternative, i.e., the distribution channel of agricultural products is farmers’ markets (indoor and outdoor).
After the pairwise comparison of all the distribution channels against delivery time of agricultural products and the definition of weight vectors for the criterion of terms of payment of agricultural products, the most relevant alternative, i.e., the distribution channel of agricultural products is sales to processing plants.
After the pairwise comparison of all the distribution channels against delivery time for agricultural products and the definition of weight vectors for the criterion of quality of agricultural products, the most relevant alternative, i.e., the distribution channel of agricultural products, is sales to processing plants.
The next step in the AHP model includes a calculation of priorities of alternatives against the defined objective, after the previously calculated priorities of the criteria against the objective, as well as the priorities of alternatives for the given criteria. That procedure includes the implementation of the multiplication of weights. All that combined enables the execution of an overall synthesis of the problem of selecting the best distribution channel for agricultural products.
Table 3 shows that the most important criterion is C
4—Quality of Agricultural Products (vector value 0.49). There are two reasons for the domination of the criterion C
4. Firstly, land is of high quality, and secondly, with an adequate treatment of crops, the quality of agricultural products in Serbia is very high. It is important to note than the criterion C
1—Price of Agricultural Products also has a high ponder (vector value 0.33). This is largely understandable because product quality is related to price (higher quality, higher price). Furthermore, these two criteria are the only ones that guarantee long-term farm improvement. The remaining two criteria, C
2—Delivery Time of Agricultural Products (vector value 0.08), and C
3—Terms of Payment of Agricultural Products (vector value 0.10), do not demonstrate major relevance for small farms in Serbia. Consistency validation is a technique aimed at successful elimination of doubts regarding criteria selection and conclusions reached in defining the criteria values in the pairwise comparison matrix. It is the so-called assessment of a rate of deviation from consistency. First, the maximum eigenvalue of the comparison matrix is calculated (
λmax = 4.25), then the consistency index is defined (CI = 0.09), followed by the consistency rate (
CR = 0.08). The obtained value of the consistency index is lower than the threshold for assessing consistency (
CR < 0.1). It means that the comparison matrix was properly designed and thus there is no need for a new criteria evaluation.
The next step is assessing variants against each criterion individually. The tables below (
Table 4) present the matrices of comparing alternatives against each of the four criteria, with computed weight vectors.
In
Table 4, the experts evaluated relations of each of four distribution channels of agricultural products against the criterion of the price of agricultural products (C
1).
The final priority for the criterion of price of agricultural products or the value of weight vector is 0.53. In order of priority, it is followed by processing plants (vector value 0.21), sales through advertising (vector value 0.19), and sales channels (vector value 0.07).
In
Table 4, the experts assessed relations of each of the four distribution channels of agricultural products against the criterion of delivery time of agricultural products (C
2).
After the pairwise comparison of all the distribution channels against the delivery time of agricultural products and the definition of weight vectors for the criterion of delivery time of agricultural products the most relevant alternative, i.e., the distribution channel of agricultural products, is sales through advertising. The final priority for the criterion of delivery time of agricultural products or the value of weight vector is 0.39. In order of priority, it is followed by processing plants (vector value 0.38), sales channels (vector value 0.15), and farmers’ markets (vector value 0.08).
In
Table 4, the experts assessed relations of each of the four distribution channels of agricultural products against the criterion of terms of payment of agricultural products (C
3).
The final priority for the criterion of terms of payment of agricultural products or the value of weight vector is 0.40. In order of priority, it is followed by sales through advertising (vector value 0.39), sales channels (vector value 0.14), and farmers’ markets (vector value 0.07).
In
Table 4, the experts assessed relations of each of the four distribution channels of agricultural products against the criterion of quality of agricultural products (C
4).
The final priority for the criterion of quality of agricultural products or the value of weight vector is 0.40. In order of priority, it is followed by sales through advertising (vector value 0.39), sales channels (vector value 0.14), and farmers’ markets (vector value 0.06).
The obtained results enable the final step in the AHP model—ranking of the distribution channels of agricultural products for a small farm (
Table 5). We find the final decision or selection of the best distribution channel of agricultural products for small farms in Serbia in the alternative with the highest rank value with the highest total weight.
With the received ranks, it is advisable to validate them by simply summing
p the ranks per row and column. In the farthest right field at the bottom (grey background) of the final table (
Table 5), the value of the summary of the last row or the last column has to be 1. It shows that the summary of all values for alternatives (the last column), namely, the criteria (the last row) equals 1. With this confirmation, we can conclude that the AHP model procedure was executed to the end, precisely and accurately.
The final decision shows that the alternative A3 is dominant and crucial for the selection of a distribution channel for small farms, namely that small farms largely rely on placing their fresh produce to processing plants (cooling and drying facilities, agricultural combines, silos). This type of placement of agricultural products is simple and safe for small farms. They are in a position to place all volumes they manage to produce, without a pre-defined volume, but in compliance with quality and standards. The main shortage for a small farm lies in an impossibility to influence the price of their products, although those may be high-quality ones. On the other hand, such buyers of agricultural products have a monopoly position and they use it to set the final price. Immediately behind it, with a high ponder, is the alternative A4, where promotion of own agricultural products and their sales over the fence to their neighbors, tourists, other customers via referrals (word-of-mouth regarding quality and prices of products) dominate. They negotiate about the price in direct contact with buyers, offering high-quality agricultural products that buyers can taste. The remaining two alternatives have a lower value for a small farm. Sales of agricultural products at farmers’ markets slightly stand out (direct bargaining, visual contact, price per agreement). This illustrative example of a small farm reflects the actual situation with the placement of small farms’ agricultural products in Serbia. By including additional criteria and alternatives, it is possible to analyze more detailed features of small farms in Serbia.
Agriculture sector in Serbian is very important because this is the only sector in the Serbian economy with a positive trade balance in past years. Based on the fact that small farms as a dominant form of farming in Serbia because of their significant role in agricultural production, self-employment and provision of family income, land resources and favourable natural conditions, the porpose of this paper was to presents a procedure for multicriteria decision-making using the AHP method for better economics performance of their business.
The AHP is a flexible decision—making process and it can help the farmer (decision maker) set priorities and make the best decision when both qualitative and quantitative aspects of a decision need to be considered [
38].

 ,
, 
