Study on the Compressive Behaviour of Sustainable Cement-Based Composites under One-Hour of Direct Flame Exposure


1
Department of Mechanical Engineering, Invertis University, Bareilly 243123, India
2
Departamento de Arquitectura, Universidad de Alcalá, 28801 Madrid, Spain
3
Department of Engineering and Architecture, University of Trieste, 34127 Trieste, Italy
*
Author to whom correspondence should be addressed.
Sustainability 2020, 12(24), 10548; https://doi.org/10.3390/su122410548
Submission received: 6 October 2020
/
Revised: 22 November 2020
/
Accepted: 12 December 2020
/
Published: 16 December 2020
(This article belongs to the Special Issue Sustainable Structural Design for High-Performance Buildings and Infrastructures)
Abstract
:Fire is a significant threat to human life and civil infrastructures. Builders and architects are hankering for safer and sustainable alternatives of concrete that do not compromise with their design intent or fire safety requirements. The aim of the present work is to improve the residual compressive performance of concrete in post-fire exposure by incorporating by-products from urban residues. Based on sustainability and circular economy motivations, the attention is focused on rubber tire fly ash, aged brick powder, and plastic (PET) bottle residuals used as partial sand replacement. The selected by-products from urban residues are used for the preparation of Cement-Based Composites (CBCs) in two different proportions (10% and 15%). Thermal CBC behaviour is thus investigated under realistic fire scenarios (i.e., Direct Flame (DF) for 1 h), by following the International Organization for Standardization (ISO) 834 standard provisions, but necessarily resulting in nonuniform thermal exposure for the cubic specimens. The actual thermal exposure is further explored with a Finite Element (FE) model, giving evidence of thermal boundaries effects. The post-fire residual compressive strength of heated concrete and CBC samples is hence experimentally derived, and compared to unheated specimens in ambient conditions. From the experimental study, the enhanced post-fire performance of CBCs with PET bottle residual is generally found superior to other CBCs or concrete. The structure–property relation is also established, with the support of Scanning Electron Microscopy (SEM) micrographs. Based on existing empirical models of literature for the prediction of the compressive or residual compressive strength of standard concrete, newly developed empirical relations for both concrete and CBCs are assessed.
1. Introduction
A series of consistent unfortunate fire disasters has highlighted the need for safer structural materials [1]. Concrete is safer under fire due to noncombustibility and low thermal conductivity in comparison to other widely used construction materials, such as glasses [2,3], steel [4], composites [5], and wood [6]. However, the physical, chemical and mechanical properties of concrete deteriorate due to fire exposure [7,8]. The structural and occupant safety in fire depends on the behaviour of concrete; thus, the performance of concrete under elevated temperature is extensively investigated [9,10,11,12]. The performance of concrete under elevated temperature deteriorates due to thermal incompatibility of constituents, aggregate and cement paste interface debonding, aggregate deformation, calcium silicate hydrate (CSH) gel disruption, cement paste chemical transformation and internal pressure resulted from entrapped steam [13]. The higher concrete grade suffers higher strength loss [14]. The heating rate and time of exposure affects concrete performance in fire [15]. The concrete suffers negligible up to 200 °C as only free water evaporates (exceptions are also reported [16]), at 300 °C bounded water starts evaporating; thus, CSH starts irreversibly dehydrating. At 400 °C, the strength of concrete further deteriorates, however the residual compressive strength does not suffer much [17]. At 530 °C, Ca(OH)2 converts into CaO, which results in shrinkage of cement paste 33% by volume [18]. The compressive strength of concrete can hence reduce down to 90% at 750 °C [19]. A multitude of parameters, however, like the nature and setup of the experiments, or the mix design parameters, govern these findings [15].
The performance of concrete depends on fillers and adhesives at normal and elevated temperature [20]. A number of supplementary cementitious materials (SCMs) can be used in for improving the fire performance of concrete [21]. The inclusion of suitable filler may prevent thermally induced explosive spalling if their melting temperature is lower than the temperature at which explosive spalling occurs [15]. The melted fillers could be absorbed by the matrix resulting in a conduit left for steam. A further permeable network could be created that would allow outward migration of steam for sinking the pore pressure.
The first objective of the present study is to assess and support the use of waste and harmful materials as fillers for improving the post-fire residual performance of standard concrete. Some studies of literature [22,23,24,25,26,27] are dedicated to the assessment of specific properties and effects of concrete-based solutions inclusive of PET residuals, with some efforts for the expected post-fire performance [28]. However, the cited documents are often related to standard methods and procedures, that often do not reproduce a real boundary condition for the tested materials.
To this aim, rubber fly ash and Polyethylene Terephthalate (PET) plastic bottle residual and aged brick powder are used in this paper for the prepared CBCs. Moreover, special attention is spent for the realistic thermal exposure of cubic samples in fire conditions. In general, the standard ISO 834 thermal history (or a fixed rate of heating) is imposed for different time durations in dedicated furnaces to expose the investigated specimens to elevated temperature [15,29]. In a few cases, the concrete specimens were exposed to real flame [30].
As such, this research study focuses on the performance of CBCs to 1 h of Direct Flame (DF) thermal exposure. A brief description of materials and methods is presented in Section 2. The final objective of this work is in fact to compare the residual compressive strength of concrete and CBCs specimens, after subjecting the samples to nonuniform, realistic fire exposure. To this aim, it is well known that Finite Element (FE) numerical models can be used to realistically predict the thermo or mechanical (and even combined) behavior of concrete (or other general materials in fire conditions). Reliable modelling strategies for concrete in fire are reported in [31,32]. In this paper, with the support of the ABAQUS/Standard computer software [33], the attention is focused on the thermal boundaries and expected predictions for the tested cubic specimens, showing the potential and limits of the FE method (Section 3). An additional support for the interpretation of test results is derived from Scanning Electron Microscopy (SEM) images. Finally, based on the experimental observations, a set of empirical formulations are proposed in Section 4, for a reliable and efficient prediction of the compressive mechanical parameters of the tested materials under elevated temperatures.
2. Experiments, Materials and Methods
2.1. Preparation of the Specimens
A total of 126 cubical samples (three for every reading) were prepared for fire and compression testing, by casting them in steel molds (150 mm × 150 mm × 150 mm their size) with the assistance of a vibrator. The samples were removed from the steel molds after 24 h and cured in water for 28 days at room temperature (26–32 °C).
Some standard American Society for Testing and Materials, (ASTM) test procedures were thus followed for evaluating the physical properties of concrete. The amount of ordinary Portland cement (OPC) type I, natural sand, aggregate (19 mm) and water were 335 kg/m3, 871 kg/m3, 1083 kg/m3, and 225 kg/m3 respectively for the concrete cubes. The water to cement ratio was 0.67. The OPC purchased from the local vendor complies with ASTM C150 [34]. The natural sand and aggregate conform to ASTM C33-16 [35]. The specific gravity, absorption, and loose density (kg/m3) of natural sand and aggregate were 2.39 and 2.61, 1% and 0.39%, 2002.4 and 1818.1, respectively. The CBC samples included of rubber fly ash or PET plastic bottle residual or aged brick powder as a replacement for the natural sand in two different proportions, i.e., 10% or 15%. The particle size of the SCMs were less than 1.18 mm for aged brick powder and plastic residual, and 90 µm for rubber fly ash obtained by the sieve analysis.
Table 1 presents, in accordance with [36], some basic mechanical properties for the material components in use.
In this regard, it is worth mentioning that the PET residual was obtained from previous experimental steps (Figure 1) in which bottles were burned for achieving added-value products (grease, useful chemicals) [37]. The COH-RC method includes heating plastics into a close chamber having oxygen but no oxygen supply during the process at different temperatures and directing the exhaust gases into another container filled with water for condensation [37]. The residual in the reactor of Figure 1a was thus converted into the powder before it could be used for the tested CBCs (Figure 1b). The rubber tyre fly ash was then obtained after burning it, while the waste brick powder was used directly as urban residual.
2.2. Fire and Compression Testing
All the specimens were heated in the furnace under 1 h of DF exposure (Figure 2), following—even for limited exposure time only—the general standardized provisions from the ISO 834 document [38]. This resulted in the time–temperature furnace variation that is shown in Figure 3, as well as in a nonuniform temperature distribution on the surface and in the volume of each tested cube. According to Figure 2c, it can be perceived that the lateral faces of each cube are also subject to severe thermal exposure.
The surface temperature of the specimens was measured using an infrared thermocouple, a thermal imaging camera (Testo-868, Universal 16 channel, RS4R5, accuracy: ±2 °C) and some additional K-type thermocouples (chromel/Alumel, range −200 to 1300 °C, accuracy: ±2.2 °C). The temperature increase was recorded on all the faces of the tested cubes. For clarity of presentation, the nonuniform surface temperature was then post-processed to obtain the average temperature at the center of each face. This measure is thus reported in this paper in terms of (see also Figure 2d):
- T1, representing the average temperature in time at the center of the bottom (exposed) face;
- T2, T3, T4, T5, being representative of the four side cube faces;
- and T6, denoting the top face of each cube.
Successively, standard compression tests were used for evaluating the compressive strength of each cube in the post-fire scenario. As a reference, three cubes for each material type and composition were also tested in compression at ambient temperatures and compared after different thermal scenarios. During the compression tests, the imposed loading rate was set in 3 kN/min. The weight loss due to fire exposure was also estimated.
Finally, SEM micrographs were collected for some of the fractured specimens, and used to further explore and determine the reasons of failure, thus supporting the establishment of some structure–property relationships.
2.3. Preliminary Numerical Assessment
At the preliminary stage of the study, some FE numerical simulations were carried out to estimate the potential experimental outcomes. According to literature, FE models can represent an efficient tool for the thermal and coupled thermo-mechanical analysis of various constructional materials under elevated temperatures [2]. The real thermal boundaries, however, can be difficult to match with taken in numerical models, due to the use of several idealized assumptions that do not reflect an experimental setup with its uncertainties. Moreover, these thermal boundaries and their effects are strictly responsible of the mechanical performance for the tested materials, thus represent a first crucial step.
In this paper, for both the investigated concrete and CBC cube samples, a preliminary set of FE analyses was thus carried out in ABAQUS/Standard [33]. The typical FE assembly, as proposed in Figure 4, consisted of 1/4th the nominal geometry of each sample, thus was numerically described in the form of a prismatic volume with total nominal height of 150 mm, and half base × width dimensions (75 mm × 75 mm). The transient “heat transfer” solver approach from ABAQUS/Standard was taken into account, so that the temperature evolution in time could be monitored in the solid elements. In doing so, the basic assumptions were represented by the use of three-dimensional, 8-node solid brick elements (heat transfer DC3D8 type, from ABAQUS library), with a structured mesh pattern (10 mm the size).
The reference cube was hence exposed, on the bottom (T1) surface, to the temperature–time history that was derived from the experimental records (Figure 3). In doing so, the thermal exposure in time from the furnace was lumped on the T1 surface, as in the schematic representation of Figure 4b.
As a first attempt to investigate the thermal behaviour of the tested cubes, besides the intrinsic approximation of this numerical approach [39], nominal thermophysical properties were considered for modelling normal concrete. This numerical choice was intended to predict the temperature distribution and evolution in the specimens, rather than a direct comparison with CBC experimental measurements. As such, the emissivity was set in 0.7, while the heat transfer coefficient for the exposed surface was defined in 25 W/m2K [40,41,42]. For the other surfaces not subjected to DF exposure, the heat transfer coefficient was assumed in 8 W/m2K [40,41,42]. At the same time, the specific heat and the conductivity variation with temperature was preliminary defined by accounting for nominal material properties of standard concrete [40,41,42], given the lack of more refined material characterizations for the cubic specimens object of study. These input data are shown in Figure 5.
3. Results and Discussion
3.1. Experimental Fire Exposure
Figure 6 shows the average time–temperature variation of concrete, CBC with rubber fly ash, CBC with brick powder, and CBC with PET bottle residual, respectively. From Figure 6a, more in detail, the temperature evolution on the cube faces directly exposed or unexposed is emphasized.
Through the experimental investigation, a rather stable fire scenario was observed and measured for most of the specimens. This is confirmed in Figure 6b,c, where the average time–temperature records for different concrete and CBC cube types are proposed at the bottom (T1) or top surface (T6). The exception was represented by PET bottle specimens, with a lower temperature peak for all the reference control points, compared to other specimen types.
Moreover, the experimental setup typically coincided with a severe nonuniform temperature distribution. This can be perceived from Figure 7a–c, where selected thermal images show the temperature variation of CBC cubes under variable exposure time. In particular, it is worth mentioning that the collected experimental measurements generally proved that the maximum and the average temperatures of CBC cubes with PET bottle residuals were typically lower than other types of CBC specimens. This was noticed on all the monitored faces for an identical exposure time. Such an effect may be due to low thermal conductivity of the residuals in use (i.e., Figure 1).
From the numerical analysis of a typical CBC cube, the temperature distribution was found to agree with Figure 7d, where the contour plot of temperatures (external view of 1/4th of cube) is shown after 1 h in DF. From the qualitative comparison of the experimental thermal images and the numerical contour plot in Figure 7d, a partial agreement only for the proposed temperature distributions can be seen. The numerical model, more in detail, lacks unsymmetrical effects due to the idealized thermal exposure of the T1 bottom surface. In addition, the experimental temperature–time history of Figure 2 is used for the FE numerical analyses; moreover, another weak point is represented by the underestimation of thermal effects on the lateral faces of each cube, compared to the experimental specimens. These are the results of the same idealized thermal loading condition for the FE model in Figure 4, and namely neglecting the radiant heating effects on the lateral faces of the specimens. As the temperature distribution is further explored in the volume of the FE model (see the view cuts in Figure 8), it can be also perceived a progressive underestimation of thermal effects for the overall compressive mechanical response of the tested specimens.
In order to further assess the effects of numerical thermal boundaries on the predicted temperature distributions for the tested specimens, as a limit condition, the FE analysis was further repeated by assuming replacing the T1 thermal exposure of Figure 4 with a uniform thermal exposure for the base (T1) but also for the lateral faces of the cube. As such, the T1, and T2-to-T5 surfaces were uniformly subjected to the experimental temperature–time history of Figure 2.
The final result is proposed in Figure 9, where it is possible to notice that such a limit thermal boundary condition still does not march the experimental setup, and thus manifests in a severe overestimation of the expected temperatures in the volume of specimens (with a consequent premature degradation of material properties at elevated temperatures).
3.2. Post-Fire Compressive Resistance
Table 2 and Table 3 give the average compressive strength and residual compressive strength (with negligible standard deviation) after 1 h heating of both concrete and CBC samples (with 10% and 15% the proportion of urban residues) following the ISO 834 under DF. In general, it is recommended by the reference standards that the tested samples should be kept for a long thermal exposure (generally 2–3 h), so that they could be uniformly heated throughout. However, in the present study, the tested samples were kept at 200, 400, 600, and 800 °C for 1 h in the furnace, under the heating rate schematized in Figure 2 and Figure 3. This allows for a comparison between different heating effects, especially in terms of compressive strength of the CBC samples compared to the concrete specimens.
Table 2 reflects that at the ambient temperature (27 °C, thus without heating), the compressive strength of concrete was generally higher than that of the CBCs, which is followed in the order by CBCs with aged brick powder, CBCs with PET bottle residual and CBCs with rubber tire fly ash. Figure 10, accordingly, presents the percentage variation of compressive strength, under different heating exposures, compared to the ambient condition.
The nonuniform fire exposure due to real flame resulted in a significantly higher reduction in compressive strength, compared to the samples exposed to ISO 834 heating, and this outcome was proved for every type of specimens. This difference should be due to higher temperature exposure in certain region nearby bottom face of the samples in case of real flame exposure. Weakening of directly exposed regions to fire caused higher damage due to loss of bounded water and conversion of Ca(OH)2 into CaO. In case of furnace heating of the samples, the duration of high temperature heating is lesser than the real fire exposure. Non uniform stresses and strain resulted due to considerable thermal gradient could be an additional reason for lesser compressive strength in case of real flame heating. It is worth mentioning that the residual compressive strength of concrete and CBC samples are comparatively higher than the standard provisions, due to the shorter exposure duration that is accounted in present work (Figure 10c,d). It is also evident that the residual compressive strength for CBC samples having 15% proportion of urban residues have lower compressive and residual compressive strength for all the types of samples. This can be seen in Figure 11 for 1 h of heating in DF.
Table 3, finally, gives the values of Young’s Modulus MoE for concrete and CBC samples with PET bottle residual at 10% (herein after defined as “CBC-PET10”), as calculated after heating the cubes following ISO 834 or 1 h in DF. According to Figure 12, it is possible to perceive a MoE percentage reduction in the order of 90% and 80% for concrete or CBC-PET10 specimens respectively, after 1 h in DF. The MoE variation with temperature is discussed in more detail in Section 4, with the support and development of reliable empirical models.
3.3. Fracture Behaviour
Figure 13 shows the photographs of samples heated in furnace and real flame. CBCs having PET bottle residual have shown considerably better performance and least weight loss due to fire. For an insight into the reason for this behaviour and establishing a structure–property relationship, the SEM micrographs of fractured samples were studied.
Figure 14 shows the SEM images of sample taken from the region near bottom face of fractured CBC samples having rubber fly ash. The spherical-shaped particles of fly ash can be seen jointly with small and medium size bubbles. The SEM images clearly reflect the microcracks, deformed CH and CSH, and dehydrated CSH phase. The pozzolanic reactivity between the paste and aggregate seems higher at high temperature in these samples [26]. Figure 15 shows the SEM images of fractured CBC with PET bottle residual. Irregular shaped particles of PET residue can be identified in a rather compact matrix and the porous network did not show air bubbles. It is evident from the SEM micrographs that the interface zone is constricted in these specimens. Moreover, the crackless interface between different phases remains. However, microcracks are occasionally visible, but they are considerably lesser and smaller in size than the cracks in CBCs with rubber tire fly ash.
In earlier reported studies, PET waste inclusion resulted in the deterioration of mechanical properties of concrete [27,28,29,30,31]. However, the performance of concrete with PET waste during ISO 834 exposure showed a comparable response but the temperature during heating was higher for CBC with PET waste than the concrete due to porous network formation [32]. The usage of PET residual has resulted in lesser deterioration in compressive strength and residual compressive strength in comparison to PET waste due to ISO 834 heat exposure [32]. Figure 16 shows the SEM images of fractured CBC with brick powder. The compact matrix produced due to the pozzalinic capacity of brick powder is scattered with many medium size air bubbles. Deformed and dehydrated microcracks in the CSH phase are visible. A comparison of the SEM micrographs of three types of CBCs reveals the minimum damage in the microstructure of CBC with PET bottle residual. However, further investigation is required to determine most suitable proportion of the PET bottle residual in concrete. The SEM micrographs establish the reasons of superior residual compressive strength of CBCs with PET but physics and chemistry behind the lesser damage requires further intensive investigation.
4. Experimental Derivation of Empirical Formulations
4.1. Time–Temperature Evolution
In the literature, there are several models for predicting residual compressive strength, see for example [43,44,45,46]. However, the common aspect of most of the cited models is that they have been originally proposed for longer thermal exposure (>1 h), as also recommended by ISO 834 to ensure uniform heating throughout the examined concrete samples. These literature models show, consequently, a comparatively lower residual strength for the tested specimens, due to severity of the heating stage. As far as different thermal boundary conditions are taken into account, their validity is questionable.
In this regard, Figure 17a,b shows the empirical model for time–temperature (max.) prediction during real flame heating for concrete and CBC with 10% PET residual specimens, respectively. Equations (1)–(3) represent the best fitting curves for experimental data. These equations are derived using a commercially available mathematical tool (LAB Fit Curve Fitting Software, www.labfit.net) that allows an enhanced match with input data to be captured due to its extended library. The empirical variation of temperature in time is obtained from the average of the collected experimental measurements, where the fitting curves are respectively proposed as:
with T in °C and t in minutes.
4.2. Residual Compressive Strength and MoE
Among the available CBC specimens, the CBC-PET10 samples were found to have the maximum residual strength, and thus were further assessed in their mechanical properties with respect to the concrete specimens. The attention was focused on both the residual compressive strength and the corresponding MoE.
Figure 18a,b, in this regard, show the empirical models for predicting the residual compressive strength of concrete and CBC-PET10, after 1 h of thermal exposure. These models are valid for temperature range and exposure time investigated in the present work. Any intermediate value can be predicted efficiently with these models for concrete and CBC-PET10.
The model established in the present work, in this regard, effectively predicts the residual compressive strength for heating up to one hour. Figure 18 reflects that the models are a good match to the available experimental data.
with f(t) in MPa and t in minutes.
Figure 19a,b give the empirical models for the MoE variation, for concrete and CBC-PET10 specimens in ISO 834 heating. The developed models are in line with the experimental data for concrete and CBC-PET10.
with MoE in GPa and t in minutes.
4.3. Compressive Stress–Strain Constitutive Laws at Elevated Temperatures
In the literature, several empirical models are available for predicting the stress–stain behaviour of concrete at an elevated temperature, both in tension and compression [43,44,45,46,47]. However, most of them are valid for specific design applications, or for particular composition of concrete constituents. Finally, their common aspect is that all those models are calibrated and validated for longer heating duration for concrete, as described in ISO 834.
In the present work, the established compressive stress–stain relations are thus modified and adapted both to concrete and CBC-PET10 specimens for 1-h of ISO 834 heating. Among the available literature models, the basic empirical equations are derived and further adapted to the examined specimens.
In the proposed Equations (4)–(7), more in detail, for a given temperature T (in °C) the following parameters are introduced:
- represents the compressive stress at elevated temperature (in MPa),
- is the compressive strength at elevated temperature (in MPa),
- and the strain at ambient temperature or under elevated temperature, respectively, and
- is the compressive strength at ambient temperature (in MPa).
The result takes the form of an empirical model in which fcT can be expressed as:
where:
and:
with Eci the MoE.
Figure 20 shows the stress–strain diagram for concrete at elevated temperature. The diagram is in line with the collected experimental values of compressive strength and modulus of elasticity, at different temperatures.
Further, the stress–strain relations for CBC-PET10 at elevated temperature (1 h heating in DF) are given in Equations (7) and (8), where:
and:
Figure 21 shows the stress–strain curve for CBC-PET10 at elevated temperature heated for one hour, following ISO 834.
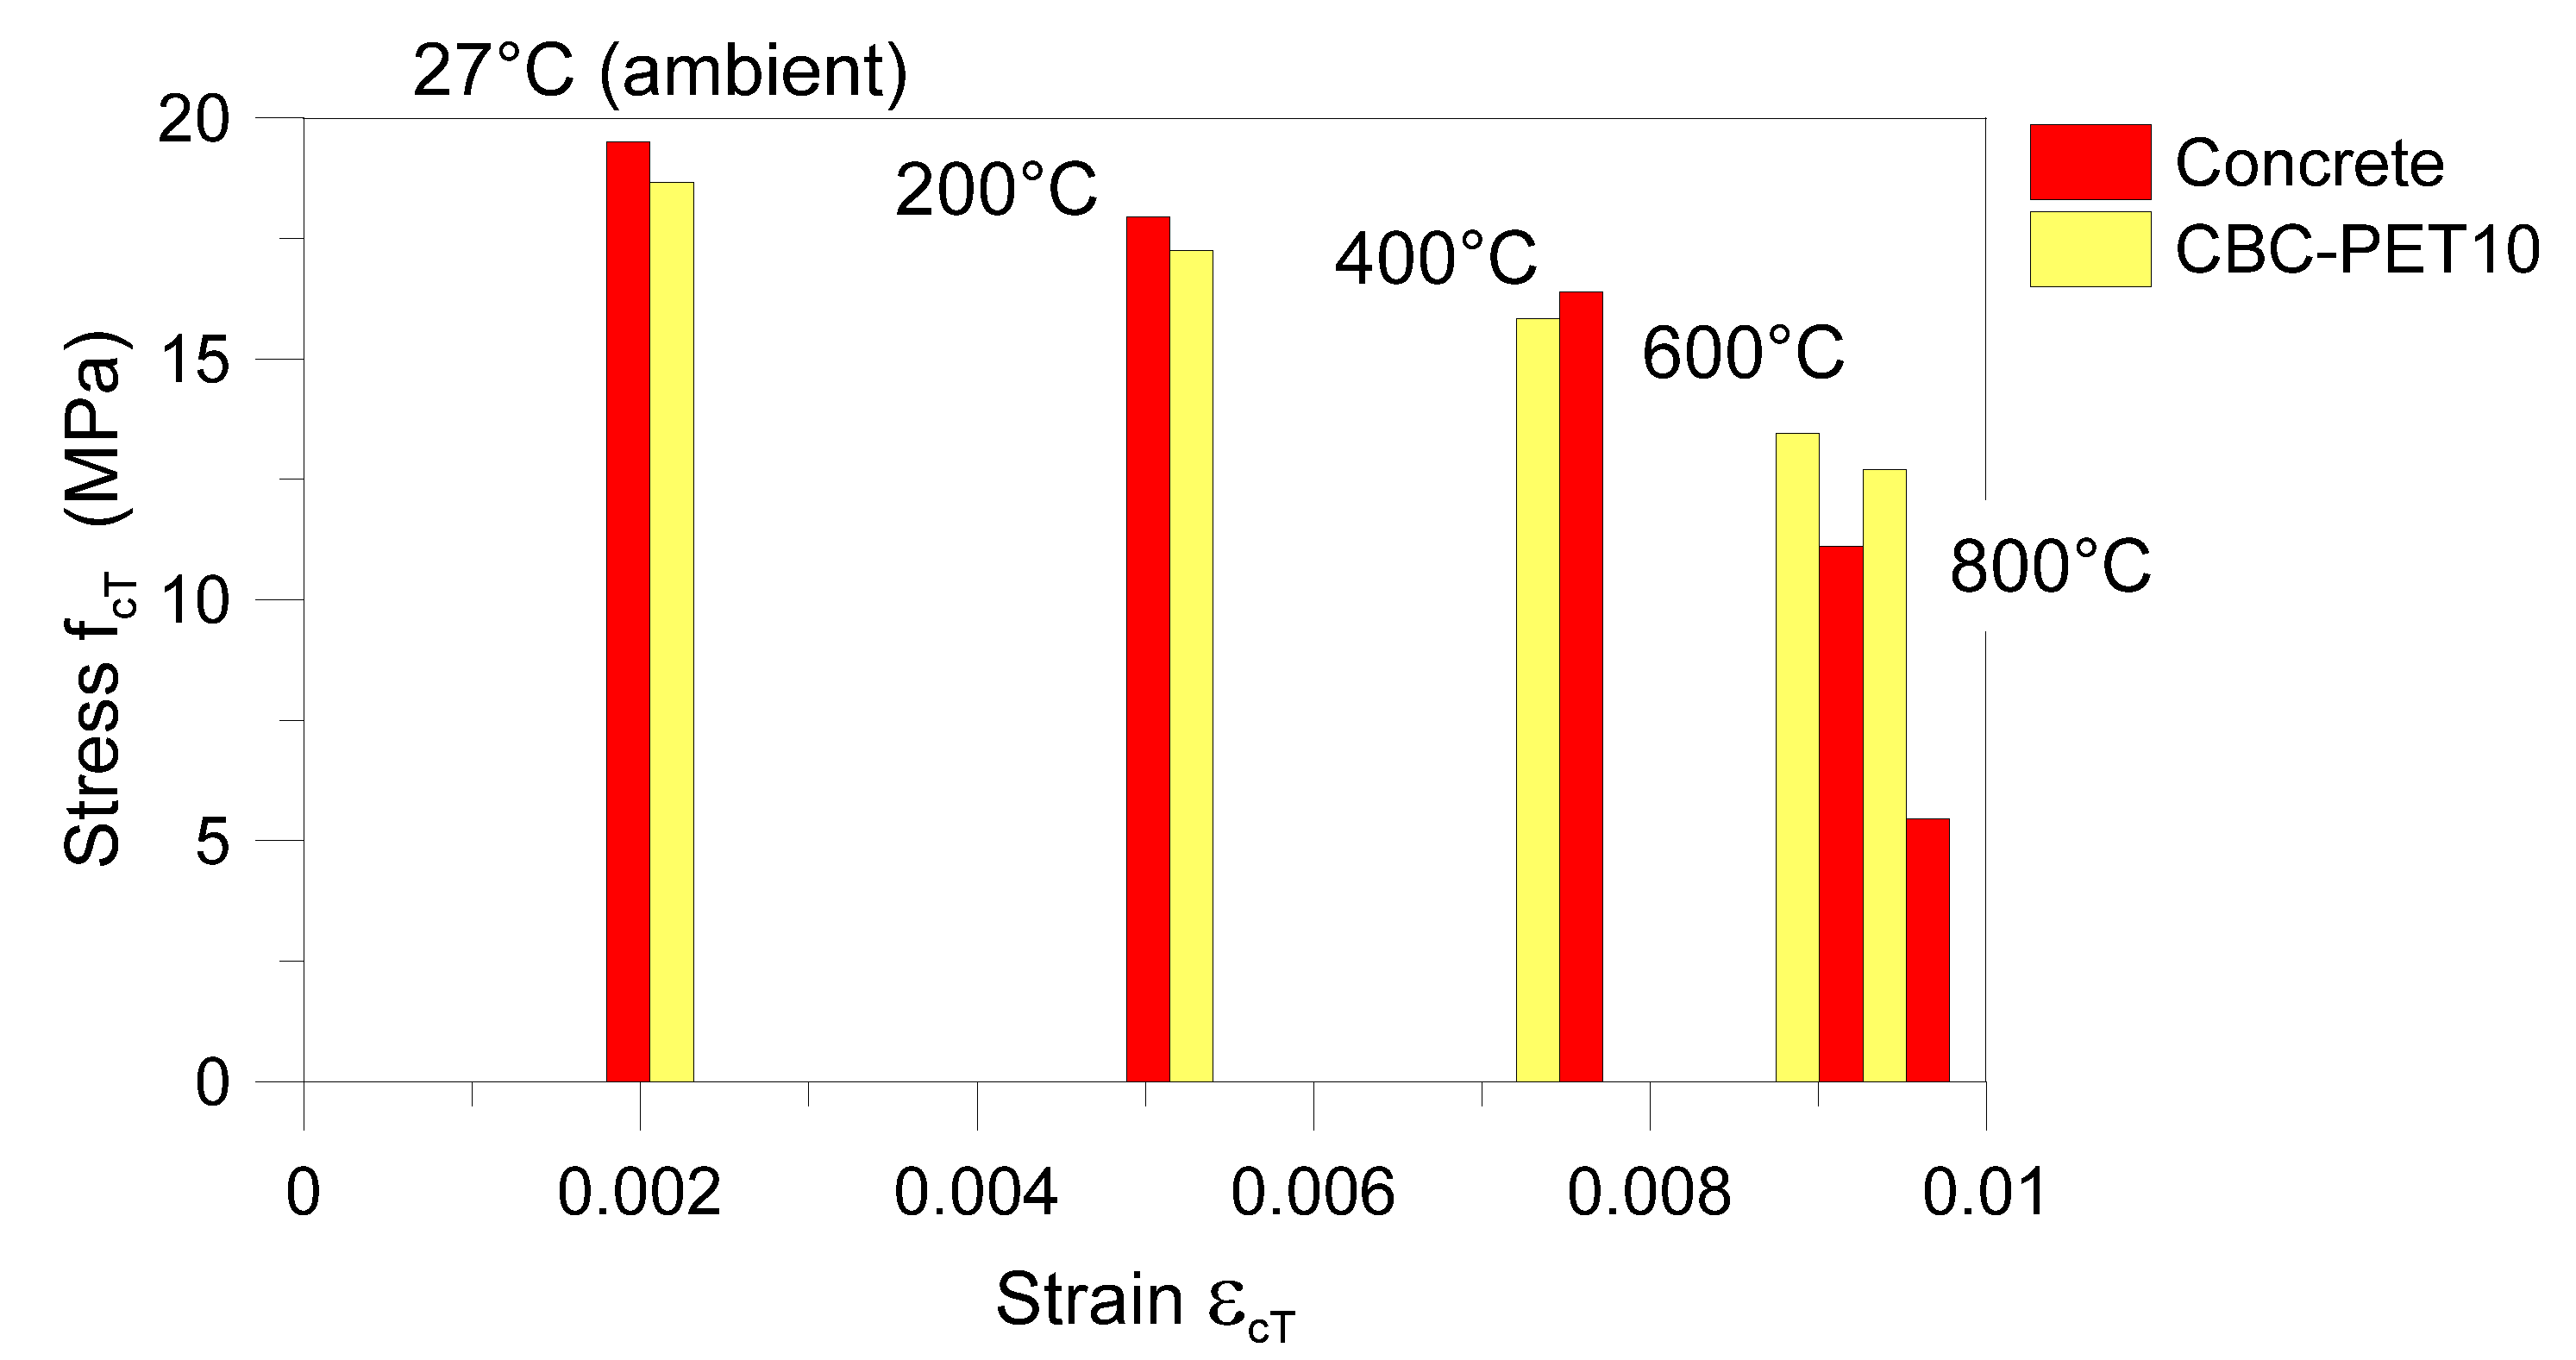
Finally, Figure 22 presents the stress–strain peaks from the experimental/empirical constitutive laws of concrete or CBC-PET10 cubes under various thermal scenarios. Again, it is possible to perceive an improve post-fire residual performance of CBC specimens, compared to standard concrete cubes, thus suggesting their potential for safe fire design purposes.
5. Conclusions
The present work reported on the effects of fire on the residual compressive strength of concrete and other sustainable alternatives of concrete, made of by-products urban residuals. The performance of concrete and cement-based composites (CBCs) was investigated during nonuniform direct flame and standard ISO 834 fire exposure. The thermal experimental findings were then further explored with the support of Finite Element (FE) investigations. Following are the significant conclusions of this work,
- Among the examined concrete or CBCs sustainable solutions, CBCs with PET bottle residual (10% proportion) offered the lowest peak temperature compared to the other specimen types under similar heating conditions.
- The FE model developed for predicting the time–temperature variation on the exposed faces and in the volume of the tested cubes further confirmed the critical role of input thermal loads but also of the thermal boundaries. It was shown in particular that the actual experimental thermal scenario for the testes specimens can be hardly predicted with refined FE methods. As such, the post-fire mechanical response of the tested cubes necessarily requires the support of dedicated experiments.
- The CBCs specimens with PET bottle residual (10% proportion) were observed to have considerable lesser reduction in their modulus of elasticity, in comparison to standard concrete samples, thus resulting in improved post-fire capacity.
- The concrete and CBC samples damaged more while subjected to nonuniform fire exposure for the same fire duration.
- Concrete has superior compressive strength compared to the CBCs with rubber tire fly ash, PET bottle residual, and brick powder investigated in the present work.
- CBCs with PET bottle residual showed superior performance followed by CBCs with rubber tire fly ash, concrete and CBCs with aged brick powder respectively.
- The SEM micrographs have shown minimum damage in the microstructure of CBC with PET bottle residual.
- Empirical models for predicting time–temperature, modulus of elasticity, compressive strength, and stress–strain constitutive laws at elevated temperatures were proposed.
Author Contributions
Conceptualization, A.V. and G.B.; methodology, A.V.; software, A.V. and C.B.; validation, A.V.; formal analysis, A.V. investigation, A.V.; resources, A.V. and G.B.; data curation, A.V. and C.B.; writing—original draft preparation, A.V.; writing—review and editing, C.B. and G.B.; visualization, A.V.; project administration, A.V. and G.B.; funding acquisition, A.V. All authors have read and agreed to the published version of the manuscript.
Funding
This project has received funding from the European Union’s Horizon 2020 research and innovation programme under the Marie Skłodowska-Curie grant agreement No 754382, GOT ENERGY TALENT. The content of this article does not reflect the official opinion of the European Union. Responsibility for the information and views expressed herein lies entirely with the author(s).
Conflicts of Interest
The authors declare no conflict of interest.
Nomenclature
| compressive strength at ambient temperature | |
| compressive stress at elevated temperature | |
| compressive strength at elevated temperature | |
| strain at ambient temperature | |
| strain at elevated temperature | |
| ASTM | American Society for Testing and Materials |
| Ca(OH)2 | Calcium hydroxide |
| CaO | Calcium oxide |
| CBC | Cement-Based Composites |
| CSH | calcium silicate hydrate |
| DF | Direct Flame |
| Ec | Young’s Modulus |
| FE | Finite Element |
| ISO | International Organization for Standardization |
| MoE | modulus of elasticity |
| OPC | Ordinary Portland cement |
| PET | Polyethylene terephthalate |
| SCM | supplementary cementitious materials |
| SEM | Scanning Electron Microscopy |
References
- NFPA. Deadliest Fires and Explosions in U.S. History, National Fire Protection Association, Batterymarch Park, Quincy, Massachusetts, USA. 2020. Available online: https://www.nfpa.org/News-and-Research/Data-research-and-tools/US-Fire-Problem/Catastrophic-multiple-death-fires/Deadliest-fires-or-explosions-in-the-world (accessed on 1 October 2020).
- Vedrtnam, A.; Bedon, C.; Youssef, M.A.; Wamiq, M.; Sabsabi, A.; Chaturvedi, S. Experimental and Numerical Structural Assessment of Transparent and Tinted Glass during Fire Exposure. Constr. Build. Mater. 2020, 250, 118918. [Google Scholar] [CrossRef]
- Wang, Y.; Wang, Q.; Wen, J.X.; Sun, J.; Liew, K.M. Investigation of thermal breakage and heat transfer in single, insulated and laminated glazing under fire conditions. Appl. Therm. Eng. 2017, 125, 662–672. [Google Scholar] [CrossRef]
- Zhou, H.; Li, S.; Chen, L.; Zhang, C. Fire tests on composite steel-concrete beams pre-stressed with external tendons. J. Constr. Steel Res. 2018, 143, 62–71. [Google Scholar] [CrossRef]
- Fan, M.; Naught, A.; Bregulla, J. Fire performance of natural fiber Composites in construction. Constr. Build. Mater. 2004, 18, 505–515. [Google Scholar]
- Yalinkilic, M.K.; Baysal, E.; Demirci, Z. Role of treatment chemicals in combustion of Douglas fir wood. In Proceedings of the First Trabzon International Energy and Environment Symposium, Trabzon, Turkey, 29–31 July 1996; pp. 803–809. [Google Scholar]
- Wróblewska, J.; Kowalski, R. Assessing concrete strength in fire-damaged structures. Constr. Build. Mater. 2020, 254, 119122. [Google Scholar]
- Haddad, R.H.; Al-Saleh, R.J.; Al-Akhras, N.M. Effect of elevated temperature on bond between steel reinforcement and fiber reinforced concrete. Fire Saf. J. 2008, 43, 334–343. [Google Scholar] [CrossRef]
- Abid, M.; Hou, X.; Zheng, W.; Hussain, R.R. High temperature and residual properties of reactive powder concrete—A review. Constr. Build. Mater. 2017, 147, 339–351. [Google Scholar] [CrossRef]
- Anand, N.; Godwin, A. Influence of mineral admixtures on mechanical properties of self-compacting concrete under elevated temperature. Fire Mater. 2016, 7, 940–958. [Google Scholar]
- Li, M.; Qian, C.; Sun, W. Mechanical properties of high-strength concrete after fire. Cem. Concr. Res. 2004, 34, 1001–1005. [Google Scholar] [CrossRef]
- Ma, Q.; Guo, R.; Zhao, Z.; Lin, Z.; He, K. Mechanical properties of concrete at high temperature—A review. Constr. Build. Mater. 2015, 93, 371–383. [Google Scholar] [CrossRef]
- Chu, H.Y.; Jiang, J.Y.; Sun, W.; Zhang, M. Mechanical and physicochemical properties of ferro-siliceous concrete subjected to elevated temperatures. Constr. Build. Mater. 2016, 122, 743–752. [Google Scholar] [CrossRef] [Green Version]
- Shah, A.H.; Sharma, U.K. Fire resistance and spalling performance of confined concrete columns. Constr. Build. Mater. 2017, 156, 161–174. [Google Scholar] [CrossRef]
- Thanaraj, D.P.; Anand, N.G.P.A.; Zalok, E. Post-fire damage assessment and capacity based modeling of concrete exposed to elevated temperature. Int. J. Damage Mech. 2019. [Google Scholar] [CrossRef]
- Xiao, J.; Li, Z.; Xie, Q.; Shen, L. Effect of strain rate on compressive behaviour of high-strength concrete after exposure to elevated temperatures. Fire Saf. J. 2016, 83, 25–37. [Google Scholar] [CrossRef]
- Lin, W.M.; Lin, T.D.; Powers-Couche, L.J. Microstructures of fire-damaged concrete. Mater. J. 1996, 93, 199–205. [Google Scholar]
- Buchanan, A.H. Structural Design for Fire Safety, 2nd ed.; Wiley Publishers: Chichester, UK, 2001. [Google Scholar]
- Savva, A.; Manita, P.; Sideris, K.K. Influence of elevated temperatures on the mechanical properties of blended cement concretes prepared with limestone and siliceous aggregates. Cem. Concr. Compos. 2005, 27, 239–248. [Google Scholar] [CrossRef]
- Cree, D.; Green, M.; Noumowe, A. Residual strength of concrete containing recycled materials after exposure to fire. Constr. Build. Mater. 2013, 45, 208–223. [Google Scholar] [CrossRef]
- Irshidat, M.R.; Al-Saleh, M.H. Thermal performance and fire resistance of nanoclay modified cementations materials. Constr. Build. Mater. 2018, 159, 213–219. [Google Scholar] [CrossRef]
- Wasserman, R.; Bentur, A. Effect of lightweight fly ash aggregate microstructure on the strength of concretes. Cem. Concr. Res. 1997, 27, 525–537. [Google Scholar] [CrossRef]
- Saikia, N.; de Brito, J. Mechanical properties and abrasion behaviour of concrete containing shredded PET bottle waste as a partial substitution of natural aggregates. Constr. Build. Mater. 2014, 52, 236–244. [Google Scholar] [CrossRef]
- Ferreira, L.; de Brito, J.; Saikia, N. Influence of curing conditions on the mechanical performance of concrete containing recycled plastic aggregate. Constr. Build. Mater. 2012, 36, 196–204. [Google Scholar] [CrossRef]
- Albano, C.; Camacho, N.; Hernández, M.; Matheus, A.; Gutiérrez, A. Influence of content and particle size of waste pet bottles on concrete behavior at different w/c ratios. Waste Manag. 2009, 29, 2707–2716. [Google Scholar] [CrossRef] [PubMed]
- Saikia, N.; de Brito, J. Use of plastic waste as aggregate in cement mortar and concrete preparation: A review. Constr. Build. Mater. 2012, 34, 385–401. [Google Scholar] [CrossRef]
- Choi, Y.W.; Moon, D.J.; Chung, J.S.; Cho, S.K. Effects of waste PET bottles aggregate on the properties of concrete. Cem. Concr. Res. 2005, 35, 776–781. [Google Scholar] [CrossRef]
- Correia, J.R.; Lima, J.S.; de Brito, J. Post-fire mechanical performance of concrete made with selected plastic waste aggregates. Cem. Concr. Compos. 2014, 53, 187–199. [Google Scholar] [CrossRef]
- Memon, S.A.; Shah SF, A.; Khushnood, R.A.; Baloch, W.L. Durability of sustainable concrete subjected to elevated temperature—A review. Constr. Build. Mater. 2019, 199, 435–455. [Google Scholar] [CrossRef]
- Bodnarova, L.; Valek, J.; Novosad, P. Testing of Action of Direct Flame on Concrete. Sci. World J. 2015, 1–8. [Google Scholar] [CrossRef]
- El-Fitiany, S.F.; Youssef, M.A. Interaction diagrams for fire-exposed reinforced concrete sections. Eng. Struct. 2014, 70, 246–259. [Google Scholar] [CrossRef]
- El-Fitiany, S.F.; Youssef, M.A. Assessing the flexural and axial behaviour of reinforced concrete members at elevated temperatures using sectional analysis. Fire Saf. J. 2009, 44, 691–703. [Google Scholar] [CrossRef]
- Simulia. ABAQUS/Standard Computer Software; Dassault SystèmesProvidence: Johnston, RI, USA, 1998. [Google Scholar]
- ASTM C150. Standard Specification for Portland Cement, ASTM International; ASTM: West Conshohocken, PA, USA, 2020. [Google Scholar]
- ASTM C33-16. Standard Specification for Concrete Aggregates; ASTM International: West Conshohocken, PA, USA, 2016. [Google Scholar]
- Zhang, X.; Deng, D.; Yang, J. Mechanical Properties and Conversion Relations of Strength Indexes for Stone/Sand-Lightweight Aggregate Concrete. Adv. Mater. Sci. Eng. 2018. [Google Scholar] [CrossRef] [Green Version]
- Amman, M. Study on Foam Production from Waste PET Bottles. Master’s Thesis, Invertis University, Rajau Paraspur, India, 2020. [Google Scholar]
- ISO 834-1:1999. Fire-Resistance Tests—Elements of Building Construction—Part 1: General Requirements; International Organization for Standardization (ISO): Geneve, Switzerland, 1999. [Google Scholar]
- Achenbach, M.; Lahmer, T.; Morgenthal, G. Identification of the thermal properties of concrete for the temperature calculation of concrete slabs and columns subjected to a standard fire—Methodology and proposal for simplified formulations. Fire Saf. J. 2017, 87, 80–86. [Google Scholar] [CrossRef]
- EN 1991-1-2: Actions on Structures. In Part 1–2: General Actions—Actions on Structures Exposed to Fire, Eurocode 1; European Committee for Standardization: Brussels, Belgium, 2002.
- EN, 1992-1-2: Design of Concrete Structures. In Part 1–2: General Rules—Structural Fire Design; Eurocode 2; European Committee for Standardization: Brussels, Belgium, 2004.
- Kodur, V. Properties of Concrete at Elevated Temperatures. Int. Sch. Res. Not. 2014, 2014, 468510. [Google Scholar] [CrossRef]
- Youssef, M.A.; Moftah, M. General stress–strain relationship for concrete at elevated temperatures. Eng. Struct. 2007, 29, 2618–2634. [Google Scholar] [CrossRef]
- Li, L.; Purkiss, J.A. Stress–strain constitutive equations of concrete material at elevated temperatures. Fire Saf. J. 2005, 40, 669–686. [Google Scholar] [CrossRef]
- Liu, D.; He, M.; Cai, M. A damage model for modeling the complete stress–strain relations of brittle rocks under uniaxial compression. Int. J. Damage Mech. 2018, 27, 1000–1019. [Google Scholar] [CrossRef]
- Liu, Y.; Wang, W.; Chen, Y.F.; Ji, H. Residual stress-strain relationship for thermal insulation concrete with recycled aggregate after high temperature exposure. Constr. Build. Mater. 2016, 129, 37–47. [Google Scholar] [CrossRef]
- Abed, M.; de Brito, J. Evaluation of high-performance self-compacting concrete using alternative materials and exposed to elevated temperatures by non-destructive testing. J. Build. Eng. 2020, 32, 101720. [Google Scholar] [CrossRef]
Figure 1.
Production process for the PET bottle residual following constrained oxygen heating and residual condensation Method [37]: (a) waste plastic treatment reactor and (b) PET (EC number: 607-507-1) bottle residual before crushing.
Figure 1.
Production process for the PET bottle residual following constrained oxygen heating and residual condensation Method [37]: (a) waste plastic treatment reactor and (b) PET (EC number: 607-507-1) bottle residual before crushing.

Figure 2.
Selected photographs of fire testing for the CBC specimens: (a) furnace view; (b) setup and (c) heating stage, with (d) thermal loading scheme.
Figure 2.
Selected photographs of fire testing for the CBC specimens: (a) furnace view; (b) setup and (c) heating stage, with (d) thermal loading scheme.

Figure 3.
Experimentally measured time–temperature history in the furnace (1 h in DF) and corresponding standard ISO 834 fire curve.
Figure 3.
Experimentally measured time–temperature history in the furnace (1 h in DF) and corresponding standard ISO 834 fire curve.

Figure 4.
Reference numerical model for the analysis of thermal distribution in concrete or CBC cube samples under direct flame exposure (ABAQUS/Standard): (a) global assembly and (b) local setup (with evidence of the thermally exposed T1 bottom face).
Figure 4.
Reference numerical model for the analysis of thermal distribution in concrete or CBC cube samples under direct flame exposure (ABAQUS/Standard): (a) global assembly and (b) local setup (with evidence of the thermally exposed T1 bottom face).

Figure 5.
Reference input properties for the thermal numerical model: (a) specific heat and (b) conductivity variation with elevated temperature. Figures reproduced with permission from [42], under the rules of the Creative Commons Attribution License.
Figure 5.
Reference input properties for the thermal numerical model: (a) specific heat and (b) conductivity variation with elevated temperature. Figures reproduced with permission from [42], under the rules of the Creative Commons Attribution License.
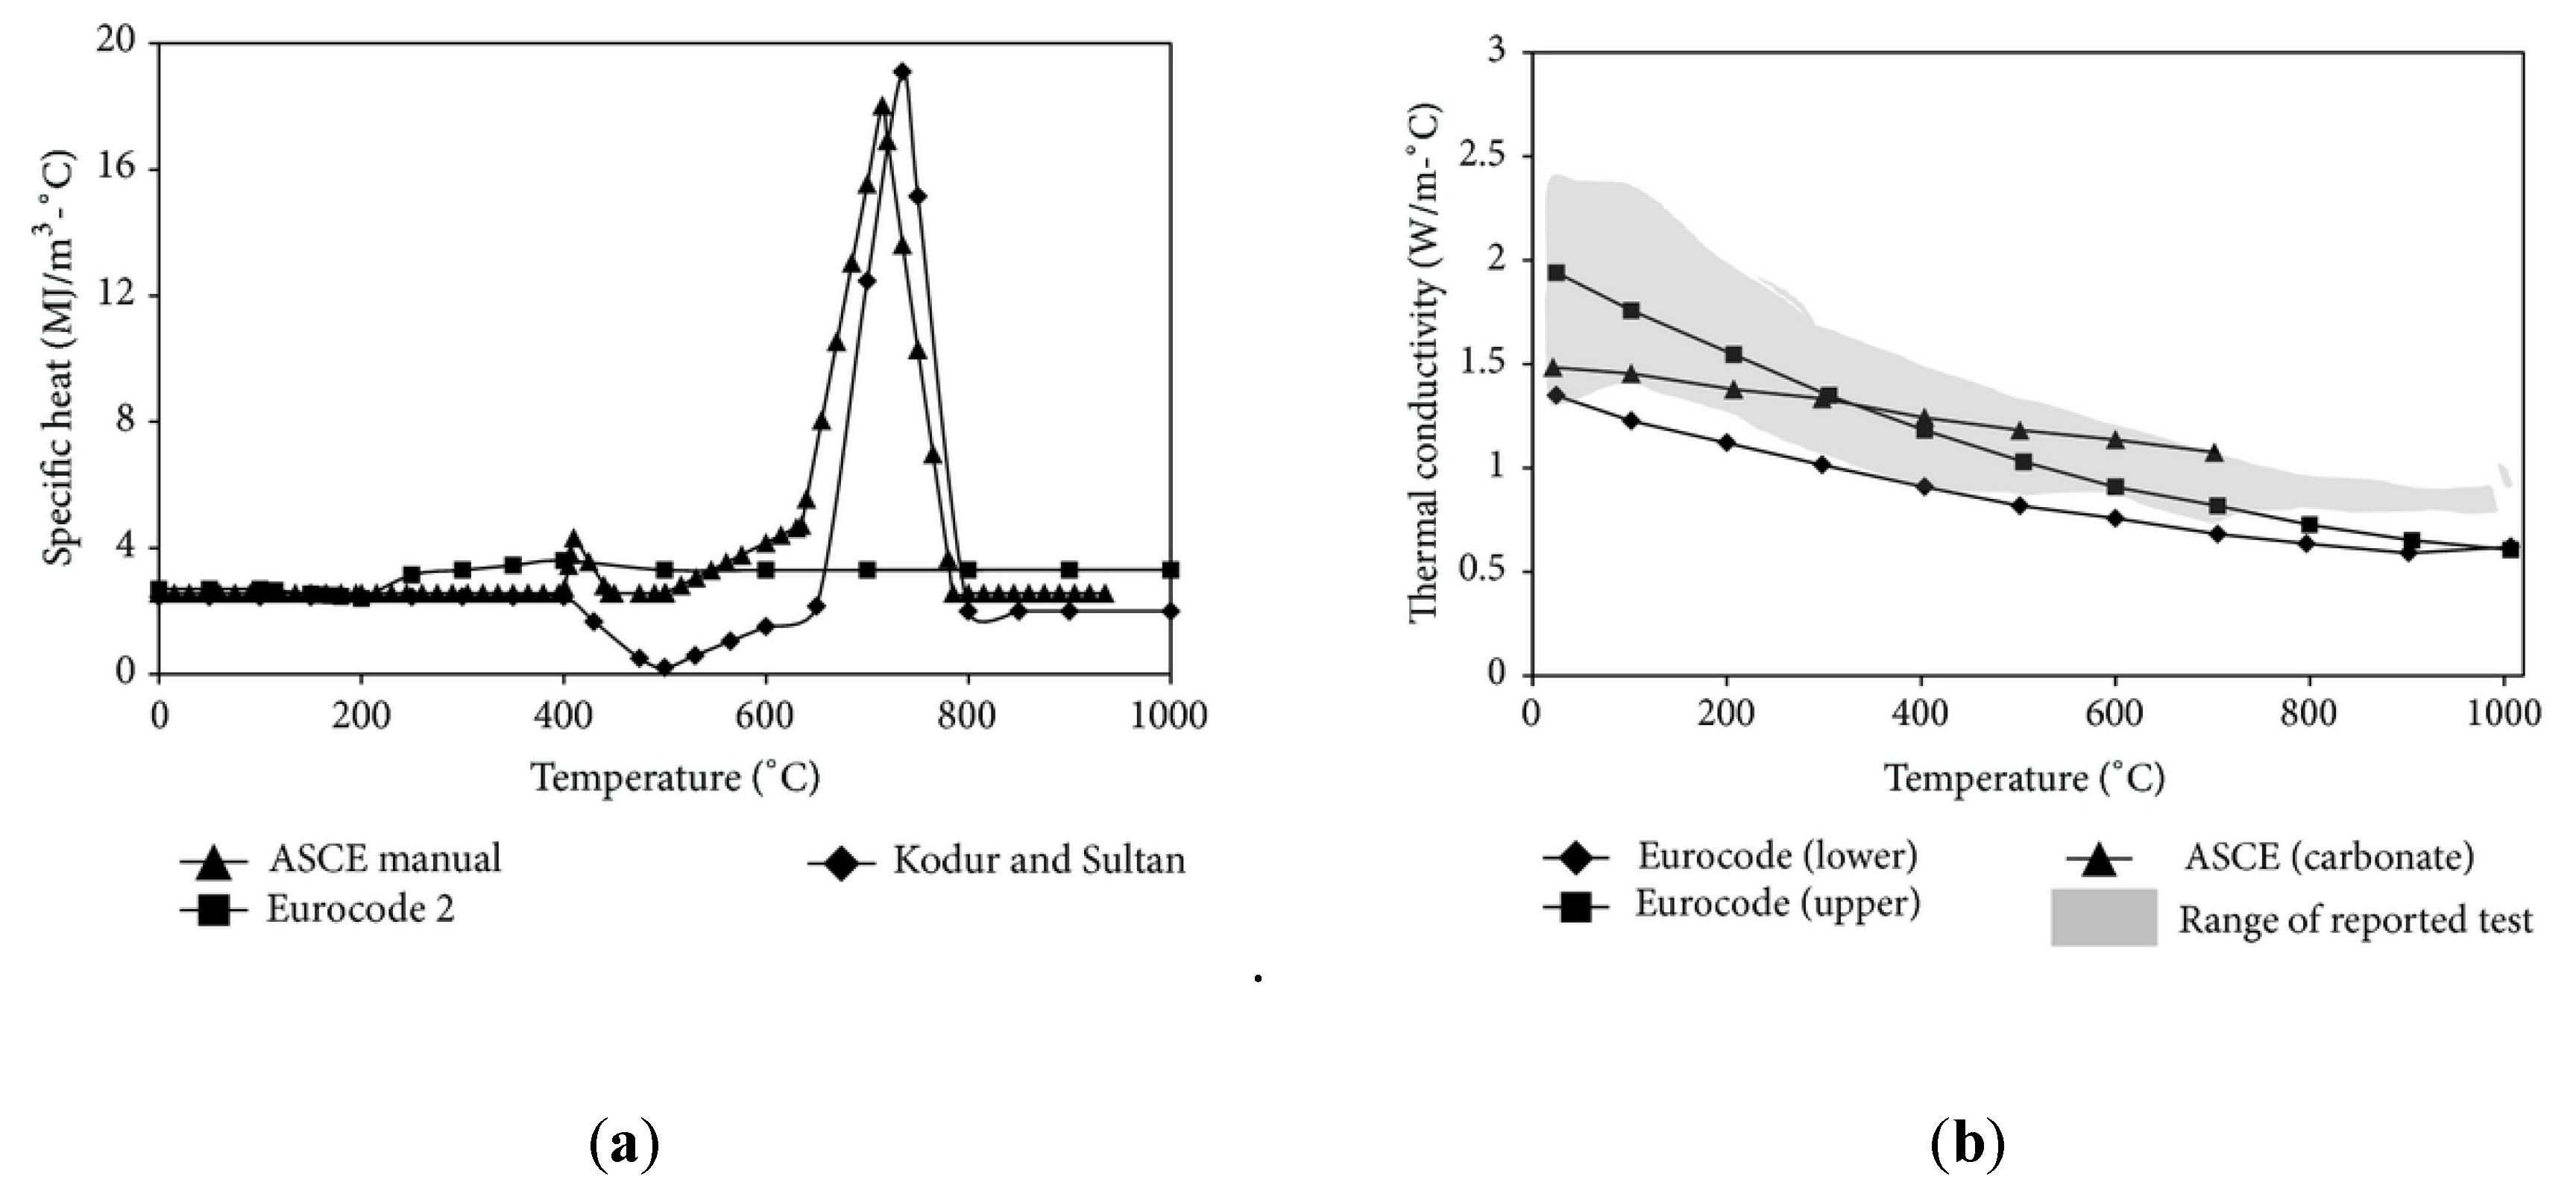
Figure 6.
Average time–temperature histories on different faces of the cubic volume for the tested specimens: (a) standard concrete, and (b) T1 bottom surface or (c) T6 top surface for all the specimens.
Figure 6.
Average time–temperature histories on different faces of the cubic volume for the tested specimens: (a) standard concrete, and (b) T1 bottom surface or (c) T6 top surface for all the specimens.
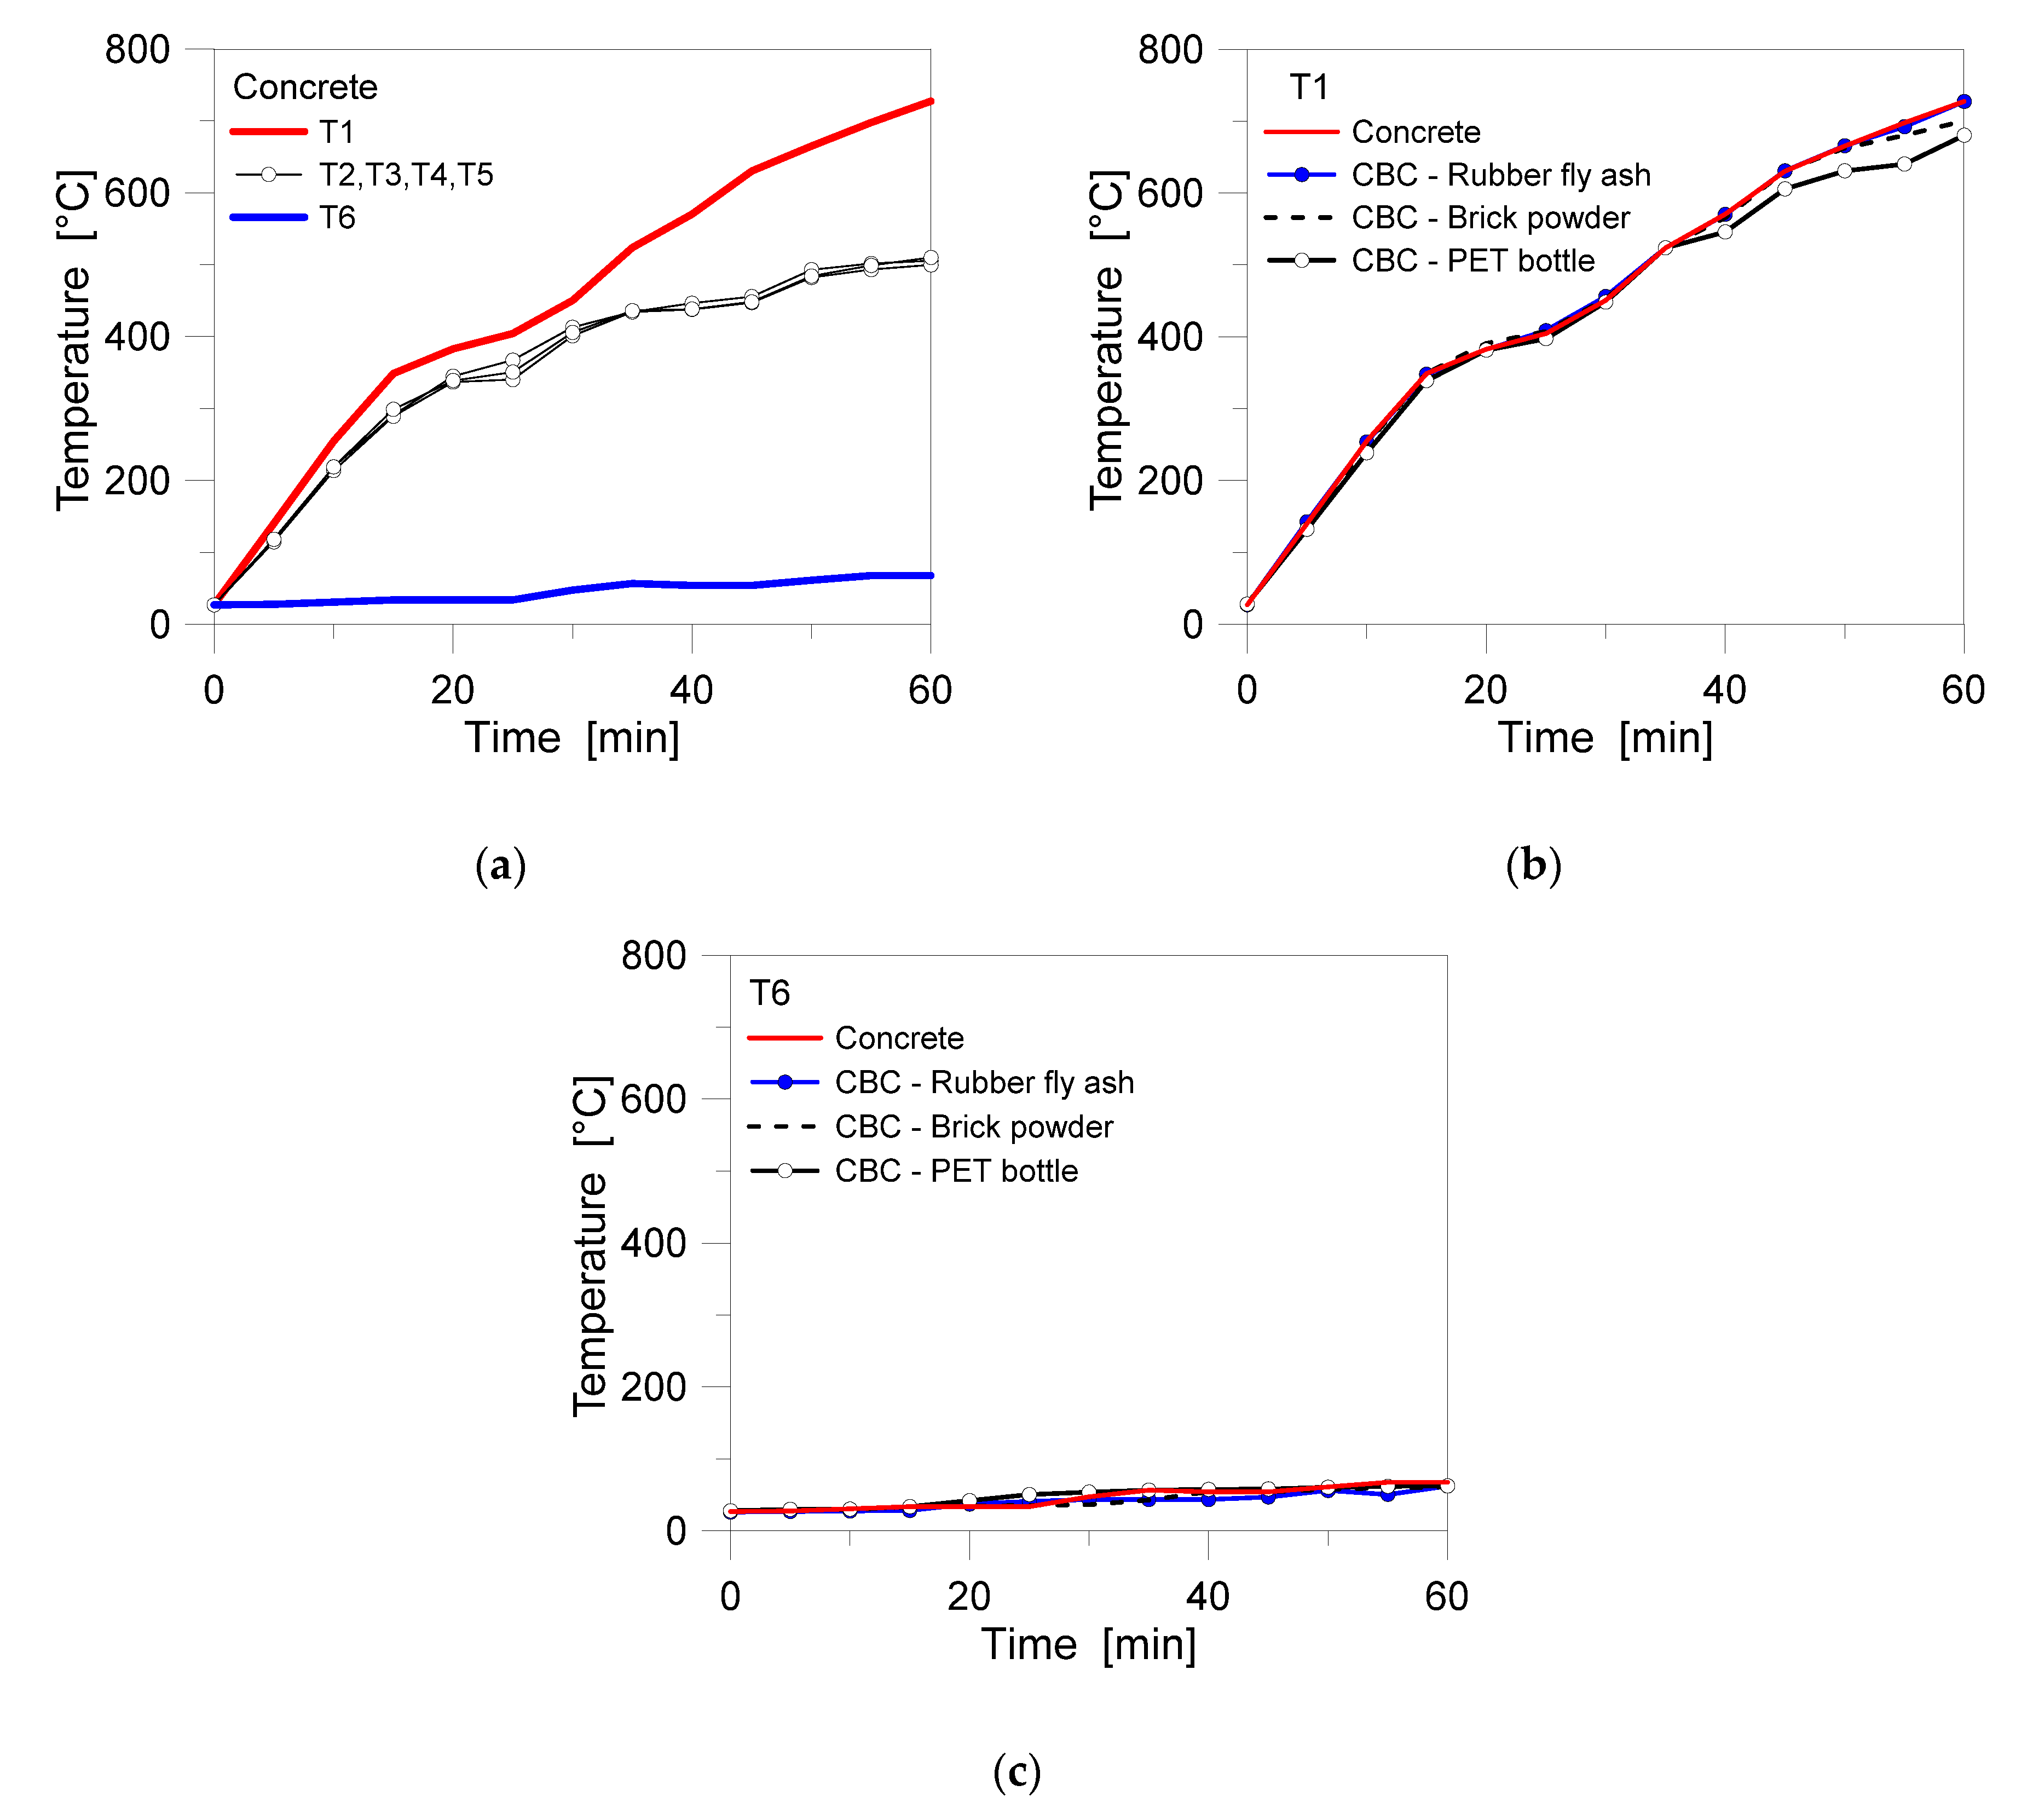
Figure 7.
Temperature variation of CBC cubes under DF (T1 bottom surface): experimental results after (a) 20 min, (b) 30 min or (c) 40 min of heating and (d) corresponding numerical contour plot for a nominal concrete cube (1/4th of the cube, ABAQUS/Standard, external view of the cube). Temperature values in °C.
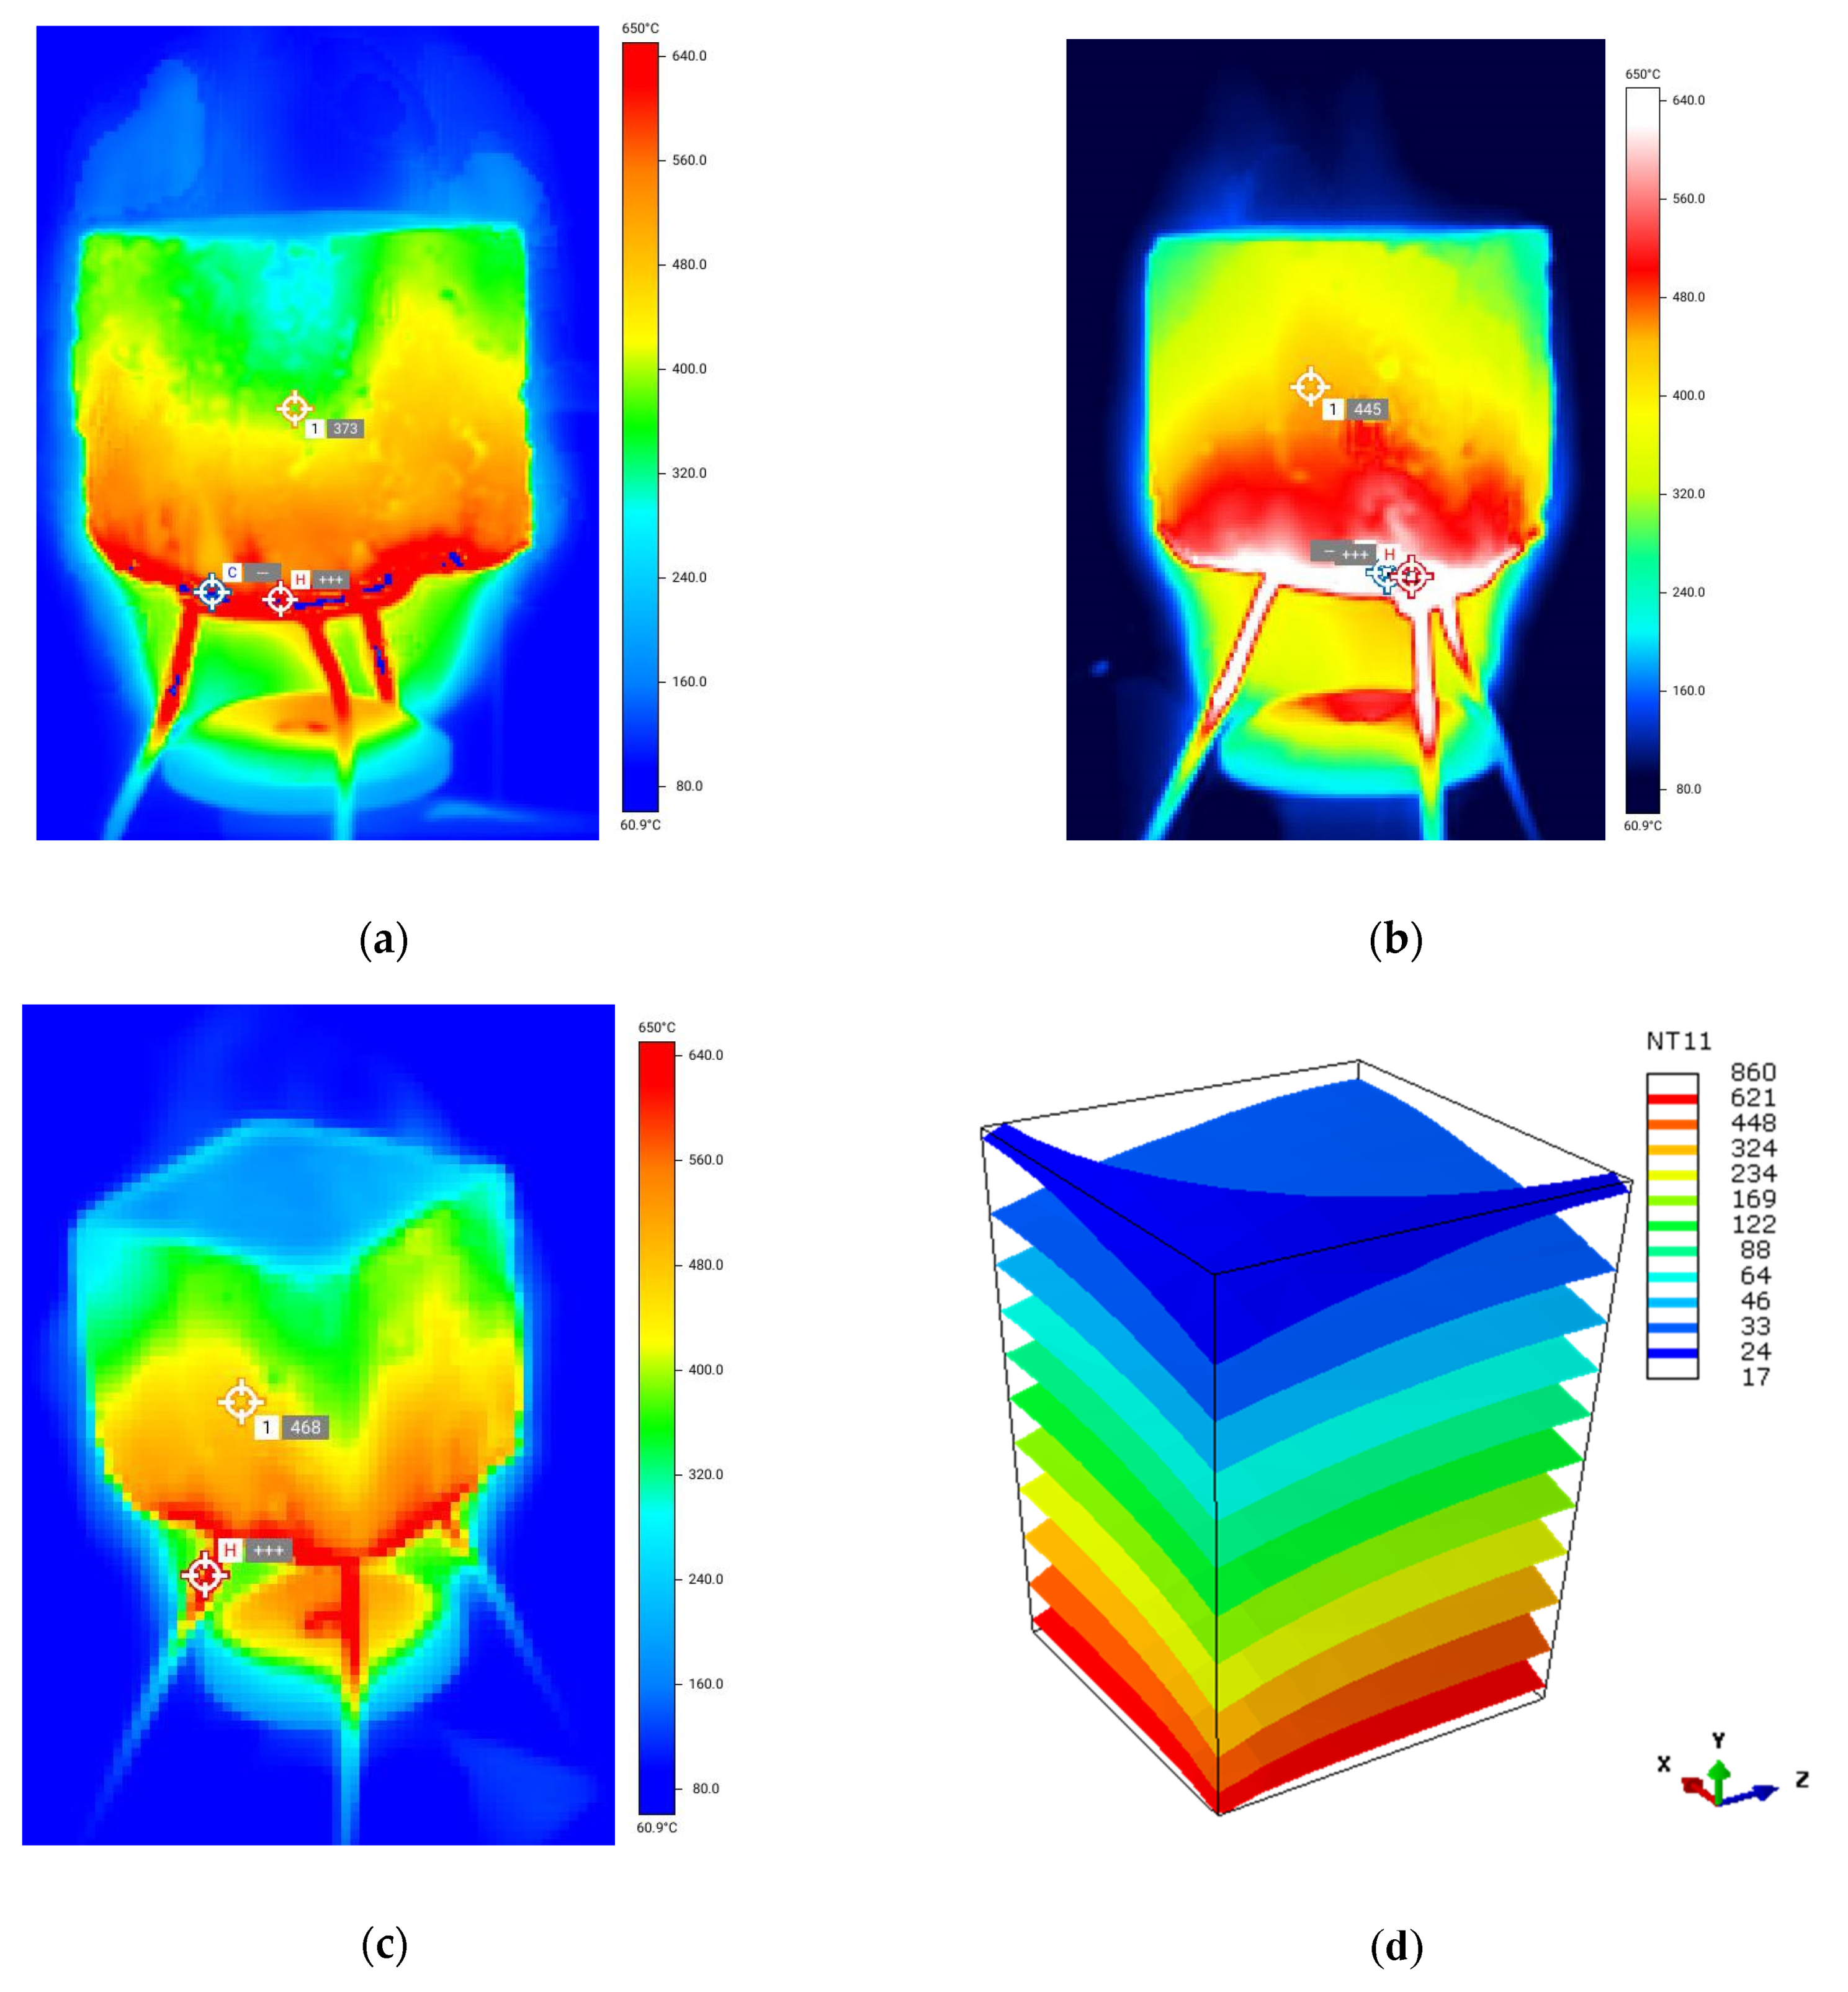
Figure 8.
Temperature variation for concrete cubes under 1 h in DF (ABAQUS/Standard), with evidence of section cuts in the height of specimens: (a) 25 mm, (b) 50 mm, (c) 75 mm, (d) 100 mm and (e) 125 mm. Temperature values in °C. T1 bottom surface under uniform thermal exposure.
Figure 8.
Temperature variation for concrete cubes under 1 h in DF (ABAQUS/Standard), with evidence of section cuts in the height of specimens: (a) 25 mm, (b) 50 mm, (c) 75 mm, (d) 100 mm and (e) 125 mm. Temperature values in °C. T1 bottom surface under uniform thermal exposure.
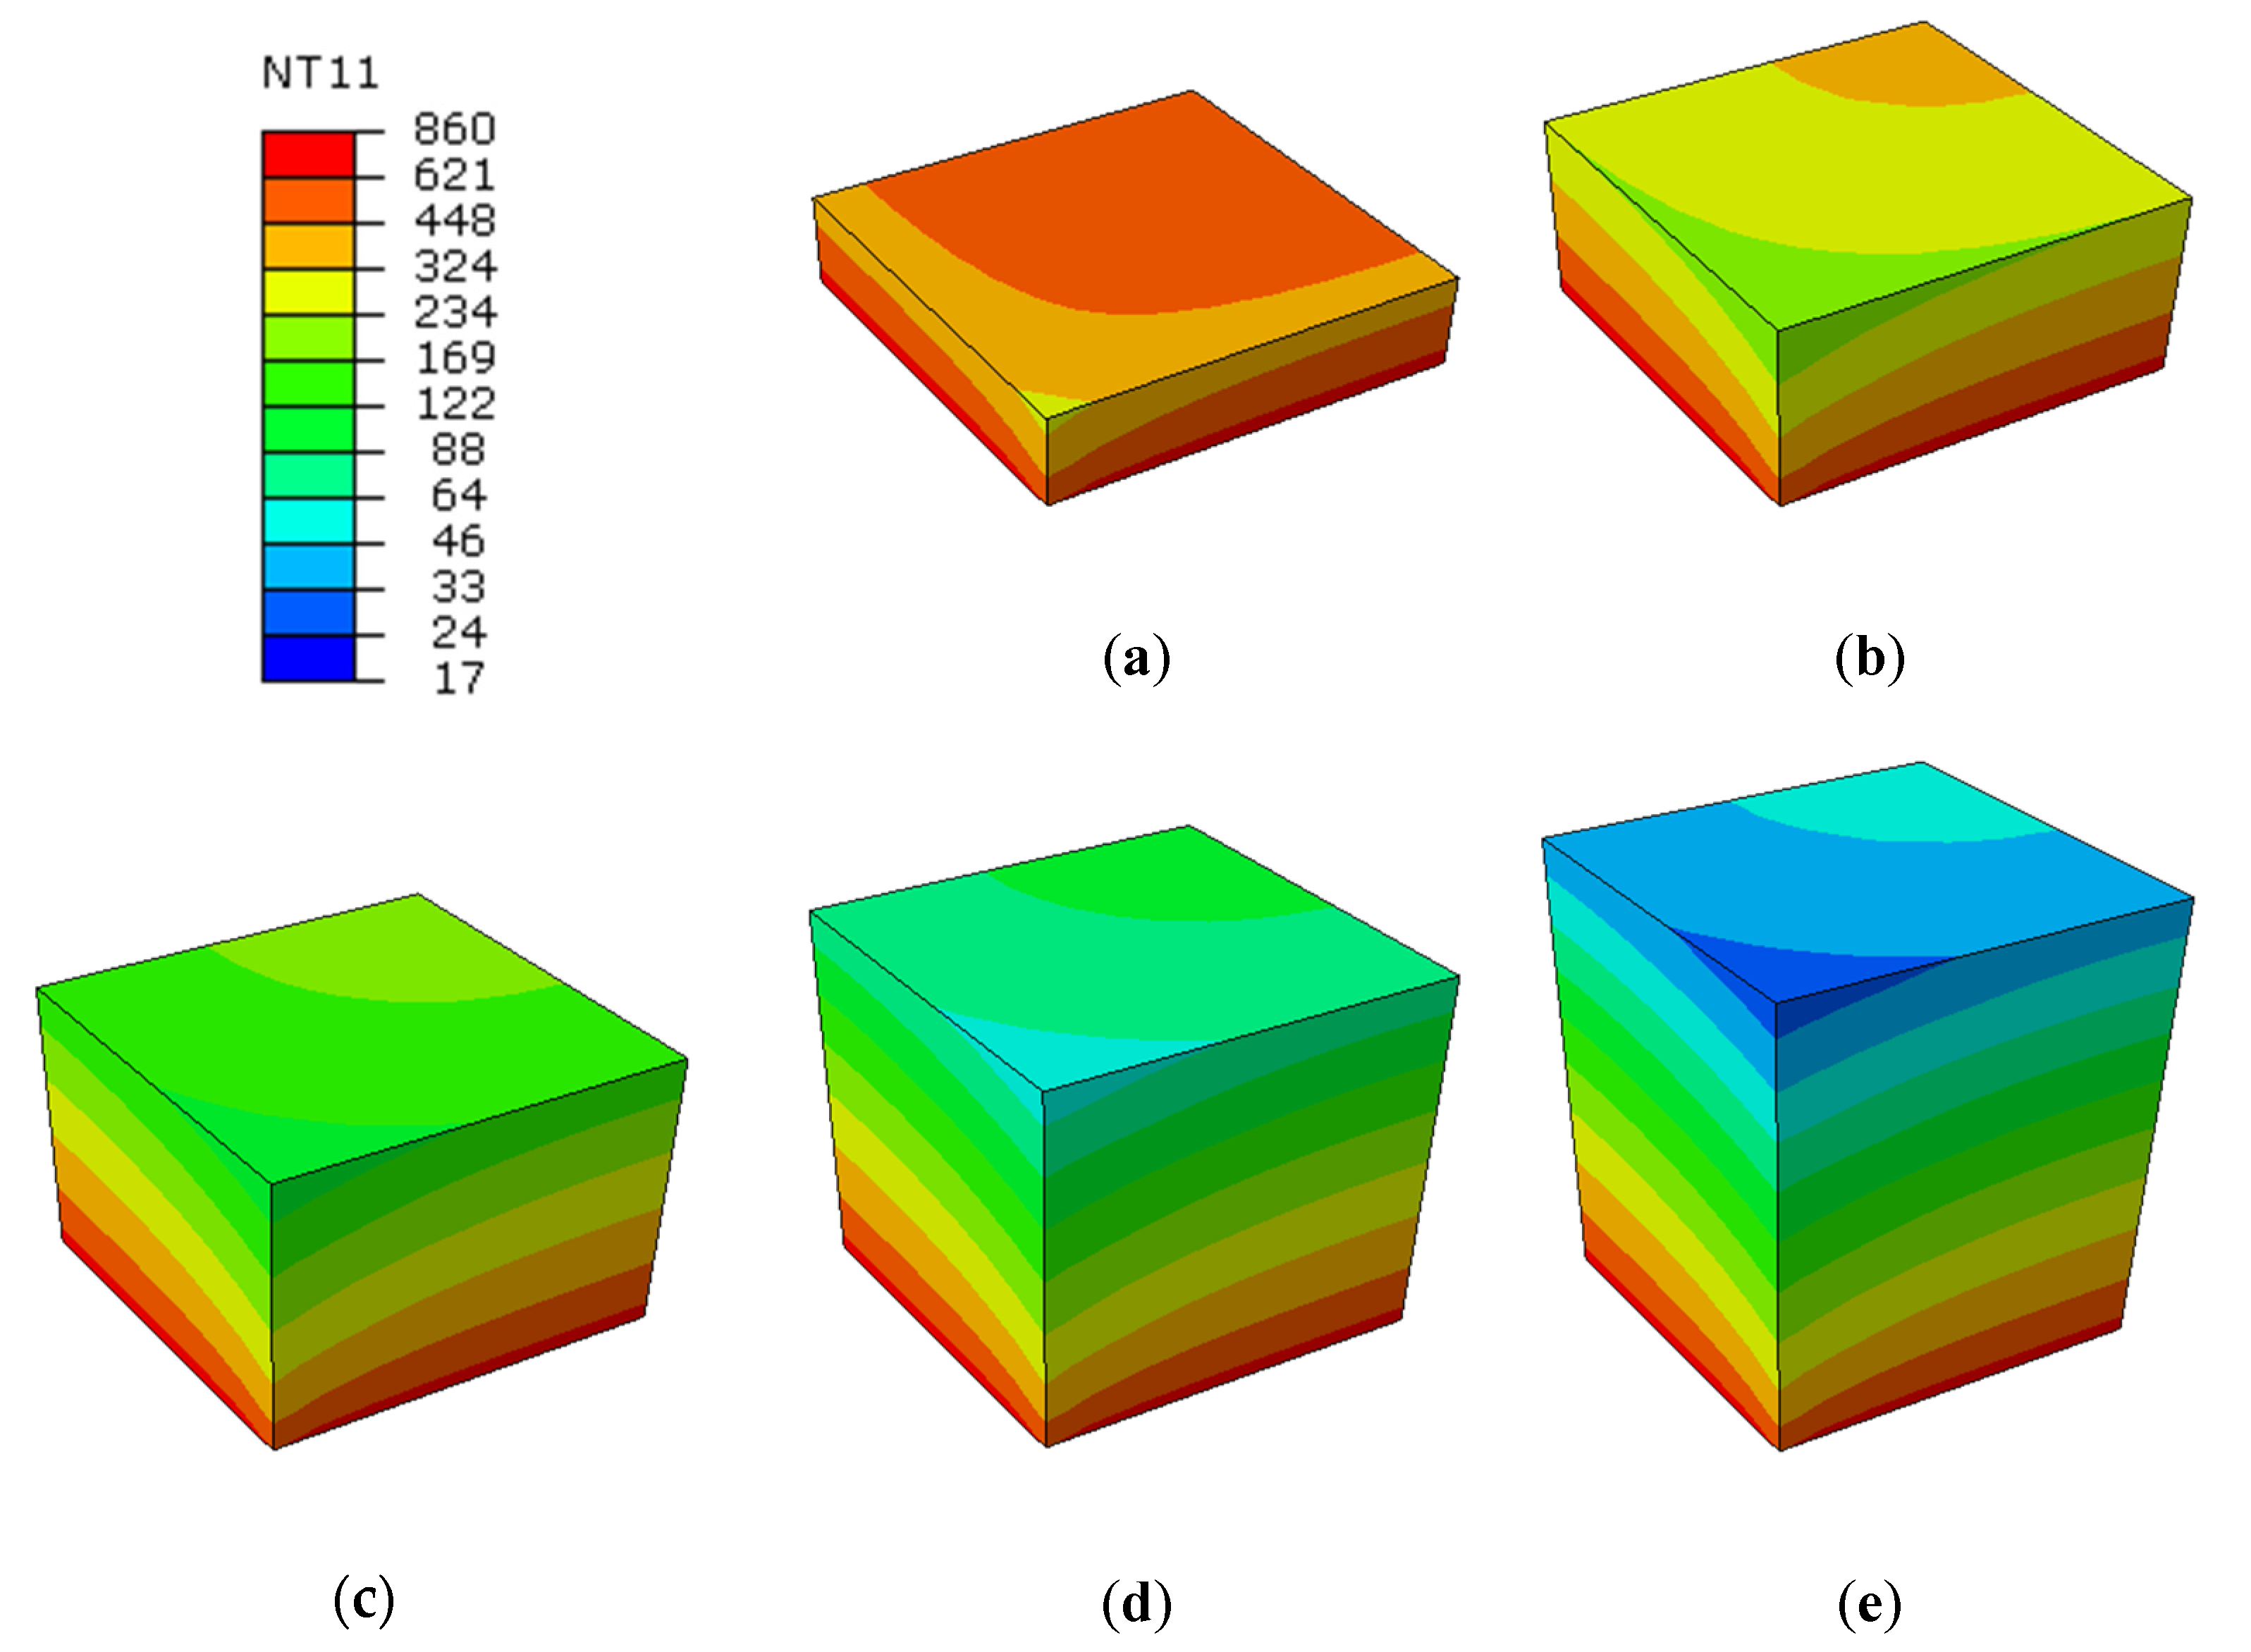
Figure 9.
Temperature variation for concrete cubes under 1 h in DF (ABAQUS/Standard), with evidence of section cuts in the height of specimens: (a) 25 mm, (b) 50 mm, (c) 75 mm, (d) 100 mm and (e) 125 mm. Temperature values in °C. T1 (bottom) and T2-to-T5 (lateral) surfaces under uniform thermal exposure.
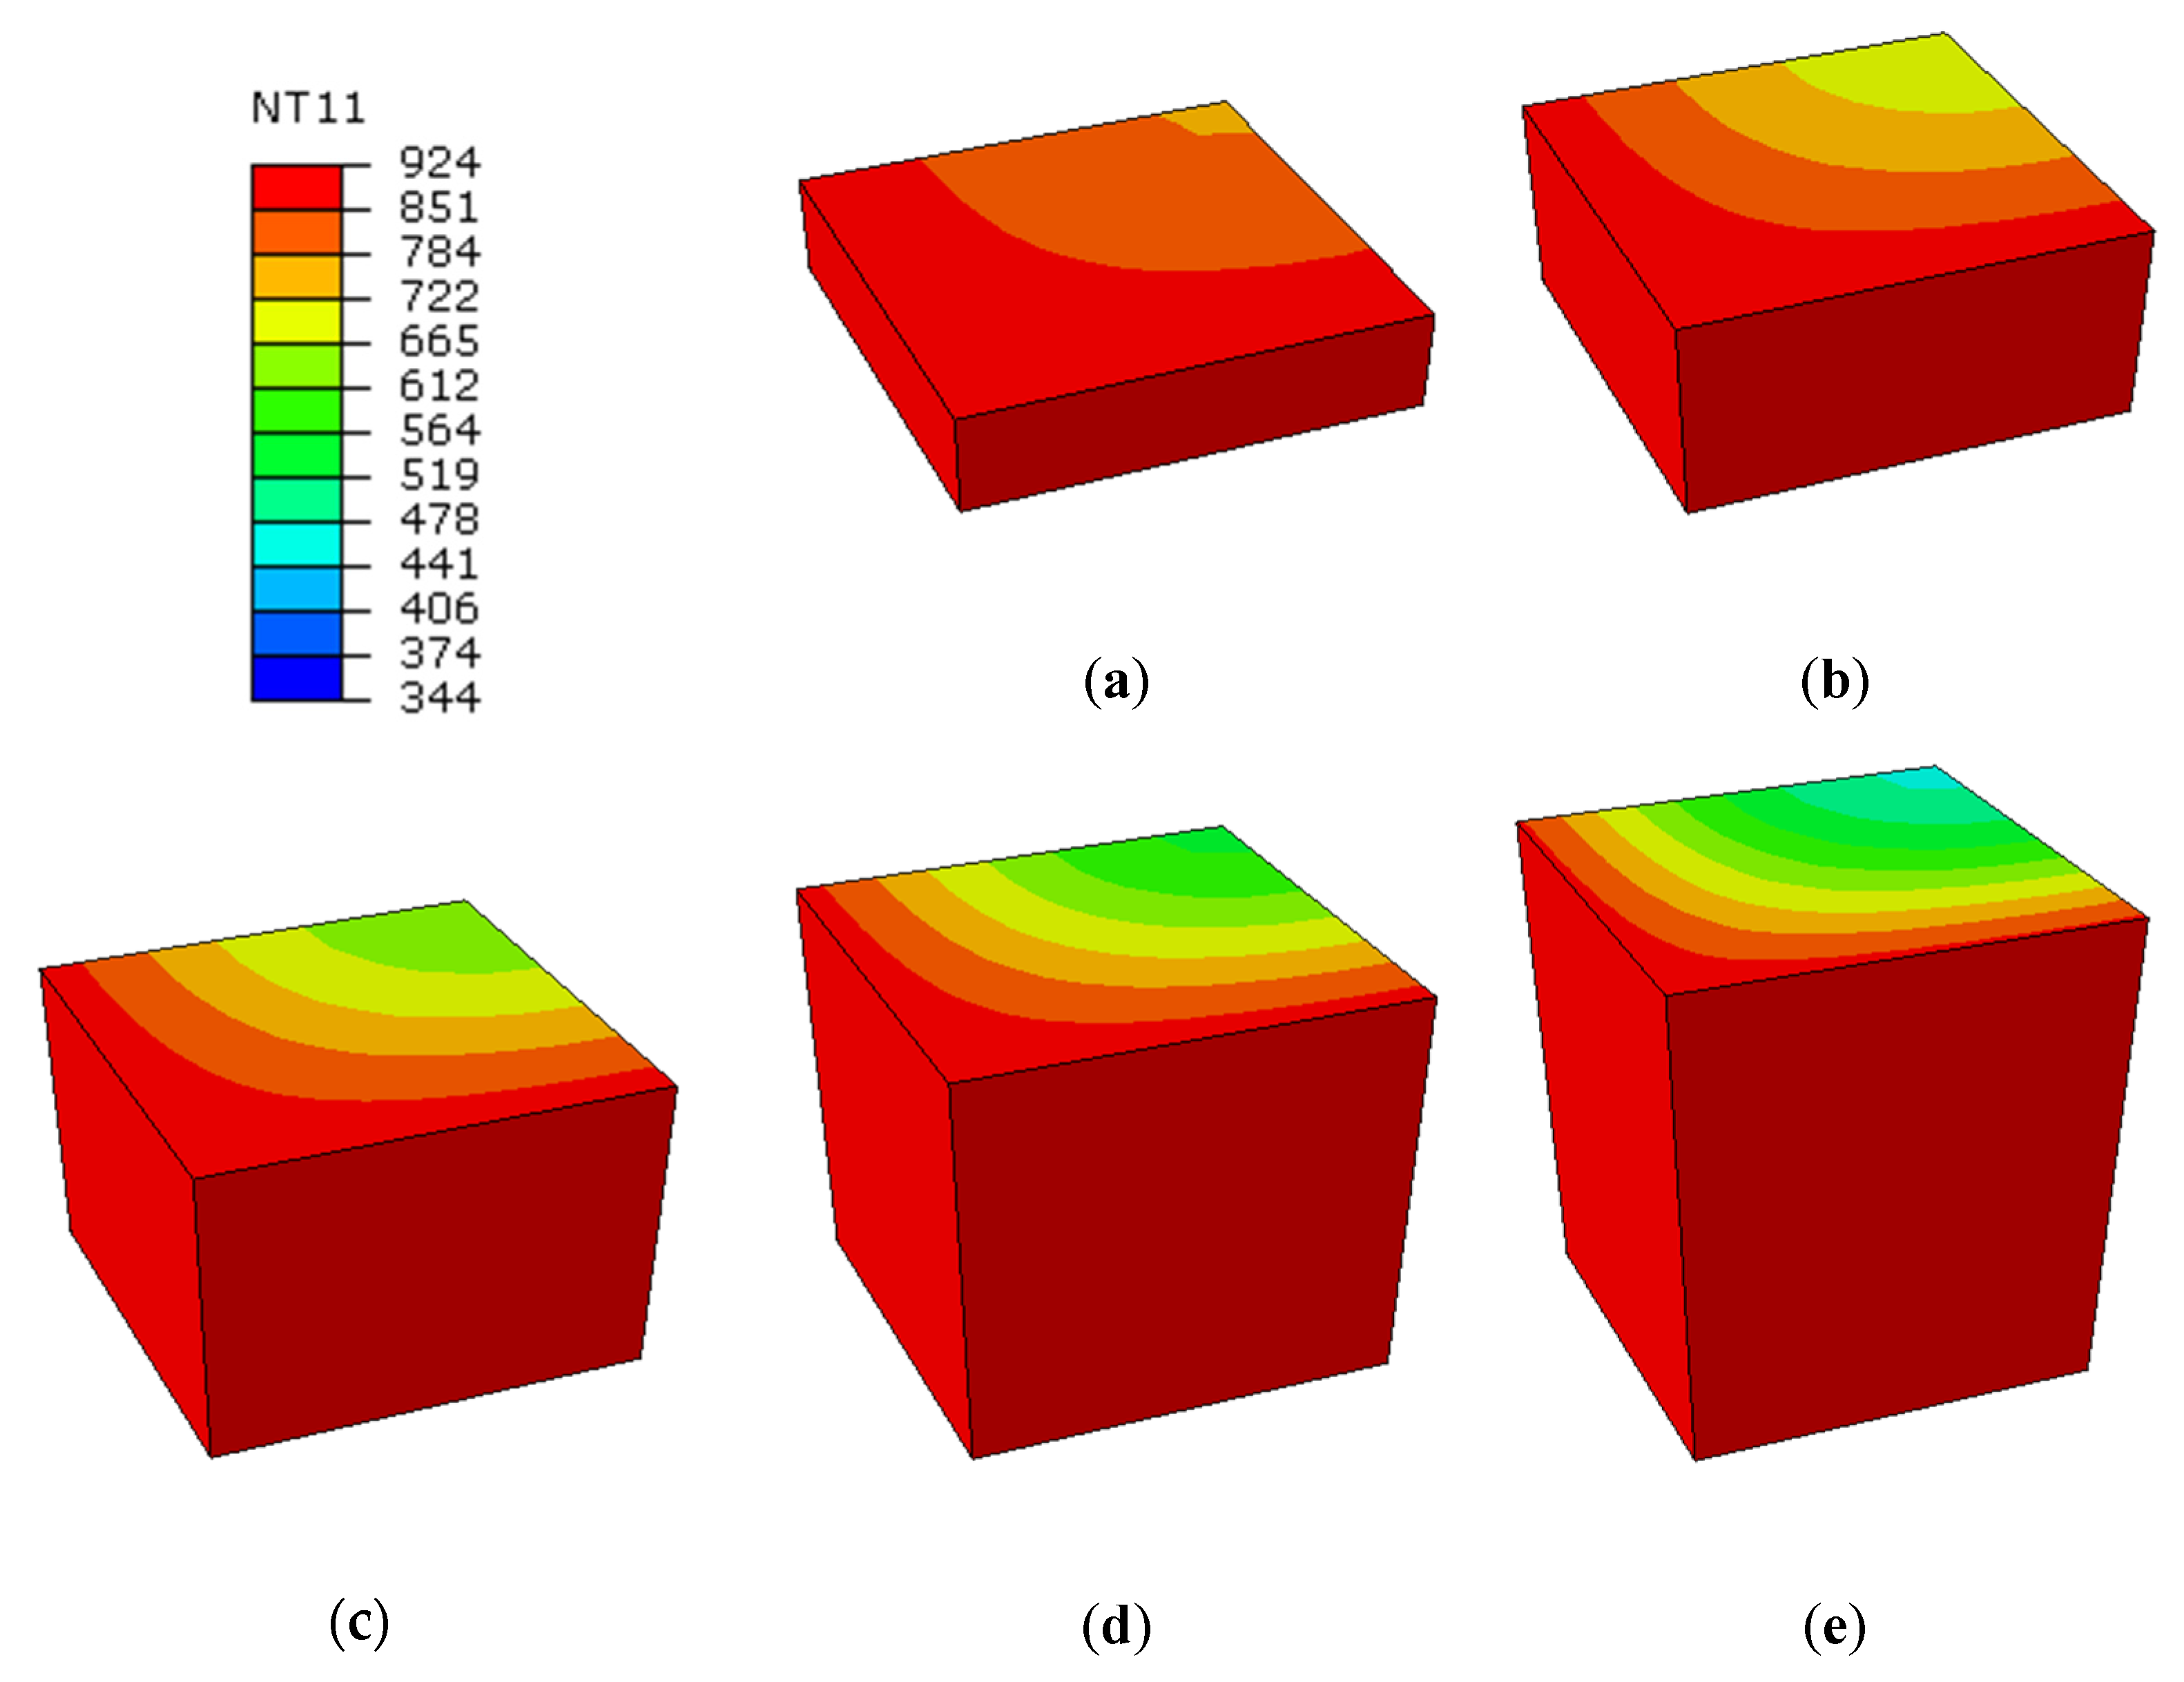
Figure 10.
Variation of relative compressive strength for concrete or CBCs samples based on (a) 10% or (b) 15% urban residues proportion, as a function of different heating conditions, and (c,d) typical trend for normal/high strength concrete, as a function of temperature. Figure 10c,d are reproduced with permission from [42], under the rules of the Creative Commons Attribution License.
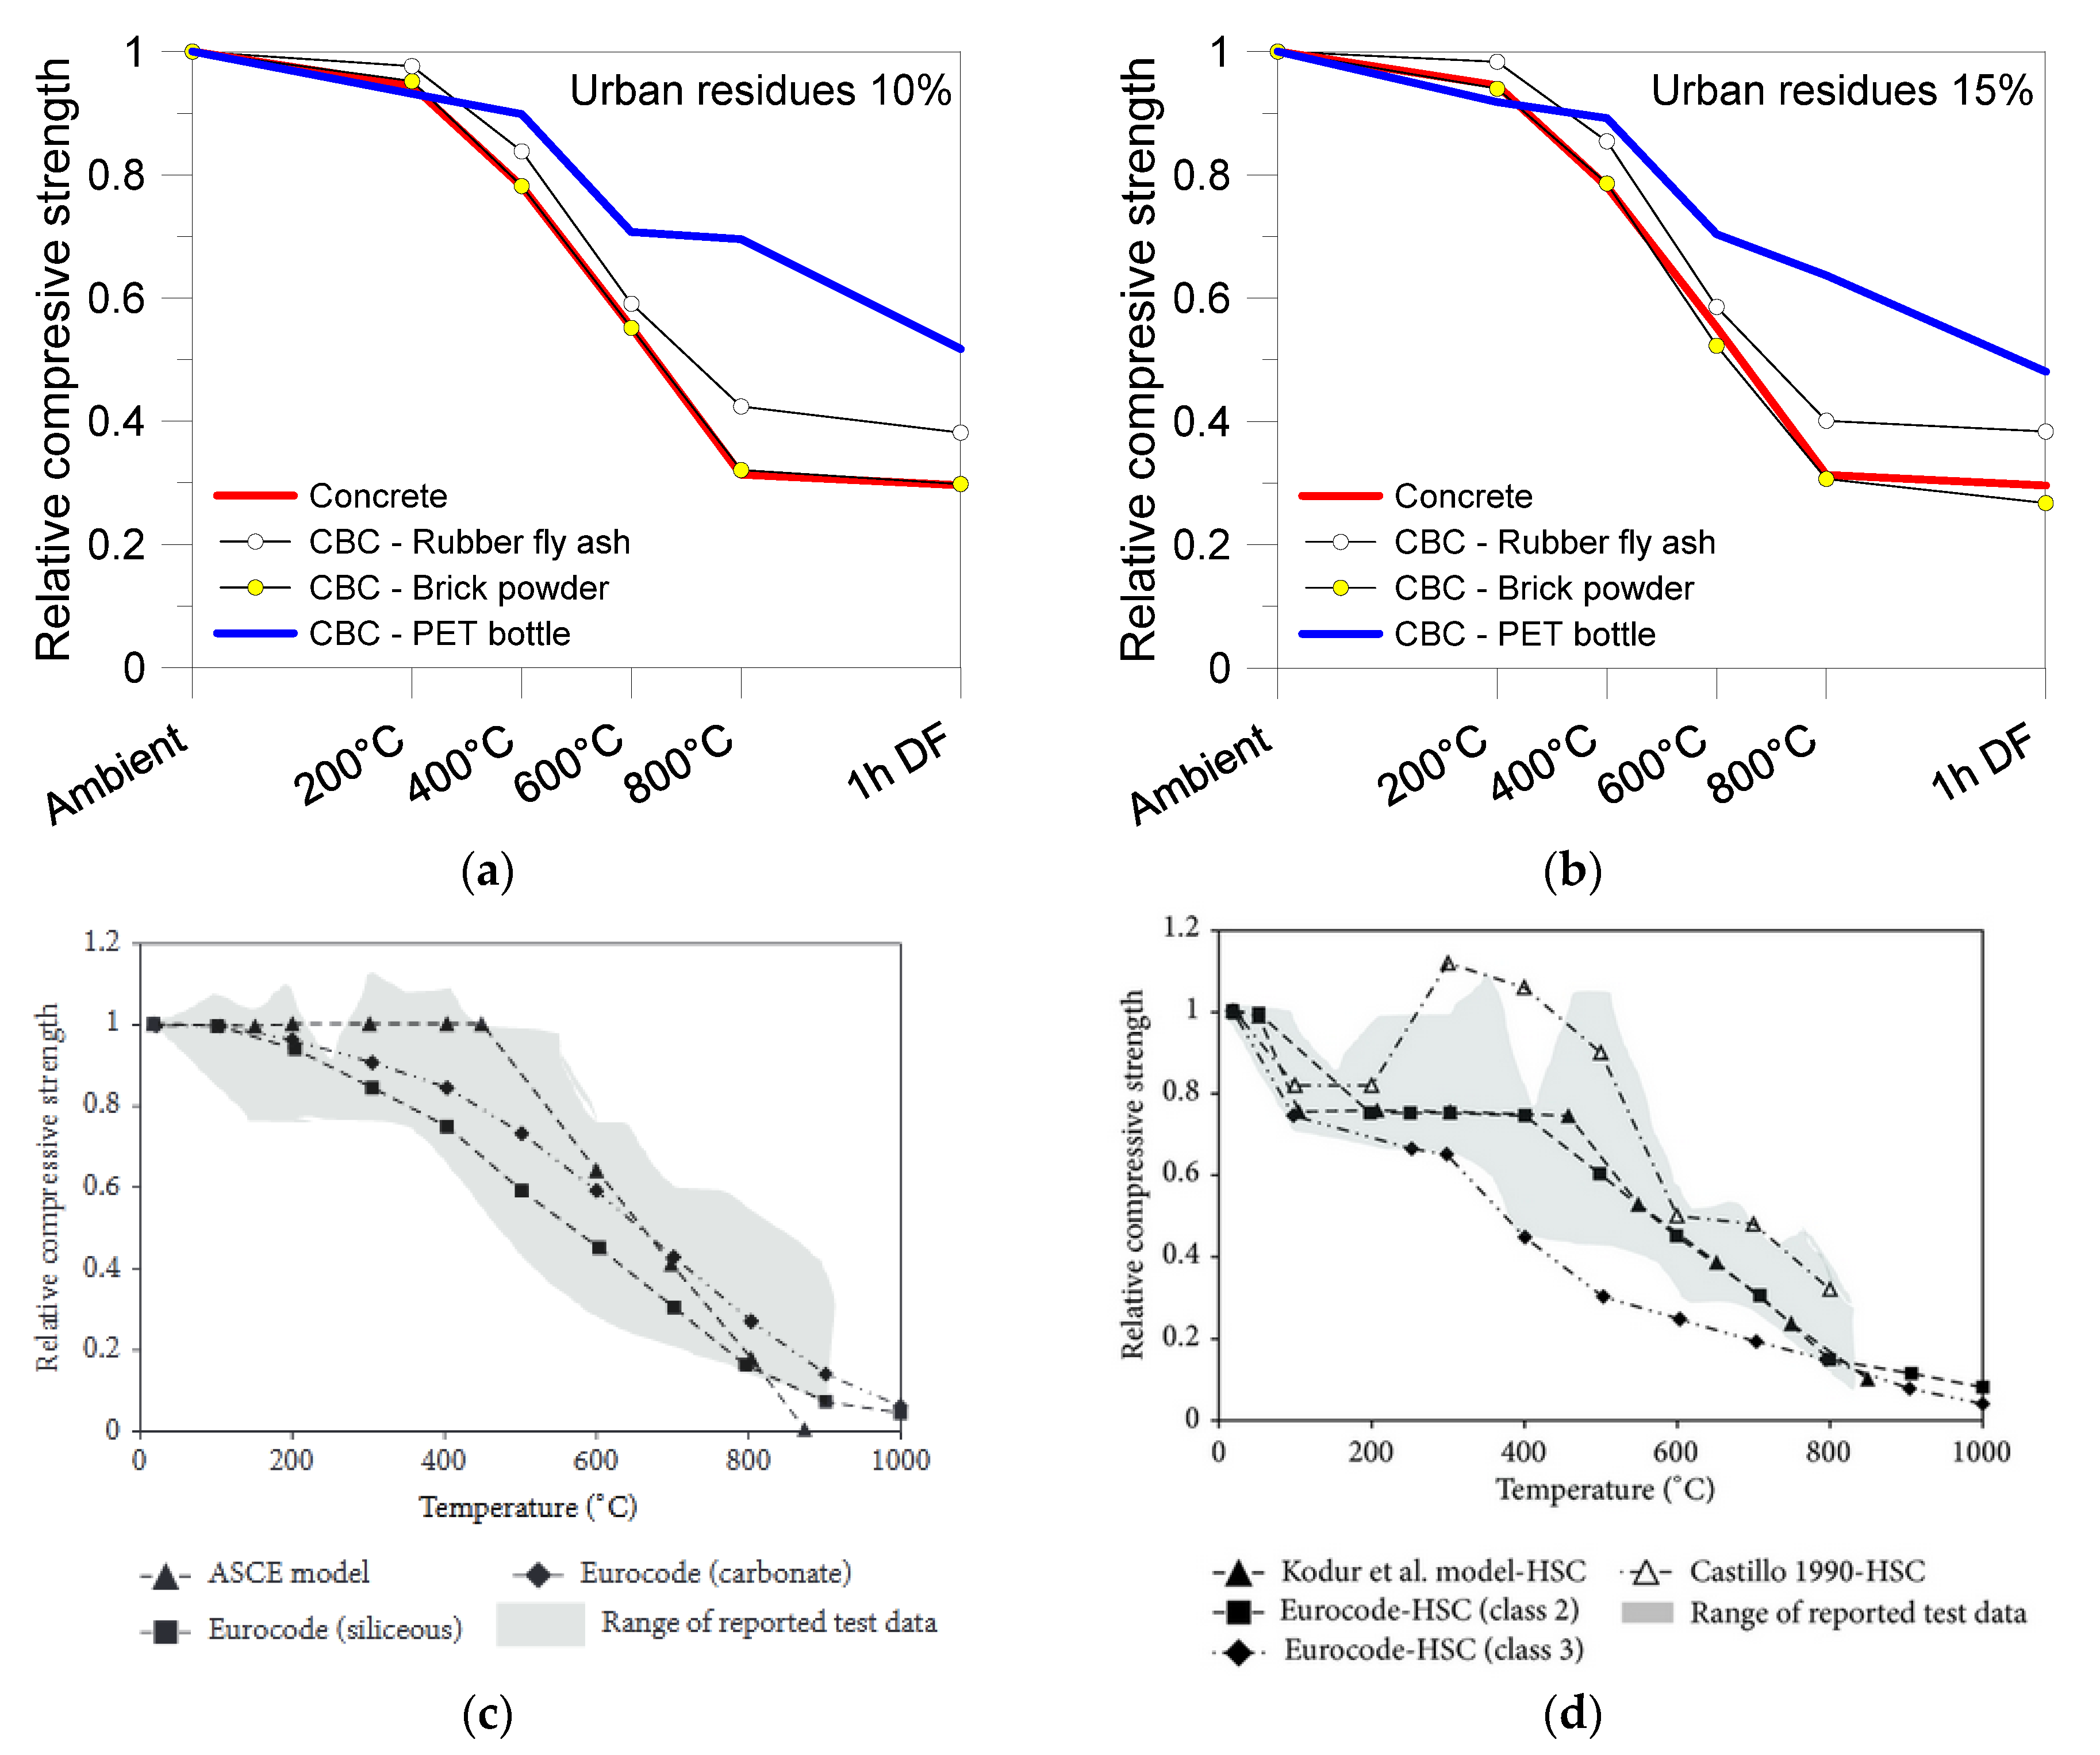
Figure 11.
Percentage variation of relative compressive strength for concrete or CBCs cube samples, after 1 h in DF.
Figure 11.
Percentage variation of relative compressive strength for concrete or CBCs cube samples, after 1 h in DF.
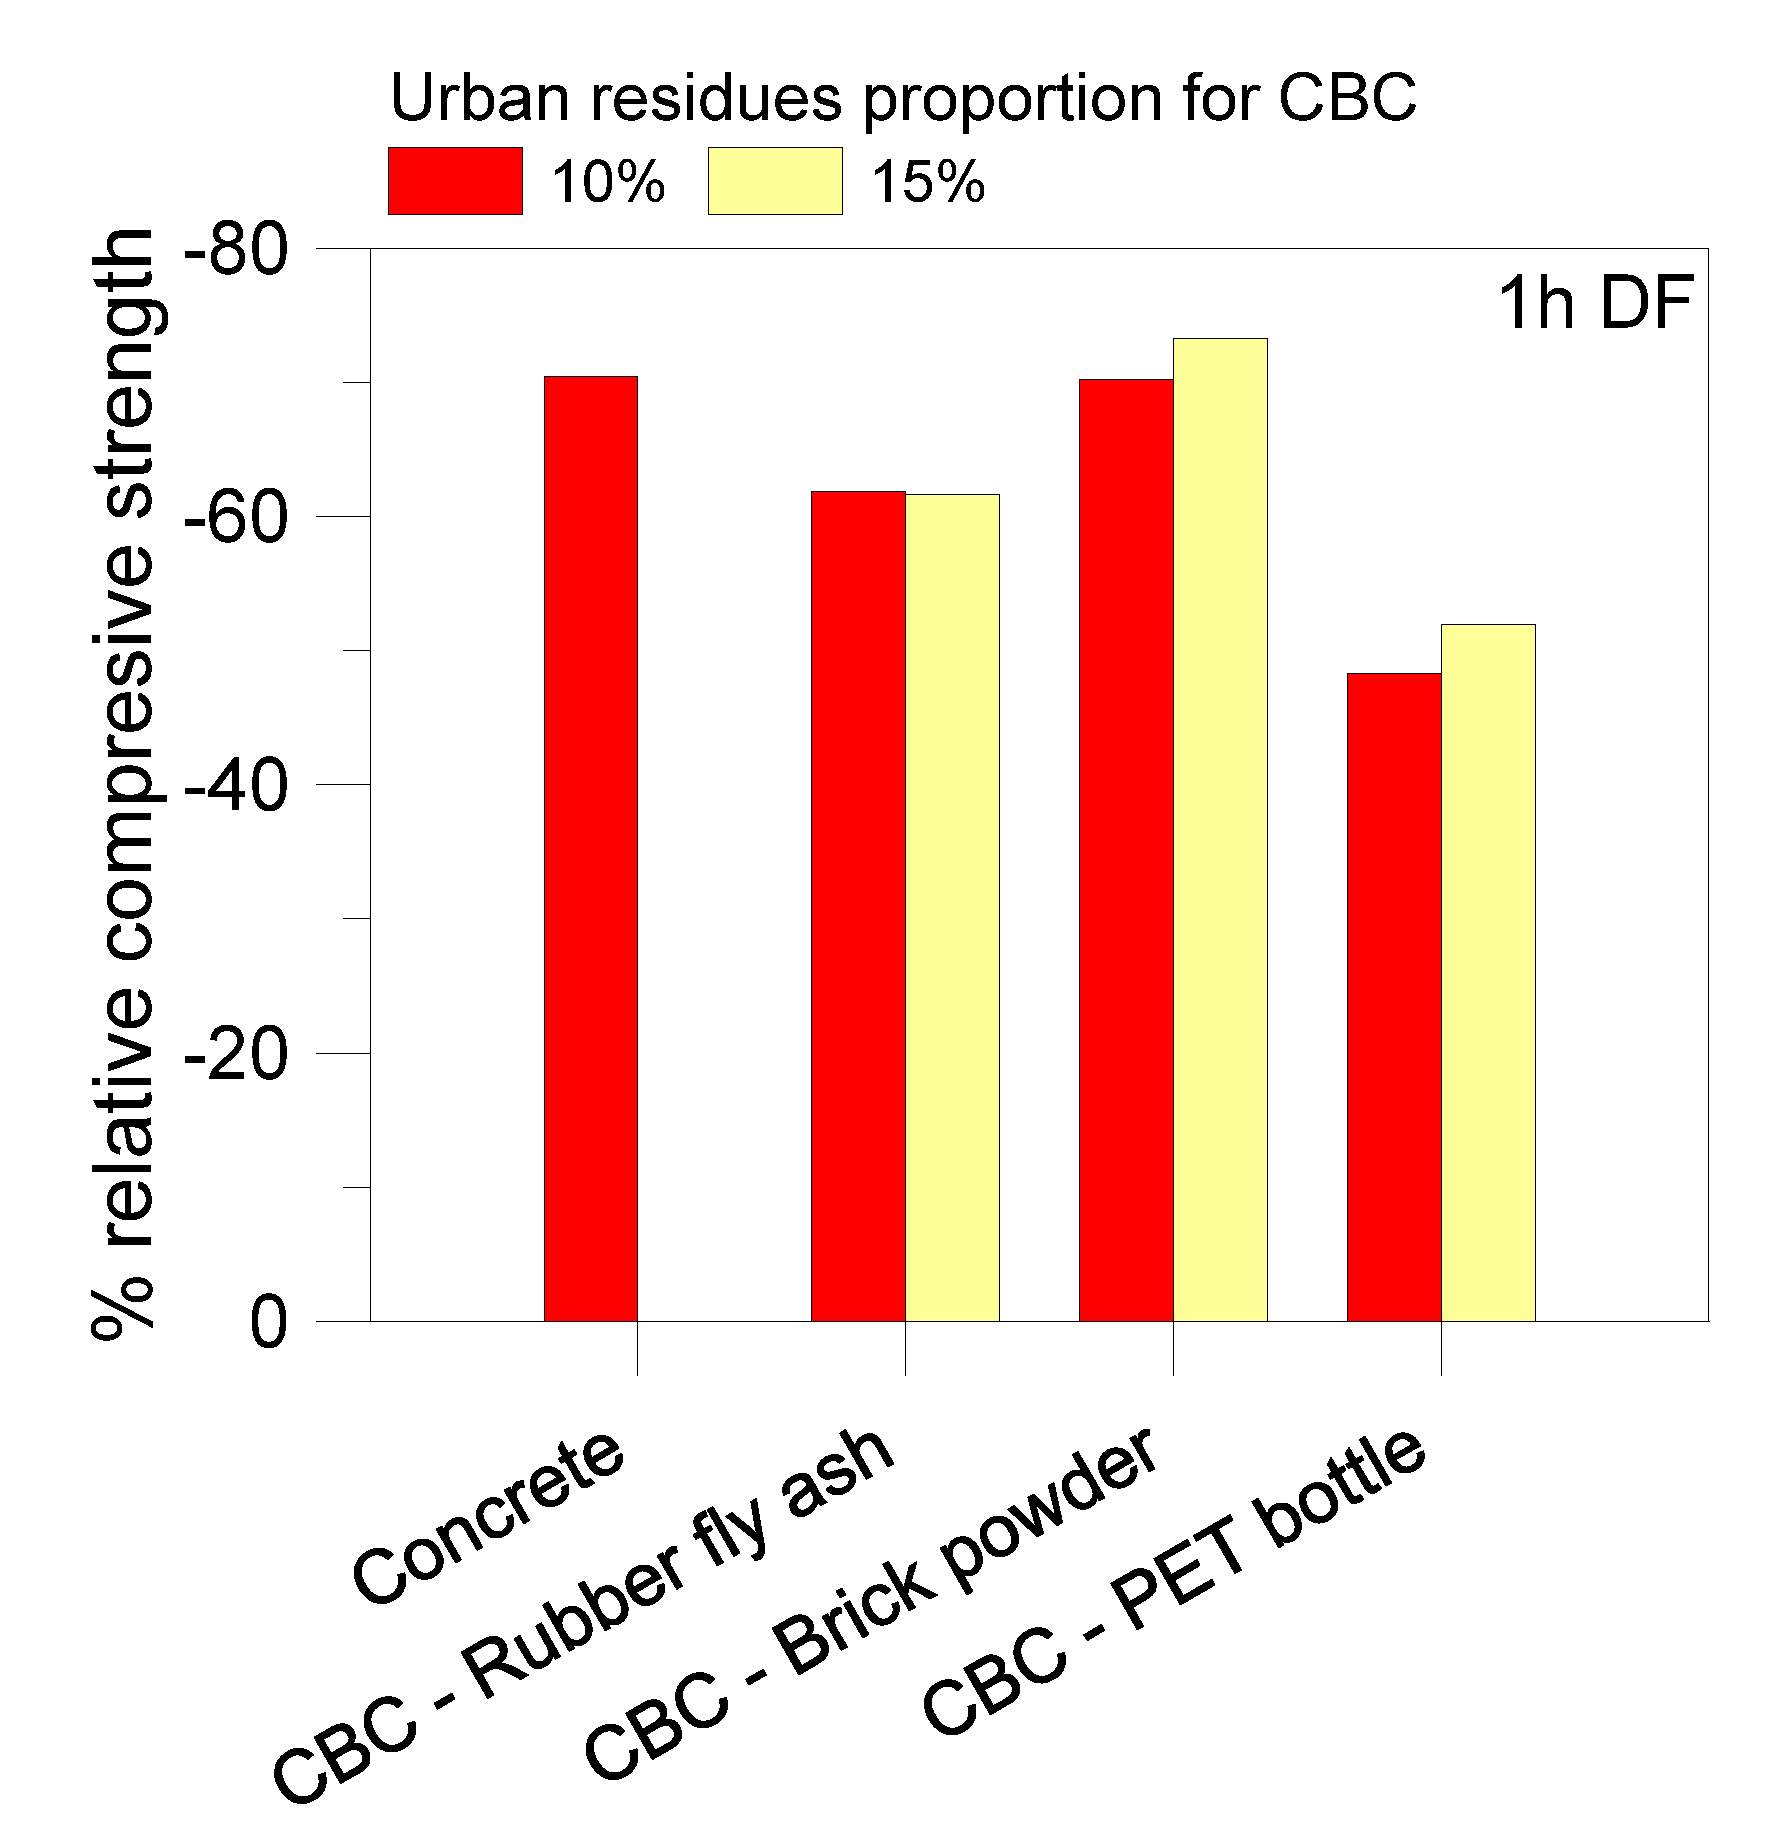
Figure 12.
Percentage variation of MoE for concrete or CBC-PET10 cube samples, after 1 h in DF.
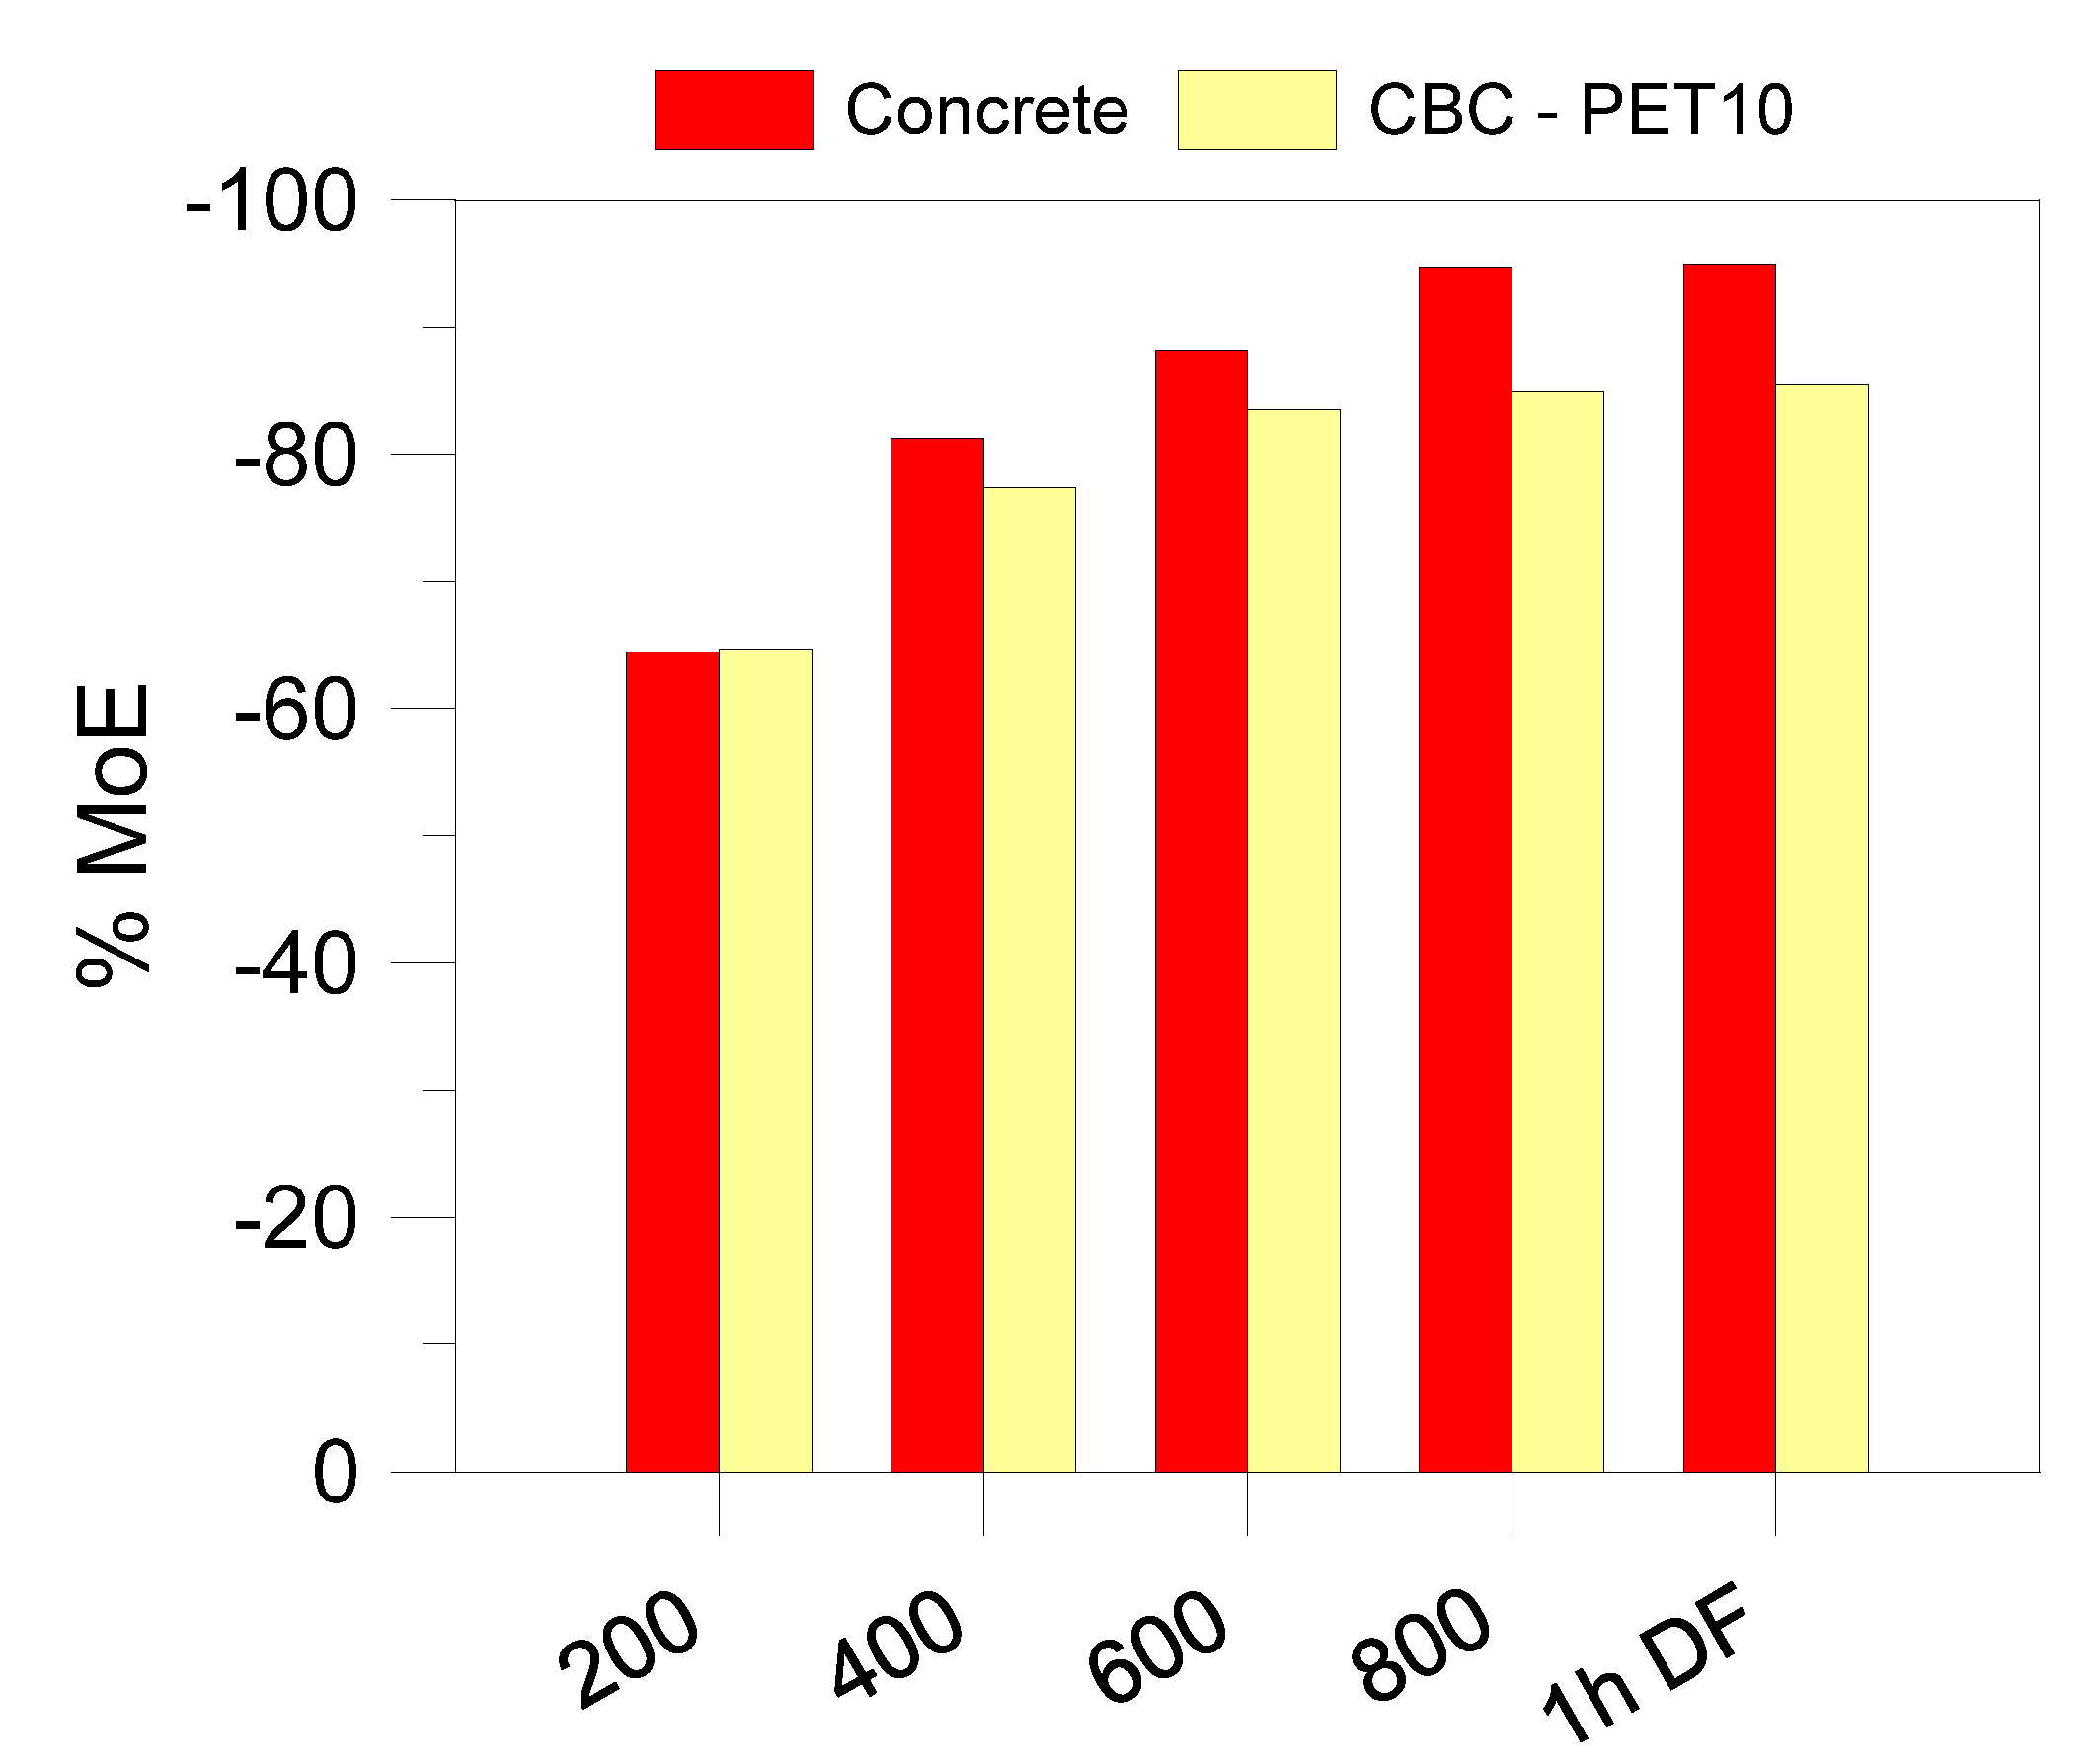
Figure 13.
Photographs of (a) samples heated in furnace (b) samples subjected to direct flame exposure.
Figure 13.
Photographs of (a) samples heated in furnace (b) samples subjected to direct flame exposure.
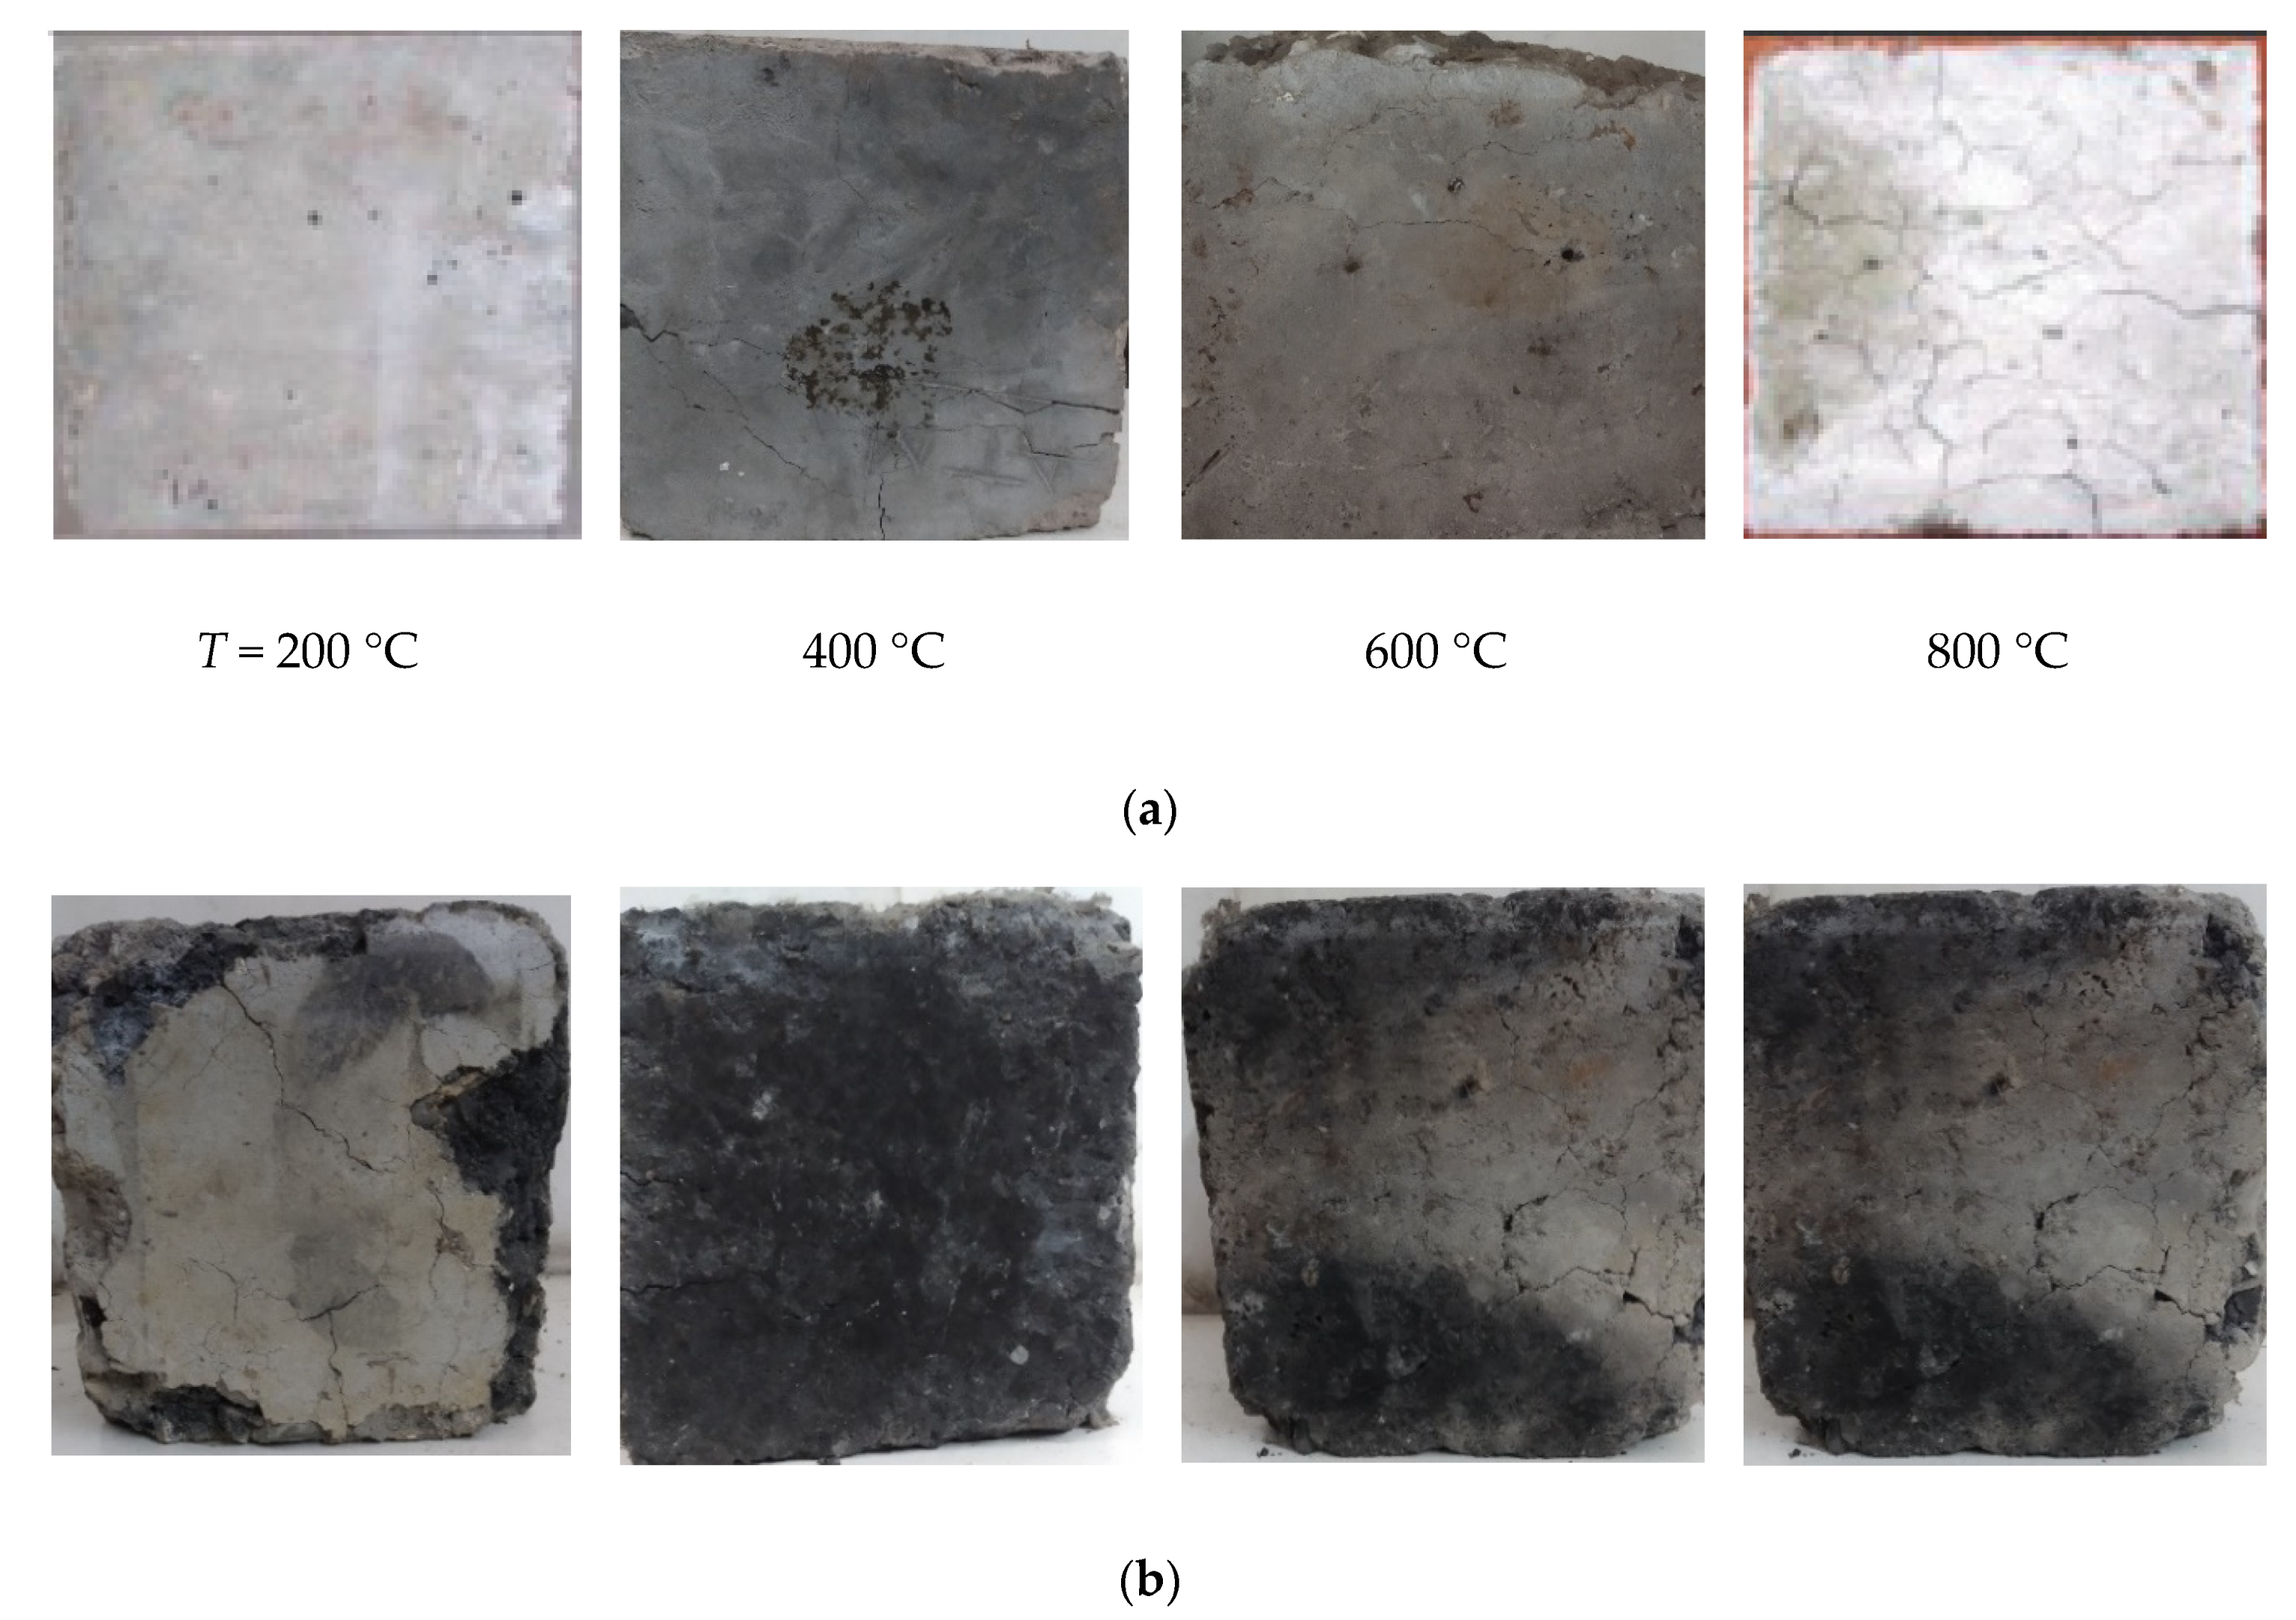
Figure 14.
SEM images of fractured CBCs having rubber fly ash at ×500, 200, 100, 50.
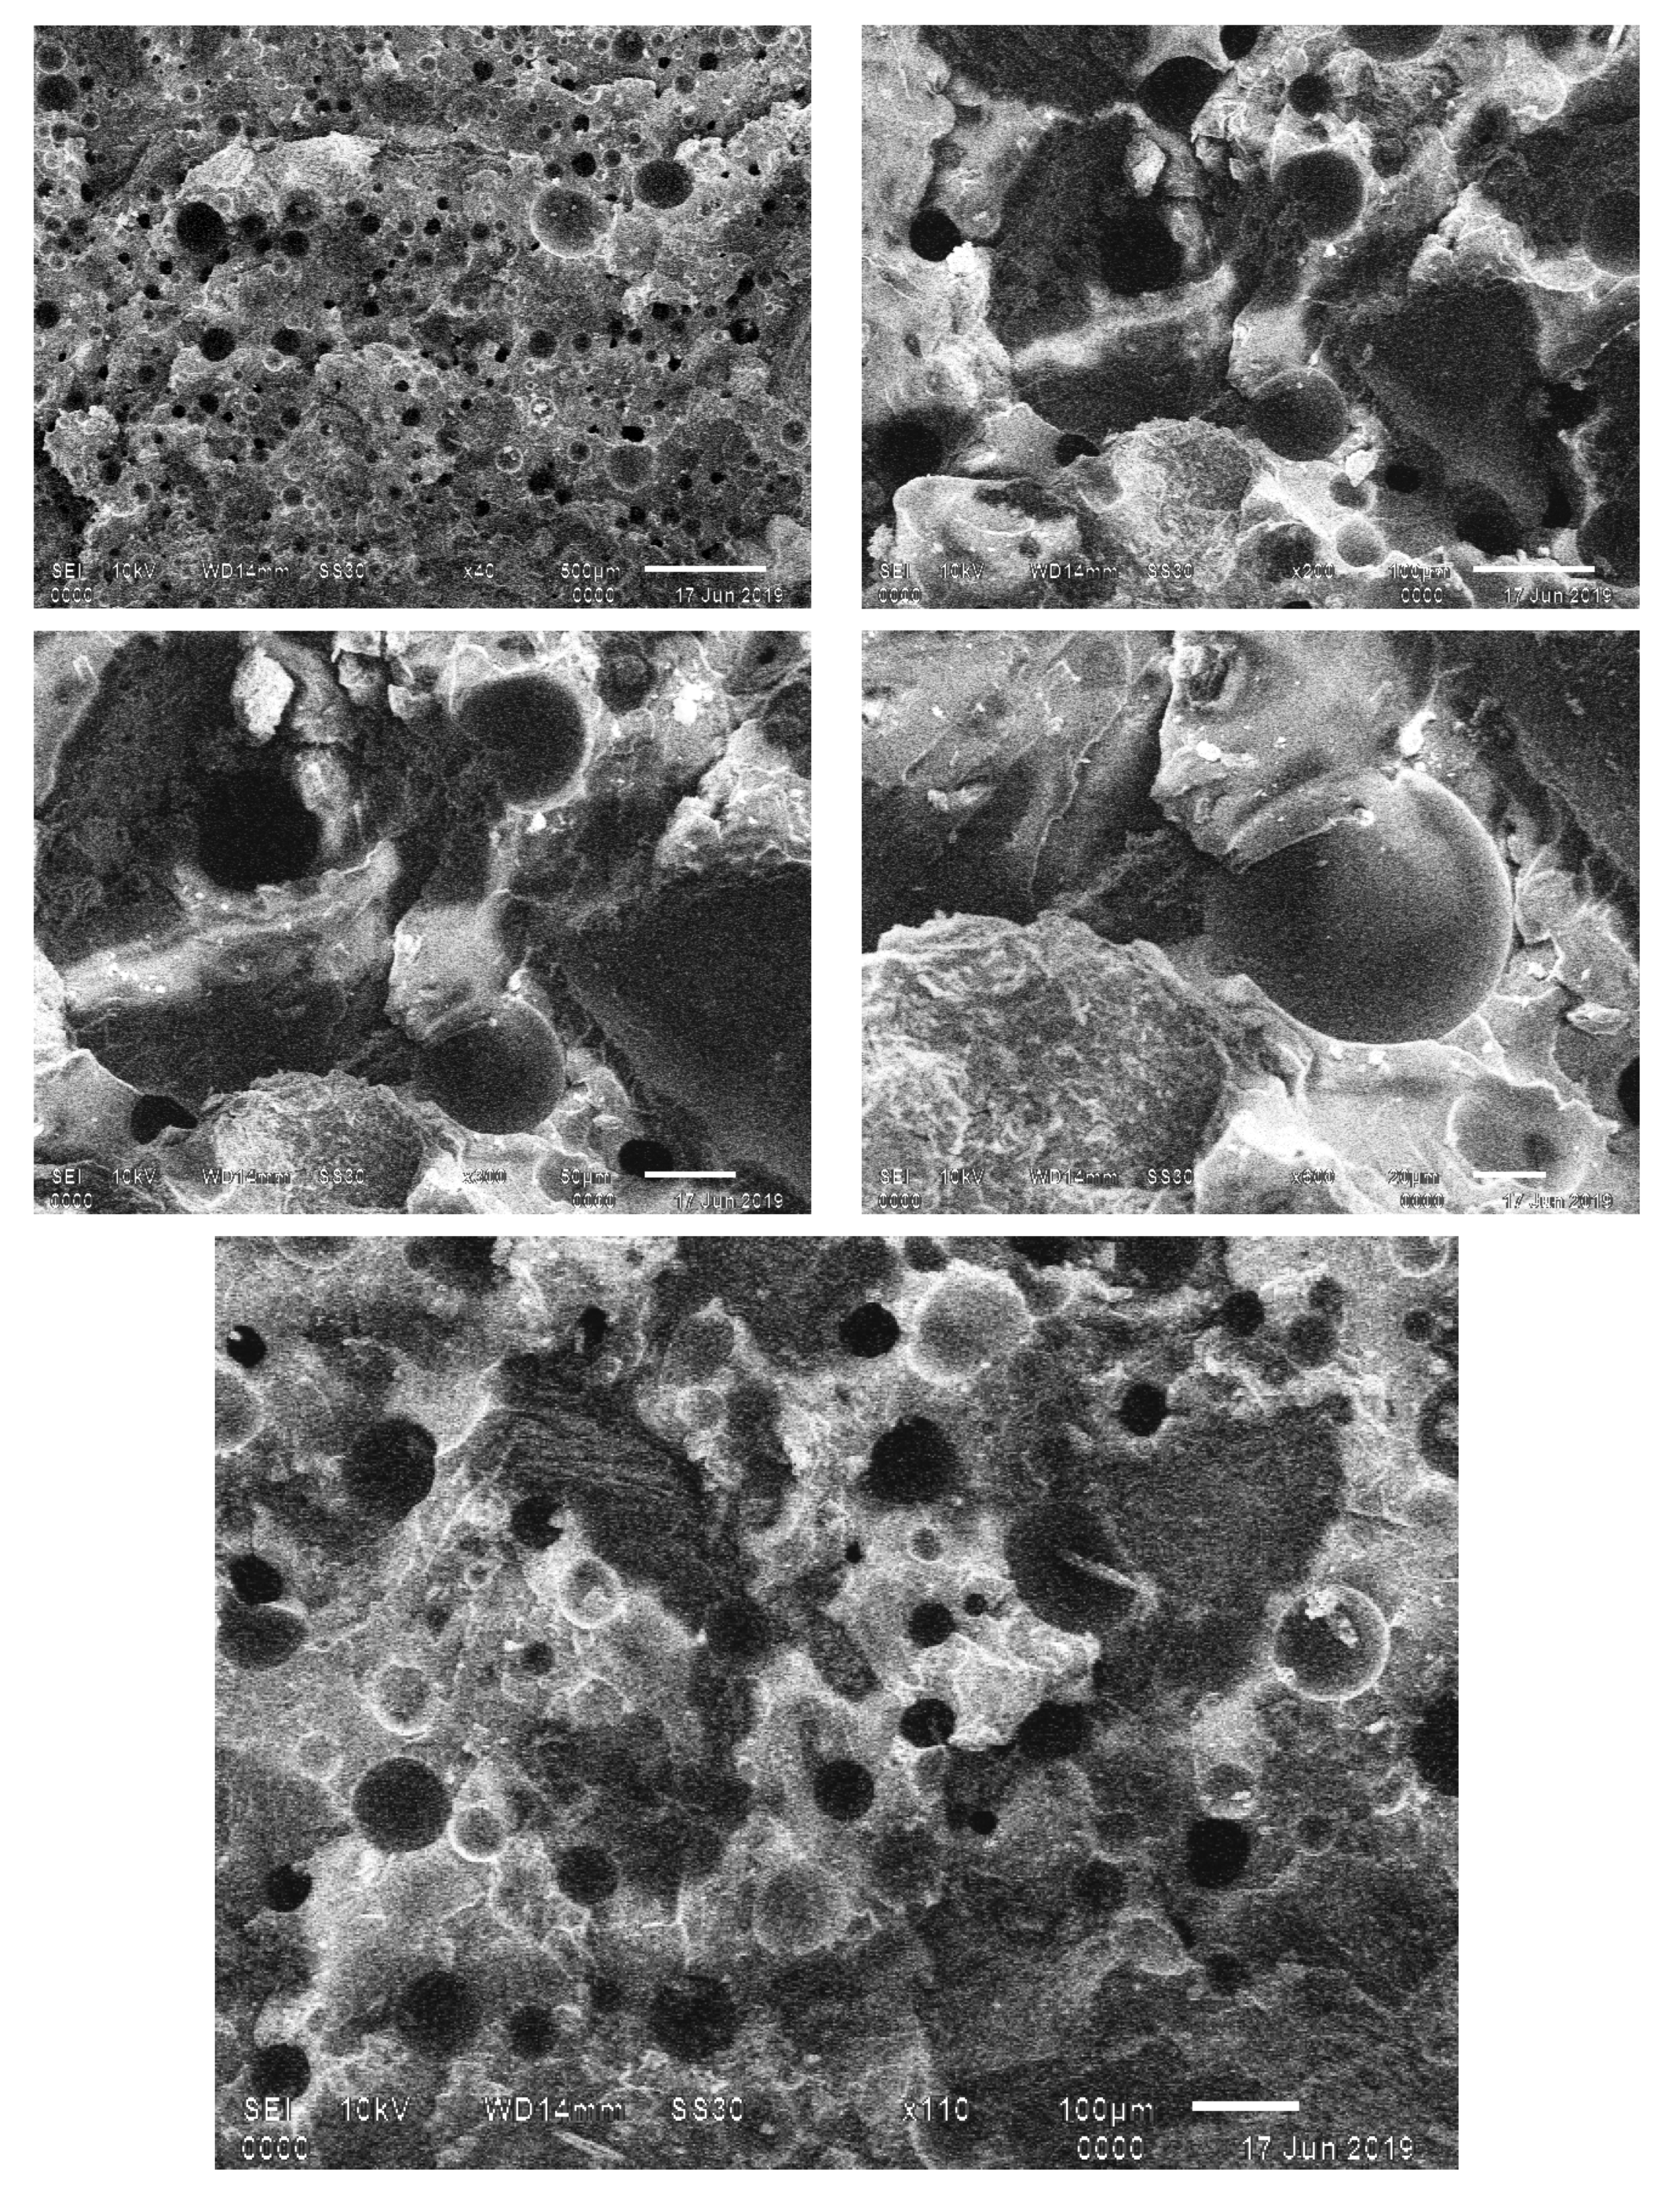
Figure 15.
SEM images of fractured CBCs with PET bottle residual at ×500, 200, 100, 50.
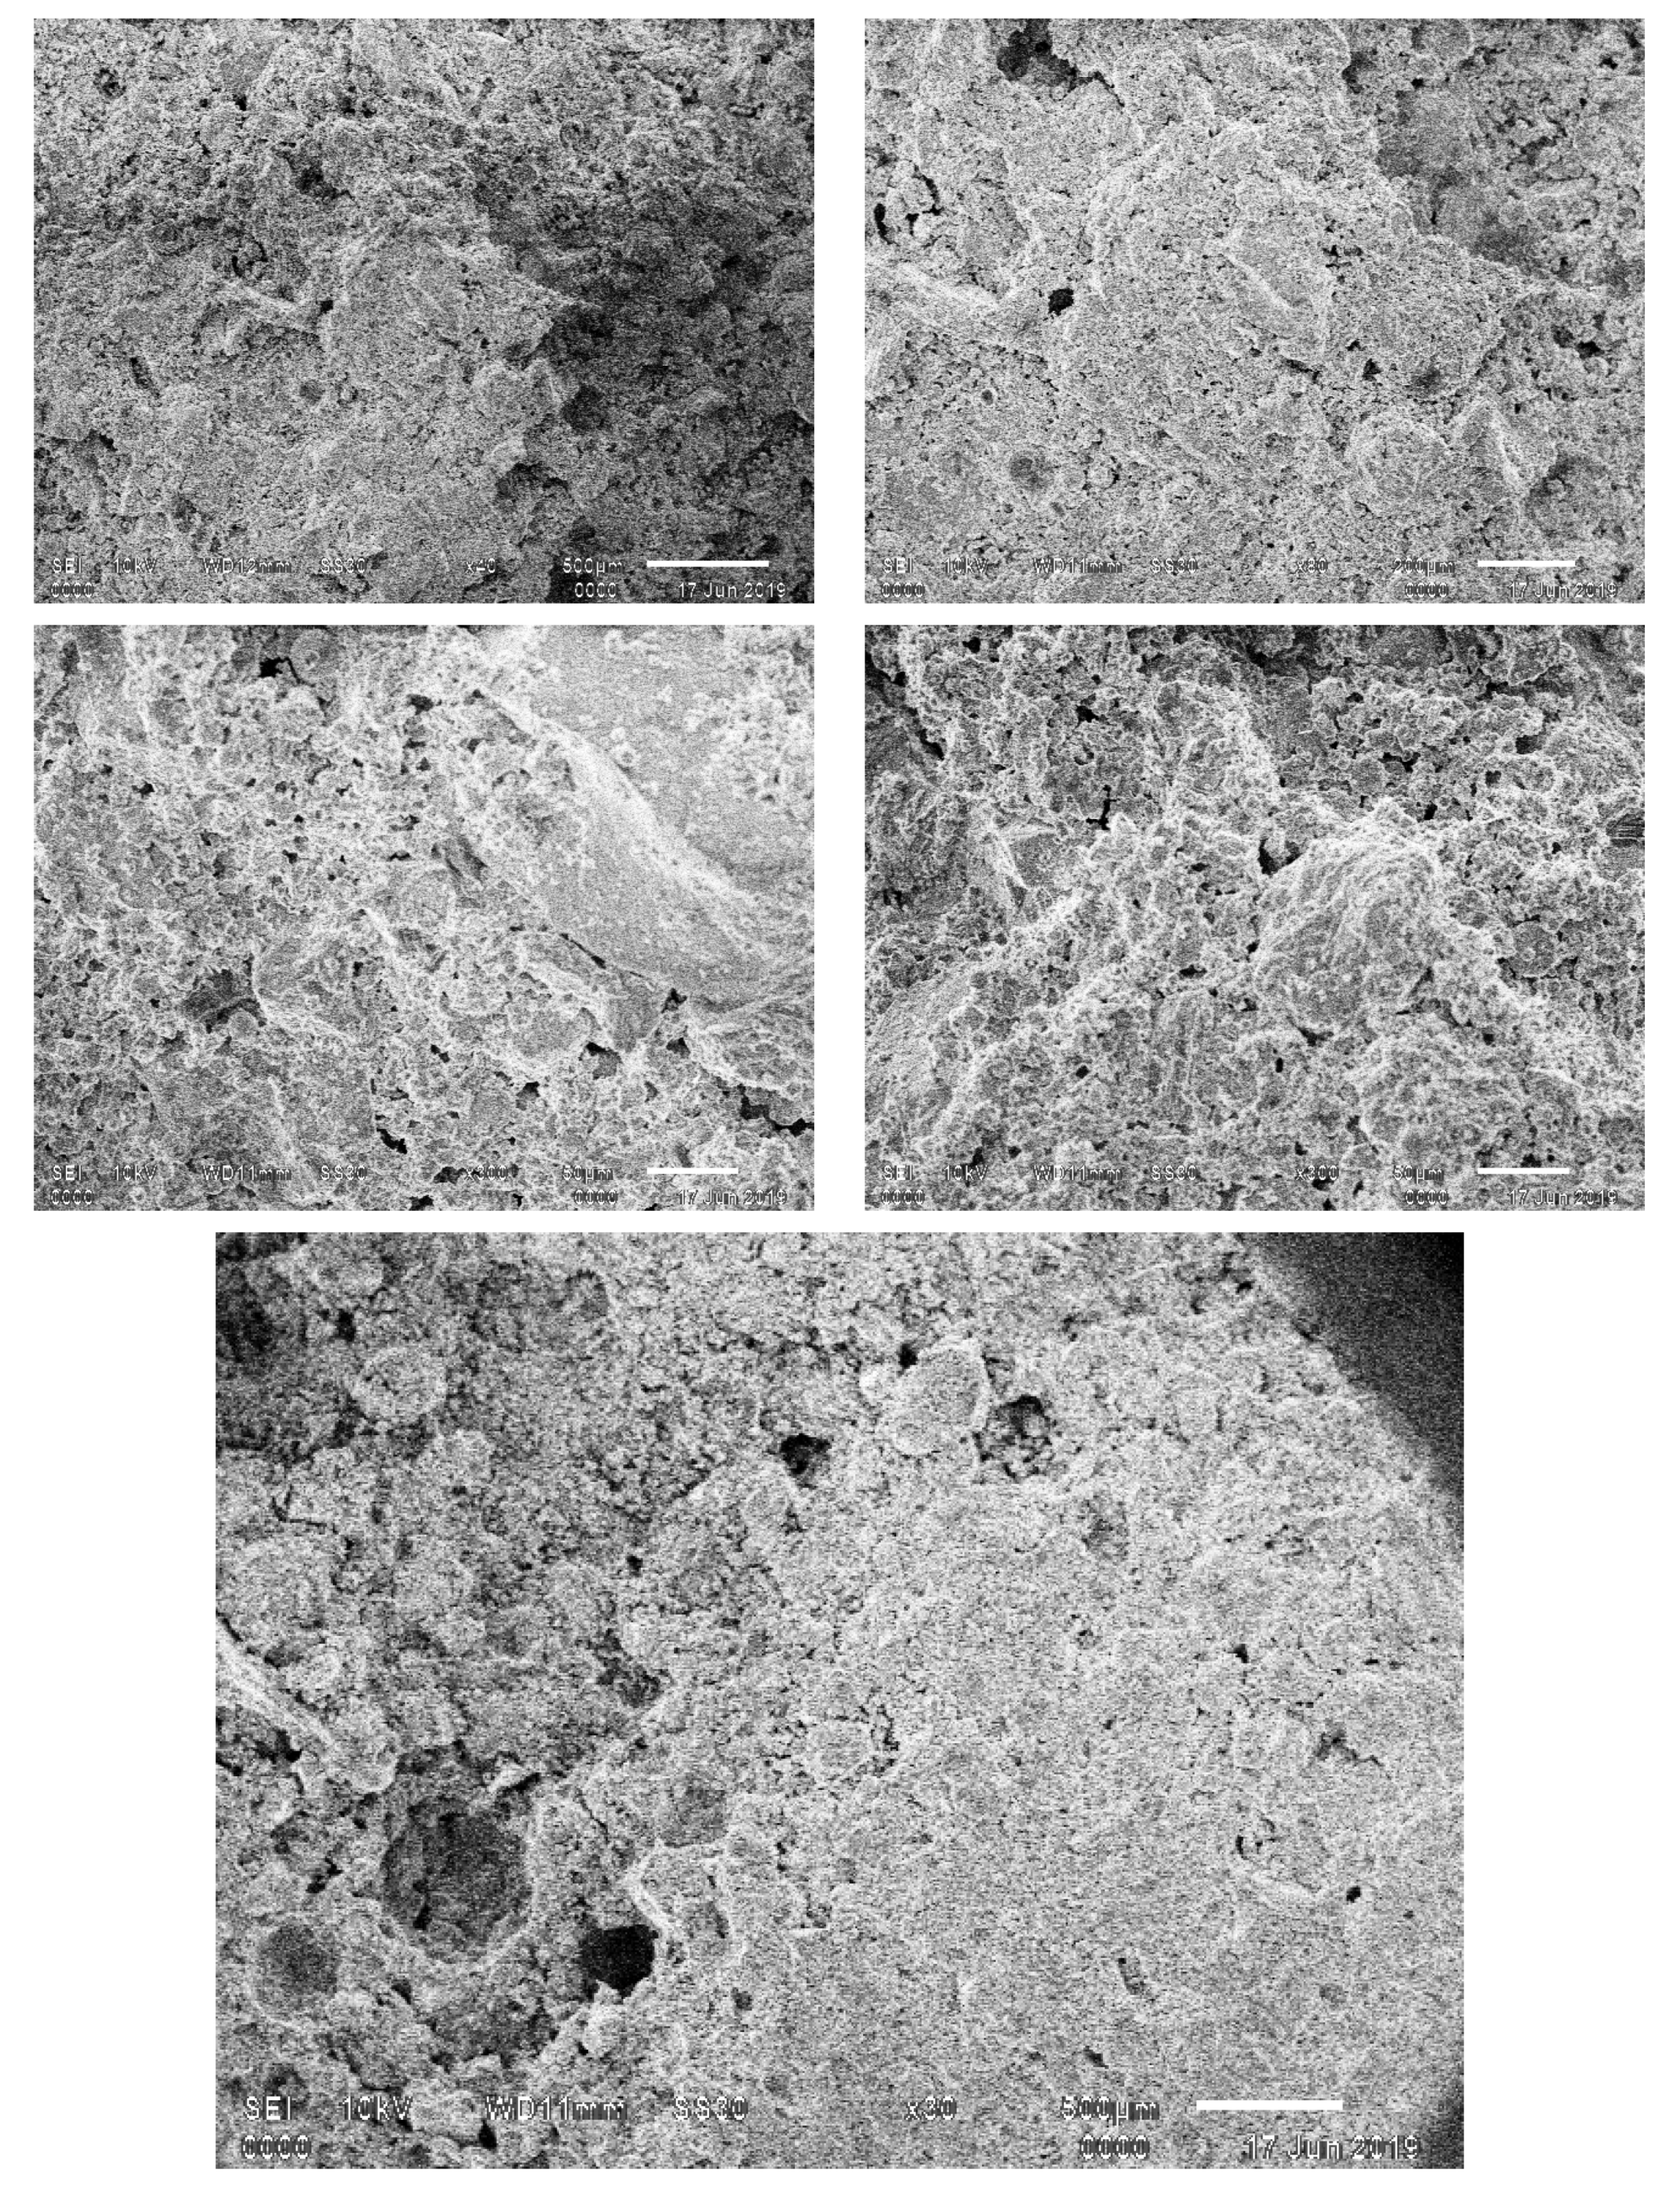
Figure 16.
SEM images of fractured CBCs having brick powder at ×500, 200, 100, 50.
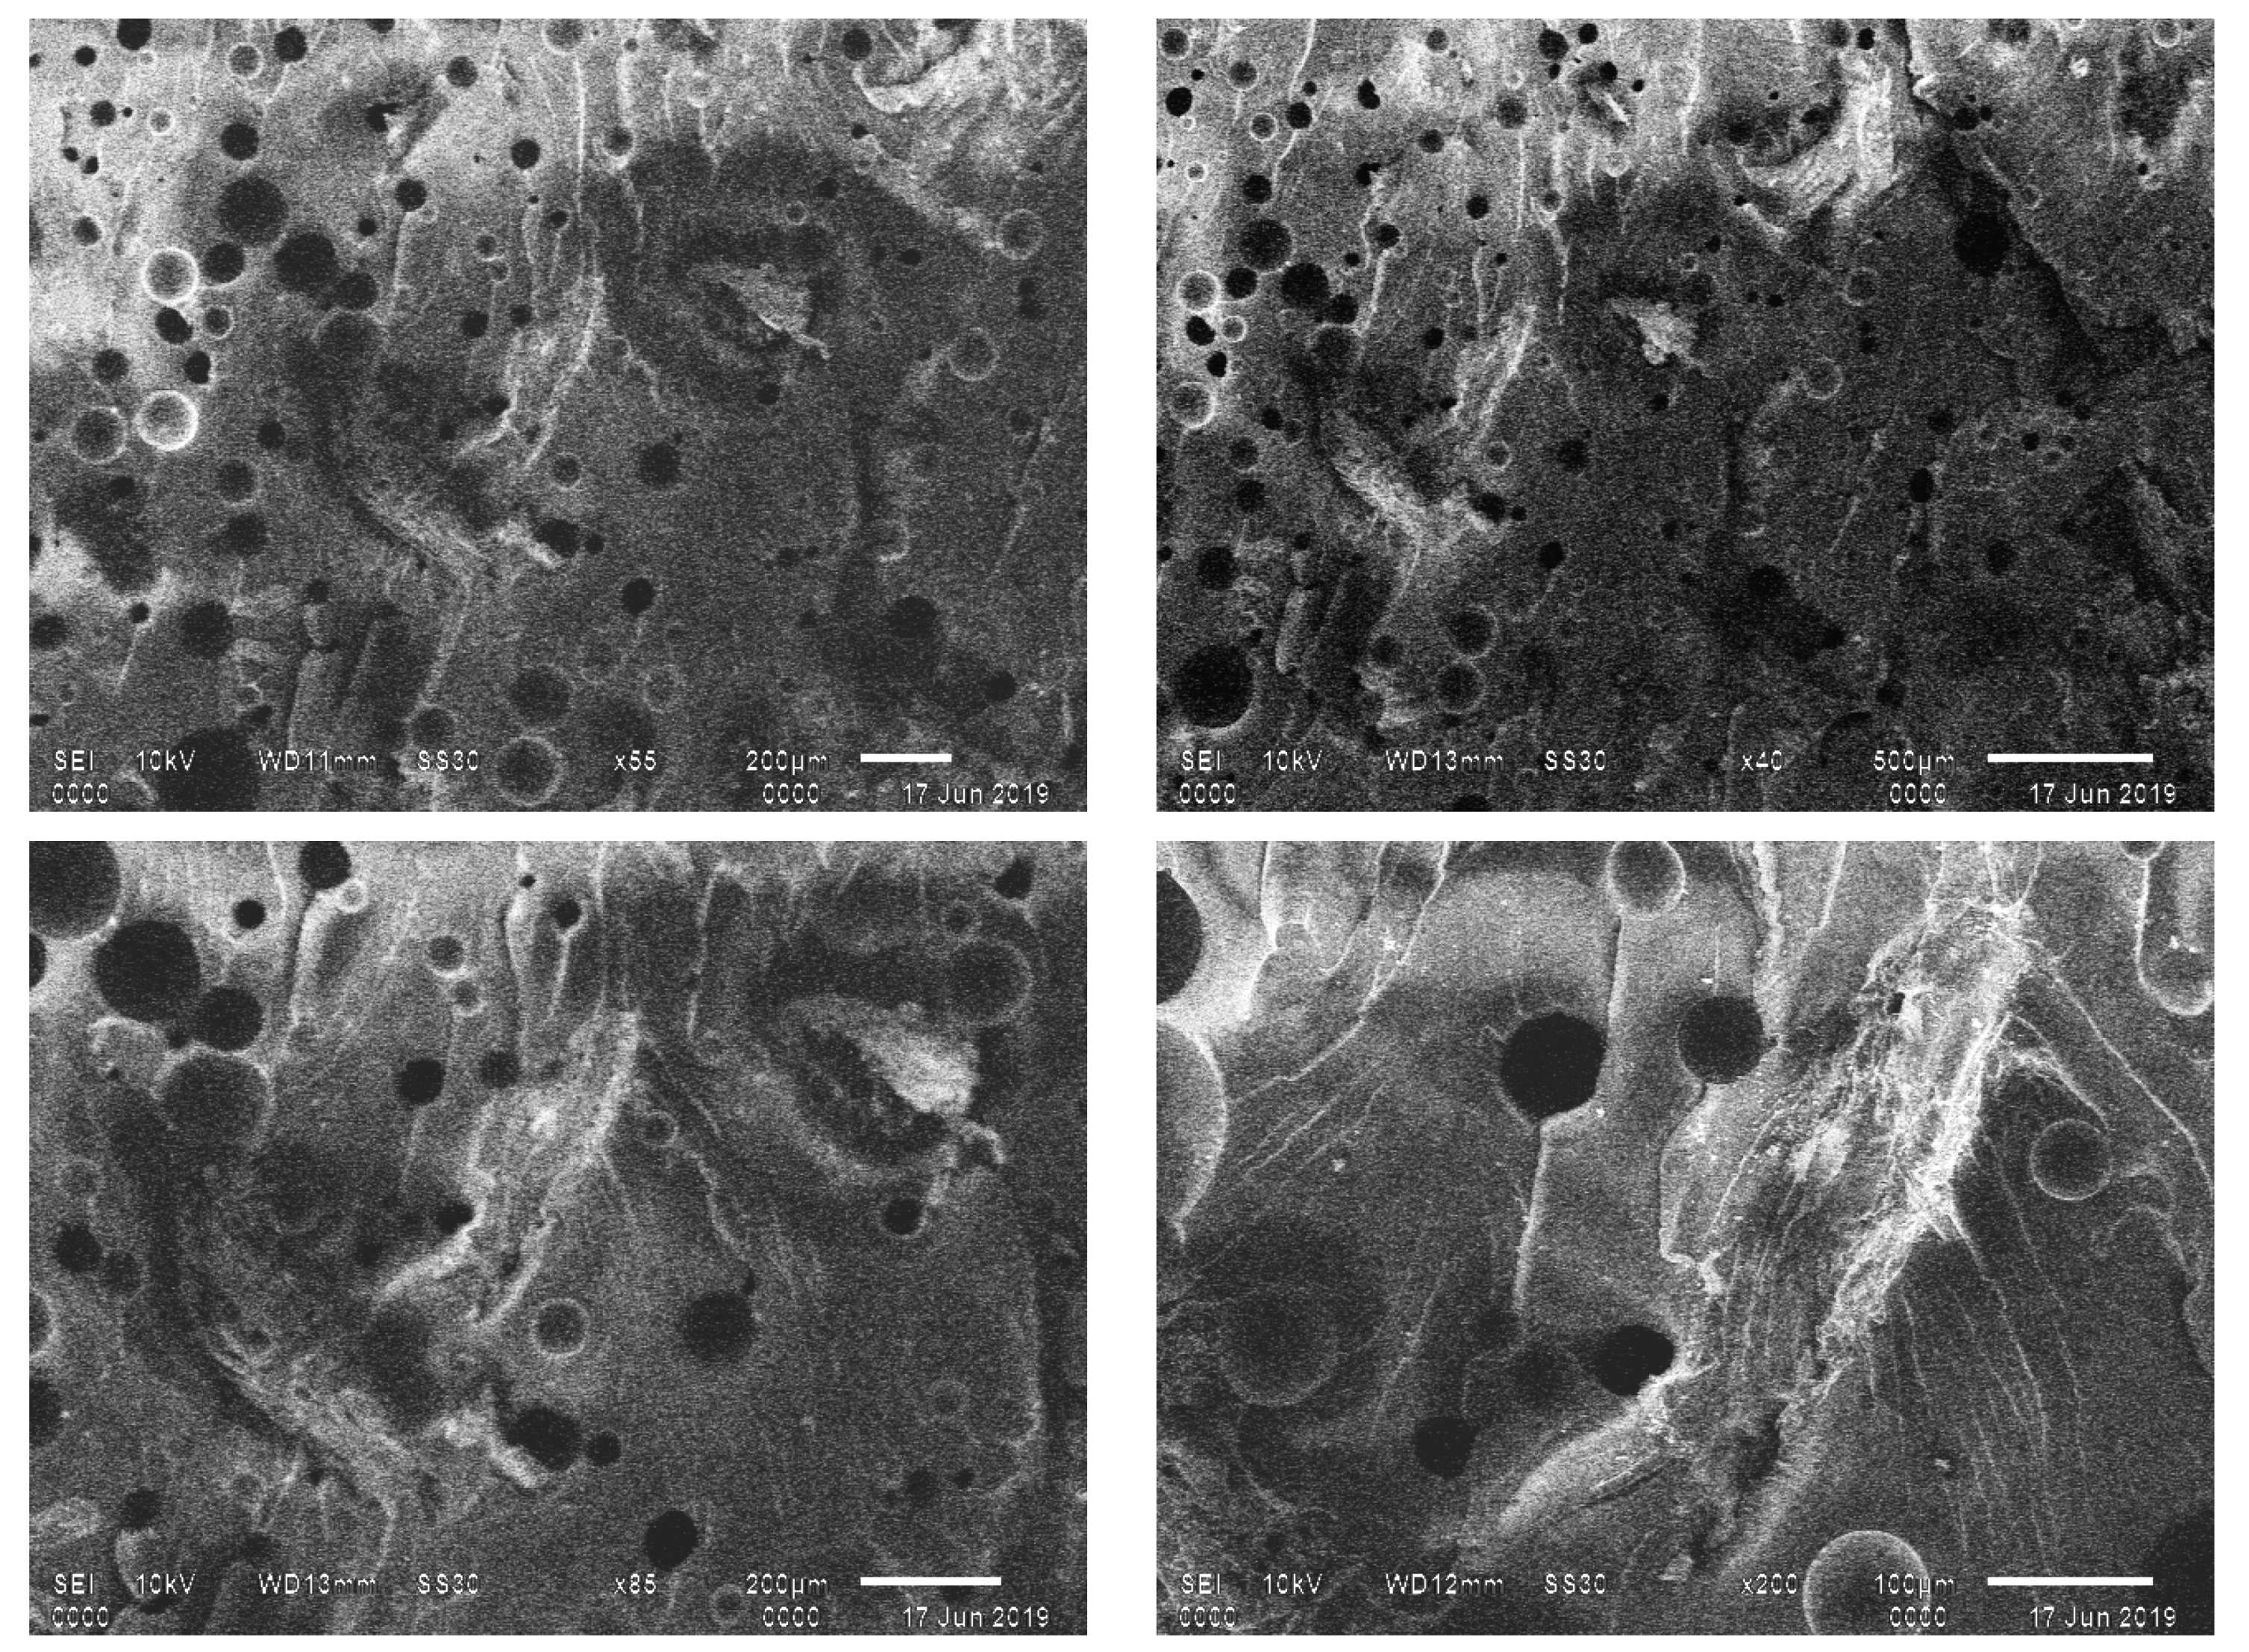
Figure 17.
Experimental derivation of an empirical model (Equation (1)) for the time–temperature variation under DF heating for (a) concrete or (b) CBC-PET10 specimens (T1 bottom face).
Figure 17.
Experimental derivation of an empirical model (Equation (1)) for the time–temperature variation under DF heating for (a) concrete or (b) CBC-PET10 specimens (T1 bottom face).
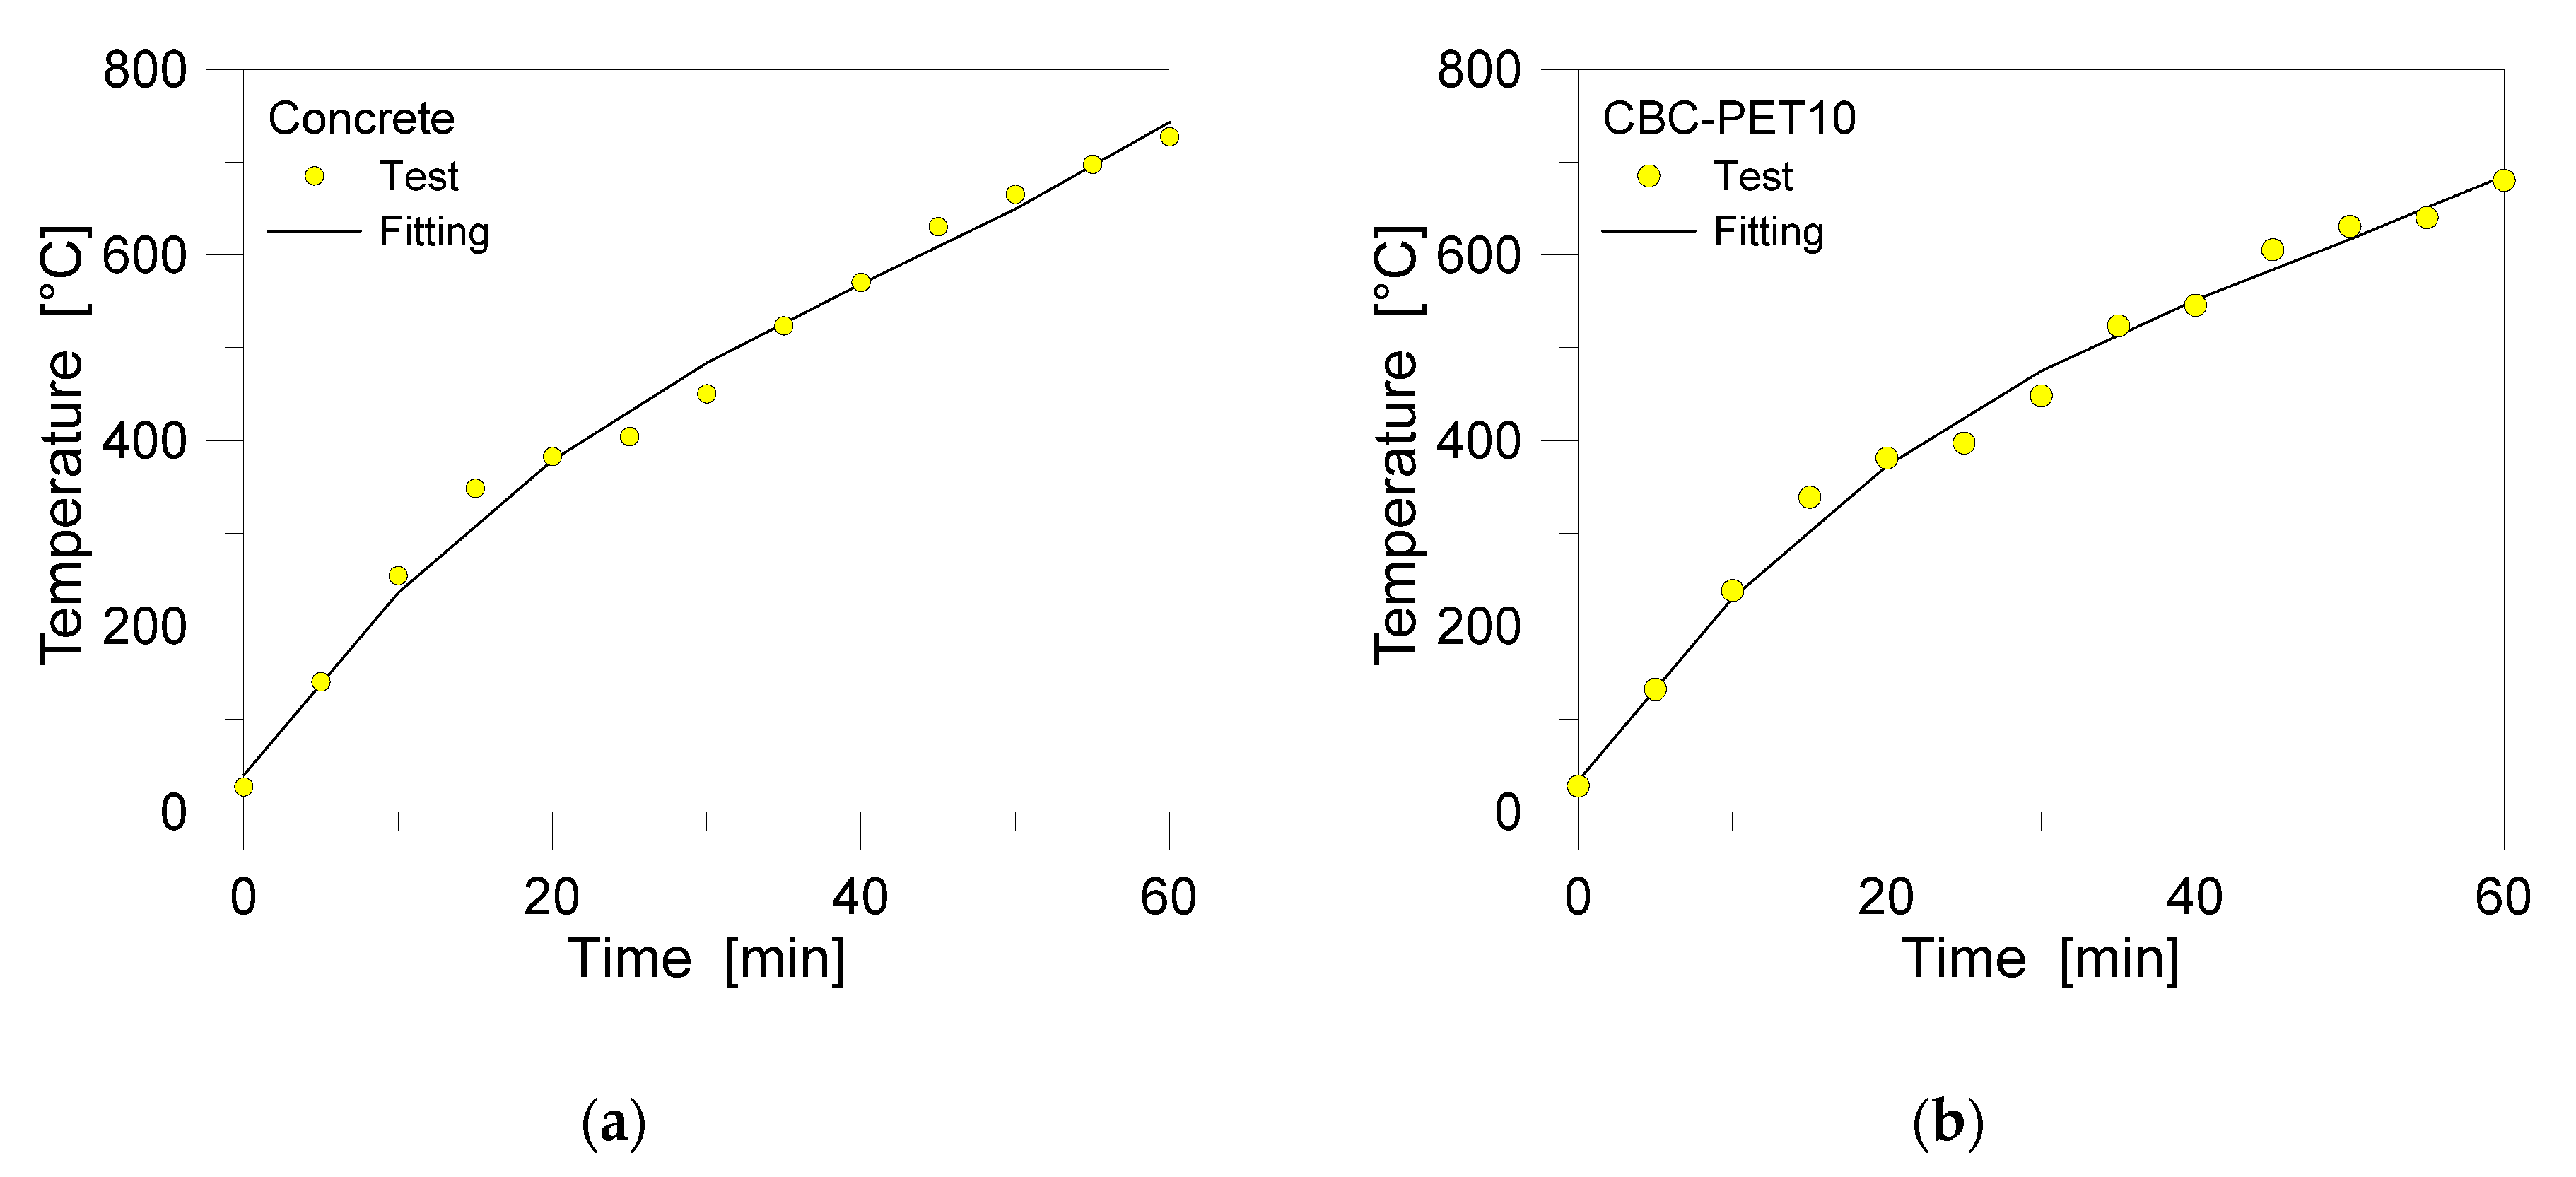
Figure 18.
Experimental derivation of an empirical model (Equation (2)) for the compressive strength variation under 1 h in DF (ISO 834), as obtained for (a) concrete or (b) CBC-PET10 specimens.
Figure 18.
Experimental derivation of an empirical model (Equation (2)) for the compressive strength variation under 1 h in DF (ISO 834), as obtained for (a) concrete or (b) CBC-PET10 specimens.
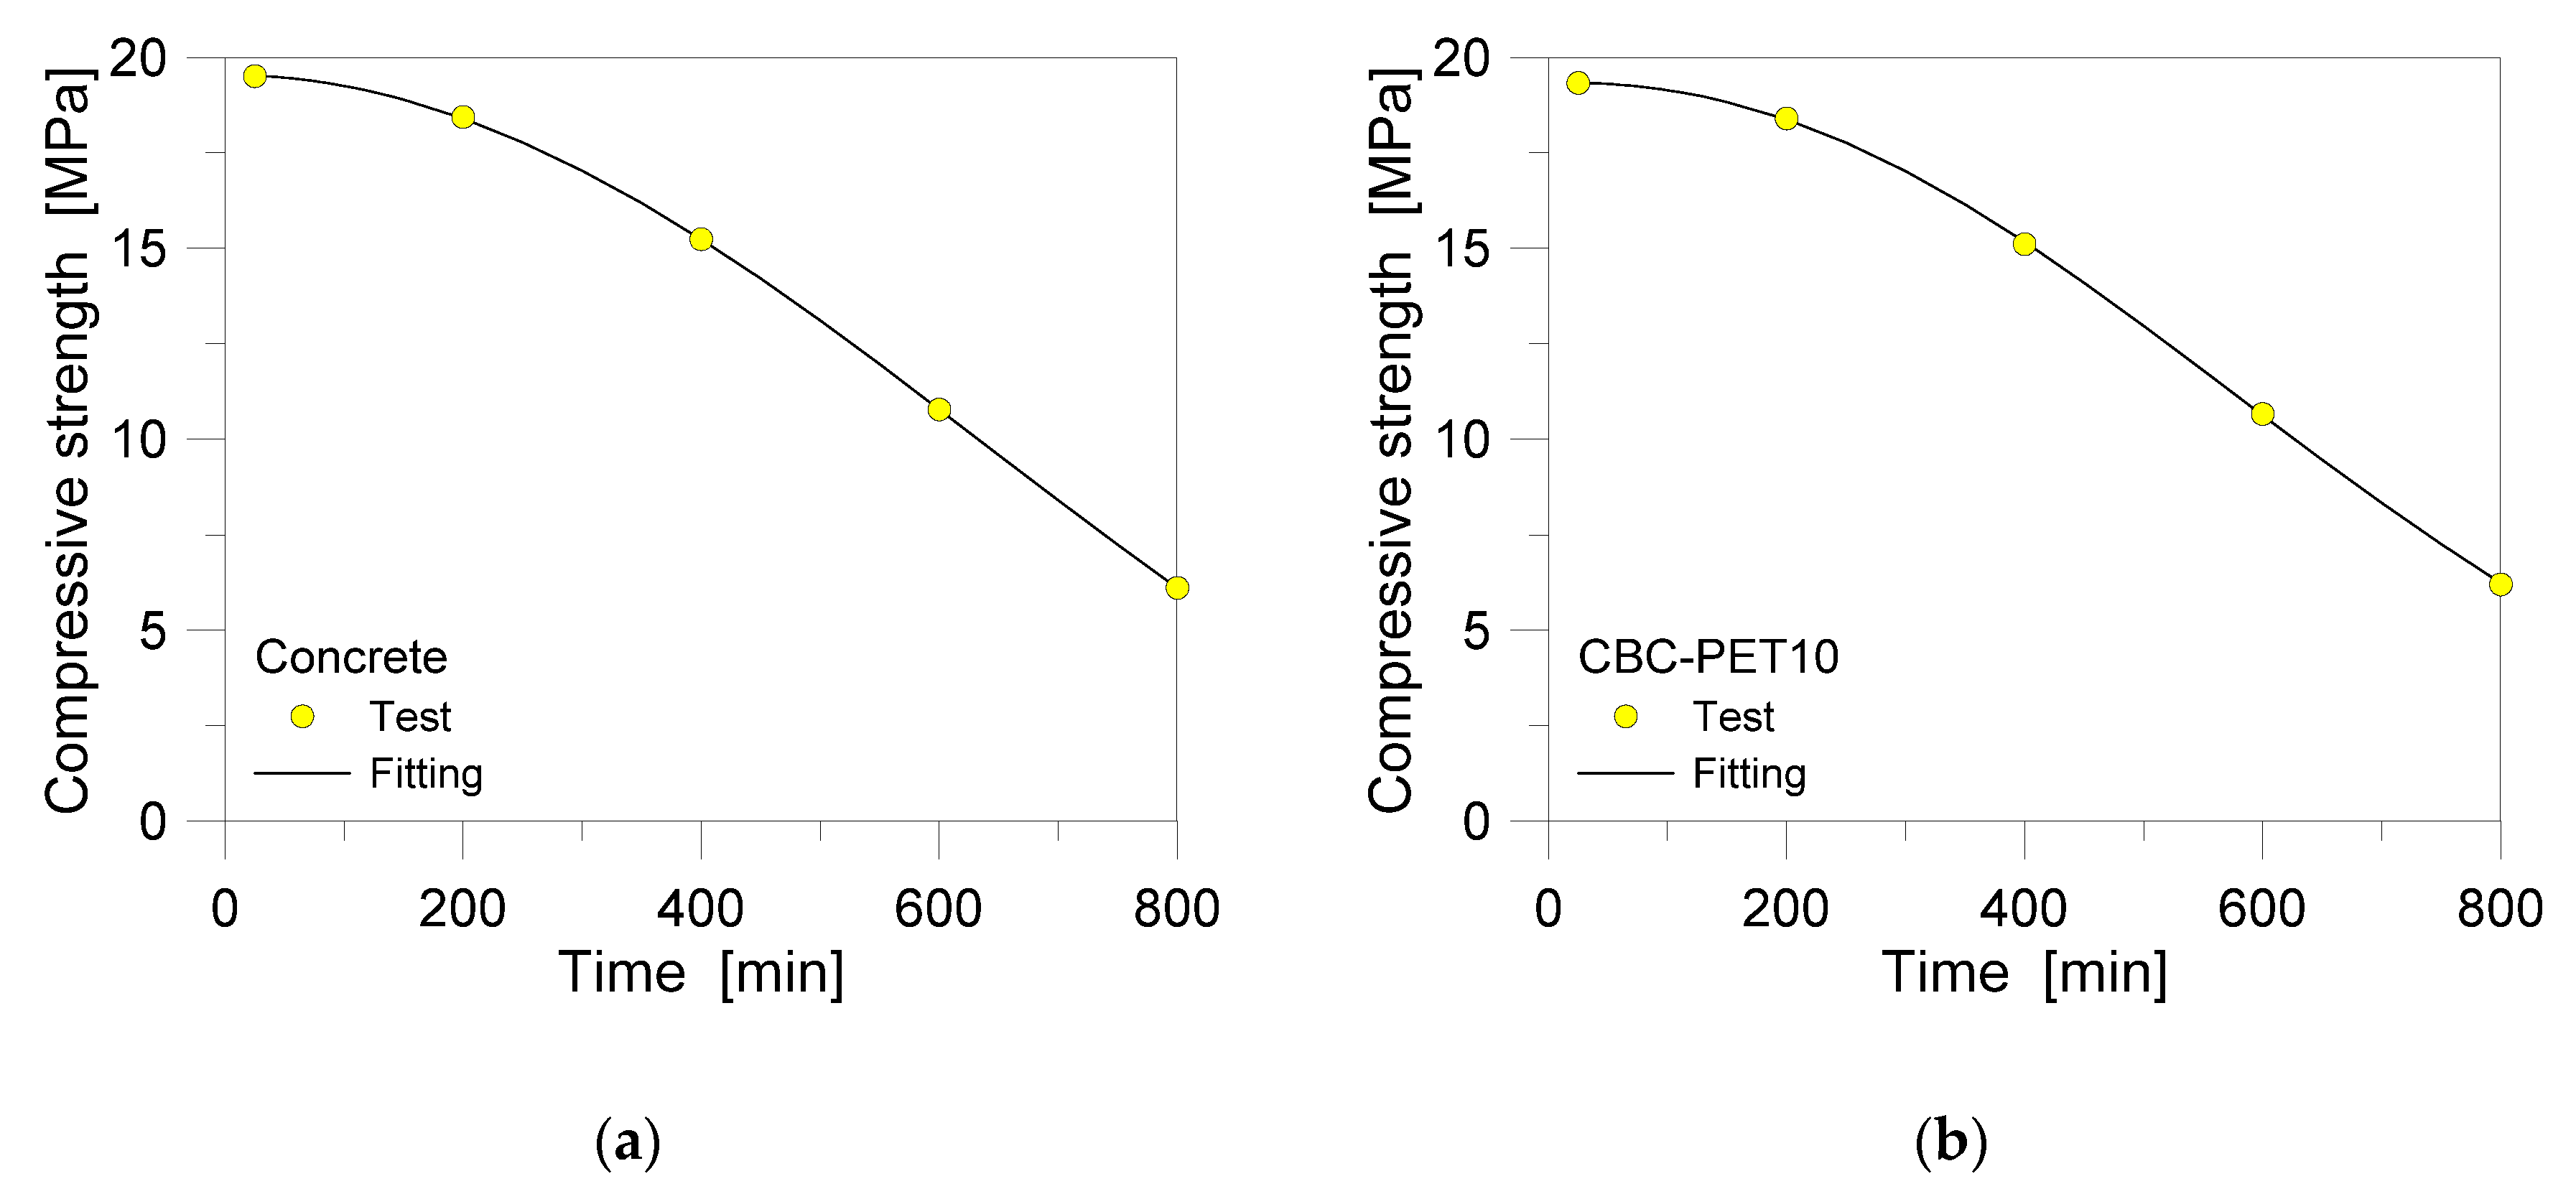
Figure 19.
Derivation of an empirical model for the MoE variation (Equation (3)) in ISO 834 heating for (a) concrete and (b) CBC-PET10 specimens, respectively.
Figure 19.
Derivation of an empirical model for the MoE variation (Equation (3)) in ISO 834 heating for (a) concrete and (b) CBC-PET10 specimens, respectively.
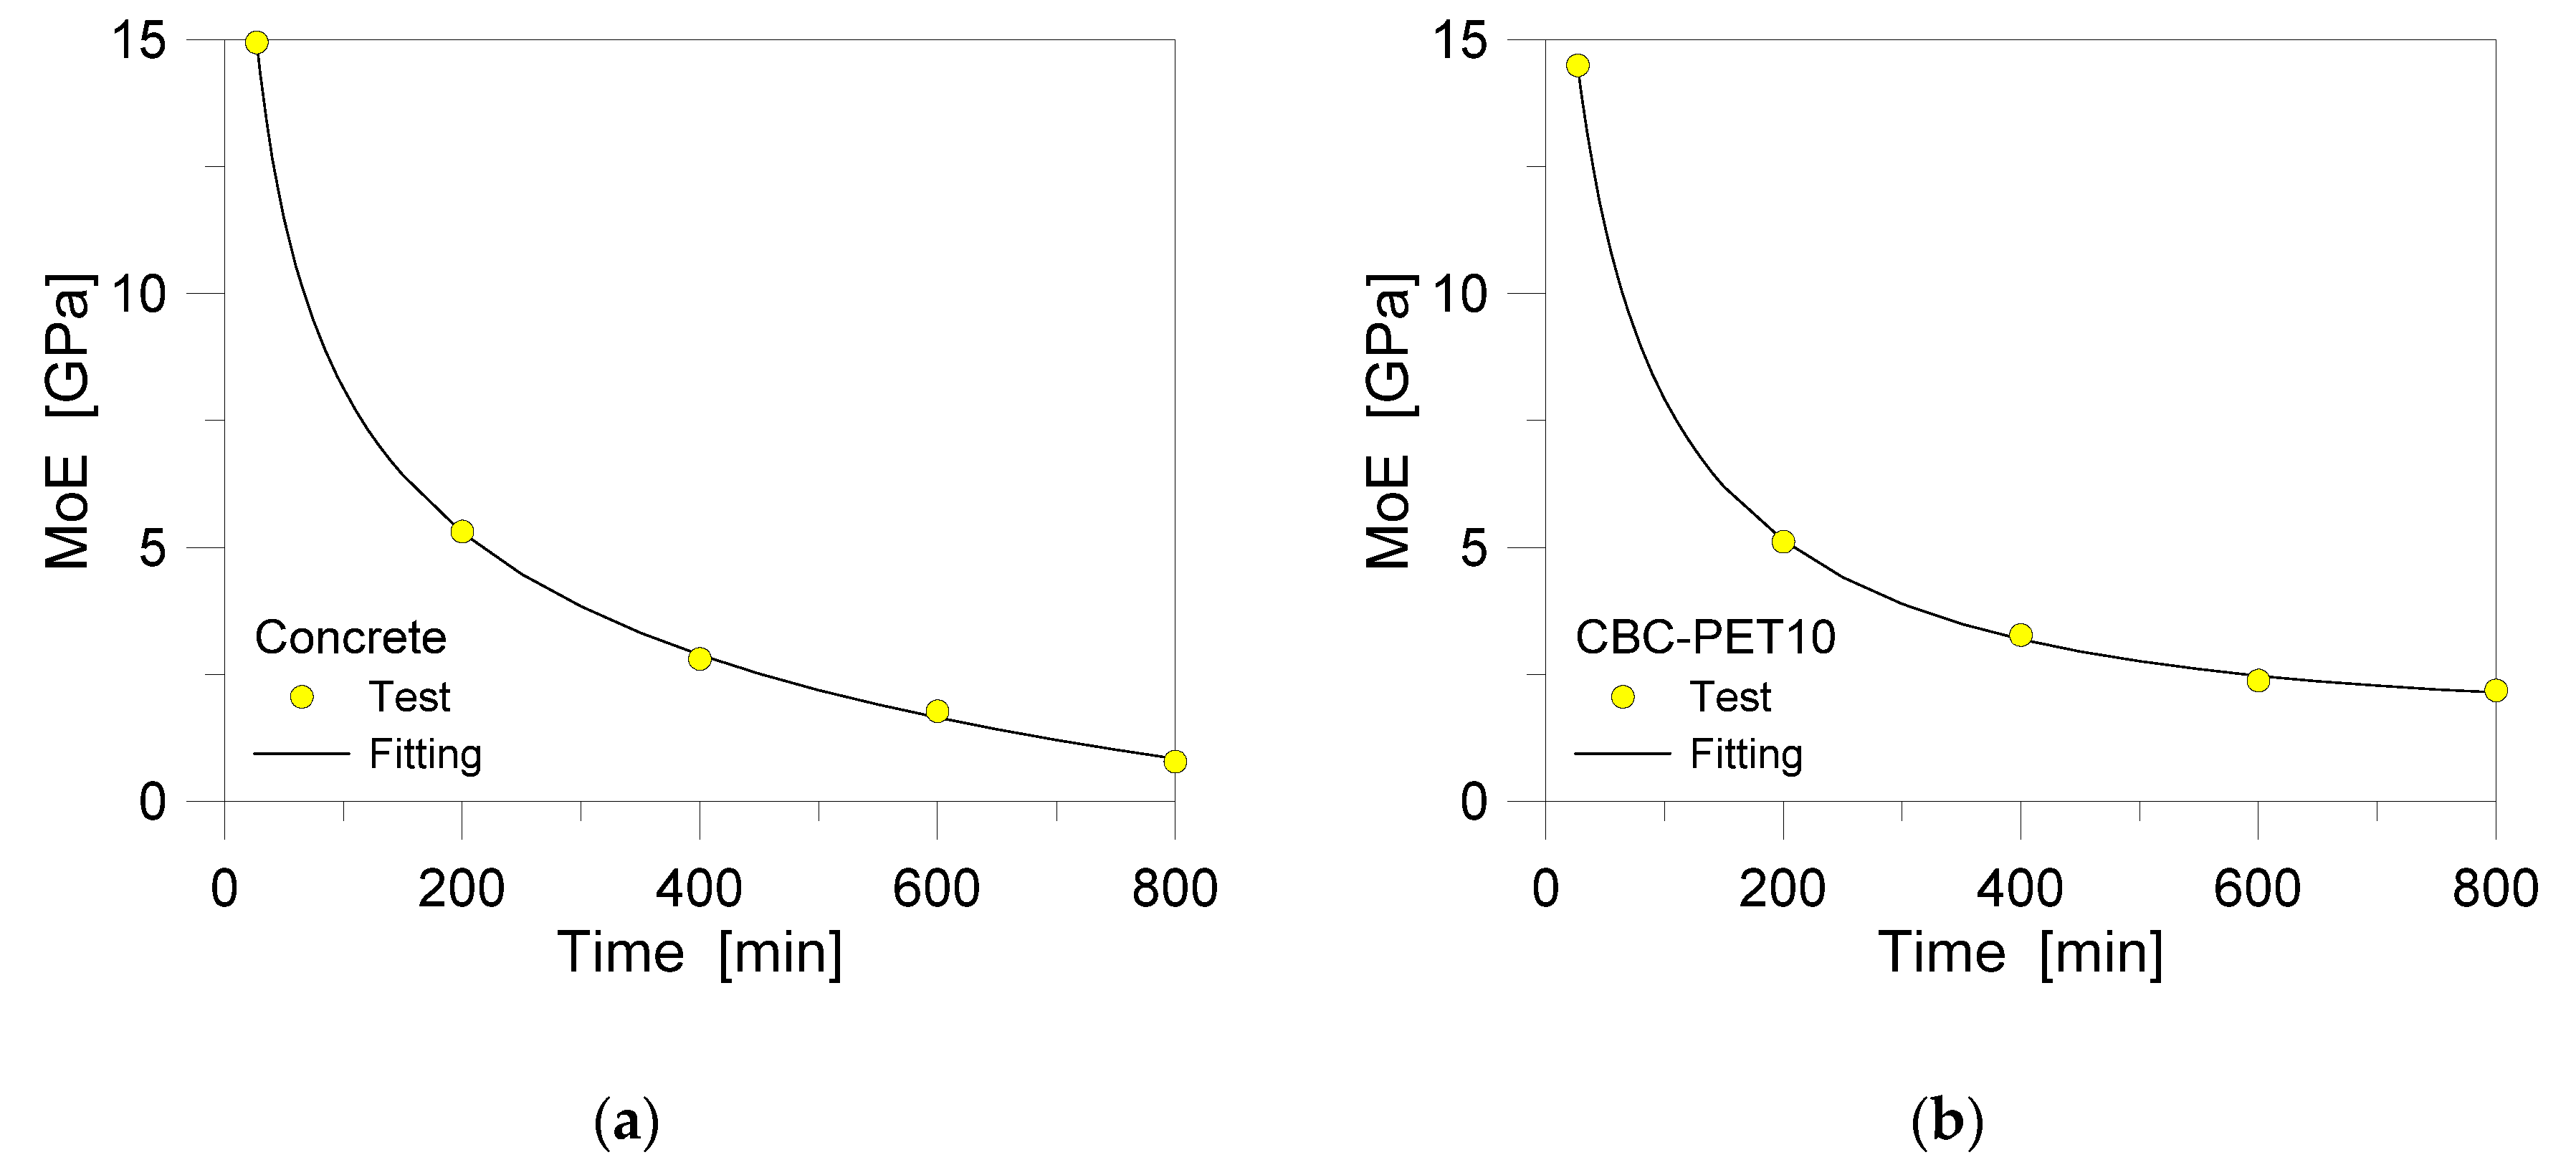
Figure 20.
Compressive stress–strain curve for concrete under elevated temperature (1 h in DF, following ISO 834 provisions). Marked with white diamonds, the maximum peak for each thermal scenario.
Figure 20.
Compressive stress–strain curve for concrete under elevated temperature (1 h in DF, following ISO 834 provisions). Marked with white diamonds, the maximum peak for each thermal scenario.
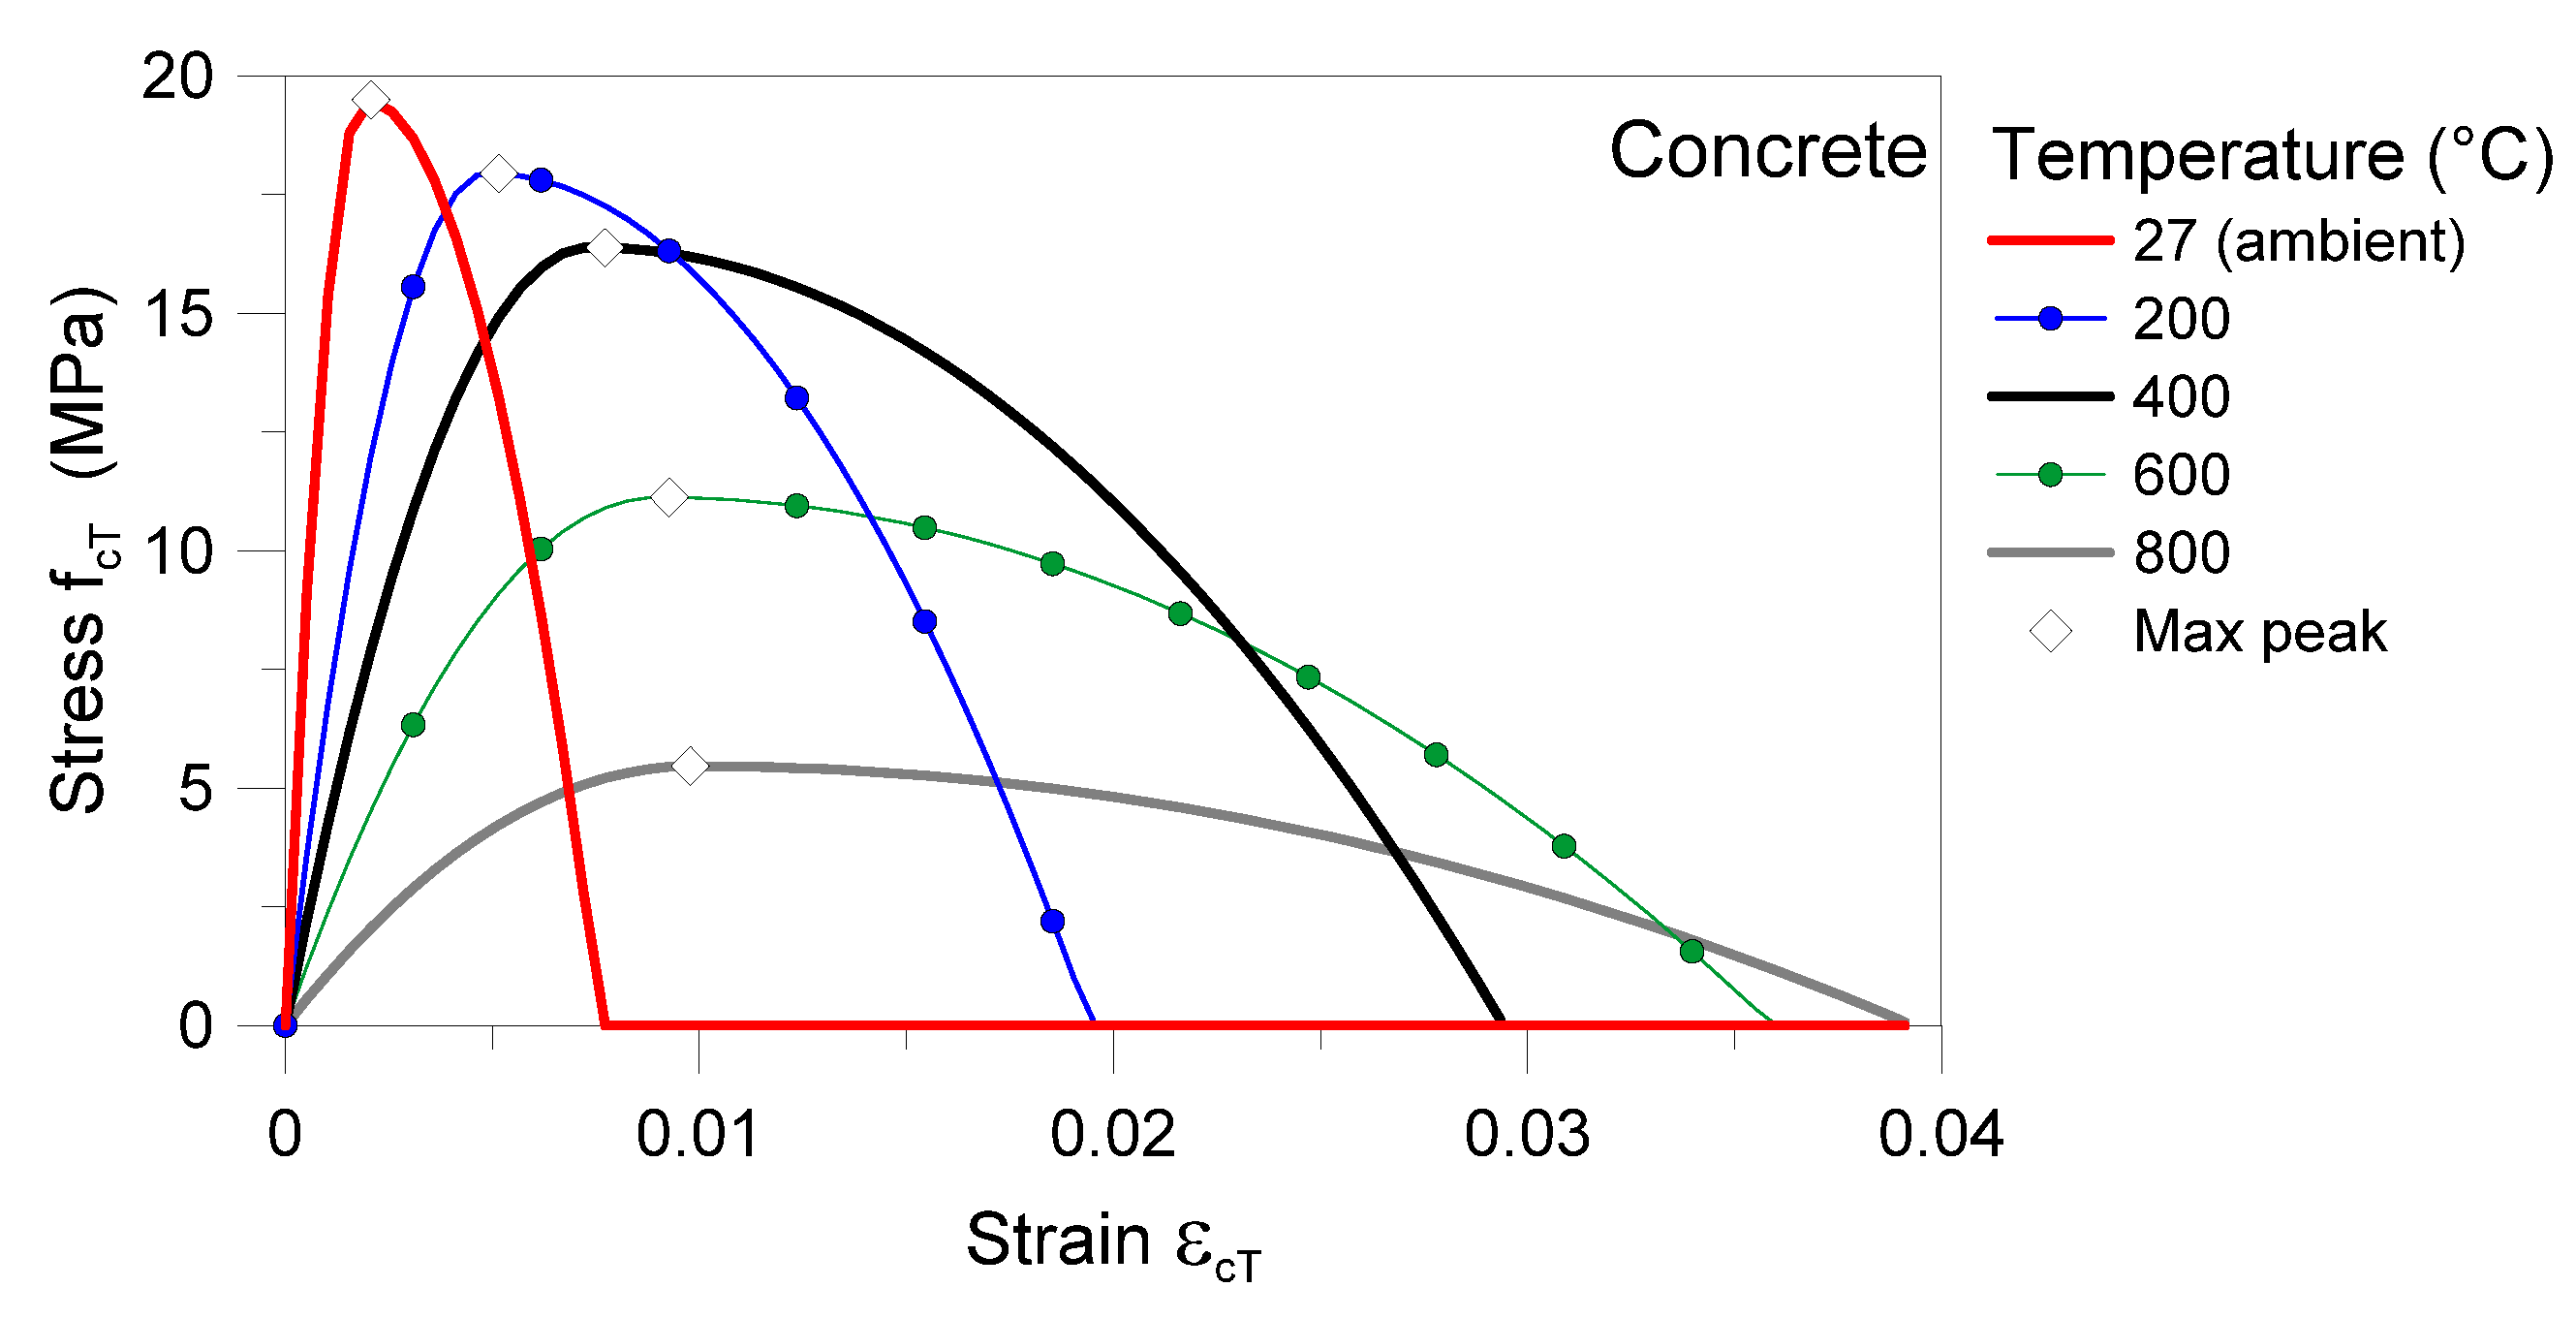
Figure 21.
Compressive stress–strain curve for CBC-PET10 under elevated temperature (1 h heating in DF, following ISO 834 provisions). In evidence with white diamonds, the maximum peak for each thermal scenario.
Figure 21.
Compressive stress–strain curve for CBC-PET10 under elevated temperature (1 h heating in DF, following ISO 834 provisions). In evidence with white diamonds, the maximum peak for each thermal scenario.
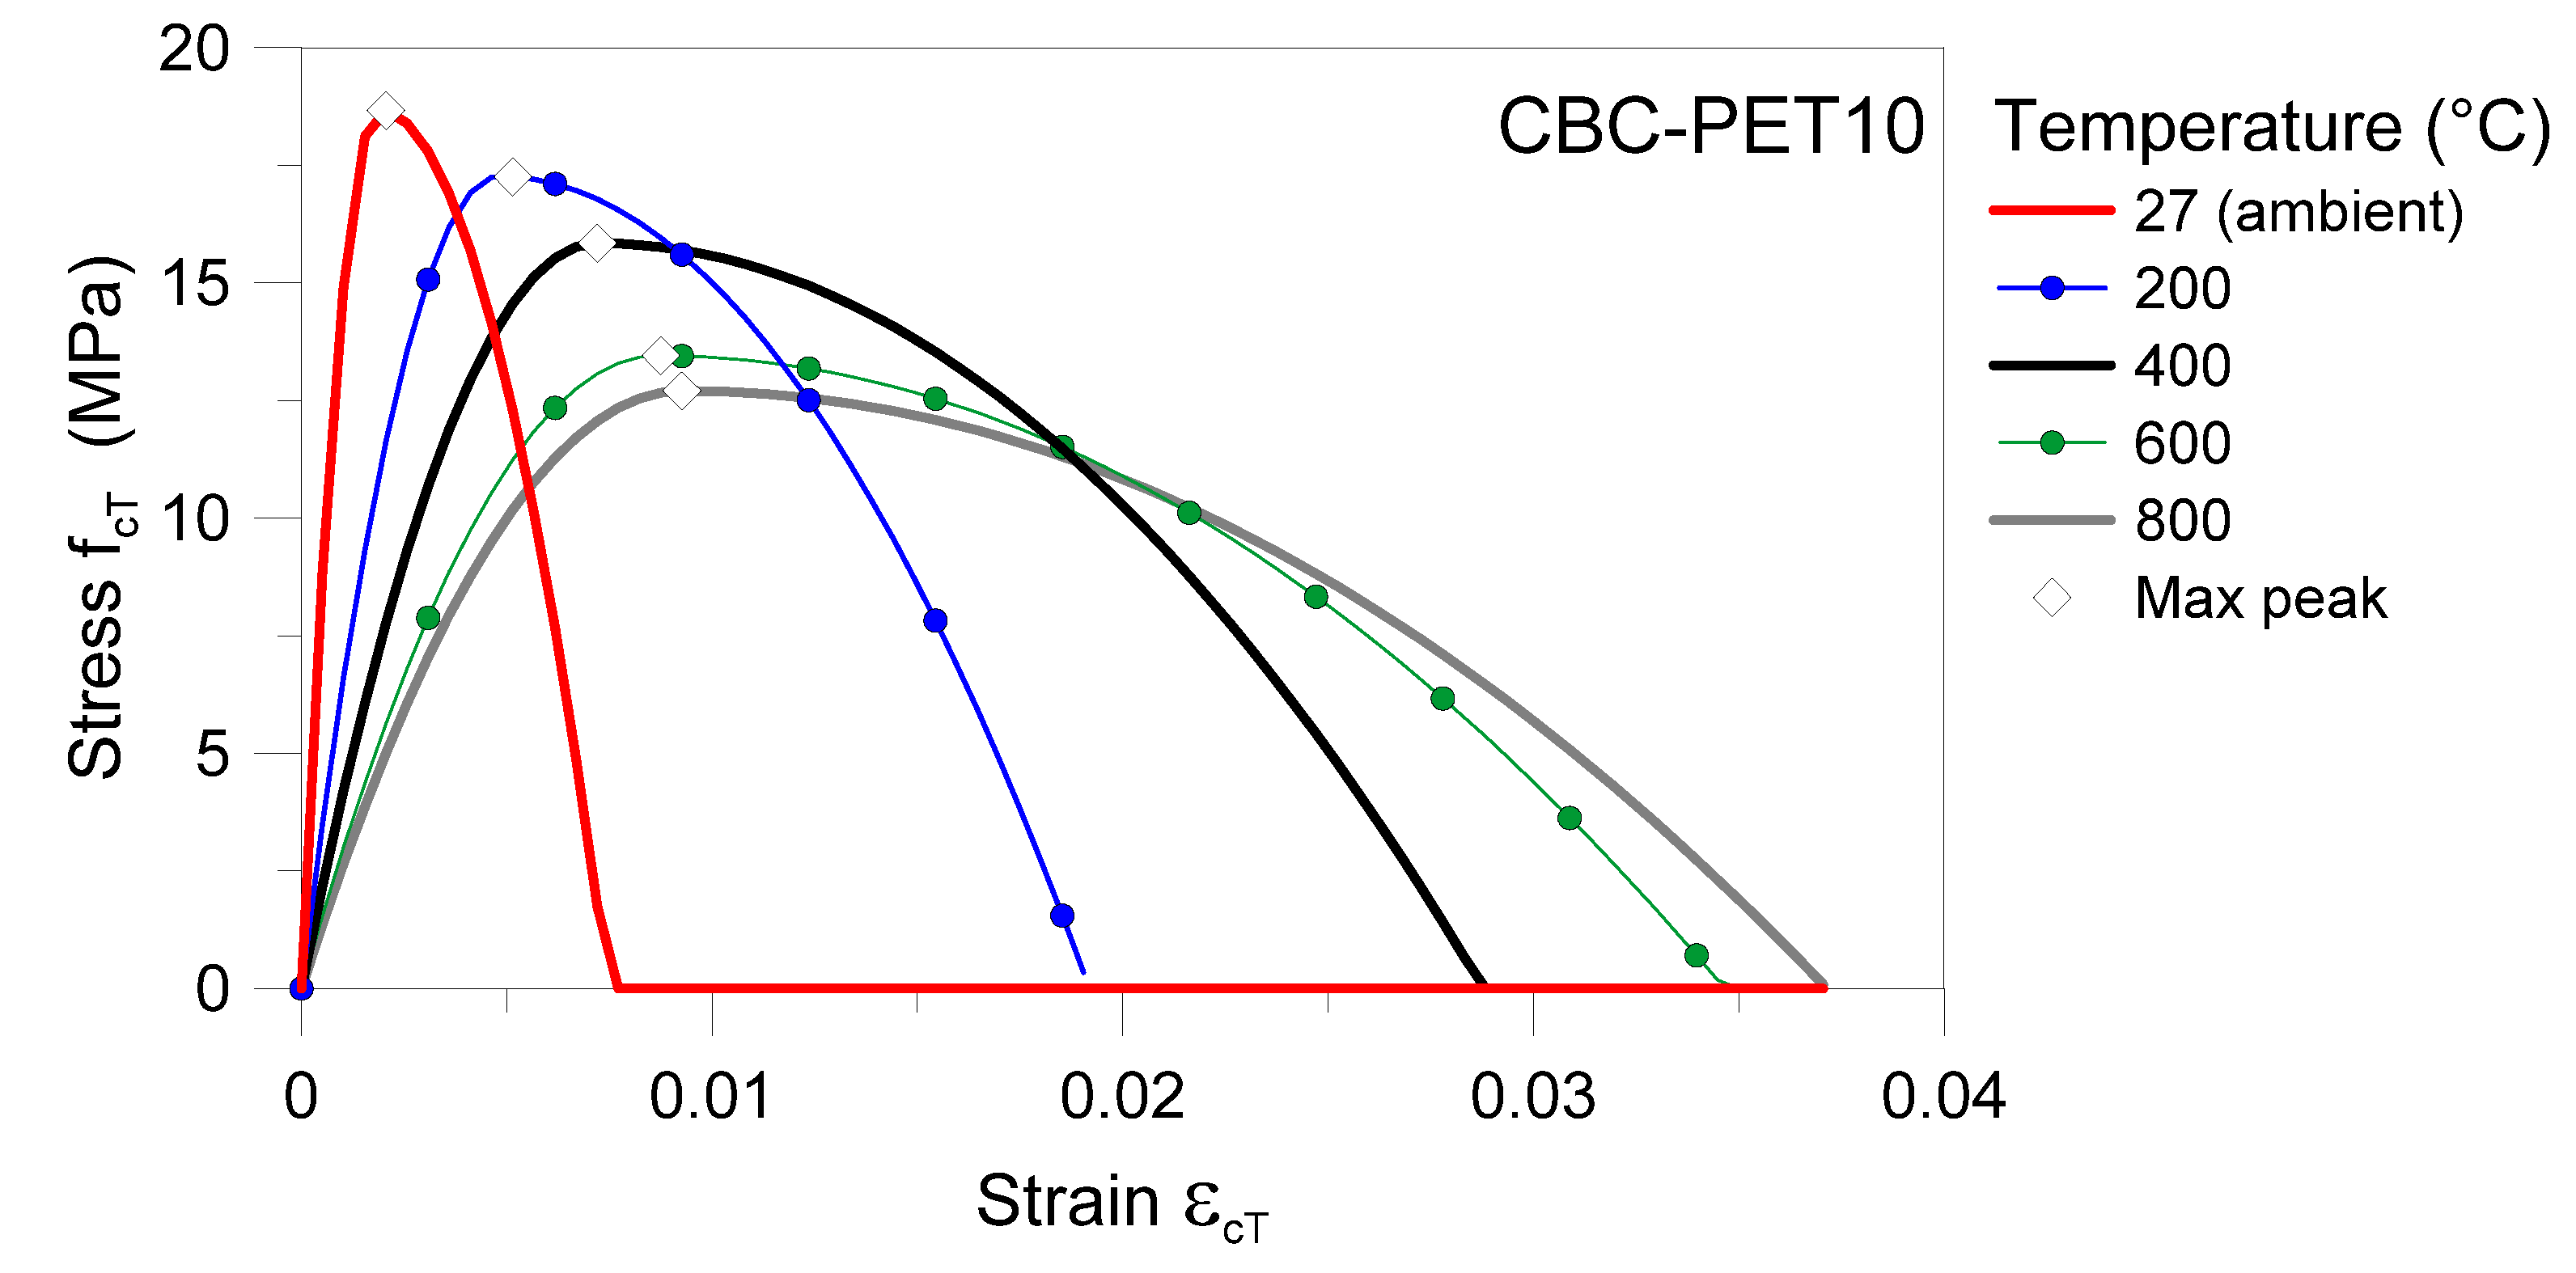
Figure 22.
Post-fire compressive response of concrete and CBC-PET10 specimens under elevated temperature. Evolution with temperature of the maximum stress–strain peaks for the experimental/empirical constitutive laws.
Figure 22.
Post-fire compressive response of concrete and CBC-PET10 specimens under elevated temperature. Evolution with temperature of the maximum stress–strain peaks for the experimental/empirical constitutive laws.

Table 1.
Basic mechanical properties of concrete and CBC components in use.
| Material | Young Modulus (GPa) | Density (kg/m3) | Poisson’s Ratio |
|---|---|---|---|
| Cement | 21.9 | 2050.3 | 0.279 |
| Fine Aggregate | 26.59 | 1472 | 0.24 |
| Coarse Aggregate | 23.49 | 1434 | 0.13 |
Table 2.
Compressive strength (MPa) of concrete and CBC samples after heating following ISO 834 or 1 h in Direct Flame (DF).
Table 2.
Compressive strength (MPa) of concrete and CBC samples after heating following ISO 834 or 1 h in Direct Flame (DF).
| Compressive Strength (MPa) | |||||||
|---|---|---|---|---|---|---|---|
| Concrete | CBC | ||||||
| Rubber Fly Ash | Brick Powder | PET Bottle | |||||
| Temperature (°C)/ Urban Residues Proportion (%) | - | 10 | 15 | 10 | 15 | 10 | 15 |
| 27 (ambient) | 19.51 | 18.64 | 18.2 | 19.33 | 19.11 | 18.68 | 18.64 |
| 200 | 18.44 | 18.2 | 17.9 | 18.4 | 17.96 | 17.4 | 17.11 |
| 400 | 15.24 | 15.62 | 15.55 | 15.11 | 15.02 | 16.78 | 16.63 |
| 600 | 10.78 | 11.01 | 10.66 | 10.66 | 9.99 | 13.21 | 13.11 |
| 800 | 6.11 | 7.9 | 7.3 | 6.2 | 5.86 | 12.99 | 11.87 |
| 1 h in DF | 5.77 | 7.11 | 6.98 | 5.76 | 5.11 | 9.66 | 8.96 |
Table 3.
Young’s modulus (MPa) of concrete and CBC-PET10 specimens after heating (following the ISO 834 provisions and 1 h in Direct Flame (DF)).
Table 3.
Young’s modulus (MPa) of concrete and CBC-PET10 specimens after heating (following the ISO 834 provisions and 1 h in Direct Flame (DF)).
| Young’s Modulus MoE (MPa) | ||
|---|---|---|
| Temperature (°C) | Concrete | CBC-PET10 |
| 27 (ambient) | 1,4941.75 | 1,4489.80 |
| 200 | 5311.78 | 5113.20 |
| 400 | 2803.67 | 3276.07 |
| 600 | 1773.64 | 2378.92 |
| 800 | 782.349 | 2182.86 |
| 1 h in DF | 756.99 | 2101.76 |
Publisher’s Note: MDPI stays neutral with regard to jurisdictional claims in published maps and institutional affiliations. |
© 2020 by the authors. Licensee MDPI, Basel, Switzerland. This article is an open access article distributed under the terms and conditions of the Creative Commons Attribution (CC BY) license (http://creativecommons.org/licenses/by/4.0/).
Share and Cite
MDPI and ACS Style
Vedrtnam, A.; Bedon, C.; Barluenga, G. Study on the Compressive Behaviour of Sustainable Cement-Based Composites under One-Hour of Direct Flame Exposure. Sustainability 2020, 12, 10548. https://doi.org/10.3390/su122410548
AMA Style
Vedrtnam A, Bedon C, Barluenga G. Study on the Compressive Behaviour of Sustainable Cement-Based Composites under One-Hour of Direct Flame Exposure. Sustainability. 2020; 12(24):10548. https://doi.org/10.3390/su122410548
Chicago/Turabian StyleVedrtnam, Ajitanshu, Chiara Bedon, and Gonzalo Barluenga. 2020. "Study on the Compressive Behaviour of Sustainable Cement-Based Composites under One-Hour of Direct Flame Exposure" Sustainability 12, no. 24: 10548. https://doi.org/10.3390/su122410548
Note that from the first issue of 2016, this journal uses article numbers instead of page numbers. See further details here.