Article

From Subjective and Objective Perspective to Reconstruct the High-Quality Tourism Spatial Structure―Taking Gannan Prefecture in China as an Example

College of Geography and Environmental Science, Northwest Normal University, Lanzhou 730000, China
*
Author to whom correspondence should be addressed.
Sustainability 2020, 12(3), 1015; https://doi.org/10.3390/su12031015
Submission received: 2 December 2019 / Revised: 16 January 2020 / Accepted: 29 January 2020 / Published: 31 January 2020

Abstract

:
Spatial relationship is the basic perspective of understanding regions. Tourism spatial structure is the spatial projection of tourism activities, reflecting the spatial attributes and interrelationships of tourism activities. In this paper, taking Gannan Tibetan Autonomous Prefecture as an example, we identified the objective and subjective tourism spatial structure of Gannan Prefecture based on the GIS spatial analysis function and using objective and subjective tourist attractions as the spatial object element. Then, the tourism spatial network was reconstructed. Results are as follows. (1) Both objective and subjective tourist attractions in Gannan Prefecture exhibit aggregated distribution. Among them, the spatial distribution of objective tourist attractions has a significant trend of contiguous aggregation, showing a relatively higher density in the northeastern and southeastern regions, and a lower density in the central and southwestern regions. This is opposite to that of the subjective tourist attractions. (2) The connectivity and accessibility between objective and subjective tourist attractions in Gannan Prefecture are poor, and only a few tourist attractions form a traffic connection with neighboring ones. (3) The objective tourism spatial network of Gannan Prefecture is layered with aggregation, and presents a significant cohesive development trend. This is opposite to the subjective one. (4) Based on the identification results of objective and subjective tourism spatial structures, the objective and subjective core tourism resources as well as tourist attractions should be integrated, and the road transportation system should be constructed and improved. Then, a high-quality tourism spatial network with ‘three poles, three axes and four groups’ was constructed. This study provides a scientific basis for the tourism spatial development, tourist route organization, the layout of tourism service facilities and product, and tourism spatial optimization in specific regions.

1. Introduction

Since the 1960s, foreign scholars have been deeply worried about the negative impact of tourism on the environment, and have criticized and questioned the development of tourism from different perspectives [1]. After entering the 1990s, the rapid development of tourism has led to climate change and environmental degradation and other issues, which have gradually been widely concerned by international organizations, all sectors of society, experts and scholars [1]. Pang et al. research results show that tourism may be one of the biggest economic victims of climate change, and at the same time, tourism is also an important factor causing greenhouse gas emissions [2]. The increasing energy consumption and carbon emission of tourism has become an important factor affecting global climate change, and the carbon emission of tourism has also become one of the important sources of global greenhouse gas emissions [1]. However, overtourism not only intensifies the greenhouse gas emissions, but also threatens the social carrying capacity of tourism destinations to changes the lifestyle of residents and threatens the social welfare [3]. Reasonable tourism planning plays an important role to effectively promote regional economic development, optimize resource allocation, and even improve the well-being of ordinary people [4].
Spatial relationship is the basic perspective of understanding region [5]. In general, the spatial relationship can be abstracted into a network system composed of nodes and edges [6]. This spatial structure reflects the organizational form of human economic and cultural activities in certain geographical regions [7]. Tourism resources are important node-type elements of the tourism spatial structure. The spatial structure of tourism resources has attracted great attentions from researchers. In the 1960s, Leiper and Gunn first proposed the concept of tourism spatial system [8,9]. Then, based on the core-edge theory [10], point-axis theory [11], growing pole theory [12], social network theory, etc., researchers have studied the distribution and function of tourism space [13], the geospatial distribution and relationship of tourism activities [14,15], the spatial organization of tourist attractions [16], the evolution process of tourism spatial model and structure [17], etc. For most of these researches, the tourism spatial structure was constructed by using the objective tourism resource (the tourist attraction, intangible cultural heritage, relic, etc.) as nodes as well as the road as the axis [18]. Great attentions have been paid to the relationship and attribute of network.
With the advent of economic globalization and information, the scale of the network is expanding, the complexity of the network is increasing, and the relationship between people and the network is getting closer. The application of Internet technology has accelerated the rapid development of tourism. Tourists express opinions, obtain information and contact with each other through interactive platforms, such as social networking tools, OTA website forums and travel product websites. This has been an important part of Internet users’ online life. Tourists are the main body of tourism activities. Network records, such as travel notes, covering a wide range of data types, including texts, pictures, geographical location information, etc., provide rich tourist information sources. Thus, the tourism digital footprint has gradually formed. American scholar Girardin et al. first proposed and defined the ‘tourism digital footprint’, which is the message and call record sent by tourists during the trip, as well as the text and picture left in the information system, such as the network after the trip [19]. It provides a new perspective for researchers to study the trajectory and consumption behavior of tourists in geographical space. In recent years, using the tourism digital footprint as a data source, many researchers have studied the time and spatial behavior of tourist [20], the perceived image of tourism destination [21,22], and tourism situation in the geographical space of tourism destinations [23], etc. A number of research results have been achieved. However, due to the limitation of data acquisition, the above research constructed the tourism spatial structure only from the perspective of objective tourism resource (the tourist attraction, intangible cultural heritage, relic, etc.) or the travel note, ignoring the comprehensive influence of them on the tourism spatial network and the geospatial characteristics. The construction of the spatial structure of subjective tourism destinations is still in its infancy. In addition, with the advancement of tourism spatial system theory and the application of mathematical analysis method, the spatial structure of tourism resources based on spatial topology theory has attracted more and more attention. According to the flow of tourists and the distribution of tourism resources, how to effectively organize the reasonable tourism spatial structure and tourist route is one of the important issues that need to be solved in tourism development and planning procedures.
Based on the analyses of tourism resources, the tourist spatial pattern and their spatial correlation, this paper constructed both the objective and subjective tourism spatial structures using TOP spatial network analysis tools, and conducted preliminary research on the spatial network structure of tourist attractions. Then, the tourism spatial structure was reconstructed with the objective and subjective evaluation results, forming a high-quality tourism spatial pattern. This provides a scientific basis for the tourism spatial development, tourist route organization, the layout of tourism service facilities and product, and tourism spatial optimization in specific regions. In addition, the research results have certain theoretical and practical significance for enriching the research theory of tourism network as well as guiding the optimization and reconstruction of tourism space.

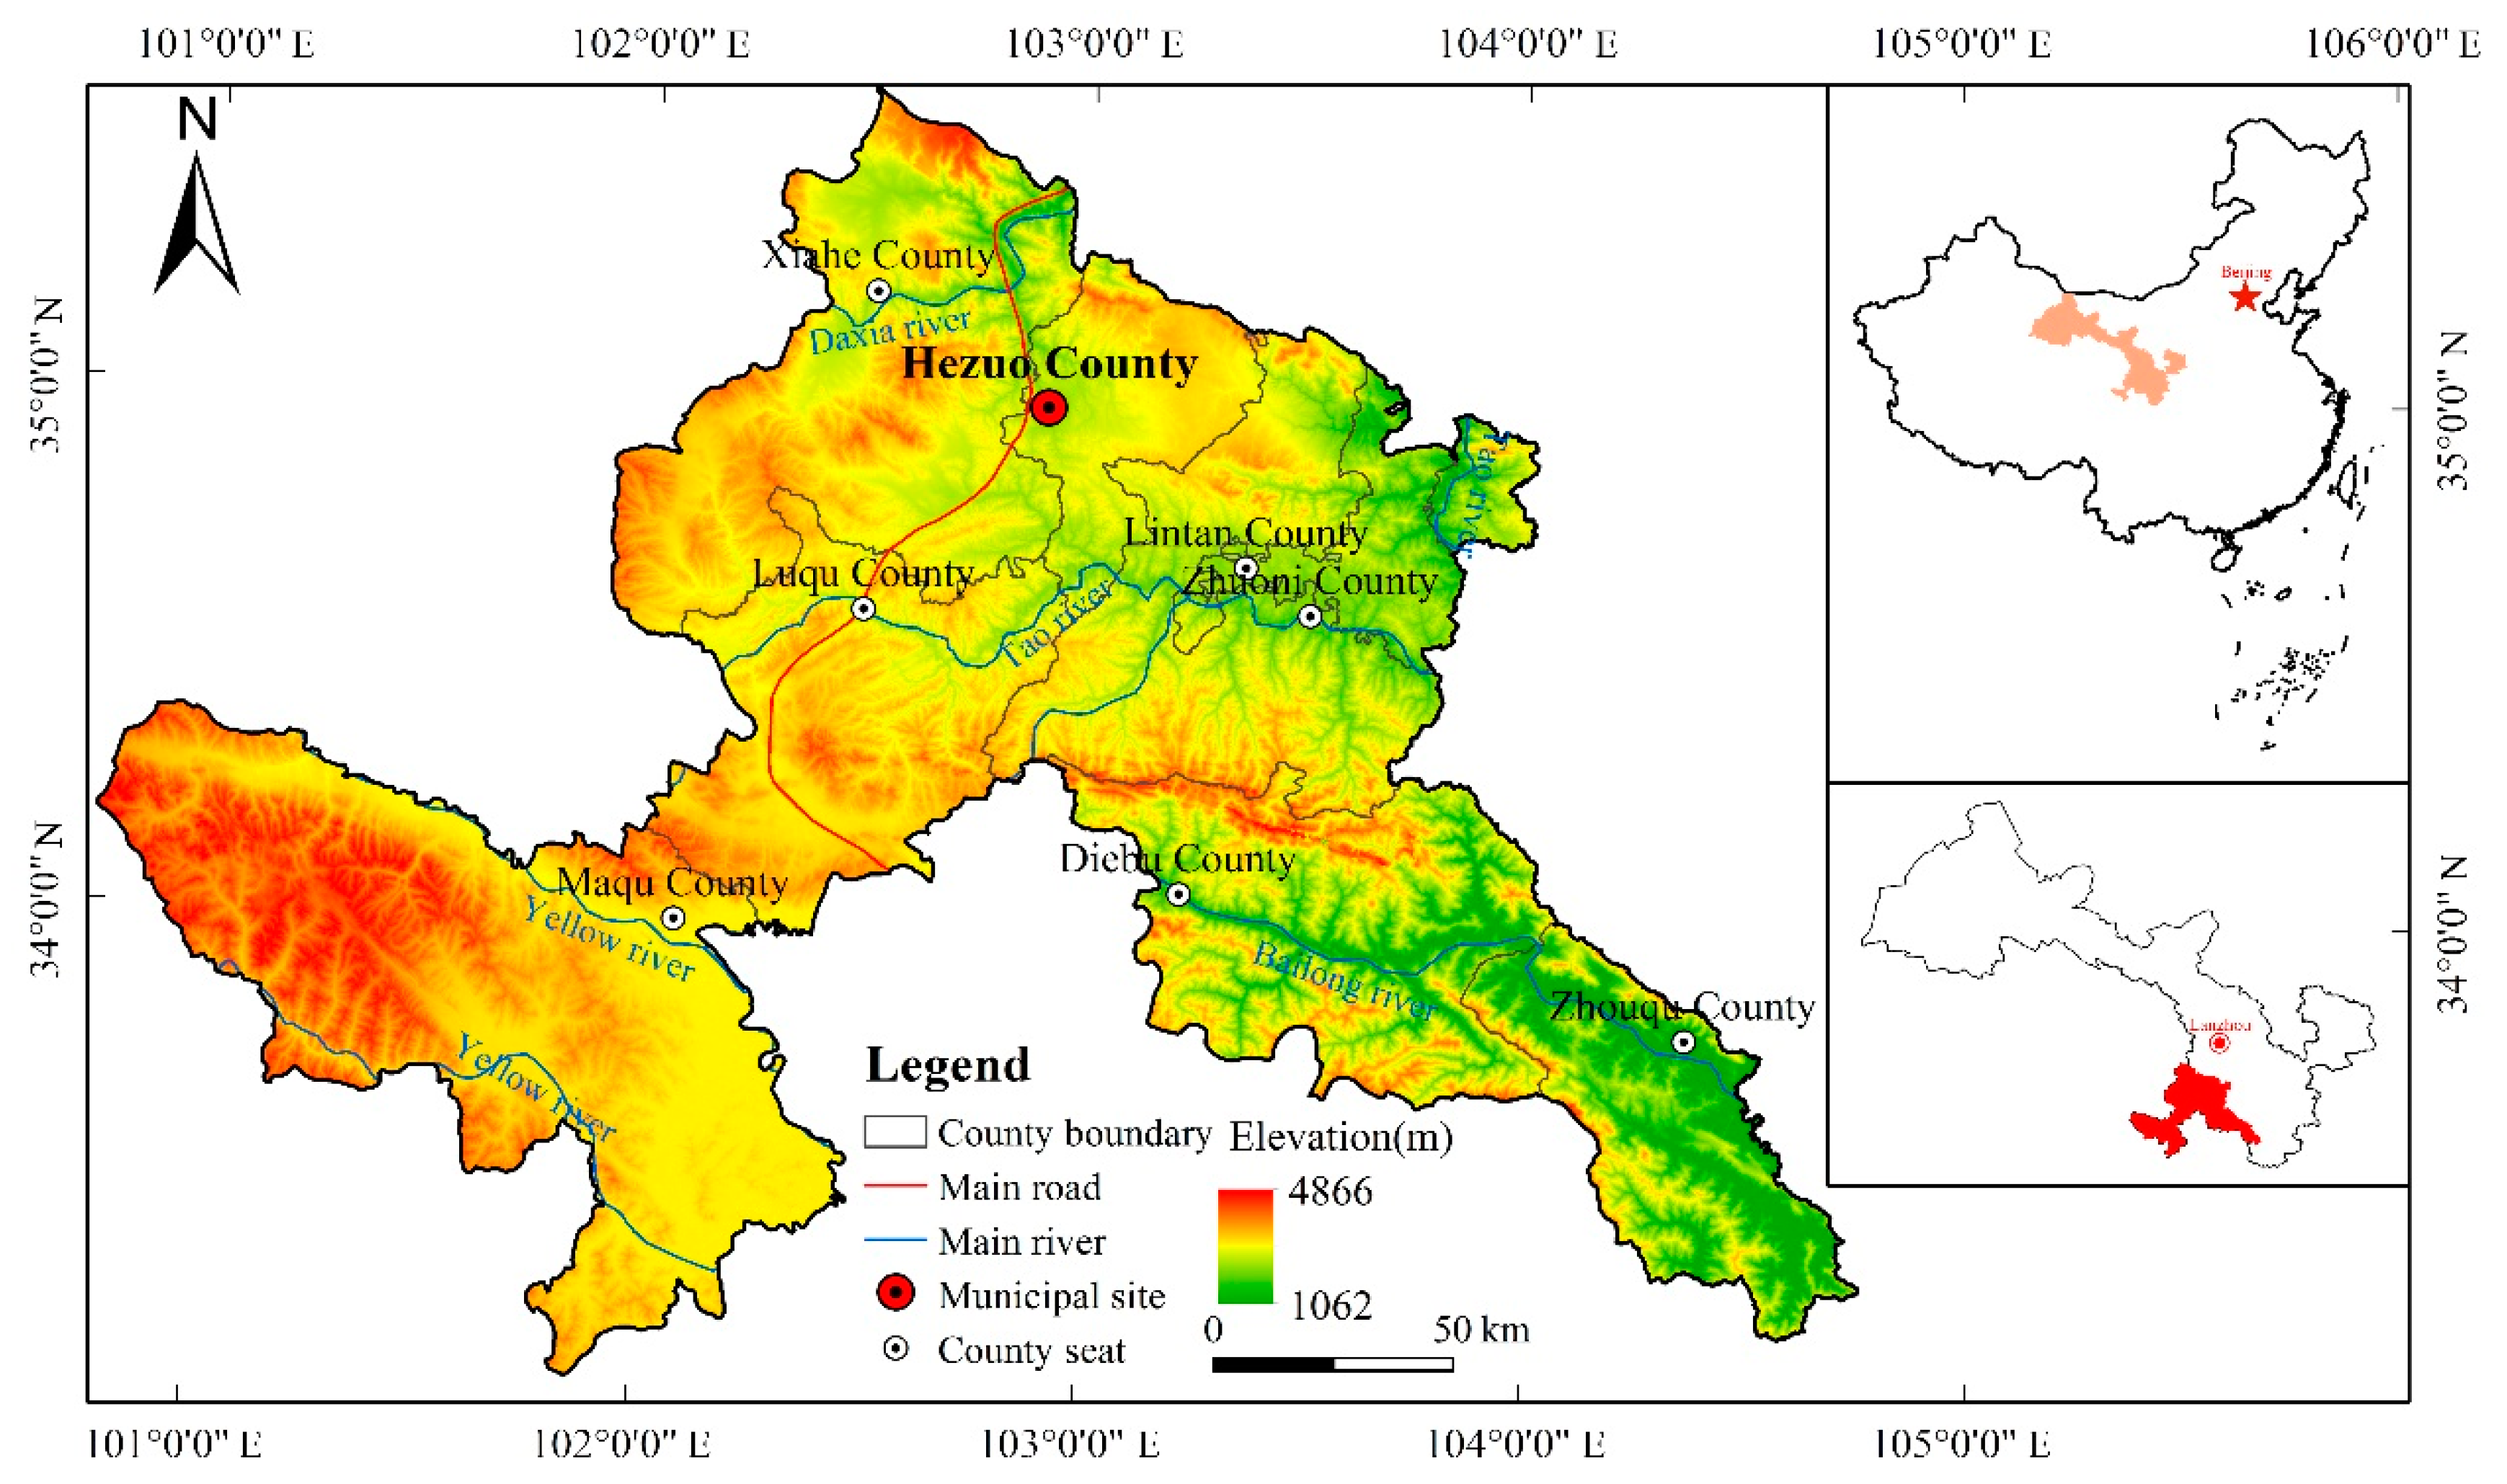
2. The Overview of Research Region

Gannan Tibetan Autonomous Prefecture is located in the southwestern part of Gansu Province, China. It is between 100°45′ and 104°45′ east longitude as well as 33°6′ and 35°34′ north latitude, with a total area of 38,521 km2. It is located between the northeastern margin of the Qinghai-Tibet Plateau and the western part of the Chinese Loess Plateau. The terrain is high in the northwest and low in the southeast, with an average elevation of 2960 m. There are mainly rivers such as the Yellow River, Taohe River, Daxia River and Bailong River (collectively referred to as the Three Rivers and One River), belonging to the Yellow River system and the Yangtze River system. Gannan Prefecture has the characteristics of continental seasonal climate, such as the abundant sunshine with low utilization rate, insufficient heat with significant vertical difference, a plenty of precipitation with significant difference in geographical distribution. The annual average temperature is between 1 and 13 °C, the annual precipitation is between 400 and 800 mm, and the annual average sunshine hours are between 1800 and 2600 h (Figure 1), statistics were obtained from Annals of Gannan Prefecture [24].
Gannan Prefecture has jurisdiction over one city and seven counties. At the end of 2017, the permanent resident population was 71.02 × 10⁴, the regional GDP was 141.42 × 10⁸ yuan, and the three industrial structure ratios were 23.47:13.77:62.76. In the whole year, it received 1105.6 × 104 tourists from home and abroad, achieving a comprehensive tourism income of 51.50 × 10⁸ yuan, accounting for 82.06% of the output value of the tertiary industry. In 2017, the per capita disposable income of urban residents was 23,012 yuan, and the per capita disposable income of rural residents was 6998 yuan, statistics about population, social economy and so on in 2017 were obtained from Gannan Prefecture Statistics Bureau.

3. Research Ideas and Methods

3.1. Concepts and Ideas

3.1.1. Concept Definition

The tourist space is a natural and social region for tourists to visit. The traditional tourism spatial structure refers to the spatial relationship and combination of tourist attractions. It is a combination of nodes (tourist attractions), passages (traffic lines) and regions (administrative regions) [25], including the combination of distribution pattern, grade and quantity of tourist attractions, and directly triggering the spatial behavior of tourists. This has a profound impact on the development speed, scale, benefits, the time and space arrangement of tourist attractions, as well as the nature, degree and development strategy of the spatial competition in the tourism region [26]. Commonly, the tourism spatial structure is mainly a network system formed on the basis of existing tourist attractions, and does not include the space formed by tourists’ subjective selection of tourism destinations. The high-quality tourism space refers to the collection of the national space carrier composed of the objective and subjective tourism space that creates attractiveness and appeal. It exhibits the comprehensive and unified characteristics of ecology and humanity [27].

3.1.2. Research Ideas

As a common economic activity, tourism occurs and develops using the tourism spatial system, including the destination system, the source system and the travel system, as the substance carrier [28]. Scenic spots, intangible cultural heritage, ruins, relics, etc., are important types of tourist attractions, and objective constituent elements of the functional system of tourism destinations. They have a special status in the tourism spatial structure, and are the objective basis for the formation of tourism space [29]. Travel note is the main way of tourism promotion, and the basis for subjective identification of the quality of tourism space. With the continuous popularization and promotion of new public media, such as Weibo and WeChat, the objective perception of tourists has an important impact on the system of tourism resources, especially the tourism spatial system [30]. The spatial pattern of tourist attractions, intangible cultural heritages, ruins, relics, etc., determines the overall form of spatial distribution, reflects the spatial attributes and interrelationships of tourism activities. In addition, it is the basis for the formation and development of objective tourism spatial structure, and has a profound impact on the development speed, scale, benefits, the time and space arrangement of tourism resources [31]. The subjective perceptions of tourists about the destinations are expressed through social platforms, which has certain influences on the choice of potential tourists, directly affecting the decision-making process of tourism [32]. Thus, it changes the cognition of the original objective spatial structure of tourists, and results in the formation of a new subjective one [22,33,34]. With the constant changes in people’s travel behaviors, traditional tourism space can no longer meet the needs of tourists. Especially, in order to seek excitement and freshness, the young tourists prefer the subjective tourism space during the choice of tourism destinations [35]. The emergence of new media has affected the spatial allocation of tourism destinations and the development of related tourism elements, which in turn affects the spatial behavior decision-making and destination choice of tourists. Based on this, this paper identified the tourism spatial structures under the objective tourist attraction and the perception of tourists from the objective and subjective levels, respectively. Objective tourism space is composed of local inherent tourism resources, which is not determined by human behavior and perception, such as Labrang temple, Sanko Grassland, Gahai Lake etc. subjective tourism space is composed of tourists’ perception and user experience. Then, the tourism spatial structure was reconstructed [36,37].

3.2. Data and Source

3.2.1. Tourist Attractions Data and its Source

The tourist attractions mainly include scenic spots, intangible cultural heritages, ruins, relics, etc. The relevant data are from Chinese Intangible Cultural Heritage Website, Gansu Provincial People’s Government Website, Bureau of Culture, Radio, Film, and Television, Press and Publication of Gannan Tibetan Autonomous Prefecture, statistical data of cultural centers of the city and county in Gannan Prefecture (one city and seven counties), ‘Gansu Cultural Relics Statistical Yearbook’ between 2008 and 2018, and ‘Gansu Tourism Statistics Yearbook’ between 2008 and 2018. According to the quality classification standard of tourist attractions in China, the tourist attractions are divided into five grades, with the advantages and disadvantages of 5A, 4A, 3A, 2A and A respectively. As of September 2018, there are 27 national A-level tourist attractions in Gannan Prefecture, including six tourist attractions at 4A-level, 10 tourist attractions at 3A-level, and 11 tourist attractions at 2A-level. A total of 518 projects of intangible cultural heritage listed in the national, provincial, state, and county levels, including six national intangible cultural heritage projects (Labrang Temple Music ‘Duder’, Gannan Tibetan Folk Songs, Zhuoni Baron Drum Dance, Zhouqu Dance, Gannan ‘Nan-mute’ Tibetan Opera, Gannan Tibetan Thangka, Zhuoni Lintan Tao inkstone Making, Gannan Tibetan Medicine), 48 projects at provincial level, 192 projects at state level and 518 projects at county level. There are 544 items of cultural ruins and relics, including six at the national level, 28 at the provincial level, and 510 at the county level (Figure 2a).

3.2.2. Tourists’ Perception Data and its Source

Tourists’ perception data mainly refers to the online travel notes about tourism destinations in Gannan published on well-known travel websites and forums by tourists. This note has a significant impact on potential tourists. This paper selects Ma Honeycomb and Ctrip website for data collection. Ma Honeycomb is a largest travel social network in China at present, which contains a large number of travel notes and photos published and taken by real travel users [38]. Ctrip website is largest online travel service provider in China, with a large number of registered users. Online travel information preservation is relatively complete, and information update speed is fast. Therefore, it is suitable to be a sample source database [39]. The data of Ma Honeycomb and Ctrip website can effectively cover different types of tourists and enrich data samples. Through the location information of two website users, it is found that their users are mainly domestic users [40]. According to the availability of data, this paper sets the perception of domestic tourists to shape the subjective tourism space from June 2013 to June 2019. The data of this article is from the Ma Honeycomb and Ctrip website. ‘Gannan’ is the search keyword, and search results are arranged according to the update time of Gannan Travel Notes. In this paper, the time period of crawling online travel notes is between June 2013 and June 2019. The data from travel notes have some problems, such as information duplication, information missing and beyond the research scope. Thus, in this paper, following criteria were adopted to select data from the original travel notes. (1) The time that tourists traveled in Gannan must be between June 2013 and June 2019. (2) Travel notes must include information about Gannan tourist attractions. In the data collection, according to the above criteria, 874 travel notes (442 from Ma Honeycomb and 432 from Ctrip website) were selected as samples for the data analysis using the web crawling technology to identify the frequency of each scenic spot in the travel notes (Figure 2b). The text is pre-processed to generate the analysis text. Then the word segmentation and mergence were performed, and the final document was generated. The word frequency, semantic network and sentiment analysis were analyzed using ROST WordParser software to analyze the tourism destination image and generate visual images of tourist attractions. The spatial location of the tourism destination was detailed with Google Earth. In addition, the coordinates of tourist attractions with large area were replaced with its particle coordinates.

3.3. Research Methods

In this paper, the Gannan tourism spatial structure were studied from two directions: the spatial pattern and spatial relationship.

3.3.1. The Research Method of Tourism Spatial Pattern

(1) Kernel density index
Kernel density estimation is based on a moving cell by using kernel function to calculate the density of elements in a cell. Based on the non-parametric method of surface density estimation, the degree of spatial aggregation of tourist attractions and tourism destinations was analyzed. Kernel Density Estimation (KDE) uses the kernel function and assigns different weight values to points in the search region to make the distribution smoother and obtain the density value of unknown region. Events have a higher probability of occurrence in point-intensive region than in point-sparse region [41].
f ( x , y ) = 1 n h 2 i = 1 n k ( x i h )
where f(x,y) is the density estimation at the (x,y); n is the number of observations; h is the bandwidth, and the value is 40 km; k is the kernel function; and xi is the distance from the ith observation position.
(2) Nearest neighbor index
Both tourist attractions and tourism destinations can be approximated as point targets, and their distribution patterns can be classified into the random distribution, uniform distribution and aggregated distribution. Combining the relevant research results with the purpose of this paper, the nearest neighbor index was used to identify the spatial structure [42,43]. The nearest neighbor distance index R is the ratio of the average Euclidean distance of each point in the geospatial location from the target to the average distance in the random distribution [44]:
r E = 1 2 n A = 1 2 D
R = r i r E
where rE represents the theoretical nearest distance of objective and subjective tourism space, A represents the area of research region, n represents the number of objective and subjective tourism space points, D represents the point density, and ri represents the actual average nearest neighbor distance of spatial distribution of objective and subjective tourism space. R is expressed as the nearest index of objective and subjective tourism space in Gannan Prefecture. When R = 1, the point set is randomly distributed; when R > 1, the point set tends to be uniformly distributed; when R < 1, the point set tends to be aggregated distribution.
(3) Semi-variogram
Since the spatial distribution type of points measured by the nearest neighbor index analysis method has the controversy on the definition criteria, the semi-variogram was used to verify the tourism spatial structure of Gannan Prefecture [45]. The semi-variogram value r(h) can be calculated by:
r ( h ) = 1 2 N ( h ) i = 1 N ( h ) [ Z ( x i ) Z ( x i + h ) ] 2
where Z(x) is the locations random variable, Z(xi) is the sample value of Z(x) at the space point xi, Z(xi+h) is the sample value of Z(x) at the distance from h at xi, and N(h) is the total number of sample point pairs when the separation distance is h.

3.3.2. The Research Method of Tourism Spatial Association

(1) The connectivity
The connectivity refers to the degree of development of the transportation network. It is used to investigate the association of tourist flows among tourist attractions in Gannan. The main indicators are the β index and the s index [46].
The β index is the average number of connection of nodes in the transportation network, which reflects the level of network connectivity. For the multi-node tourism region, the more traffic lines connecting different tourist attractions, the higher the level, as well as the higher the connectivity. Then, it is more convenient for tourists to travel among tourist attractions. The higher index is the requirement and guarantee for the optimization of the spatial network structure of tourist attractions in the tourism region. The formula is β = m/n, where β represents the connectivity of the traffic network, m represents the number of edges in the traffic network, i.e., the number of direct connections between the two nodes, and n represents the number of vertices in the transportation network, i.e., the number of nodes. Commonly, the value of β is between 0 and 3. The greater the value of β, the better the connectivity of the network.
The γ index is the ratio of the actual number of connections among nodes in the transportation network to the theoretical maximum one, reflecting the connectivity of a regional transportation network. The formula is γ = m/3(n-2). The value of γ index ranges from 0 to 1. When γ = 0, there is no connection in the network, that is, the nodes are not connected to each other. When γ = 1, the maximum number of connections is achieved, that is, the connectivity of network is excellent.
(2) Accessibility
The accessibility reflects how easy it is to move between nodes in a transportation network, that is, the degree of patency from one node to the other, characterizing the speed of traffic between tourist attractions [47]. The accessibility index is the average distance of the shortest path from one vertex to all other vertices in the network. The formula is:
A i = i = 1 n D i j / n
where Ai represents the accessibility index of vertex i in the network; Dij represents the shortest distance from vertex i to vertex j; The cumulative sum represents the distance from vertex i to all other vertices; n is the number of nodes. The smaller the value of Ai, the higher the accessibility of the node.

3.3.3. The Research Method of Tourism Spatial Network

Through the tourism spatial pattern and association research, the high-quality tourism nodes and the connection strength among nodes in Gannan are obtained, respectively. Based on this, TOP network spatial analysis and complex network tools are used to explore the spatial structure of tourism network and identify the high-quality tourism space in Gannan [48,49]. In this paper, the connection strength among nodes was calculated using the distance of transportation network and the level of node in the network:
W i j = p x i a × x j b D i j γ
where Wij represents the connection strength between nodes i and j; xi and xj are levels of nodes i and j, respectively, xi and xj are levels of nodes i and j respectively, which are national, provincial, state, and county levels, and the values are 4,3,2,1; when considering the scale indicator, since only one indicator is selected, a = b = 1; p is a constant. The main function of the model is to distinguish the magnitude of gravity among nodes, so the p value is 1. γ is the distance attenuation coefficient, which commonly has the value of 2; Dij represents the transportation distance between the two nodes i and j, which can be calculated through OD Cost Matrix tool of ArcGIS 10.2 software.
Based on the ArcGIS platform and using VBA programming, the maximum value of tourism connection strength of each node is determined (The tourism connection among nodes is the line connecting the nodes in the network. The data is binarized. If there is a connection between nodes i and j, the tourism connection will be judged to be 1; If there is no such connection, the tourism connection will be judged to be 0). Then, the Top1 network can be obtained by connecting corresponding nodes. The top 3 (Top3 network) and the top 5 (Top5 network) tourism connection accessibility are used to build TOP network. The reason for choosing these three types of networks is that they can reflect the spatial organizations of tourist attractions with different scales. The connection of TOP tourism network results in the direction. This is because the maximum network connection direction of the tourism node k originates from the node g, but that of node g not necessarily results from the node k. Thus, the TOP network is a directed network [50].

4. Result Analysis

4.1. Analysis of Objective and Subjective Tourism Spatial Pattern

4.1.1. Kernel Density Analysis

Density maps of objective and subjective tourist attractions are generated using ArcGIS’s Kernel Density Estimation (KDE) (Figure 3). There is significant regional difference between spatial distributions of objective and subjective tourist attractions in Gannan Prefecture. The spatial distribution of objective tourist attractions has a significant trend of contiguous aggregation, showing a relatively higher density in the northeastern and southeastern regions, and a lower density in the central and southwestern regions. Three regions with significant high densities of the maximum value 2.35 are formed in Xiahe County and Hezuo City, Lintan County and Zhuoni County, as well as Zhouqu County. The density gradually decreases from the center to the periphery, and a medium-density corridor is formed among counties (Figure 3a). This is opposite to that of the subjective tourist attractions. They present a relatively higher density in the central region, and a lower density in the periphery region. The regions with high density exhibit point distribution, except for the central part, which exhibits the surface distribution. In addition, the maximum density of them is only 0.11.

4.1.2. Nearest Neighbor Analysis

According to the objective and the subjective tourist attractions, the nearest distances among the tourist attractions are 5.15 km and 4.56 km, respectively. Using ArcGIS, the actual linear distances between objective as well as subjective tourist attractions and their nearest tourist attractions are 0.21 km and 1.74 km, respectively. In addition, their nearest neighbor indices are 0.0415 and 0.3822, respectively. Both the objective and subjective nearest neighbor indices are <1, and the distribution type belongs to the aggregated pattern, indicating that the tourist attractions are relatively aggregated in the region. The level of aggregation of objective tourist attractions is higher than that of the subjective one.

4.1.3. Semi-Variogram Analysis

In ArcGIS 10.2, this paper selects spherical model, exponential model, Gaussian model and power function model. Through comparison of several fitting models, it is found that Gaussian model has the highest fitting accuracy. Finally, the semi-variogram model parameters and distribution types of spatial distribution of objective and subjective tourism spatial distribution are obtained in Gannan Prefecture (Table 1). The nugget value C0 represents the spatial heterogeneity of the random part, and the spatial variability value C0/(C0 + C) reflects the degree of spatial variability caused by the random factor.
As shown in Table 1, the optimal semi-variogram models for the spatial distribution of objective and subjective tourism in Gannan Prefecture are Gaussian models. Their spatial patterns exhibit aggregated distribution. The variability of objective tourism spatial structure is relatively small, and that of subjective one is great. This indicates that the variation of objective tourism spatial structure is weakly affected by random factors, mainly due to the spatial autocorrelation. The variation of subjective one is mainly caused by random factors, and the travel note has a significant effect on the tourism destination choice.

4.2. The Analysis of Objective and Subjective Tourism Spatial Association

4.2.1. Connectivity Analysis

According to the spatial distribution network of objective tourist attractions in Gannan Prefecture, the number of connections between two nodes m is 98, the number of nodes n is 101, as well as β = 0.9703 is calculated according to the formula. The number of connections between two nodes in the subjective tourism destinations m is 35, the number of nodes n is 35, as well as β = 1.0 is calculated according to the formula. The connectivity of transportation network among objective or subjective tourist attractions in Gannan Prefecture is not high, and the density of traffic routes among tourist attractions is relatively low. γ index is similar to β index, and reflects the connectivity of a regional transportation network. The objective and subjective γ indices calculated according to the formula are 0.33 and 0.36, respectively, both of which are low. This further indicates that the connectivity among objective or subjective nodes is low. Only a few tourist attractions are connected with their neighbor ones through transportation network. Thus, the overall transportation infrastructure in Gannan Prefecture is poor, and there are few transportation routes. This is an important factor hindering the tourism development.

4.2.2. Accessibility Analysis

According to the formula, the average accessibility indices of the objective 101 nodes and the subjective 35 nodes in Gannan Prefecture are 170.63 km and 161.56 km, respectively. The overall accessibility is not high. The accessibilities of objective 59 nodes and the subjective 18 nodes are smaller than their average values, respectively, accounting for 57.42% and 51.42% of the total nodes, respectively. The accessibility is relatively good. As shown in Figure 4, the objective tourist attractions with good accessibility are mainly distributed in the northeastern region, such as the Lintan County and Zhuoni County, followed by the surrounding Hezuo City, Luqu County and Diebu County. The overall accessibility of western and southern regions is poor. Zhouqu County has the worst accessibility, and the objective tourist attractions have low accessibility. The tourism development is inevitably constrained, which reduces the overall accessibility of tourism network of the entire Gannan Prefecture. The spatial distribution of subjective accessibility is consistent with that of the objective one. The tourist attractions with the accessibility smaller than the average value are mainly distributed in the northeastern and central regions. The Maqu County and Zhouqu County in the southern region have the worst accessibility. Therefore, it is necessary to improve the transportation facilities in the western and southern regions, especially in the Maqu County and Zhouqu County, and enhance the tourism competitiveness.

4.3. The Identification of Objective and Subjective Tourism Spatial Structure

The Top1 network exhibits the ‘neighbor connection’ between the core tourist attractions and its surrounding tourist nodes, forming several tourism spatial aggregated units. The Top3 network reflects the interweaving connections among the internal nodes of the aggregated unit as well as the nearest connection among aggregated units. The core aggregated unit and the sub-core aggregated unit are particularly prominent. Based on this, the Top5 network reflects the ‘preferential connection’ feature among nodes of aggregated units.

4.3.1. The Identification of Objective Tourism Spatial Structure

With the expansion of the network scale, the objective tourism spatial network of Gannan Prefecture is layered with aggregation, and presents a significant cohesive development trend (Figure 5). The number of nodes with the connectivity greater than 0 in the Top1 network is 47, accounting for 46.54% of the total number of connection edges. This indicates that the primary connection of the objective tourism network in Gannan Prefecture is mainly concentrated on these 47 nodes. Two spatial regions with relatively high level of aggregation, the Lintan-Zhuoni and Diebu-Zhouqu aggregated regions, are formed. In the Top3 network, the number of tourist nodes with the connectivity greater than 0 increases to 85. Most (84.16%) of the tourist nodes participates in the network, and the network scope continues to expand. The level of aggregation of the original two core aggregated regions increases significantly. In the Top5 network, the number of tourist nodes with the connectivity greater than 0 continuously increases to 94, and the network scope further extends to the global scale to the west and north. In addition, a sub-core aggregated region occurs besides the original two core aggregated regions. Network connections are closer, and the connectivity is higher.

4.3.2. The Identification of Subjective Tourism Spatial Structure

The subjective tourism spatial network system presents a significant spatial aggregated distribution with a radial development trend (Figure 5). In the Top1 network, the number of nodes with the connectivity greater than 0 is 23, accounting for 65.71% of the total number of connection edges. This indicates that the primary connection of the subjective tourism network in Gannan Prefecture is mainly concentrated on these 23 nodes, forming a significant aggregated region. In the Top3 network, the number of tourist nodes with the connectivity greater than 0 increases to 34, and 91.74% of the tourist nodes participates in the network. Contrary to the case of spatial aggregation of objective tourist nodes, the core of the subjective network is located in the central and northwestern regions, forming two core aggregated regions. In the Top5 network, the number of tourist nodes with the connectivity greater than 0 increases to 35. The network connection is closer, and the connectivity is higher. Two relatively large core aggregated regions are formed in Luqu county and Xiahe county, and the connection between these two regions are closer.

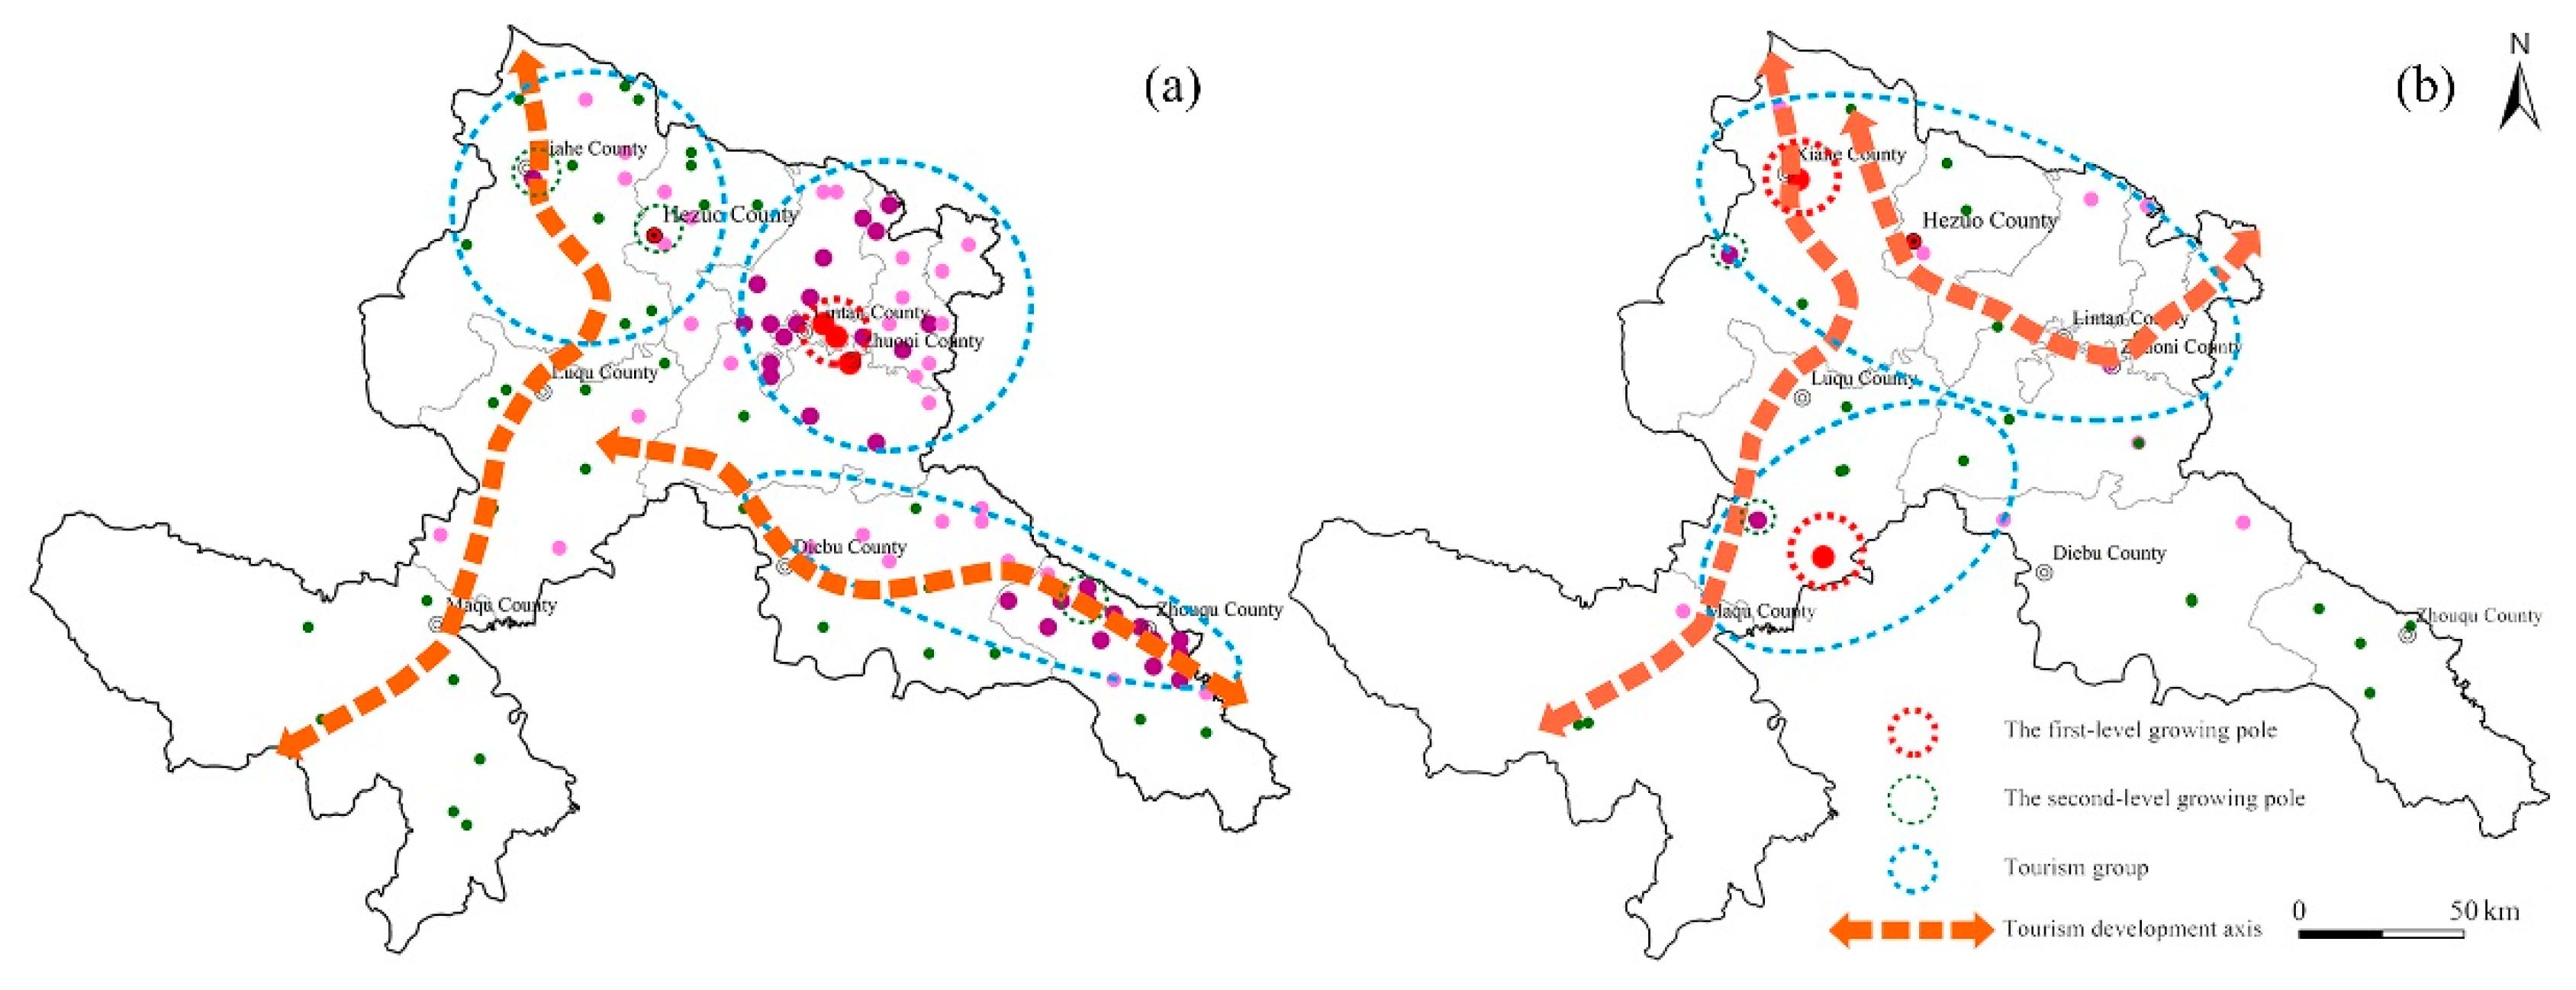
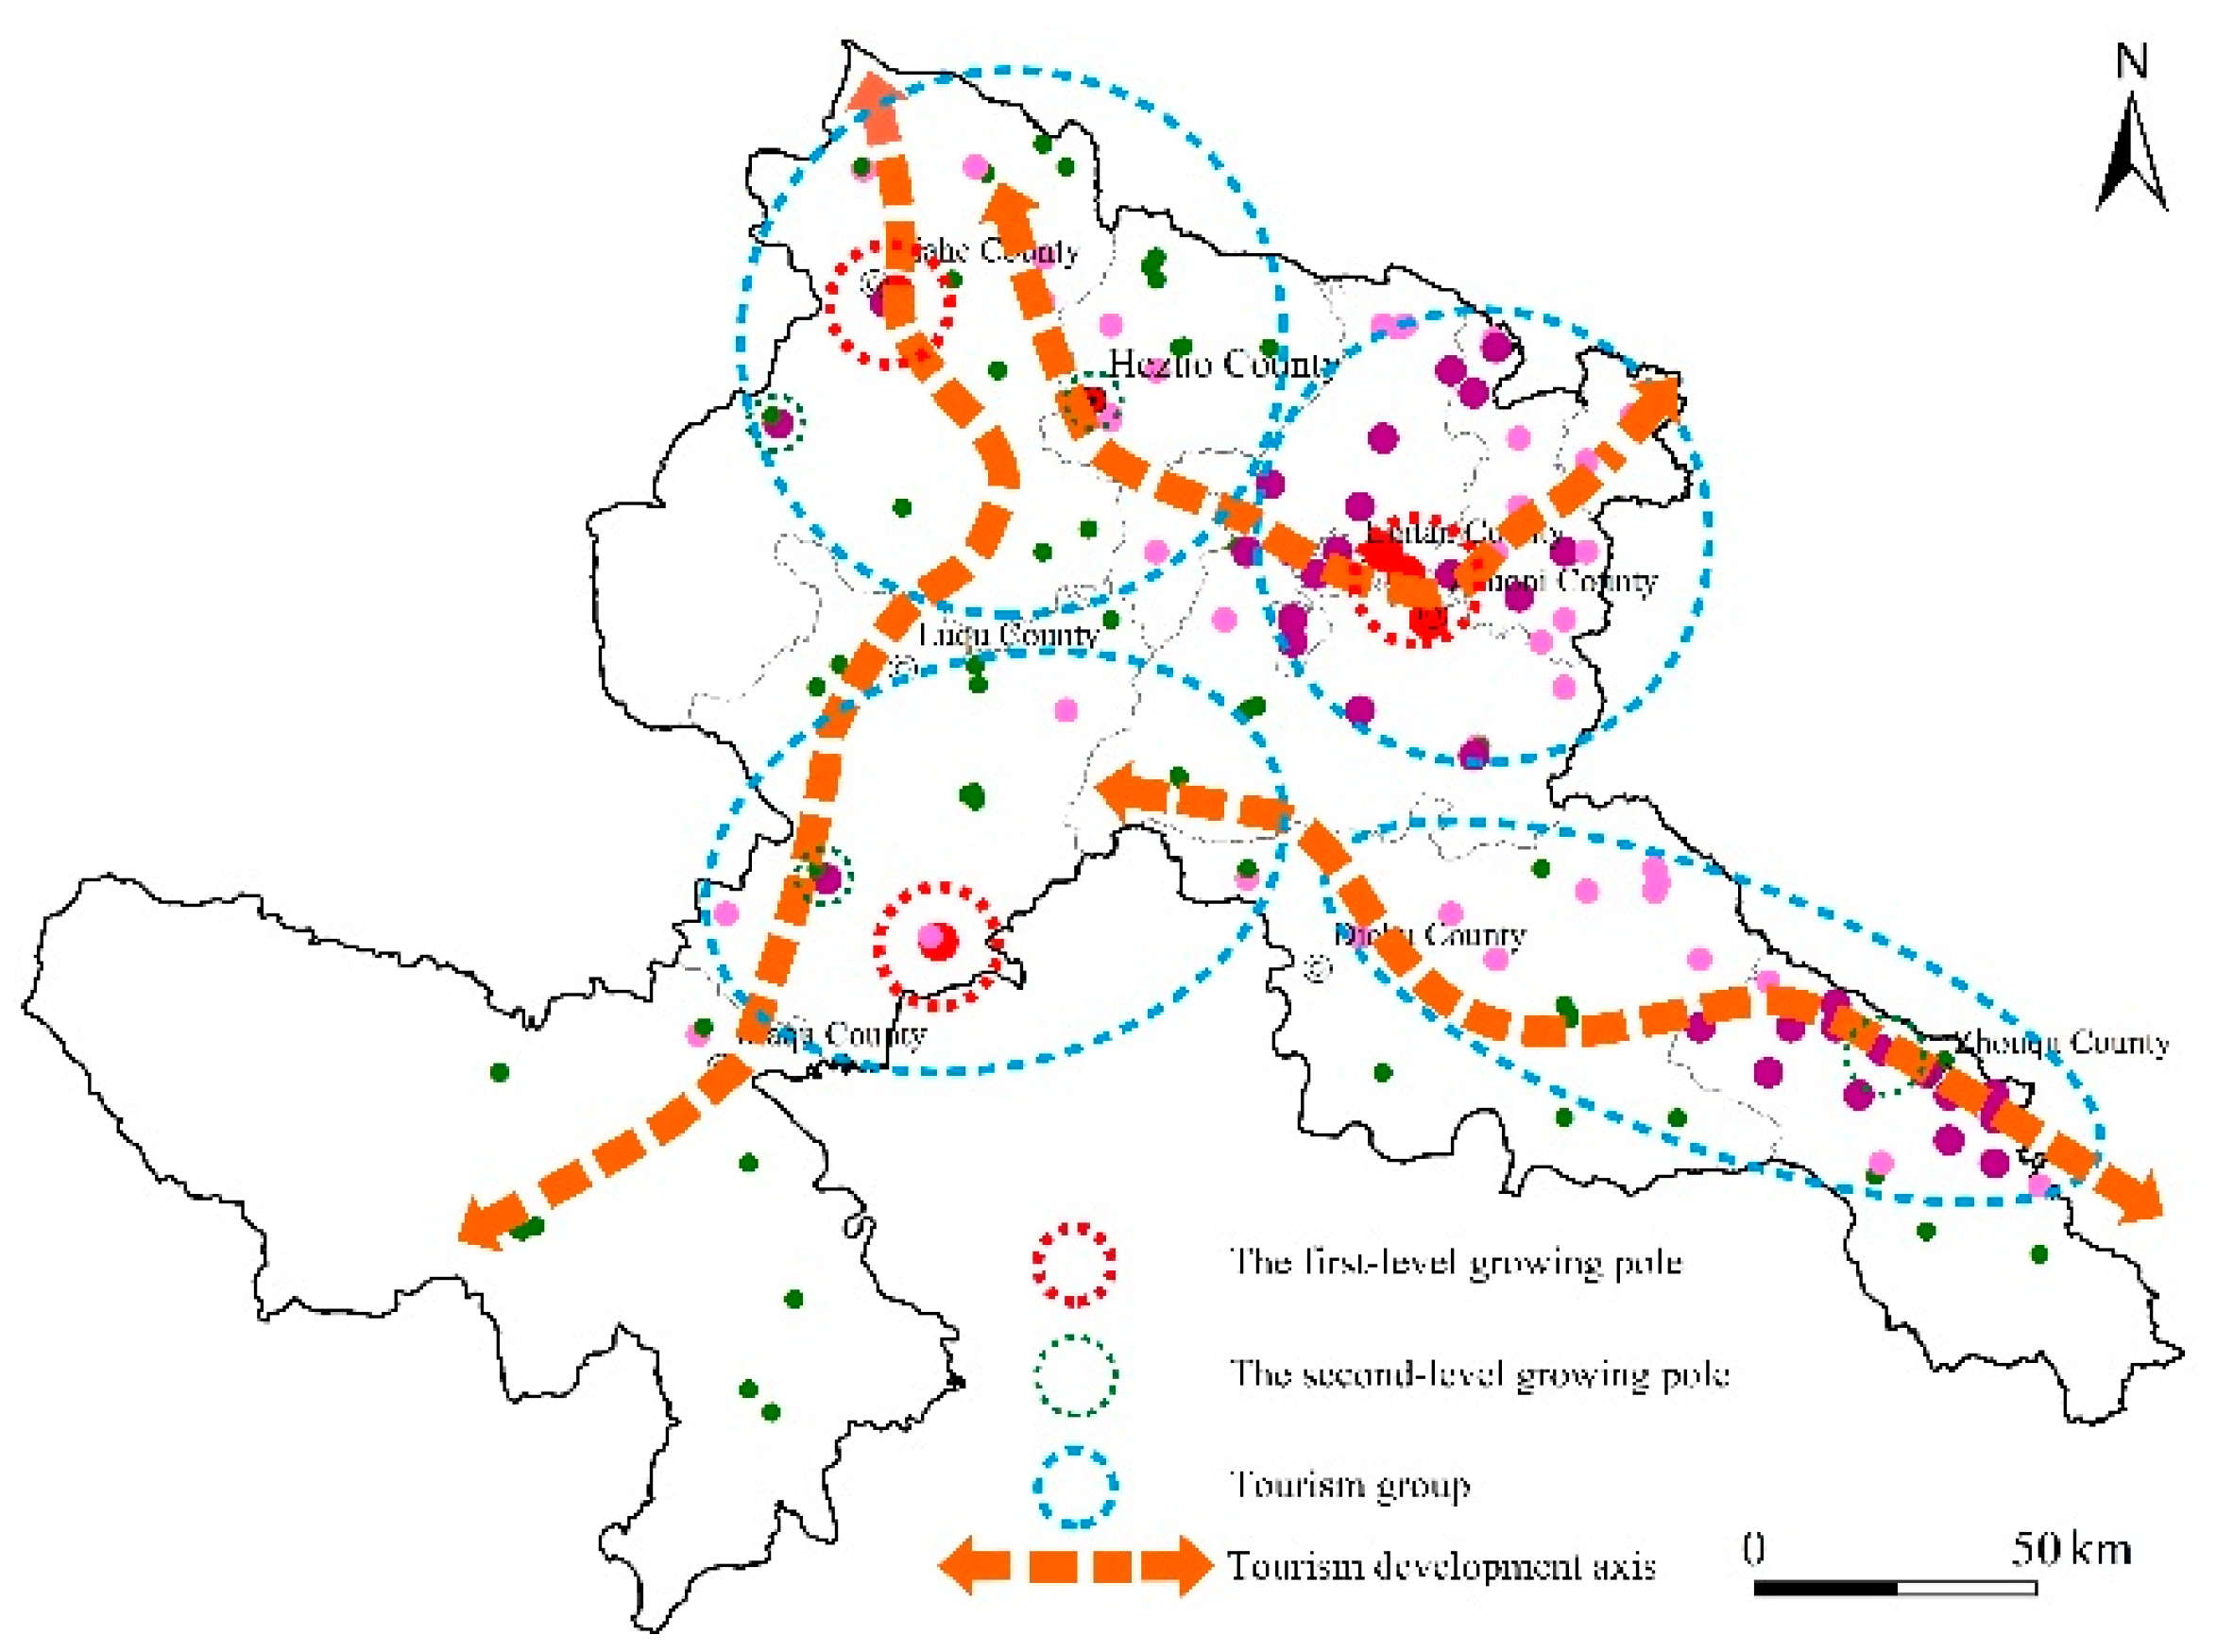
4.4. The Reconstruction of High-Quality Tourism Spatial Pattern

According to the identification results of objective and subjective tourism spatial structure, a ‘group tour’ spatial layout pattern combining ‘point’, ‘axis’ and ‘surface’ is formed (Figure 6). Then, the objective regional tourism spatial pattern of ‘four poles, two axes and three groups’ (Figure 6a) is formed. The four growing poles refer to the intangible cultural heritage sites mainly based on Lintan-Zhuoni (the first level), the Labrang Temple, Milarepa Buddha Pavilion and Zhouqu Folk Culture (the second level). Two tourism development axes refer to the Religious Folklore Sightseeing Belt in the Northern Region and the Adventure-Experience Belt of Canyon and Forest in the Southern Region. The three groups refer to tourism groups of Hezuo-Xiahe Tibetan Buddhism, Lintan-Zhuoni Folk Customs and Diebu-Zhouqu folk Customs. The tourism spatial network is mainly concentrated in six counties (cities) in the northeastern region. The spatial connections between Luqu County or Maqu County and other counties (cities) are weak. In addition, the subjective regional tourism spatial pattern of ‘four poles, two axes and two groups’ is formed (Figure 6b). The four growing poles include two first-level growing poles of Labrang Temple and Langmu Temple, as well as two second-level growing poles of Sanko Grassland and Gahai Lake. Two tourism development axes refer to the Religious Folk Sightseeing Belt in the Western Grassland and the Landscape Tourism Tour Belt in the Eastern Region. The two groups refer to tourism groups of Xiahe-Hezuo-Lintan Tibetan Buddhism and folk customs ecology, the Luqu-Diebu grassland ecology canyon forest. The tourism spatial network is mainly concentrated in the northern and central regions. The spatial connections between Zhouqu County or Diebu County located in the southeastern regions and other counties (cities) are weak. Neither the objective nor the subjective tourism spatial networks can fulfill the requirements of overall tourism development. Therefore, it is necessary to reconstruct the tourism spatial pattern of Gannan Prefecture on the basis of objective and subjective networks, providing reference for the overall tourism development.
The reconstruction of the high-quality tourism spatial pattern is devoted to the comprehensive manifestation of the social, economic and ecological benefits of tourism, highlighting the sustainability. In the process of reconstruction, based on the objective and subjective tourism spatial structures, we should integrate the objective and subjective core tourism resources as well as tourist attractions, improve the road traffic system, and construct a tourism spatial network of ‘three poles, three axes and four groups’ (Figure 7). The three growing poles are Labrang Temple-Sanke Grassland Large-Scale Tourist Attraction, Langmu Temple Large-Scale Tourist Attraction, Lintan-Zhuoni Folk Customs Tourist Attraction. Three axes refer to Religious Folk Sightseeing Belt in the Western Grassland, the Landscape Tour Belt in the Eastern Region, Adventure-Experience Belt of Canyon and Forest in the Southern Region. Four groups refer to tourism groups of Hezuo-Xiahe Tibetan Buddhism, the Luqu-Daibu Grassland Ecology Canyon Forest, Lintan-Zhuoni Folk Custom Ecology, Diebu-Zhouqu Folk Red Custom.

5. Discussion and Conclusions

5.1. Discussion

As a social and economic phenomenon, tourism activity occurs and develops within the certain space. The tourism spatial structure is an important factor in tourism research, and reflects the spatial attributes and interrelationships of tourism activities [51,52]. It is a combination of the node, line and surface. The ‘node’ refers to the tourism destination or the tourism resource, the ‘line’ is the traffic channel connecting tourism resources, and the ‘surface’ is the tourist attraction inlaid with space patches in the geographic location of tourism destination [53,54]. In the traditional sense, tourism destinations mainly consist of elements including objective tourist attractions, ruins and remains, cultural heritage, etc. Based on their differences in tourism resources, geographic location, traffic conditions, social culture, etc., these elements play different roles in the tourism system, forming a relatively fixed tourism network [55]. However, in the process of tourism in rural or urban regions with a single tourist attraction as the core tourism destination, the network of tourism destination follows the law of distance attenuation [56]. With the advancement of information and the continuous improvement of people’s living standards, the traditional tourism network can no longer meet the needs of some tourists. More and more tourists acquire, publish and exchange travel information through the Internet. As a result, some new tourism destinations, namely subjective tourism destinations, have become popular with potential tourists. In this paper, based on the study of the spatial pattern, association and structure of objective tourism destinations, we analyzed the spatial network of subjective tourism destinations from the perspective of tourists, and constructed a spatial structure based on subjective and objective tourism. Compared with the case of traditional tourism spatial network, the movement trajectory and consumption behavior of tourists in the actual geographical location changed, as well as some new tourism ‘nodes’ and ‘surfaces’ have been created. This makes up for the lack of traditional tourism spatial structure, and plays an important role in further concisely highlighting the characteristics of the tourism destination as well as the promotion of the theme and quality of the tourism destination [57]. In addition, according to the subjective and objective tourism spatial structures, Gannan tourism should further strengthen the cooperation among tourist attractions with high tourism connectivity. By creating features of tourist attractions, optimizing public transportation, increasing tourist routes and improving resource sharing policies, groups consisting of special tourist attractions are formed for tourism marketing. Then, the integrated marketing of tourist attractions is developed to promote the tourism development in Gannan.
Compared with the traditional methods, this paper has some innovations in constructing the tourism spatial network structure from the perspective of tourists. However, as an exploratory study limited by the actual conditions, most data in this paper is from travel notes. In the future research, we should focus on how to effectively integrate multi-source data of image, video and voice, as well as even real-time travel digital footprints, such as mobile phone signals, real-time microblogging interaction, etc. Then, based on the in-depth combination of GIS spatial-temporal data expression and analysis methods, the basic rules of tourist behavior should be analyzed and summarized to guide the regional tourism development and enrich the tourism spatial network [58]. In addition, the scope of the sample subject, the normative and scientific aspects of subjective behavior data extraction should be further discussed.
The characteristics of this paper are to study the spatial network organization structure of tourism destinations from objective and subjective levels, and construct a new complex network system structure of tourism destinations. This theoretical framework is beneficial to guiding the construction of whole tourism destinations [59]. It should be noted that in reality, the tourism destination network is a complex adaptive system. This paper only discussed its static structural characteristics, ignoring the dynamic evolution and simulation prediction research. The optimization of the network structure of tourism destinations should be significantly improved. Especially the understanding of the complexity of the network of tourism destinations, such as deepening the research and application of the network organization and effects of tourism destinations, paying attention to the interaction between the association of spatial elements and the network structure of tourism destinations, as well as the comprehensive effect and guide of network structure of tourism destinations to the wide region, are all key issues for future research [5].

5.2. Conclusions

(1) There is significant regional difference between spatial distributions of objective and subjective tourist attractions in Gannan Prefecture. Both objective and subjective tourist attractions in Gannan Prefecture exhibit aggregated distribution. Among them, the spatial distribution of objective tourist attractions has a significant trend of contiguous aggregation, showing a relatively higher density in the northeastern and southeastern regions, and a lower density in the central and southwestern regions. This is opposite to that of the subjective tourist attractions. They present a relatively higher density in the central region, and a lower density in the periphery region. In addition, the regions with high density exhibit point distribution, except for the central part, which exhibits the surface distribution.
(2) The connectivity and accessibility between objective and subjective tourist attractions in Gannan Prefecture are poor, and only a few tourist attractions form a traffic connection with neighboring ones. The spatial distribution of subjective accessibility is consistent with that of the objective one. The tourist attractions with the accessibility smaller than the average value are mainly distributed in the northeastern and central regions. The Maqu County and Zhouqu County in the southern region have the worst accessibility.
(3) The objective tourism spatial network of Gannan Prefecture is layered with aggregation, and presents a significant cohesive development trend. This is opposite to the subjective one. The number of objective and subjective network nodes for Top3 and Top5 are more than that for Top1, respectively. This indicates a relatively stronger aggregation.
(4) According to the identification results of objective and subjective tourism spatial structure, a ‘group tour’ spatial layout pattern combining ‘point’, ‘axis’ and ‘surface’ is formed. Based on this, the objective and subjective core tourism resources as well as tourist attractions should be integrated. The road transportation system should be constructed and improved. Then, a high-quality tourism spatial network with ‘three poles, three axes and four groups’ is constructed.

Author Contributions

Conceptualization, L.M. and X.L.; methodology, X.L. and J.B.; software, X.L. and J.B.; resources, F.F.; writing—original draft preparation, L.M. and X.L.; writing—review and editing, L.M. and X.L. All authors have read and agree to the published version of the manuscript.

Funding

This research was funded by National Natural Science Foundation of China, grant number 41661105.

Conflicts of Interest

The authors declare no conflict of interest.

References

  1. Huang, H.P.; Qiao, X.Z.; Zhang, J.; Li, Y.L.; Zeng, Y.M. Spatio-temporal differentiation and influencing factors of regional tourism carbon emissions under the background of green development: A case study of the Yangtze river economic belt. Econ. Geogr. 2019, 39, 214–224. [Google Scholar]
  2. Pang, S.F.H.; Mckercher, B.; Prideaux, B. Climate change and tourism: an overview. Asia Pac. J. Tour. Res. 2013, 18, 4–20. [Google Scholar] [CrossRef]
  3. Namberger, P.; Jackisch, S.; Schmude, J.; Karl, M. Overcrowding, overtourism and local level disturbance: How much can Munich handle? Tour. Plan. Dev. 2019, 16, 452–472. [Google Scholar] [CrossRef]
  4. Ma, X.L. Building tourism planning system, standards and norms to meet national strategic needs. Tour. Trib. 2014, 29, 3–5. [Google Scholar]
  5. Gao, P.; Xi, J.C. Research on the spatial structure and complex characteristics of tourism destination network: A case study of Yesanpo tourism destination. J. Nat. Resour. 2018, 33, 85–98. [Google Scholar]
  6. Wu, J.F.; Ren, R.P.; Han, L.N.; Wang, Y.Q. Chinese aviation international network and its impact on inbound tourism. Econ. Geogr. 2012, 32, 147–152. [Google Scholar]
  7. Yang, Y.; Timothy, F.; Zhang, J. Modeling sequential tourist flows: where is the next destination? Ann. Tour. Res. 2013, 43, 297–320. [Google Scholar] [CrossRef]
  8. Leiper, N. Tourism Management; The RMIT Press: Melbourne, Australia, 1995. [Google Scholar]
  9. Gunn, C.A. Tourism Planning: Basics, Concepts, Cases; Routledge: Abingdon, UK, 1993. [Google Scholar]
  10. Friedman, J.R. Regional Development Policy: A Case Study of Venezuela; The MIT Press Ltd: Cambridge, MA, USA, 1966. [Google Scholar]
  11. Lu, D.D. An analysis of spatial structure and optimal regional development. Acta Geogr. Sin. 2001, 56, 127–135. [Google Scholar]
  12. Smith, J.W.; Floyd, M.F. The urban growth machine, central place theory and access to open space. City Cult. Soc. 2013, 4, 87–98. [Google Scholar] [CrossRef]
  13. Wang, W.; Li, J.N.; Yu, F.Y.; He, H. Space, function, and vitality in historic areas: The tourismfication process and spatial order of Shichahai in Beijing. Int. J. Tour. Res. 2018, 20, 335–344. [Google Scholar] [CrossRef]
  14. Wu, Z.Q.; Wu, C.Z. Principle of Urban Tourism Planning; China Architecture and Building Press: Beijing, China, 2005. [Google Scholar]
  15. Kang, S.; Lee, G.; Kim, J.; Kim, J.; Park, D. Identifying the spatial structure of the tourist attraction system in South Korea using GIS and network analysis: An application of anchor-point theory. J. Destin Mark. Manage 2018, 9, 358–370. [Google Scholar] [CrossRef]
  16. Yu, H.Y.; Li, Q.Y.; Mei, L.; Li, J.S. Research on the spatial structure and spatial development patterns of urban tourism economic connections of Heilongjiang Province-Focus on the perspective of social network. Sci. Gerogr. Sin. 2015, 35, 1429–1436. [Google Scholar]
  17. Wang, D.G.; Niu, Y.; Qian, J. Evolution and optimization of China’s urban tourism spatial structure: A high speed rail perspective. Tour Manag. 2018, 64, 218–232. [Google Scholar] [CrossRef]
  18. Gkoltsiou, A.; Terkenli, T.S.; Koukoulas, S. Landscape indicators for the evaluation of tourist landscape structure. Int. J. Sust. Dev. World. 2013, 20, 461–475. [Google Scholar] [CrossRef]
  19. Girardin, F.; Calabrese, F.; Fiore, F.D.; Ratti, C.; Blat, J. Digital footprinting: Uncovering tourists with user-generated content. IEEE Pervas. Comput. 2008, 7, 36–43. [Google Scholar] [CrossRef] [Green Version]
  20. Yang, M.; Li, J.Y.; Yang, L. The study on spatio-temporal behaviors of inbound tourists based on tourists’ digital footprints: a case study of Chengdu. Tour. Sci. 2015, 29, 59–68. [Google Scholar]
  21. Salas-Olmedo, M.H.; Moya-Gómez, B.; García-Palomares, J.C.; Gutiérrez, J. Tourists’ digital footprint in cities: Comparing Big Data sources. Tour Manag. 2018, 66, 13–25. [Google Scholar] [CrossRef] [Green Version]
  22. Liu, Y.; Bao, J.G.; Zhu, Y.L. Exploring emotion methods of tourism destination evaluation: A big-data approach. Geogr. Res. 2017, 36, 1091–1105. [Google Scholar]
  23. Liu, Y.; Bao, J.G.; Chen, K.Q. Sentimental features of Chinese outbound tourists in Australia: Big-data based content analysis. Tour. Trib. 2017, 32, 46–58. [Google Scholar]
  24. Gannan Tibetan Autonomous Prefecture Local History Compilation Committee. Annals of Gannan Tibetan Autonomous Prefecture; National Press: Beijing, China, 1999. [Google Scholar]
  25. Xie, J.H.; Wu, B.H. Tourism spatial structure of resources–based attractions in China. Sci. Gerogr. Sin. 2008, 28, 748–753. [Google Scholar]
  26. Jin, D.; Song, B.P.; Gao, N. Spatial structure of tourism in Shanxi province based on ‘Pole-Axis’ theory. J. Arid. Land Resour. Environ. 2013, 27, 196–202. [Google Scholar]
  27. Fan, J. Call for high-quality land space and high-quality urban and rural appearance. J. CPPCC 2019, 11, 21. [Google Scholar]
  28. Jin, C.; Lu, Y.Q.; Zhang, L.; Xu, J. An analysis of accessibility of scenic spots based on land traffic network: A case study of Nanjing. Geogr. Res. 2009, 28, 246–258. [Google Scholar]
  29. Pang, X.X.; Wang, R.C.; Wang, W.G. Research on coupling of tourism and urbanization in underdeveloped regions: A case study of Fusong county in Jilin province. Geogr. Geo-Info. Sci. 2014, 30, 130–134. [Google Scholar]
  30. Danah, B.; Kate, C. Critical questions for big data. Inf. Commun. Soc. 2012, 15, 662–679. [Google Scholar]
  31. Tang, L.; Yu, Q.; Xian, R.S. The spatial layout and path of Tibetan cultural tourism industry development. Econ. Geogr. 2012, 32, 134, 141–146. [Google Scholar]
  32. Zhu, H.; Liu, J.M.; Tao, H.; Zhang, J. Evaluation and spatial analysis of tourism resources attraction in Beijing based on the internet information. J. Nat. Resour. 2015, 30, 2081–2094. [Google Scholar]
  33. Xu, F.; Li, S.S.; Qi, X.Q. On the reconstruction of tourism system model in the background of big data. Tour. Sci. 2016, 30, 48–59. [Google Scholar]
  34. Chareyron, G.; Darugna, J.; Raimbault, T. Big Data: A New Challenge for Tourism; IEEE: Washington, DC, USA, 2015. [Google Scholar]
  35. Peng, H.S.; Lu, L.; Lu, X.F.; Ling, J.S.; Li, Z.M.; Deng, H.B. The network structure of Cross-border tourism flow based on the Social network method: A case of Lugu lake region. Sci. Gerogr. Sin. 2014, 34, 1042–1050. [Google Scholar]
  36. Ma, L.; Zhu, H. Establishing the legitimacy of constructivist methodology and methods in the study of tourism: On the essence of tourism world. Tour. Trib. 2015, 30, 100–107. [Google Scholar]
  37. Holm, M.R.; Lugosi, P.; Croes, R.; Torres, E.N. Risk-tourism, risk-taking and subjective well-being: a review and synthesis. Tour Manag. 2017, 63, 115–122. [Google Scholar] [CrossRef] [Green Version]
  38. Luo, Q.J.; Liu, S.X. Temporal and spatial characteristics of self-driving tourist flows based on tourism digital footprints: a case study in Yunnan province. Tour. Trib. 2016, 31, 41–50. [Google Scholar]
  39. Zhang, X.X.; Li, J.H.; Zuo, Y.; Zhang, H.M.; Jin, X.L. Study on spatial-temporal characteristics of tourist behavior based on digital footprints: Taking Nanjing for example. Econ. Geogr. 2018, 38, 226–233. [Google Scholar]
  40. Liu, Z.; Dai, Z.F.; Lou, J.J.; Liu, S. Temporal and spatial characteristics of urban recreation behavior based on digital footprints—A case study of Shanghai. World. Region. Stud. 2019, 28, 95–105. [Google Scholar]
  41. Wang, F.H. Quantitative Method and Application Based in GIS; CRC Press: Boca Raton, FL, USA, 2011. [Google Scholar]
  42. Chen, H.F.; Hu, W.H. Spatial structure of class a tourist attraction in Chizhou. Sci. Gerogr. Sin. 2014, 34, 1275–1280. [Google Scholar]
  43. Sun, J.W.; Tian, Y.; Cui, J.X.; Luo, J.; Zeng, J.X.; Han, Y. Identification of tourism spatial structure and measurement of tourism spatial accessibility in Hubei province. Econ. Geogr. 2017, 37, 208–217. [Google Scholar]
  44. Zhang, Y.; Chen, Y.J.; Wang, D.L. Study on spatial distribution characteristics of leisure agricultural park in Beijing. China J. Agric. Resour. Region. Plan. 2016, 37, 209–219. [Google Scholar]
  45. Luan, F.M.; Zhang, X.L.; Yang, Z.P.; Xiong, H.G.; Han, F.; Wang, S.G. Temporal-spatial variability of tourism festivals and its mechanism in Shandong Province during 1990-2011. Prog. Geogr. 2013, 32, 940–949. [Google Scholar]
  46. Wang, Z.F.; Tang, J.P. Approach of tourism cooperation in Daxiangxi area based on traffic network. Econ. Geogr. 2015, 35, 198–203. [Google Scholar]
  47. Liu, B.T.; Tao, H.P.; Liu, S.Q.; Shi, Z.; Guo, Z.L. Transportation accessibility evaluation model for mountains areas and its application. Prog. Geogr. 2011, 30, 733–738. [Google Scholar]
  48. Dong, Y.; Luo, J.; Zheng, W.S.; Tian, Y.; Tian, L.L.; Chen, G.L. The Urban Network Structure and Complexity in Hubei Province. Econ. Geogr. 2019, 39, 76–84. [Google Scholar]
  49. Yu, H.; Chen, T.; Lu, L.; Wang, K.Y.; Zhu, D.F. Structure of tourist economy network and its spatial development pattern in Jianghuai urban agglomeration. Prog. Geogr. 2014, 33, 169–180. [Google Scholar]
  50. Chen, T.Z.; Li, B. Research on spatial transport linkage of highway passenger flow in Henan province based on Gis. Areal Res. Dev. 2012, 31, 150–155. [Google Scholar]
  51. Baloglu, S.; Henthorne, T.L.; Sahin, S. Destination image and brand personality of Jamaica: A model of tourist behavior. J. Travel. Tour. Mark. 2014, 31, 8–1057. [Google Scholar] [CrossRef]
  52. Huang, Z.F.; Huang, R. The theoretical perspective and academic innovation of tourism geography based on human-environment interactions. Geogr. Res. 2015, 34, 15–26. [Google Scholar]
  53. Xiao, D.N.; Zhong, L.S. Study on the landscape ecology of ecological tourism. Sci. News 2000, 5, 5. [Google Scholar]
  54. Xiao, D.N.; Yang, G.H. Ecological Tourism Perspective; Chinese Tourism Press: Beijing, China, 2002. [Google Scholar]
  55. Yu, H.; Liu, Q.Q.; Chen, T.; Lu, L. Organizational structure, drivers of change, and development characteristics of metropolitan tourism system. Prog. Geogr. 2016, 35, 1288–1302. [Google Scholar]
  56. Xi, J.C.; Wang, X.G.; Kong, Q.Q.; Zhang, N. Spatial morphology evolution of rural settlements induced by tourism: A comparative study of three villages in Yesanpo tourism area, China. Acta Geogr. Sin. 2014, 69, 531–540. [Google Scholar] [CrossRef]
  57. Zhu, H.; Liu, J.M. Rural settlement reconstructing driven by mountain scenic spot construction: An empirical study of Yunqiu Mountain Scenic Spot. Geogr. Res. 2018, 37, 2490–2502. [Google Scholar]
  58. Li, Y.; Yan, Y.; Yun, X. The spatial structure of Tibet tourism based on tourism digital footprint. J. Arid. Land. Resour. Environ. 2015, 29, 176–182. [Google Scholar]
  59. Wang, S.B.; Luo, X.L.; Guo, J.H.; Zhang, P.G.; Gu, Z.N. Dynamic evolution of tourism spatial structure under the improvement of the high speed rail network in northeast China. Sci. Gerogr. Sin. 2019, 39, 568–577. [Google Scholar]
Figure 1. Study region map.
Sustainability 12 01015 g001
Figure 2. (a) Spatial distribution of objective tourism space, (b) Frequency of subjective tourism space in travel notes.
Sustainability 12 01015 g002
Figure 3. (a) Density map of objective tourism space, (b) Density map of subjective tourism space.
Sustainability 12 01015 g003
Figure 4. (a) Accessibility distribution map of objective tourism space, (b) Accessibility distribution map of subjective tourism space.
Sustainability 12 01015 g004
Figure 5. (a,b) The spatial structure of top1 network of tourism contact intensity, (c,d) The spatial structure of top3 network of tourism contact intensity, (e,f) The spatial structure of top5 network of tourism contact intensity.
Sustainability 12 01015 g005
Figure 6. (a) Objective tourism spatial network; (b) subjective tourism spatial network.
Sustainability 12 01015 g006
Figure 7. The structure of high-quality tourism spatial network.
Sustainability 12 01015 g007
Table 1. The parameters and spatial distribution types of semi-variogram model of the objective and subjective tourism.
ParametersRange (A)Nugget Value (C0)Sill Value (C + C0)Nugget Coefficient (C0/(C + C0))ModelDistribution Type
objective46.99000.09260.95190.0973Gaussian modelaggregation
subjective59.25000.71251.20120.5932Gaussian modelaggregation

