Sustainable Irrigation Management in Paddy Rice Agriculture: A Comparative Case Study of Karangasem Indonesia and Kunisaki Japan


Abstract
:1. Introduction
1.1. The Subak
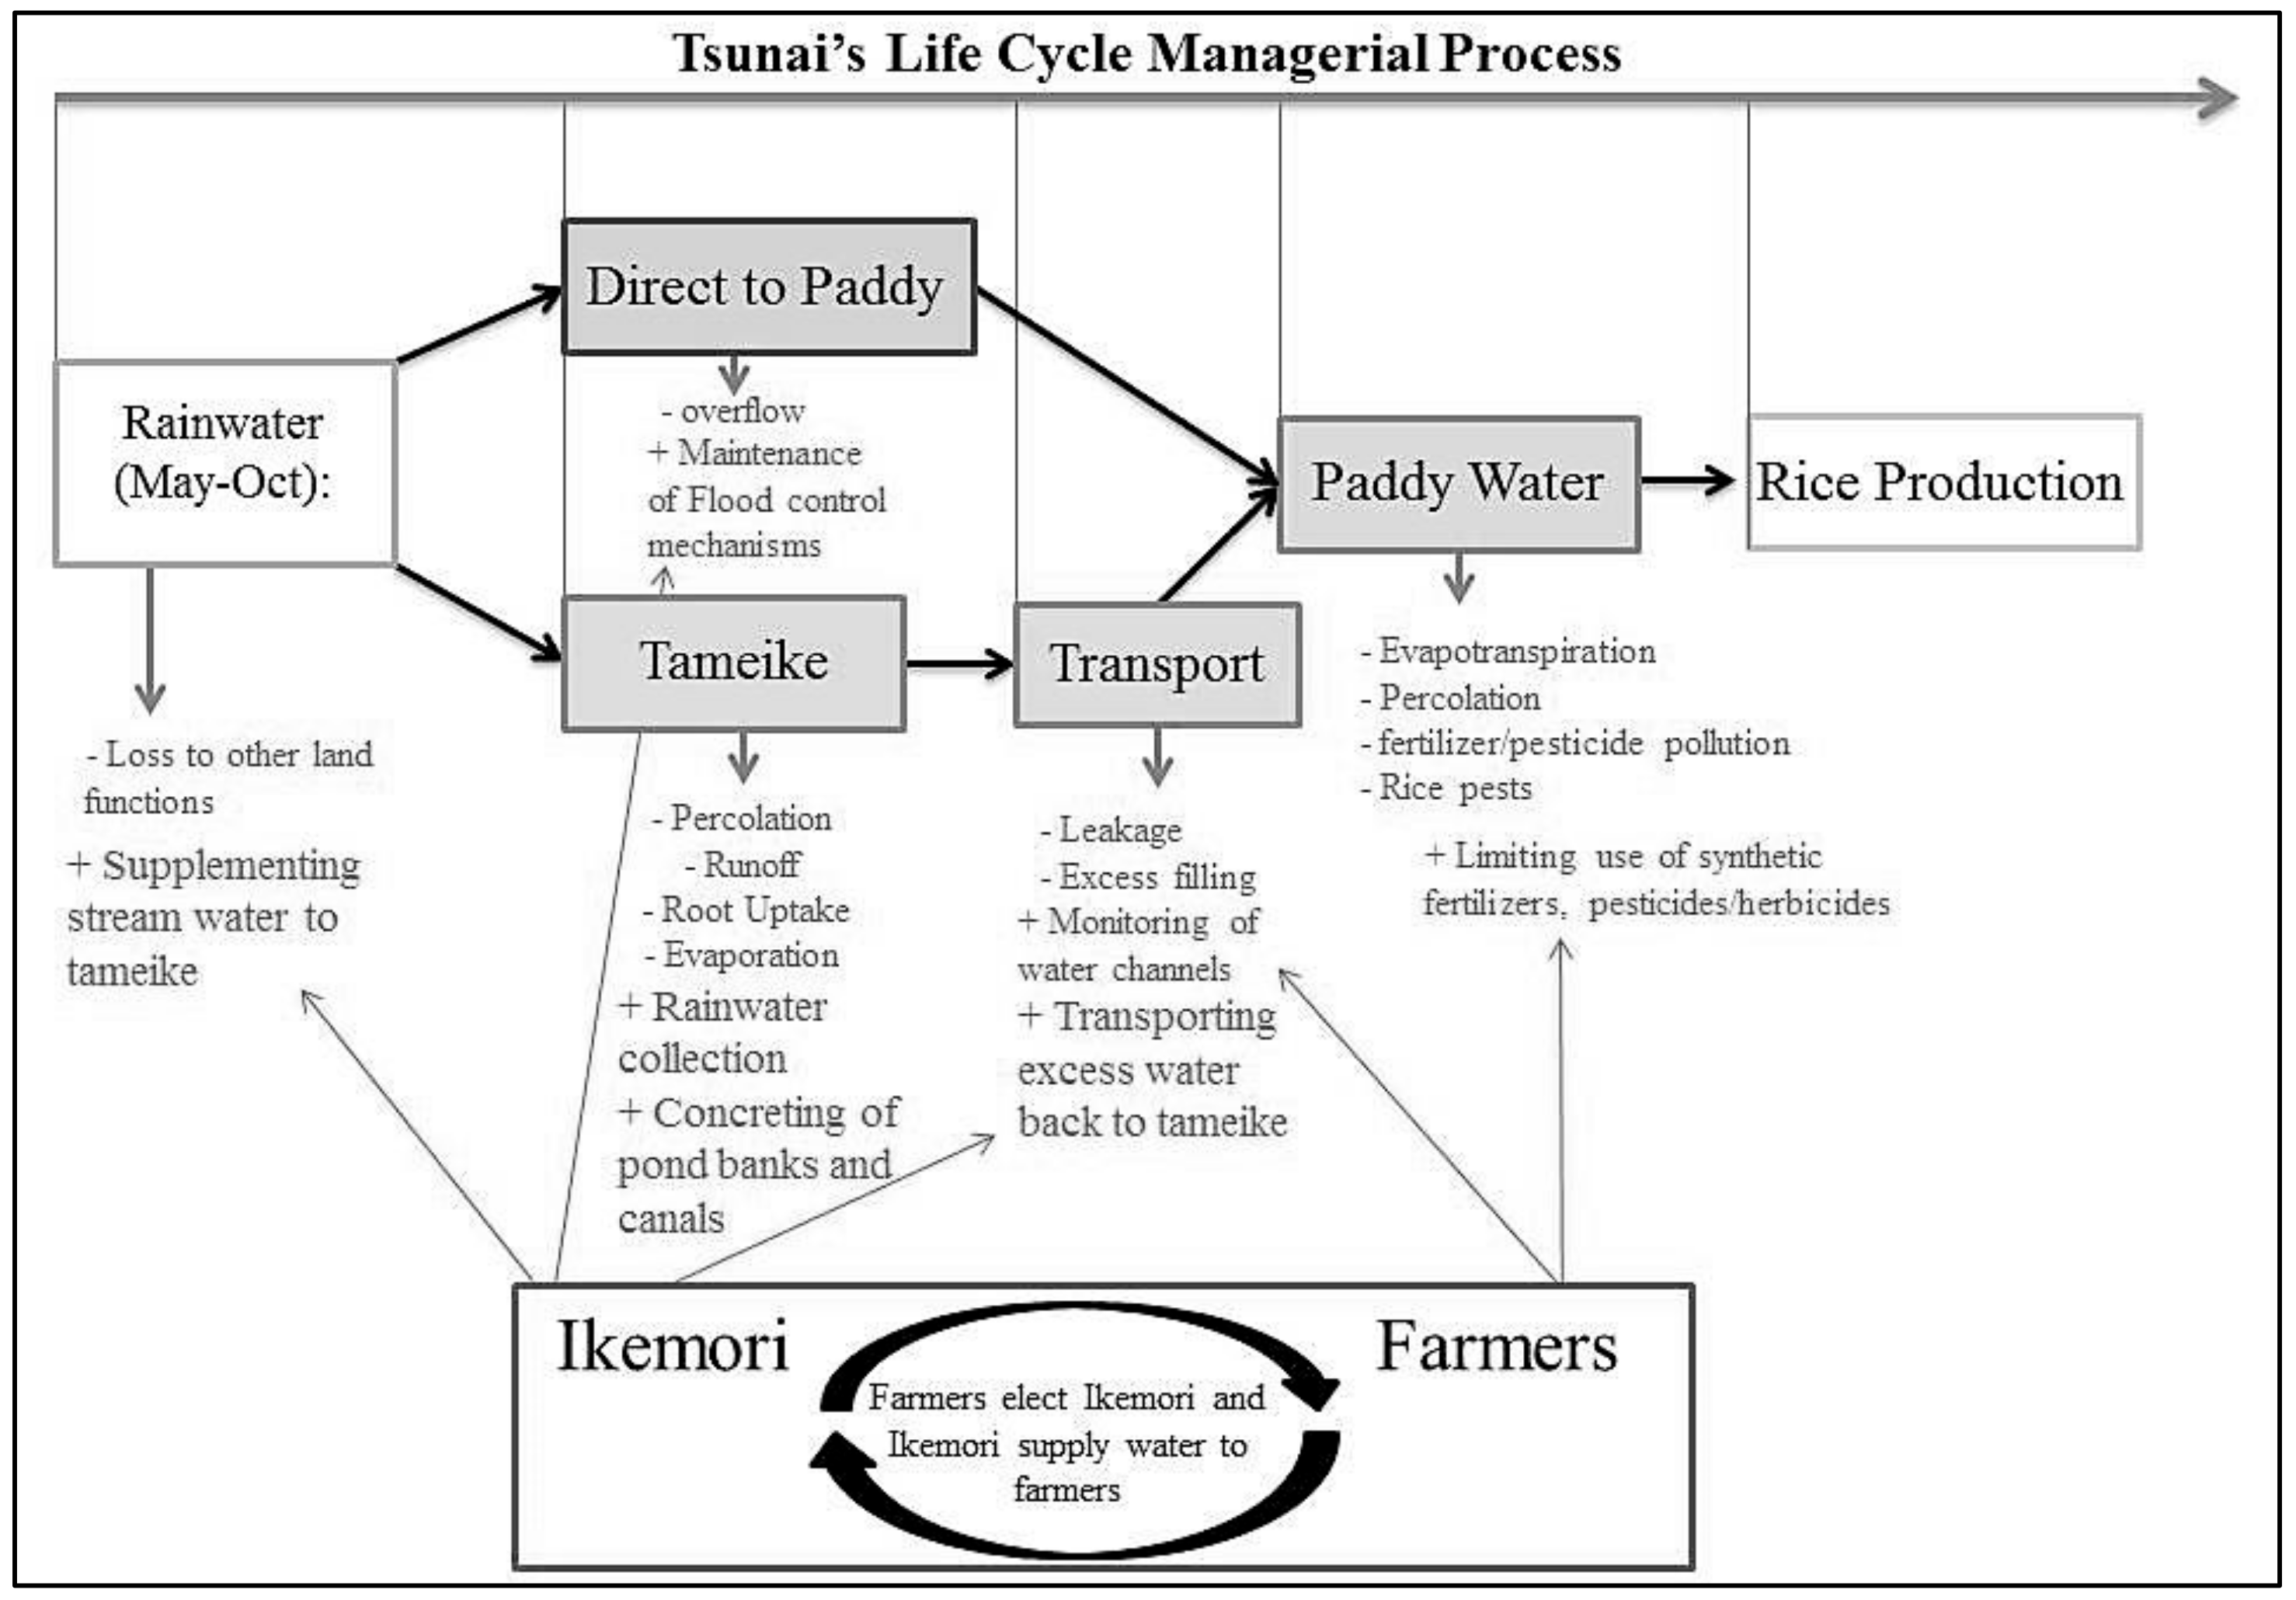
1.2. The Tameike
1.3. Aim of the Research
2. Theory
3. Methodology
3.1. Defining Metrics
3.2. Study Sites
3.3. Data Collection
3.4. Water Demand and Water Footprint
- SAT = Sum of area cultivated (m2) 0.2 m
- WL = Sum of area cultivated (m2) reported depths from surveys (m)
- ETC = Sum of area cultivated (m2) evapotranspiration (m/day) FAO crop coefficient (m) number of days from transplant to harvest
- PERC = Sum of area cultivated (m2) percolation estimated from surveys (m/day) number of days from transplant to harvest
3.5. Water Quality
4. Results
4.1. Bonding Social Capital
4.2. Bridging and Linking Social Capital
4.3. Structural, Cognitive, and Relational Social Capital
4.4. Water Demand and Water Footprint
4.5. Water Quality
4.6. Managerial Effectiveness
4.7. Summary of Survey Results
5. Discussion
6. Conclusions
Author Contributions
Funding
Acknowledgments
Conflicts of Interest
References
- Rijsberman, F.R. Water scarcity: Fact or fiction? Agric. Water Manag. 2006, 80, 5–22. [Google Scholar] [CrossRef] [Green Version]
- Yi Loo, Y.; Billa, L.; Singh, A. Effect of climate change on seasonal monsoon in Asia and its impact on the variability of monsoon rainfall in Southeast Asia. Geosci. Front. 2015, 6, 817–823. [Google Scholar] [CrossRef] [Green Version]
- Singh, A. Soil salinization and waterlogging: A threat to environment and agricultural sustainability. Ecol. Indic. 2015, 57, 128–130. [Google Scholar] [CrossRef]
- Darryl, B.; Virkler, L. Farm to Table: The Essential Guide to Sustainable Food Systems for Students, Professionals, and Consumers; Chelsea Green Publishing: Hartford, VT, USA, 2016. [Google Scholar]
- Morrow, D.; Olivar, M.; Garz, H. Water Scarcity: Will Investors be Left High and Dry. Available online: https://www.longfinance.net/media/documents/Sustainalytics_Thematic_Research_Water_Scarcity_2016.pdf (accessed on 31 December 2019).
- Duncan, D. Freshwater under Threat: Pacific islands: Vulnerability Assessment of Freshwater Resources to Environmental Change. Available online: https://www.zaragoza.es/contenidos/medioambiente/onu/830_eng.pdf (accessed on 31 December 2019).
- Fa’anunu, J. Adaptation to Water Ccarcity in the Context of Climate Change: A Case Study of the Nuku’alofa and Hihifo Districts, Tongatapu. Research Commons. Master’s Thesis, University of Waikato, Hamilton, New Zealand, 2017. [Google Scholar]
- Jha, N.; Schoenfelder, J. Studies of the Subak: New Directions, New Challenges. Hum. Ecol. 2011, 39, 3–10. [Google Scholar]
- Lansing, J.S.; Fox, K.M. Niche construction on Bali: The gods of the countryside. Phil. Trans. R. Soc. B 2011, 366, 927–934. [Google Scholar] [CrossRef] [PubMed] [Green Version]
- Lansing, J.S.; Kremer, J.N. Emergent properties of Balinese water temple networks: Coadaptation on a rugged fitness landscape. Am. Anthropol. 1993, 95, 97–114. [Google Scholar] [CrossRef]
- Lansing, J.S.; Miller, J.H. Cooperation games and ecological feedback: Some insights from Bali. Curr. Anthropol. 2005, 46, 328–334. [Google Scholar] [CrossRef]
- Pitana, I. Tri hita karana—The local wisdom of the Balinese managing development. In Trends Issues Global Tourism, 1st ed.; Conrady, R., Buck, M., Eds.; Springer-Verlag: Berlin/Heidelberg, Germany, 2010; pp. 139–150. [Google Scholar]
- Hauser-Schäublin, B. Temple and king: Resource management, rituals and redistribution in early Bali. J. R. Anthropol. Inst. 2005, 11, 747–771. [Google Scholar] [CrossRef]
- GIAHS Promotion Association of Kunisaki Peninsula. Kunisaki Peninsula Usa Integrated Forestry, Agriculture, and Fisheries System. GIAHS proposal. Available online: http://www.fao.org/giahs/giahsaroundtheworld/designated-sites/asia-and-the-pacific/kunisaki-peninsula-usa-integrated-forestry-agriculture-and-fisheries-system/en/ (accessed on 31 December 2019).
- Vafadari, K. Tameike reservoirs as agricultural heritage: From the case study of Kunisaki peninsula in Oita, Japan. J. Resour. Ecol. 2013, 4, 220–230. [Google Scholar] [CrossRef]
- Hayashi, H. Understandings of relationships between agriculture and biodiversity in Kunisaki GIAHS. J. Resour. Ecol. 2014, 5, 395–397. [Google Scholar]
- Indrawan, M.; Yabe, M.; Nomura, H.; Harrison, R. Deconstructing satoyama—The socio-ecological landscape in Japan. Ecol. Eng. 2014, 64, 77–84. [Google Scholar] [CrossRef]
- Katoh, K.; Sakai, S.; Takahashi, T. Factors maintaining species diversity in satoyama, a traditional agricultural landscape of Japan. Biol. Conserv. 2009, 142, 1930–1936. [Google Scholar] [CrossRef]
- Fuller, A.; Min, Q.; Jiao, W.; Bai, Y. Globally Important Agricultural Heritage Systems (GIAHS) of China: The challenge of complexity in research. Ecosyst. Health Sustain. 2015, 1, 1–10. [Google Scholar] [CrossRef]
- MAFF. The 90th Statistical Yearbook of Ministry of Agriculture Forestry and Fsheries. Available online: http://www.maff.go.jp/e/data/stat/90th/. (accessed on 31 December 2019).
- FAO. GIAHS Globally Important Agricultural Heritage Systems. Available online: http://www.fao.org/3/i9187en/I9187EN.pdf. (accessed on 31 December 2019).
- Lehtonen, M. The environmental-social interface of sustainable development: Capabilities, social capital, institutions. Ecol. Econ. 2004, 49, 199–214. [Google Scholar] [CrossRef]
- Isham, J.; Kahkonen, S. Institutional determinants of the impact of community-based water services: Evidence from Sri Lanka and India. Econ. Dev. Cult. Chang. 2002, 50, 667–691. [Google Scholar] [CrossRef]
- Álvarez, E.C.; Romaní, J.R. Measuring social capital: Further insights. Gac. Sanit. 2017, 31, 57–61. [Google Scholar] [CrossRef] [PubMed] [Green Version]
- Claridge, T. Social Capital and Natural Resource Management: An Important Role for Social Capital? Available online: https://www.socialcapitalresearch.com/guide-to-social-capital-the-concept-theory-and-its-research/ (accessed on 31 December 2019).
- Chartzoulakis, K.; Bertaki, M. Sustainable water management in agriculture under climate change. Agric. Agric. Sci. Procedia 2015, 4, 88–98. [Google Scholar] [CrossRef] [Green Version]
- Bhuiyan, S. Irrigation sustainability in rice-growing Asia. Can. Water Resour. J. 1993, 18, 39–52. [Google Scholar] [CrossRef]
- Wichelns, D.; Qadir, M. Achieving sustainable irrigation requires effective management of salts, soil salinity, and shallow groundwater. Agric. Water Manag. 2015, 157, 31–38. [Google Scholar] [CrossRef]
- Loof, R.; Onta, P. Introduction. Int. J. Water Resour. Dev. 1994, 10, 379–381. [Google Scholar] [CrossRef]
- Chapagain, A.; Hoekstra, A. The blue, green and grey water footprint of rice from production and consumption perspectives. Ecol. Econ. 2011, 70, 749–758. [Google Scholar] [CrossRef]
- FAO. CropWat. Available online: http://www.fao.org/land-water/databases-and-software/cropwat/en/. (accessed on 31 December 2019).
- Kyoritsu Chemical Check-Lab. River Water Test Kit. Available online: https://kyoritsu-lab.co.jp/seihin/list/az-rw-2.html (accessed on 30 December 2019).
- FAO. A new rice [Oryza sativa] cultivar “Hinohikari”. 1993. Available online: http://agris.fao.org/agris-search/search.do?recordID=JP9301826. (accessed on 31 December 2019).
- MAFF. Hinokari. Available online: http://www.maff.go.jp/kanto/syokuryou/syouhi/hakase/pdf/hinohikari.pdf. (accessed on 31 December 2019).
- Lansing, J.S. Perfect Order: Recognizing Complexity in Bali; Princeton University Press: Princeton, NJ, USA, 2006. [Google Scholar]


| Approach | Classification | Description | Example |
|---|---|---|---|
| Network Approach | Bonding | Connections within a social group or community; horizontal ties between people of similar demographics | Family, friends, neighbors, members of a local association |
| Bridging | Connections between social groups or communities; horizontal or vertical ties between people from dissimilar demographics | People of dissimilar cultural background, economic status, gender, age, etc. | |
| Linking | Connections between social groups or communities where there is a significant hierarchy; vertical ties between people from dissimilar demographics | Patron/Client, Government/Citizen, Teacher/Student | |
| Social Structure Approach | Structural | The social system through which society operates and its typical procedures that facilitate group action | Laws, traditions, modes of government, religion |
| Cognitive | Like norms, values, unspoken-rules, taboos, etc., which govern the actors within a social system | Language, culture, ceremonies, narratives | |
| Relational | Relationships between actors within a social system and the nature of said relationships | Trust, reciprocity, obligations |
| No. | Question | Ababi | Tsunai |
|---|---|---|---|
| G4 | What is your religious affiliation? | 100% Hindu | 100% Buddhist |
| S1 | Average time living in the area? | 51 years (Whole Life) | 70.7 years (Whole Life) |
| S2 | The average amount of generations living in the area: | 3.7 | 4 |
| S3 | Do you have any children or grandchildren? | 100% yes | 91% yes |
| S4 | Do/did any of your children or grandchildren attend schools in your area? | 75% yes | 90% yes |
| S5 | Do any of your children/grandchildren help with farming? | 75% yes | 50% yes |
| S6(a) | Do you have a spouse? | 92% yes | 82% yes |
| S6(b) | Does your spouse help with farming? | 91% yes | 72% yes |
| S7(a) | Have you been in a leadership position before? | 50% yes | 82% yes |
| S7(b) | The average amount of time spent in a leadership position? | 9.9 years | 4.7 years |
| No. | Question | Ababi | Tsunai |
|---|---|---|---|
| S9 | I have neighbors in (system name) with whom I am close. | 1.5 | 0.89 |
| S10 | On average, I contact at least one of these neighbors ____. (top 2 answers) | Every day/2–3 times a week | Twice a month/2–3 times a week |
| S11 | I usually talk to them about _____. (Top 2 answers) | Farming/Group or cultural activities | Farming/Everyday things |
| S12 | I have farmers outside of (system name) with whom I am close. | 1 | 0.63 |
| S13 | On average, I contact at least one of these people ____. (Top 2 answers) | Once a month/Less than once a month | Once a month/Twice a month |
| S14 | I usually talk to them about _____. (Top 2 answers) | Farming/Group or cultural activities | Farming/Everyday things |
| S15 | I mostly agree with other farmers in my system about farming methods and schedules. | 1.42 | 0.5 |
| S16 | I mostly agree with other farmers in my system about everyday affairs. | 1.36 | 0.63 |
| No. | Question | Ababi | Tsunai |
|---|---|---|---|
| S26/S29 | I often participate in (system name)’s events, festivals, or ceremonies. | 1.5 | 1 |
| S27/S30 | I often participate in events, festivals, or ceremonies outside of (system name). | 0.73 | 0 |
| S29/S32 | My spouse is equally active in the community’s cultural affairs and events. | 1.5 | 0.33 |
| S33/S35 | There is a new organic production method being used and promoted in the town next to (system name). The farmer using it apparently experienced a cut in production costs and a rise in revenue. This farmer gives a workshop on this new method in (system name) and offers to train everyone for free. What do you think best reflects your attitude in this situation? (top 2 answers). | I will try it, but only if a few other farmers in (system name) try it too/I will try it, but only if all the farmers in (system name) try it too. | I will try it, but only if all the farmers in (system name) try it too/I will try it, but only if a few other farmers in (system name) try it too. |
| Farmer # | Organizations and Events Participated | Ababi | Outside |
|---|---|---|---|
| 1 | Subak Leader Water Management Training Program | 0 | 1 |
| 2 | Fish Farming Coop | 1 | 0 |
| 3 | Village Choir Group | 1 | 0 |
| 4 | Gamelan, Government Sponsored Agricultural Classes | 1 | 1 |
| 5 | n/a | 0 | 0 |
| 6 | Gamelan | 1 | 0 |
| 7 | n/a | 0 | 0 |
| 8 | Gamelan | 1 | 0 |
| 9 | n/a | 0 | 0 |
| 10 | Gamelan | 1 | 0 |
| 11 | Temple Leader | 1 | 0 |
| 12 | Gamelan | 1 | 0 |
| Farmer # | Organizations and Events Participated | Tsunai | Outside |
| 1 | Daishi Matsuri, Ike Matsuri | 1 | 1 |
| 2 | n/a | 0 | 0 |
| 3 | Usa-Kunisaki GIAHS Promotion Council, Kunisaki Agricultural Dept., Kunisaki Tourism Department, Kunisaki City Hall Other, Agricultural Coop., Fisheries Coop., Forestry Coop., Land Improvement Bureau, East Oita Promotional Office, Daishi Matsuri, Ike Matsuri | 2 | 9 |
| 4 | Kunisaki Agricultural Dept., Forestry Coop., Ike Matsuri | 0 | 3 |
| 5 | n/a | 0 | 0 |
| 6 | Daishi Matsuri, Suijin Matsuri, Ike Matsuri | 3 | 0 |
| 7 | n/a | 0 | 0 |
| 8 | Kunisaki Agricultural Dept., Agricultural Coop., Forestry Coop., Land Improvement Bureau, Suijin Matsuri, Ike Matsuri | 2 | 4 |
| 9 | Agricultural Coop., Forestry Coop., Ike Matsuri | 1 | 2 |
| 10 | Daishi Matsuri, Suijin Matsuri, ike Matsuri, Other Matsuri | 3 | 1 |
| 11 | Agricultural Coop., Daishi Matsuri, Ike Matsuri | 2 | 1 |
| Type | No. | Question | Ababi | Tsunai |
|---|---|---|---|---|
| Structural Social Capital | S7(b) | The average amount of time spent in a leadership position? | 9.9 years | 4.7 years |
| S25/S28 | The position and authority of the subak/ikemori are respected. | 1.58 | 0.73 | |
| S26/S29 | I often participate in cultural events in (system name). | 1.5 | 1 | |
| S32/S24 | Can you estimate how many times you’ve discovered a leak in the irrigation? | >10 | 4.13 | |
| S19(Tsunai) | The tameike are necessary for the success of agriculture in Tsunai. | n/a | 1.36 | |
| S18/S20 | The subak/the ikemori is/are necessary for successful water management in (system name). | 1.45 | 1.2 | |
| S19/S21 | The way in which water is disseminated is fair to all farmers in (system name). | 1.27 | 1 | |
| S22(Tsunai) | The price of water from tameike is fair. | n/a | 0.9 | |
| Cognitive Social Capital | S17(Tsunai) | After achieving the GIAHS designation, I have more pride in my community. | n/a | 0.89 |
| S17/S18 | Agriculture done in (system name) is special or exceptional among others. | 0.6 | 0.4 | |
| S24/S27 | I feel that I have the freedom to farm in the manner in which I please. | −0.3 | 0.2 | |
| S28/S31 | Temples, shrines, and other cultural sites in Karangasem/Kunisaki are important to me. | 1.5 | 0.56 | |
| Relational Social Capital | S21/S23 | Theft of irrigation water does not occur in (system name). | 1.45 | 0 |
| S24(Tsunai) | If the population of Tsunai were to increase, the frequency of water theft would also increase. | n/a | 0 | |
| S22/S25 | I feel that I am included in important decision-making on water management. | 1.45 | 0.9 | |
| S23/S26 | I feel that the inclusion of all farmers in decision-making is necessary. | 1.6 | 1 | |
| S30/S33 | In regards to farming and my general affairs, ________________. | I usually ask others for advice or help/I usually give and receive advice or help. | I usually give and receive advice or help/I work best alone. |
| Ababi | Tsunai | |
|---|---|---|
| Water Demand (m/m2) | 0.84 | 1.15 |
| Water Footprint (m3/t) | Blue—3159.89 Green—2088.95 Total—5248.84 | Blue—980.84 Green—765.73 Total—1746.57 |
| Ababi | Tsunai | Ideal Conditions * | |
|---|---|---|---|
| pH | 6.75 | 7.04 | 6.5–8.4 |
| COD | 5.125 mg/L | 7.97 mg/L | 0–5 mg/L |
| NH4 | 0.15 mg/L | 0.2 mg/L | ≤0.2 mg/L |
| NO2 | 0.0017 mg/L | 0.0056 mg/L | ≤0.02 mg/L |
| NO3 | 0.4125 mg/L | 0.22 mg/L | 1–2 mg/L |
| PO4 | 0.01 mg/L | 0.058 mg/L | ≤0.05 mg/L |
| Ababi | Tsunai | |
|---|---|---|
| Social Capital | Highest social capital overall and especially high bonding, relational, and structural social capital | Somewhat lower overall social capital, but higher amounts of bridging and linking |
| Water Demand (m/m2) | 0.84 | 1.15 |
| Water Footprint (m3/t) | Blue—3159.89, Green—2088.95 Total—5248.84 | Blue—980.84, Green—765.73 Total—1746.57 |
| Water Quality | Fair | Fair |
| Managerial Effectiveness | High satisfaction, but stealing does occur | Medium-high satisfaction, but stealing does occur and water scarcity a concern |
© 2020 by the authors. Licensee MDPI, Basel, Switzerland. This article is an open access article distributed under the terms and conditions of the Creative Commons Attribution (CC BY) license (http://creativecommons.org/licenses/by/4.0/).
Share and Cite
Scott Jansing, M.; Mahichi, F.; Dasanayake, R. Sustainable Irrigation Management in Paddy Rice Agriculture: A Comparative Case Study of Karangasem Indonesia and Kunisaki Japan. Sustainability 2020, 12, 1180. https://doi.org/10.3390/su12031180
Scott Jansing M, Mahichi F, Dasanayake R. Sustainable Irrigation Management in Paddy Rice Agriculture: A Comparative Case Study of Karangasem Indonesia and Kunisaki Japan. Sustainability. 2020; 12(3):1180. https://doi.org/10.3390/su12031180
Chicago/Turabian StyleScott Jansing, Matthew, Faezeh Mahichi, and Ranahansa Dasanayake. 2020. "Sustainable Irrigation Management in Paddy Rice Agriculture: A Comparative Case Study of Karangasem Indonesia and Kunisaki Japan" Sustainability 12, no. 3: 1180. https://doi.org/10.3390/su12031180