1. Introduction
As basic natural resources and strategic economic resources, water resources are of great significance to sustainable economic development under the strategy of ecological civilization construction. The worldwide increasing demand of water resources is the main problem for the sustainable utilization of water resources [
1]. Water scarcity is mainly caused by overexploitation of water resources, population growth, pollution, and increasing demand for economic development [
2,
3]. With the rapid development of the economy, the amount of water used is increasing and the problem of water shortage caused by economic development has become the focus of academic circles [
4]. Improving water-use efficiency is one of the most effective ways to solve the problem of water shortage [
5]. There is an interactive coupling relationship between water-use efficiency and economic development. On the one hand, the demand for water increases as the economy develops, and the discharged pollutants may pollute the water body and reduce the available water amount. However, at the same time, the improvement of water-use efficiency and water environment also benefits from the financial and technical supports provided by economic development. On the other hand, the improvement of water-use efficiency is conducive to alleviating water shortage, reducing water environmental pollution, and providing high-quality and sufficient water resources for rapid and high-quality economic development. Economic development acts on water resources, but is also subject to the countermeasures and constraints of water resources. High-quality and sufficient water resources can not only promote benign economic development, but also provide power and conditions for the high-quality improvement of the social and economic systems. Therefore, it is of great significance to study the coupling coordination relationship between water-use efficiency and economic development to achieve the sustainable utilization of water resources and promote sustainable economic development.
In recent years, scholars have made some advances in their research studies on the relationship between water resources and economic development. From the world’s point of view, Piamchan studied the relationship of water use for agricultural purposes in 154 countries and their economic development [
6].
From the country or region’s point of view, Ekin et al. defined the role of economic valuation techniques in assisting in the design of efficient, equitable, and sustainable policies for water resource management in the face of environmental problems such as pollution, intensive land use in agriculture, and climate change [
7]. Joel et al. used data envelopment analysis (DEA) to measure the relative technical efficiency of urban water utilities in regional New South Wales (NSW) and Victoria for measuring the efficiency consequences of a number of recent urban water policy initiatives [
8]. Suinyuy et al. adapted the transcendental logarithmic production model to examine the role of water resource consumption on economic growth in 38 Sub-Saharan African (SSA) countries [
9]. Wu used the decoupling theory to compare the evolution of economic development and water resource utilization in China and the United States [
10]. Hao et al. studied the relationship between water use and economic growth using panel data from 29 provinces in China from 1999 to 2014 with the theoretical framework of the environmental Kuznets curve [
11]. Gedefaw et al. developed a water evaluation and planning (WEAP) model to allocate the water supplies to demanding sectors based on an economic parameter to maximize the economic benefits [
12]. Arain et al. explored the empirical relationship between foreign direct investment (FDI), population, energy production, and water resources in South Asia with the newly developed approach called dynamic common correlated effects [
13]. Alexandratos et al. pointed out that the regional competition for water resources impacts both energy and water supply reliability, which requires that nations balance both for sustainable economic development [
14].
From the city’s point of view, Li and Li, Wu and Guan, Hu, and Geng et al. studied the coupling coordination relationship between water-use efficiency and economic development with a coupling coordination degree model [
15,
16,
17,
18].
Scholars have studied the relationship between water resource utilization and economic development in different ways from different spatial scales. The above examples from the literature provide much theoretical basis and many beneficial references. However, there are few studies on the coupling and coordination relationship between urban water-use efficiency and economic development, and the evaluation indexes of the two systems are not comprehensive and reasonable, thus affecting the accuracy of the coupling and coordination evaluation of the two systems. Therefore, for this paper, we selected Jinan of Shandong Province as representative of a capital city with a water shortage in North China. The water-use efficiency system was constructed from the four aspects of synthesis, production, life, and ecology, and the economic development system was constructed from the three aspects of economic scale, economic structure, and economic vitality. The entropy weight and the comprehensive evaluation methods were used to determine the weight of each index of the two systems and to evaluate them comprehensively. A coupling coordination model was used to calculate the coupling degree, coordination degree, and coupling coordination degree of the two systems. The coupling stage and coupling coordination intensity of the two systems were analyzed and determined annually. This paper reveals the factors influencing the coordinated development of water resources and economy, and discusses the policies and measures necessary to promote the evolution of water-use efficiency and economic development into a coordinated, orderly, healthy and sustainable development. This research provides a theoretical basis and practical guidance for achieving the benign interaction between urban water-use efficiency and economic development under the strategy of ecological civilization construction.
2. Materials and Methods
2.1. Study Area
Jinan is the capital of Shandong Province. By the end of 2017, the area had reached 7998 km2, the permanent population, 7.3212 million, and the GDP, 720.196 billion yuan. Jinan remains in the forefront of Shandong Province according to the comprehensive economy. It is an important comprehensive industrial city in Shandong Province. The per capita water resources of China are only equal to one fourth of the world per capita water resources and those of Jinan are only one seventh of those of China, and the geographical distribution is uneven. Therefore, it is urgent to analyze the coordination degree between water-use efficiency and economic development, in order to provide information supports for formulating economic development strategies coordinated with water-use efficiency, facilitate scientific management and protection of water resources, and promote the coordinated and orderly development of water resources and the economy.
2.2. Construction of the Evaluation Index System
According to the Jinan’s actual situation, the integrated system of water-use efficiency and economic development is divided into water-use efficiency subsystem and economic development subsystem (hereinafter referred to as WUES and EDS). The water-use efficiency subsystem is then divided into 13 evaluation indexes in 4 aspects: comprehensive water-use efficiency, production water-use efficiency, domestic water-use efficiency, and ecological water-use efficiency (hereinafter referred to as CWUE, PWUE, DWUE, and EWUE). For the economic development subsystem, 9 evaluation indexes were selected in terms of economic scale, economic structure, and economic vitality (hereinafter referred to as ESC, EST, and EV).
In WUES, the 13 indicators in 4 aspects were selected as follows:
CWUE. Here, 2 indexes, namely water consumption per 10,000 yuan of GDP (X1) and integrated water consumption per capita (X2), were selected from the level of water consumption per capita in the whole industry and region.
PWUE. The proportion of industrial water consumption in total water consumption (X3) and water consumption per 10,000 yuan added value of industry (X4) were selected to reflect the level of industrial water consumption. The proportion of irrigation water consumption in total water consumption (X5), water consumption per 10,000 yuan added value of agriculture (X6), and water consumption per unit area for irrigation (X7) were selected to reflect the level of agricultural water consumption.
DWUE. Daily domestic water consumption per capita (X8) and the proportion of domestic water consumption in total water consumption (X9) were selected to reflect the level of domestic water consumption.
EWUE. Because the sewage produced by industrial water consumption and urban domestic water consumption puts pressure on the ecological environment, and indirectly affects the water consumption of the whole industry, 3 indexes, namely waste water discharge of 100 million yuan GDP (X10), sewage treatment rate (X11), and the proportion of ecological water consumption in total water consumption (X13), were selected. The greater the precipitation, the better the ecological environment; therefore, annual precipitation (X12) was selected.
In EDS, the 9 indexes in 3 aspects were selected as follows:
ESC. GDP per capita (X14) comprehensively reflects regional economic scale and wealth. Per capita disposable income of urban residents (X15) reflects the regional consumption capacity from the perspective of expenditures. Total fixed assets investment (X16) reflects the ability to improve material and cultural life.
EST. The proportion of the added value of the tertiary industry in GDP (X17) and the proportion of non-agricultural production value in GDP (X19) are important reflections of the economic structure, and are directly related to the growth potential and competitiveness of the region. Rural Engel’s coefficient (X18) reflects the living standard of the grass-roots people in the region from the proportion of farmers’ food expenditures. The proportion of fiscal spending in GDP (X20) reflects the power source of regional economic growth and measures the sustainability of regional economic growth.
EV. The growth rate of GDP (X21) was selected to reflect the economic growth rate, and the labor productivity of the whole society (X22) was selected to reflect the vitality of economic growth.
The coupling coordination evaluation index system of the integrated system of water-use efficiency and economic development in Jinan is shown in
Table 1.
2.3. Sources of Data
The data were obtained from the statistical yearbook of Jinan, the bulletin of water resources of Jinan, the statistical bulletin of national economy and social development of Jinan, as well as relevant statistical data and planning reports for Jinan.
2.4. Entropy Weight Method and Comprehensive Evaluation Method
2.4.1. Entropy Weight Method
In information theory, entropy is used to measure the degree of system disorder and the amount of effective information provided by data [
19].Therefore, entropy can be used to determine the weight of an index. When the values of a certain index of the evaluation object differ greatly, the entropy value is smaller, indicating that the index provides a large amount of effective information and the weight of the index should be larger. Conversely, if the value difference of an index is smaller, the entropy value is larger, indicating that the index provides a small amount of effective information and the weight of the index should be smaller [
20]. The entropy weight method is a weighting method based on the law of statistical change of data. By calculating the formula, the weight of each index is obtained. If no artificial and subjective factors are involved, the assignment is relatively objective, and the result is authentic [
21]. The entropy weight and the comprehensive evaluation methods were combined to evaluate WUES and EDS.
The judgment matrix
X based on samples and evaluation indexes can be constructed as:
where
n is the total number of samples and
m is the total number of evaluation indexes.
The normalized judgment matrix
B can be expressed as:
where
can be calculated using Equations (3) and (4).
where
and
are, respectively, the most satisfied and least satisfied in different samples under the same index. Equation (3) is the treatment equation of negative indicator, and Equation (4) is the treatment equation of positive indicator.
According to the definition of entropy, the entropy of the
ith evaluation index is as follows:
where
can be calculated as:
The entropy weight
of the
ith evaluation index can be calculated as:
The weights of the coupling coordination evaluation indexes of WUES and EDS in Jinan are shown in
Table 1.
2.4.2. Comprehensive Evaluation Method
The annual comprehensive evaluation value of each system can be calculated as:
The comprehensive evaluation value can be used to evaluate the state of the system. The bigger the value, the better the state of the system.
2.5. Coupling Coordination Degree Model
Coupling originates from testing and research on the interaction and correlation of multiple systems in physics. By referring to the coupling method, the degree of synergy between WUES and EDS can be measured. According to the concept of volumetric coupling and the volumetric coupling coefficient model [
4], the coupling degree model between the two systems is as follows:
where
C is the coupling degree, and
and
are the comprehensive evaluation values of WUES and EDS.
According to the segmented method of the coupling coordination degree proposed by many scholars [
22,
23,
24], when
C equals 0, the coupling degree is minimal, the two systems or internal elements of the same system are irrelevant, and the two systems develop into disorder. When
C is in the range of
,
,
, or
, the two systems are in low-level coupling, antagonistic, running-in, or high-level coupling stage, respectively. When
C equals to 1, the coupling degree is maximal, and the benign resonance and efficient coordination between the two systems are achieved.
In order to better judge the coordination degree of interaction coupling between WUES and EDS, we referred to Liao ’s model of coordinated development [
25]. The two equations in Liao’s model are as follows:
In Equation (10), T is the comprehensive coordination index of WUES and EDS, reflecting the integrated synergistic effect of the two systems. and are the weight coefficients. Since the influences of WUES and EDS on Jinan can be thought to be the same, we made and equal to 0.5. In Equation (11), D is the coupling coordination degree of WUES and EDS. When D is in the range of , , , or , the two systems are at the state of low degree, moderately, highly, or extremely coordinated coupling, respectively.
The coupling coordination degree model can be used to judge the coupling coordination level of WUES and EDS, but it cannot be used to determine the relative development level between the two systems. In order to make up for the deficiency, the relative development degree [
26] is introduced as follows:
where
E is the relative development degree. When
E is in the range of
, the level of water-use efficiency (hereinafter referred to as WUE) is low, economic development (hereinafter referred to as ED) is fast, the former restricts the social and economic development, and the use of water resources is in the stage of extensive use. When
E is in the range of
, WUES and EDS are in the stage of benign interaction, mutual promotion, and balanced coordination. When
E is greater than or is equal to 1.2, the level of water resource utilization is ahead of ED, the quality of ED is not high, and water resources are in the stage of overexploitation.
3. Results
3.1. Comprehensive Evaluation of WUES and EDS
Calculated with Equations (8) and (12), the comprehensive evaluation values and the relative development degrees of WUES and EDS in Jinan from 2008 to 2017 are shown in
Table 2. According to
Table 2, the temporal changes of the comprehensive evaluation values and the relative development degrees are shown in
Figure 1,
Figure 2 and
Figure 3.
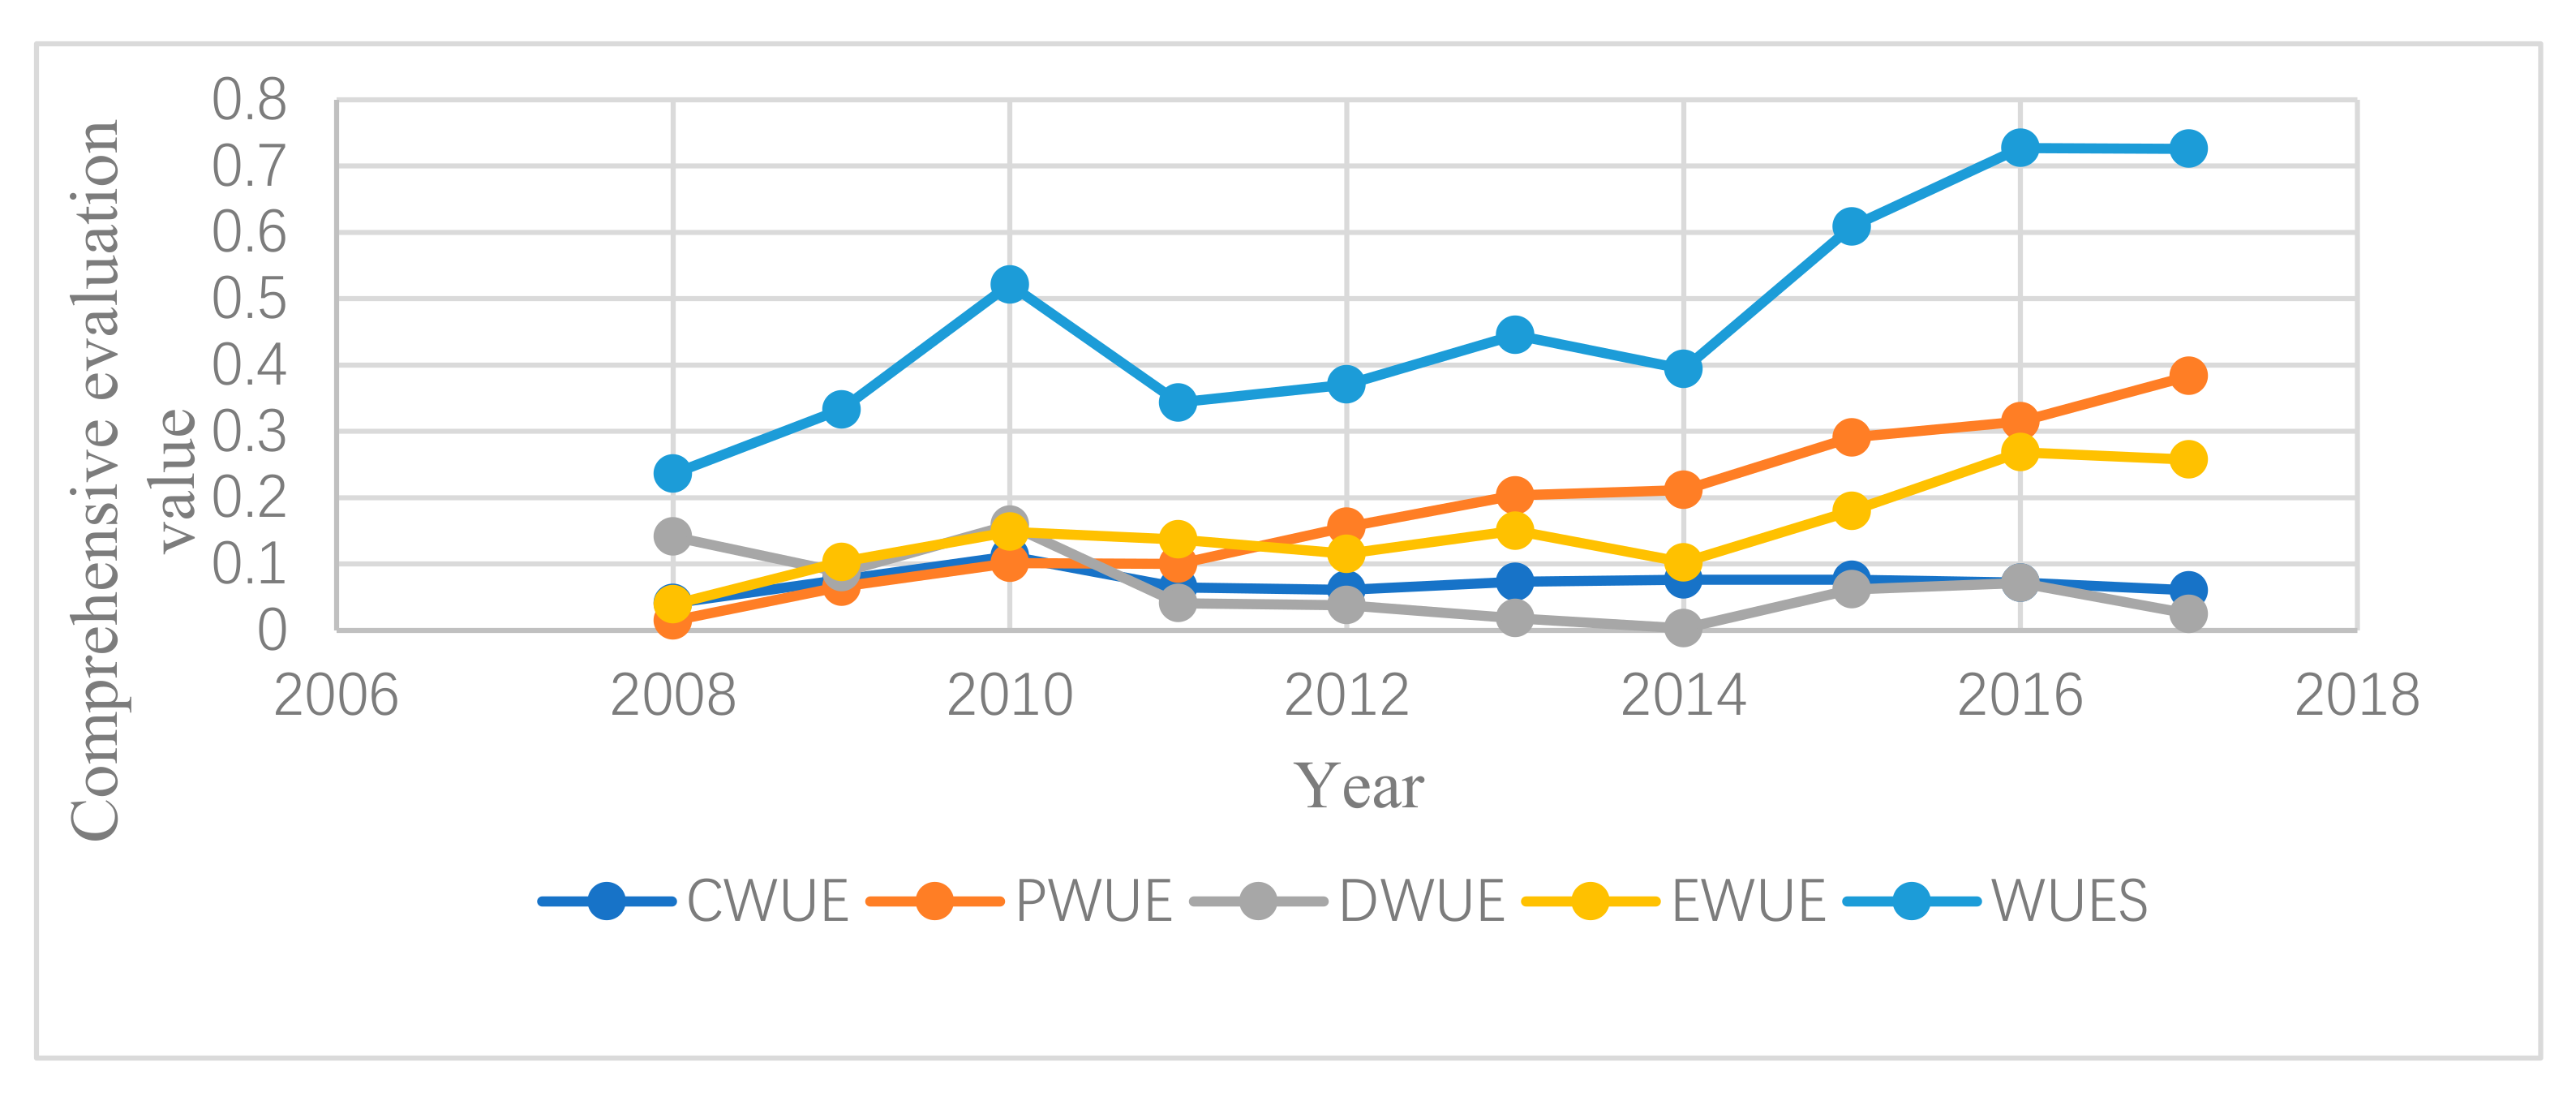
3.1.1. Comprehensive Evaluation of WUES
As can be seen from
Figure 1, from 2008 to 2017, the comprehensive evaluation values of WUES in Jinan increased as a whole. There was an obvious decline in 2011, a slight decline in 2014, and the maximum value in 2016. In 2011, the CWUE, DWUE, PWUE, and EWUE all declined, resulting in a sharp decline of WUE, with the comprehensive evaluation value of WUES dropping from 0.521 in 2010 to 0.343. The reasons might be as follows: (1) The precipitation in 2011 was significantly lower than that in 2010, which resulted in a larger proportion of agricultural water consumption. However, the WUE of agriculture was lower than that of industry and ecology, which was mainly reflected in the higher water consumption per unit area for irrigation and the higher water consumption per 10,000 yuan of agricultural GDP. (2) Although the precipitation decreased, both daily domestic water consumption per capita and the proportion of domestic water consumption in total water consumption obviously increased compared with 2010. (3) Both water consumption per 10,000 yuan of GDP and integrated water consumption per capita increased significantly compared with 2010. The main reason for the slight decline in the comprehensive evaluation value of WUES in 2014 might be the decline in precipitation and the increase of daily domestic water consumption per capita and integrated water consumption per capita compared with 2013. The reason why the comprehensive evaluation value of WUES reached the maximum value in 2016 might be that, although the comprehensive evaluation value of CWUE decreased slightly compared with that in 2015, the values of PWUE, DWUE, and EWUE increased significantly compared with those in 2015.
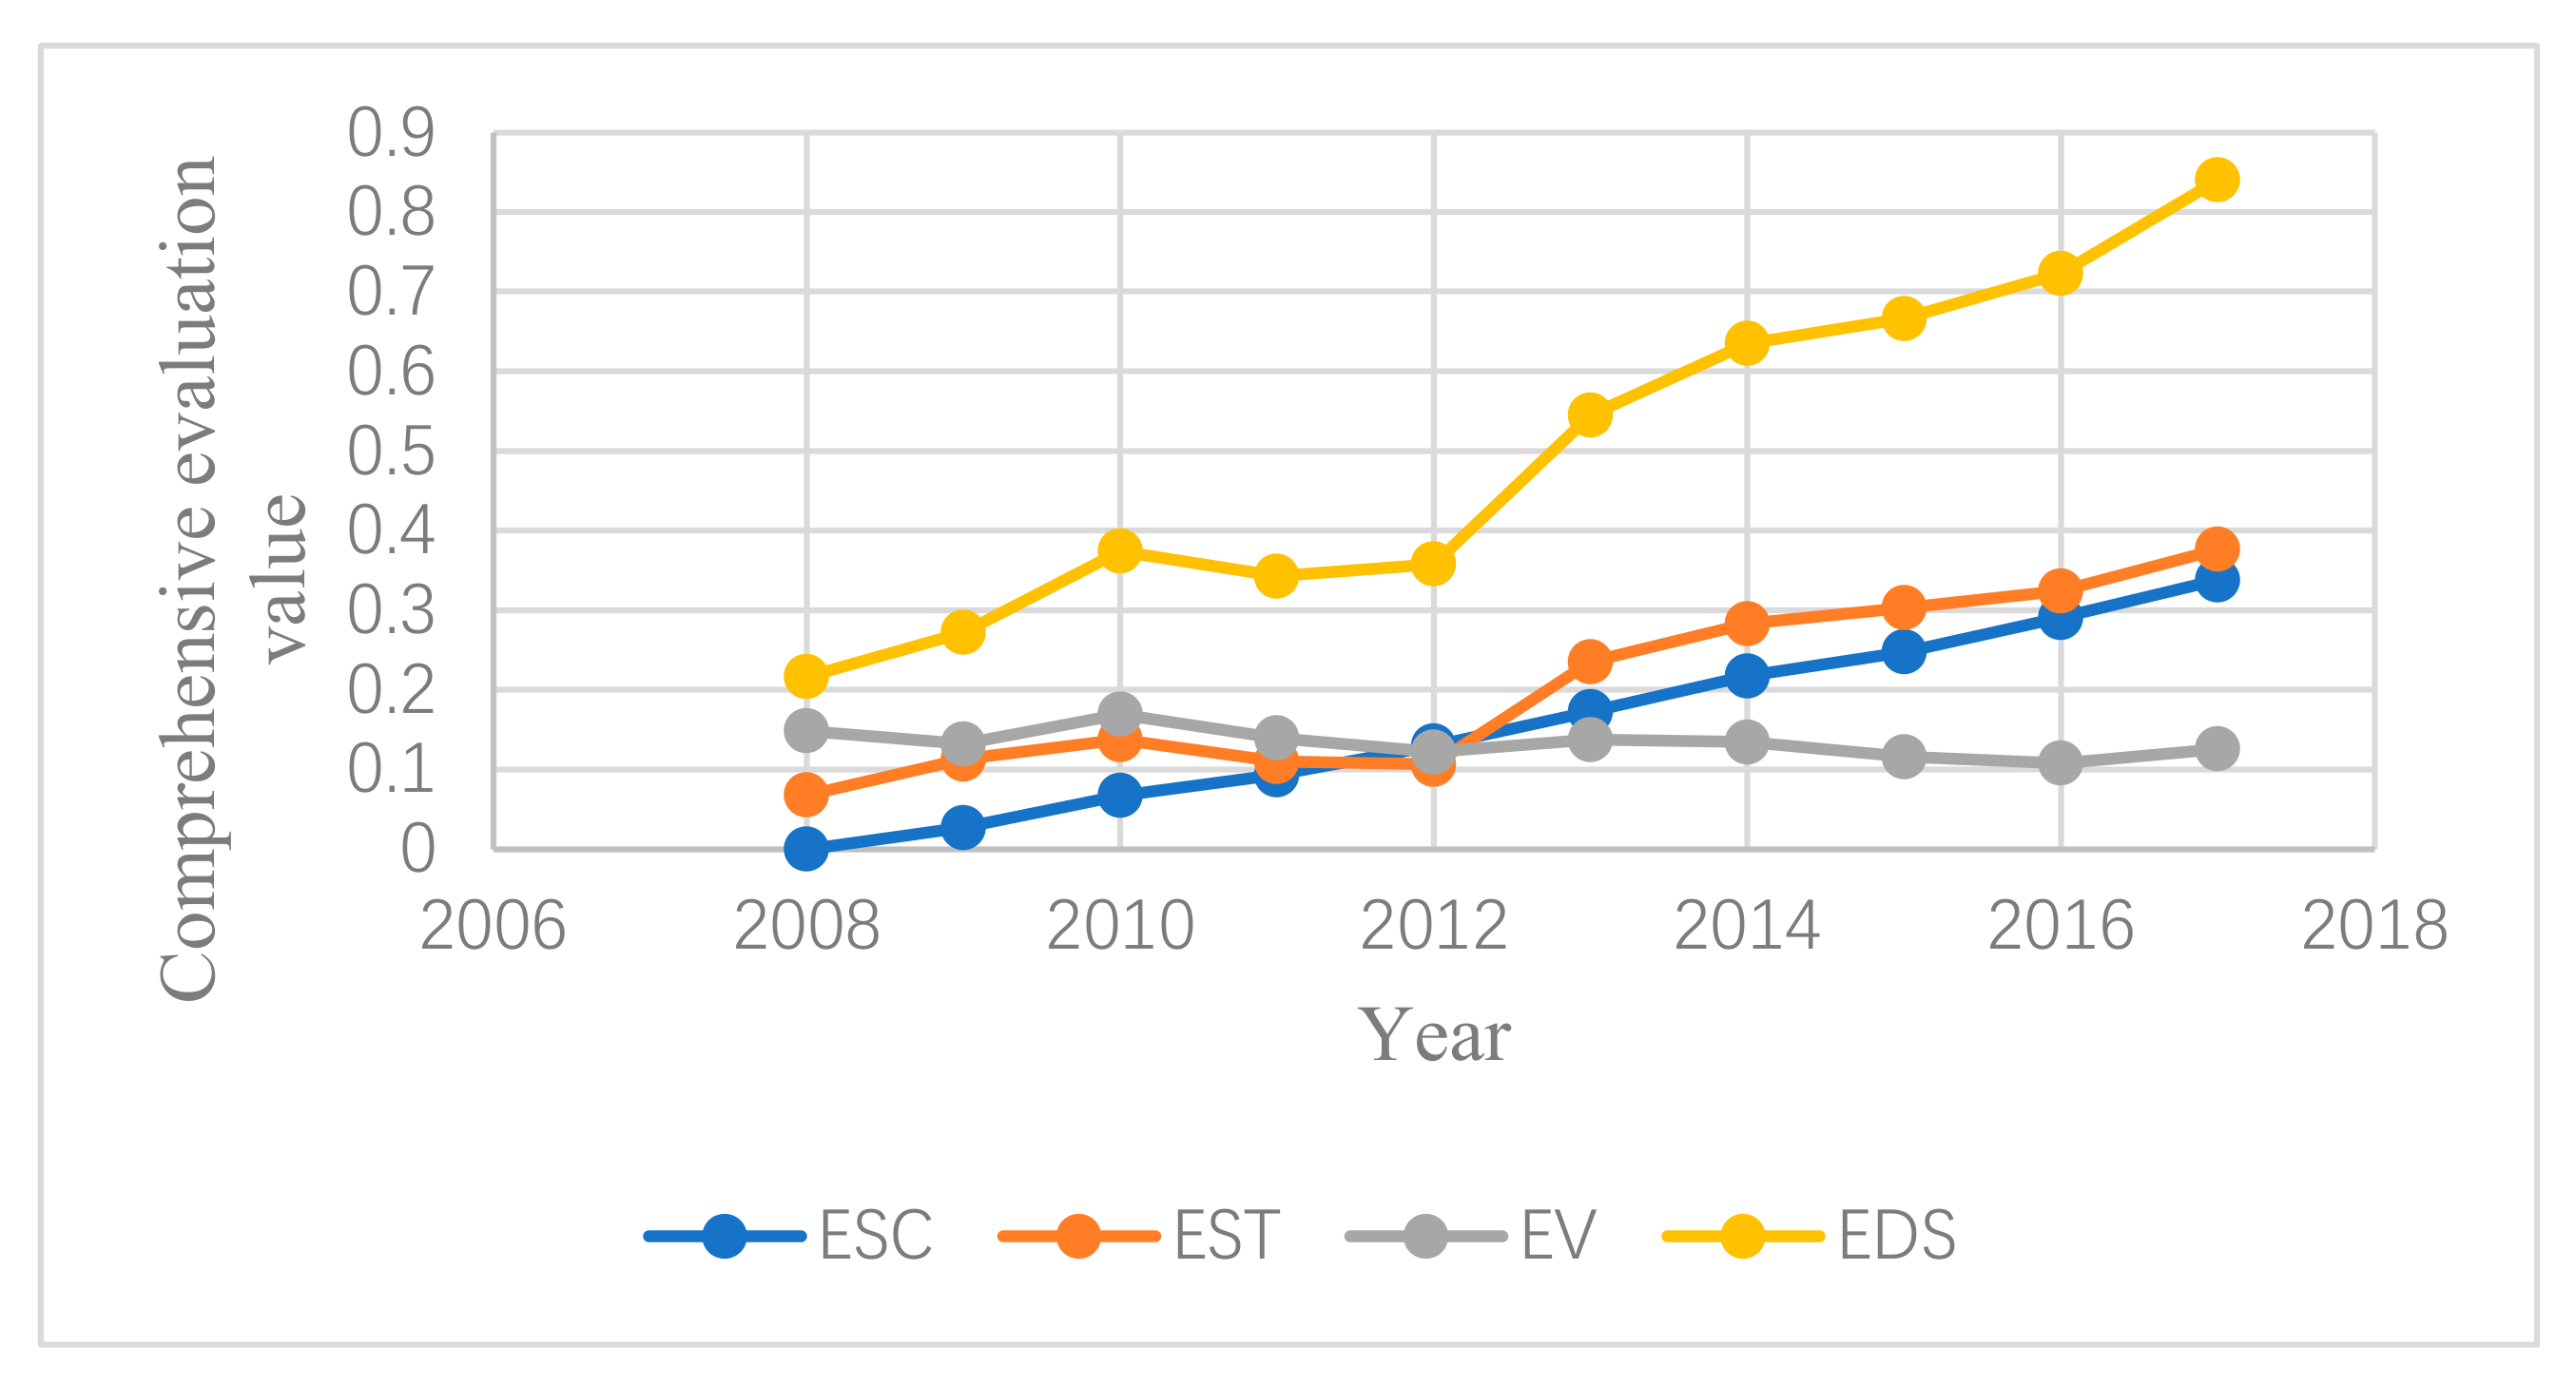
3.1.2. Comprehensive Evaluation of EDS
As can be seen from
Figure 2, from 2008 to 2017, the comprehensive evaluation values of EDS in Jinan increased as a whole, with only a slight decline in 2011 and the maximum value in 2017. The reason for the slight decline in the comprehensive evaluation value of EDS in 2011 might be that the increase of rural Engel’s coefficient and the decrease of GDP growth rate resulted in a slight decline in the comprehensive evaluation values of EST and EV. From 2012 to 2017, the comprehensive evaluation values of EDS increased from 0.343 to 0.840, indicating that the economy developed rapidly in the past six years. The previous extensive pattern of economic development changed into a pattern with low energy consumption and high efficiency. Energy conservation, emissions reduction, and ecological environment improvement received more attention. Industrial structure was adjusted. The development of service industries, such as water conservancy environment, was sped up. Innovative industries were constantly introduced. Although the reduction of GDP growth rate led to the slight decline of EV, both ESC and EST had a greater degree of consolidation and improvement. Particularly, ESC grew most obviously, promoting the rapid development of the economy.
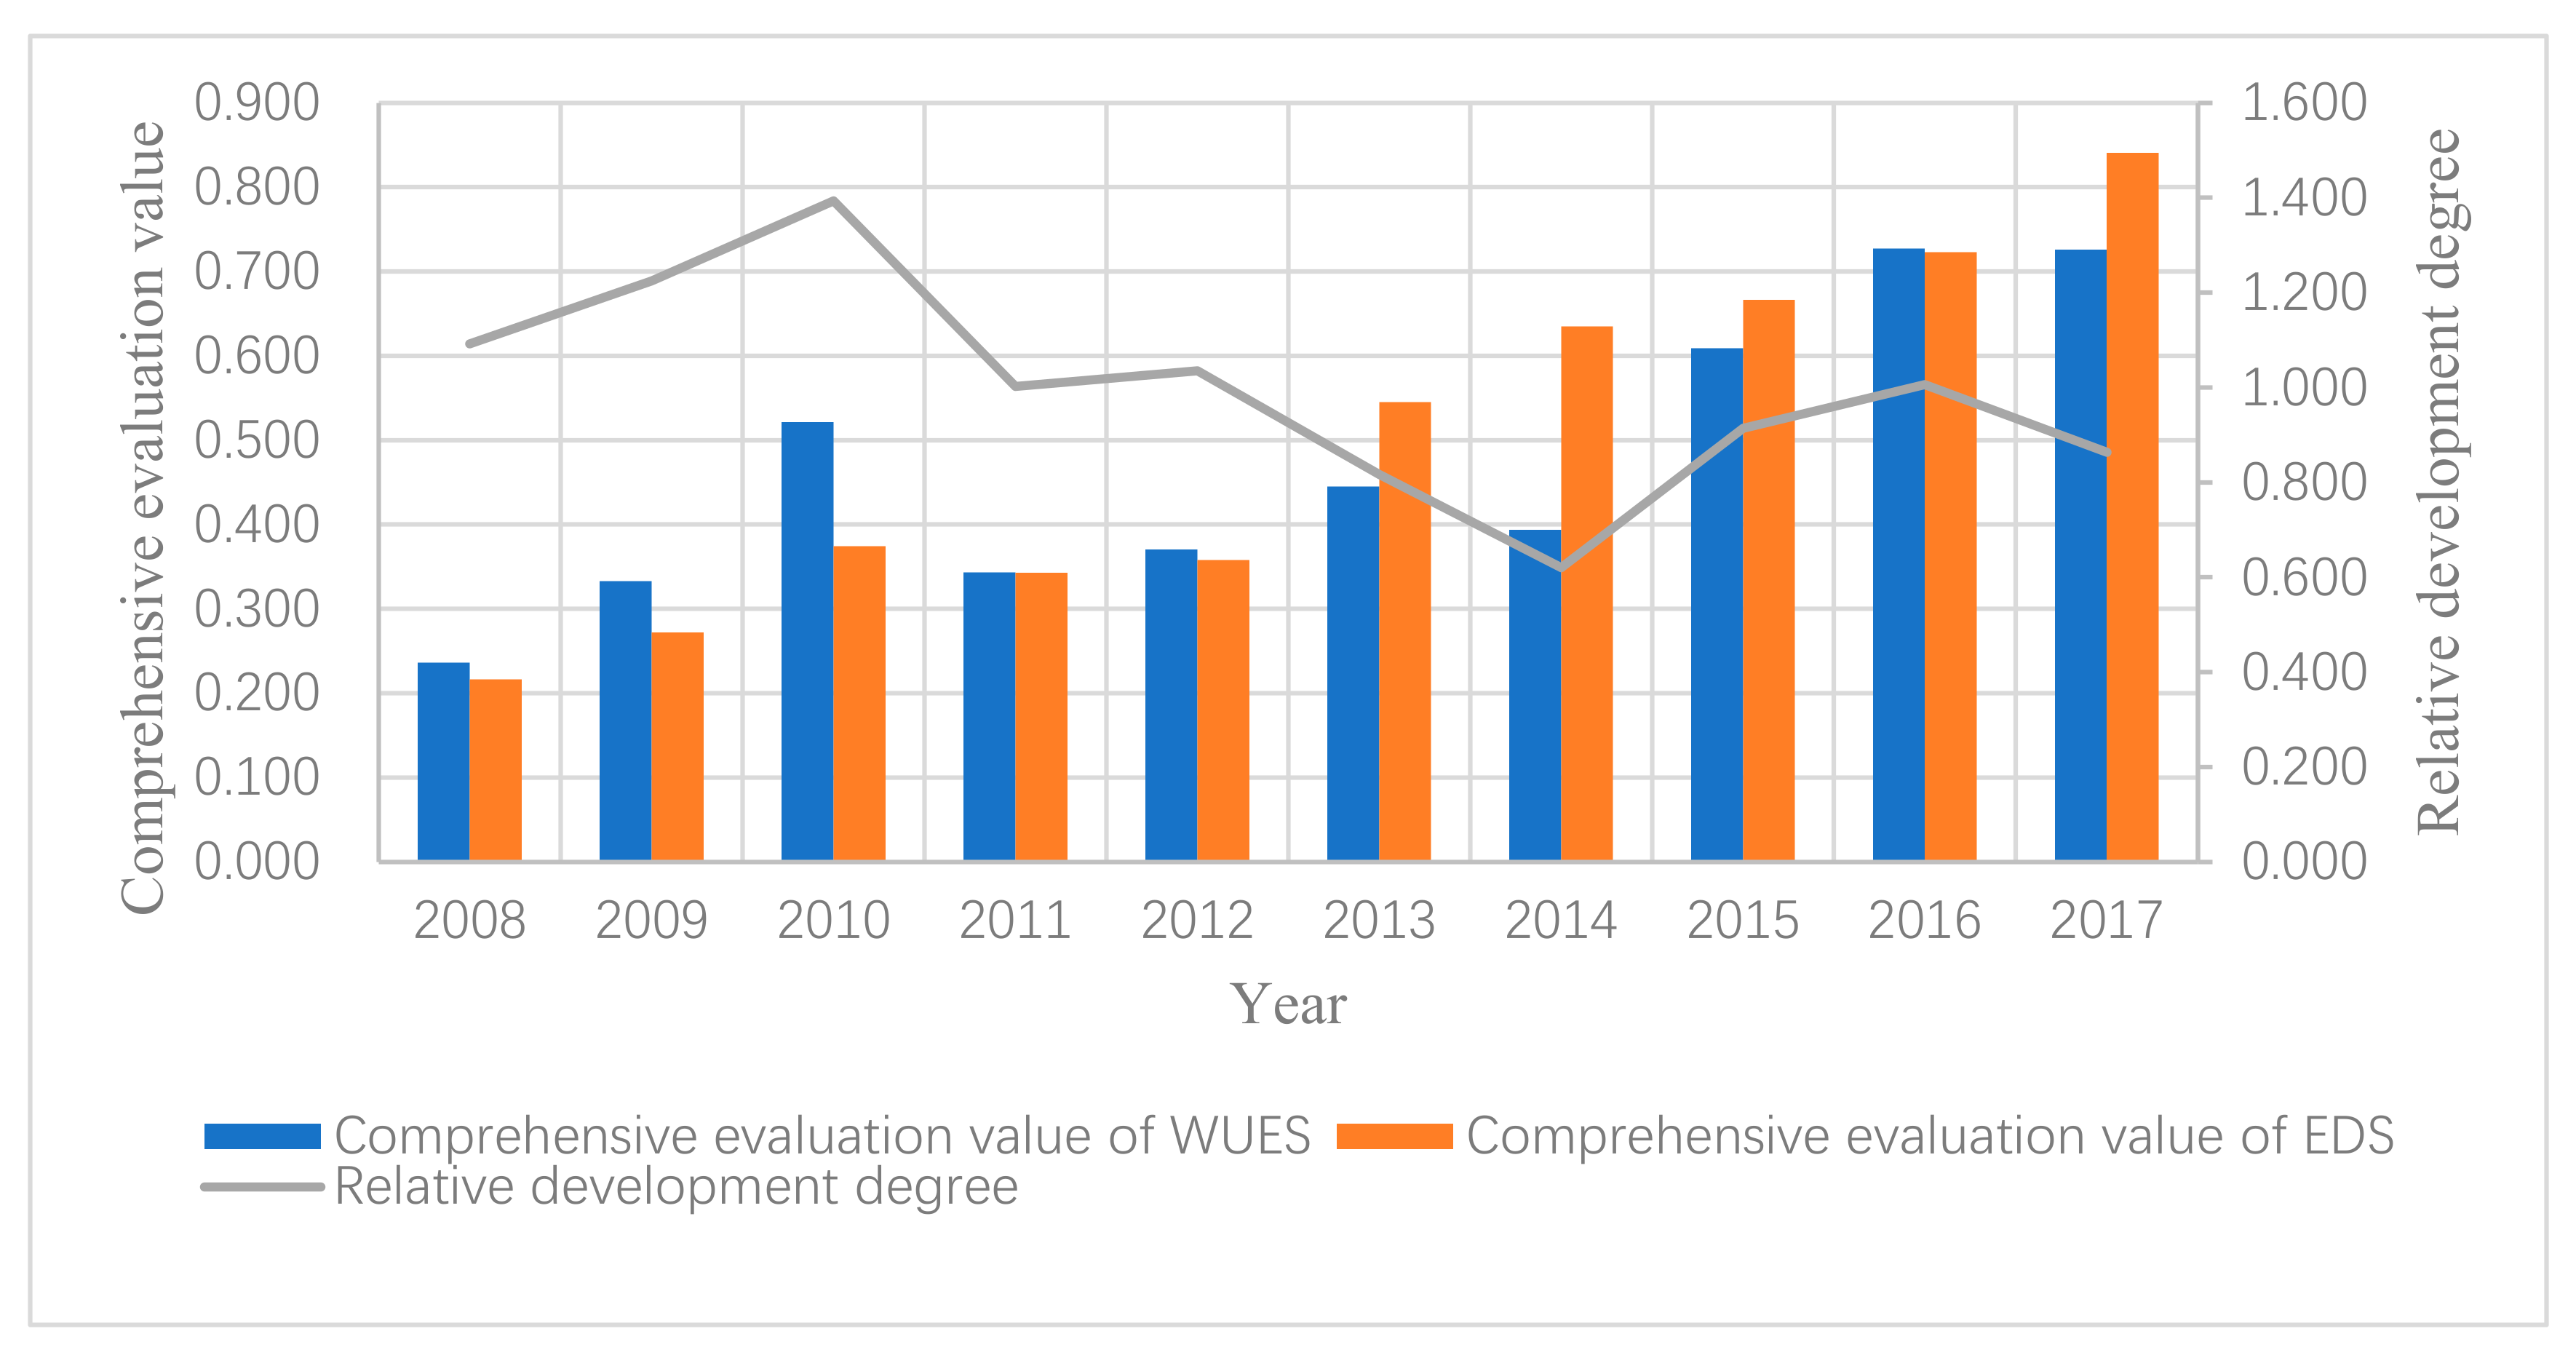
3.1.3. Relative Development Degrees of WUES and EDS
As can be seen from
Figure 3, from 2008 to 2017, the relative development degrees of WUES and EDS in Jinan fluctuated greatly, focusing on the range of [0.621, 1.394] and showing an up-down-up-down unstable state. In 2008, from 2011 to 2013, and from 2015 to 2017, the relative development degrees were in the range of (0.8, 1.2), indicating that WUES and EDS were in a relatively balanced, synchronized, and coordinated state. From 2009 to 2010, the relative development degrees were greater than 1.2, indicating that the quality of ED was not high, the level of ED lagged behind that of WUE, and there was the problem of excessive use of water resources. In 2014, the relative development degree was less than 0.8, indicating that the level of WUE lagged behind that of ED, restricting social and economic development, and water resources were in the stage of extensive use.
3.2. Coupling Coordination Degree between WUES and EDS
The calculated results of coupling degree, coordination degree, and coupling coordination degree between WUES and EDS in Jinan from 2008 to 2017 are shown in
Table 3. According to
Table 3, the temporal variation diagram of coupling degree, coordination degree, and coupling coordination degree between WUES and EDS is shown in
Figure 4.
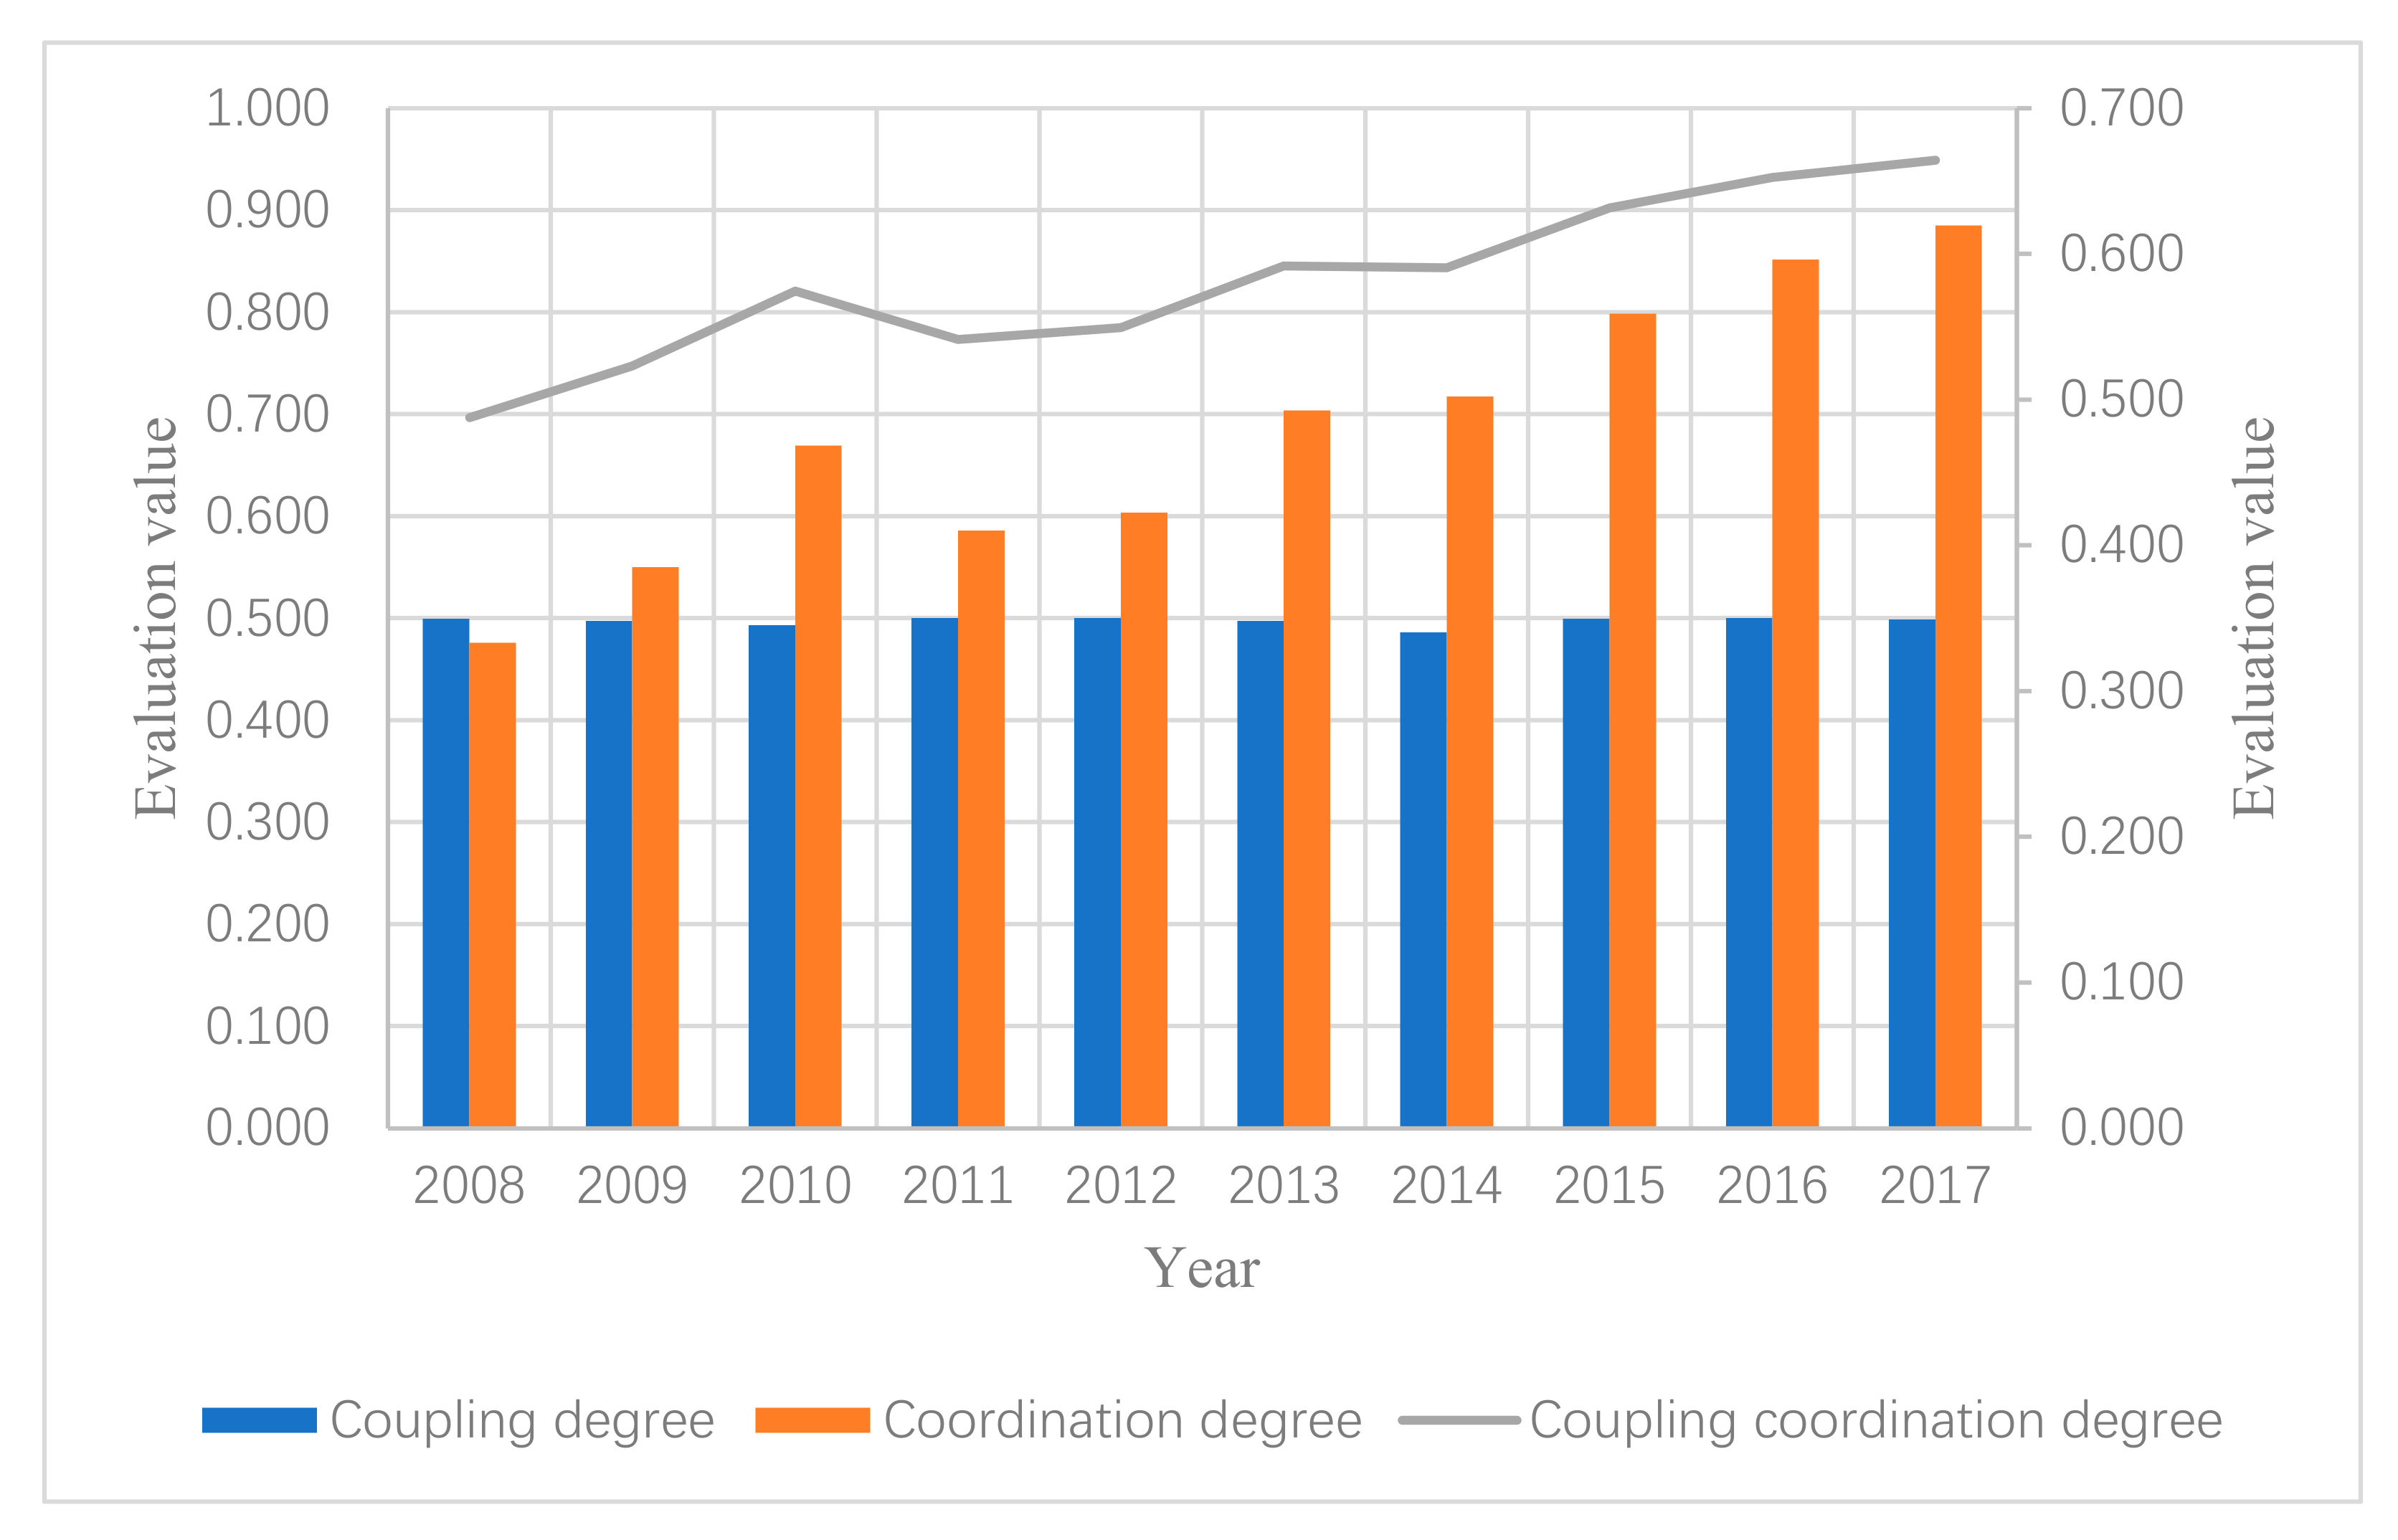
As can be seen from
Table 3 and
Figure 4, the coupling degrees between WUES and EDS in Jinan from 2008 to 2017 were in the range of [0.486, 0.500], and the two systems were in the antagonistic stage, that is, the state of common development. The coupling degrees were close to or equal to the inflection point value of 0.5, indicating that the two systems would gradually move towards coordination and enter the running-in stage.
From 2008 to 2017, the coordination degrees between WUES and EDS in Jinan increased on the whole, indicating that the coordination between the two systems was improving continuously. The reason for the decrease of coordination degree in 2011 might be that the level of WUE dropped sharply and that of ED dropped slightly, that is, the synergistic effect of the two systems decreased.
From 2008 to 2017, the coupling coordination degrees between WUES and EDS in Jinan were in the range of [0.488, 0.664] with less fluctuation and overall rise. Except for the moderately coordinated coupling stage in 2008, coupling and coordination intensities from 2009 to 2017 were at the highly coordinated coupling stage, indicating that the two systems influenced each other, constantly broke in, and jointly developed.
4. Discussions
From 2008 to 2017, the comprehensive evaluation values of WUES in Jinan increased from 0.236 to 0.726, with a very large overall improvement. In the process, a changing trend of ups and downs was observed. The reasons why the state of “low start and fast development” occurred might be the following. Since 2002, Jinan became one of the first ten national water-saving cities in China. The long-term water-saving management mechanism construction was highly regarded. Government-led measures, social participation, and universal action combined, the organizational structure improved, capital investment increased, infrastructure construction strengthened, and water conservation management was strictly carried out; water-saving work made remarkable achievements.
From 2008 to 2017, the comprehensive evaluation values of EDS in Jinan increased from 0.217 to 0.840, with a great overall improvement. In the process, except for a slight decline in 2011, all the other years showed a rising trend. The reasons why the state of “low start and fast development” similar to that of WUES occurred might be the following. During the study period, the severe impact of the international financial crisis was overcome and growth was achieved. The economic structure was positively adjusted. The agriculture industrialization level increased persistently. Industrial production grew steadily. The key industries continued to present a good momentum. Industrial economic benefits continued to improve.
From 2008 to 2017, the relative development degrees of WUES and EDS in Jinan varied between 0.621 and 1.394. Only in 2014, the relative development degree was less than 0.8, indicating that the comprehensive evaluation value of WUE was significantly lower than that of ED, and the use of water resources was extensive and inefficient. This might be caused by a sudden drop of about 300 mm in precipitation in that year compared with the previous year, leading to a significant decrease in DWUE and EWUE, whereas the level of economic development improved compared with the previous year. From 2009 to 2010, the relative development degrees were greater than 1.2, indicating that the comprehensive evaluation values of ED were significantly lower than those of WUE, and the use of water resources was excessive. This might be due to the fact that WUE and ED had both improved in these two years, but the former had improved more than the latter. In the other years, the relative development degrees were in the range of (0.8, 1.2), indicating that the comprehensive evaluation value of ED was very close to that of WUE. This might be due to the fact that water-use efficiency and economic development were both lower in 2008, but the two remained in sync. From 2011 to 2013 and from 2015 to 2017, water-saving measures were promoted, the water consumption structure was improved, the mode of economic development changed, and the two systems increased synchronously and promoted each other.
From 2008 to 2017, the coupling degrees between WUES and EDS in Jinan were in the range of [0.486, 0.500]. The results showed that the coupling degrees changed slightly and the two systems were in an antagonistic stage during the study period. The overall economic development degree was low, and WUE was constrained. The two systems hardly developed towards an orderly and coordinated direction. The evolution trend that the coupling degrees were very close to 0.5 indicated that the two systems would enter the running-in stage after years of binding development, and they would be in a state of benign interaction.
From 2008 to 2017, the coupling coordination degrees between WUES and EDS in Jinan were in the range of [0.488, 0.664]. The results showed that the two systems developed from the moderately to the highly coordinated coupling during the study period. The two systems constantly broke in under the function of restraining and promoting each other. The whole system advanced from the medium to the high level of coupling coordination relationship. In Jinan, the utilization of water resources was guided toward high efficiency, high benefit, low emission, and low pollution, and the water-use structure was gradually optimized to produce greater economic benefits. The mode of economic development was transformed from one of high energy consumption and low efficiency to one of low energy consumption and high efficiency. The industrial structure was adjusted, the development of the service sector was accelerated, and more innovative industries were introduced. The size of the economy kept sustained and significant growth. These practical measures promote the increase of the coupling coordination degree between WUES and EDS, which is consistent with the results calculated by the coupling coordination degree model.
5. Conclusions
In this study, the comprehensive evaluation values and relative development degrees of WUES and EDS were calculated, and the coupling coordination degree model was used to analyze the coupling degree, coordination degree, and coupling coordination degree of the two systems.
During the study period, the comprehensive evaluation values of WUES and EDS in Jinan were greatly improved, and showed the changing trend of ups and downs. The two systems were in the antagonistic stage, and were gradually approaching the running-in stage, indicating that the two systems were in the state of common development. The coupling coordination degrees between WUES and EDS in Jinan increased gradually in waves. The two systems advanced from moderately to highly coordinated coupling. These conclusions are consistent with the actual situation of the water-use efficiency and economic development systems in Jinan during the study period, indicating that the selected method is scientific and applicable. The calculated results can provide guidance for formulating policies and measures on the sustainable utilization of water resources and sustainable economic development in Jinan. In the future, if the water control path appropriate to Jinan can be explored actively, the water-saving kinetic energy of economic development can be increased constantly, and the linkage effect between economic development and water resource utilization can be given full play. The two systems will then be in sync, enjoying a benign interaction and a healthy harmonious development.
The coupling coordination evaluation index system of the integrated system of water-use efficiency and economic development established in this paper contains 22 indexes, which cannot fully reflect the rich connotation of WUES and EDS. Therefore, the regional reality should be further studied to build a more scientific and reasonable evaluation index system.
The study area selected in this paper is Jinan. Although the research results have a certain reference significance for cities having similar water resource conditions and economic development levels, the empirical results of this paper lack a comparative analysis with cities having similar or different water resource conditions and economic development levels. Therefore, a comparative analysis of several cities should be conducted in the future to explore the effects of urban water resource endowment, economic development level, and other factors on the coupling coordination degree of WUES and EDS.
Author Contributions
Conceptualization, W.X.; Data curation, Q.X., H.G., Q.L., B.L., and J.Z.; Formal analysis, X.Z.; Investigation, Q.X., H.G., Q.L., and B.L.; Methodology, W.X. and X.Z.; Writing—original draft, W.X.; Writing—review and editing, J.Z. All authors read and agreed to the published version of the manuscript.
Funding
This research received no external funding.
Acknowledgments
The authors wish to thank Sheng-Le Cao, professor of the School of Civil Engineering, Shandong University, Jinan, China, for his suggestions on the structure of the paper.
Conflicts of Interest
The authors declare no conflict of interest.
References
- Cai, Y.; Xu, M.; Wang, X.; Yue, W.; Li, C. Optimal water utilization and allocation in industrial sectors based on water footprint accounting in Dalian City, China. J. Clean. Prod. 2017, 176, 1283–1291. [Google Scholar]
- Divakar, L.; Babel, M.S.; Perret, S.R.; Gupta, A.D. Optimal allocation of bulk water supplies to competing use sectors based on economic criterion—An application to the Chao Phraya River Basin, Thailand. J. Hydrol. 2011, 401, 22–35. [Google Scholar] [CrossRef]
- Roozbahani, R.; Schreider, S.; Abbasi, B. Optimal water allocation through a multi-objective compromise between environmental, social, and economic preferences. Environ. Model. Softw. 2015, 64, 18–30. [Google Scholar] [CrossRef]
- Gai, M.; Wang, Y.F.; Ma, G.D. Evaluation of the coupling coordination development between water use efficiency and economy in Liaoning Coastal Economic Belt. J. Nat. Resour. 2013, 28, 2081–2094. [Google Scholar]
- Sun, C.Z.; Wang, Y.; Li, H.X. Influencing factors of water utilization efficiency in Liaoning Province. J. Econ. Water Resour. 2009, 27, 1–5. [Google Scholar]
- Doungmanee, P. The nexus of agricultural water use and economic development level. Kasetsart J. Soc. Sci. 2016, 37, 38–45. [Google Scholar] [CrossRef]
- Ekin, B.; Katia, K.; Phoebe, K. Using economic valuation techniques to inform water resources management: A survey and critical appraisal of available techniques and an application. Sci. Total Environ. 2006, 365, 105–122. [Google Scholar]
- Byrnes, J.; Crase, L.; Dollery, B.; Villano, R. The relative economic efficiency of urban water utilities in regional New South Wales and Victoria. Resour. Energy Econ. 2010, 32, 439–455. [Google Scholar] [CrossRef]
- Suinyuy, D.N.; Xiong, Z.X.; Presley, K. Signatures of water resources consumption on sustainable economic growth in Sub-Saharan African countries. Int. J. Sustain. Built Environ. 2016, 5, 114–122. [Google Scholar]
- Wu, D. The evolution of China’s economic development and water resources utilization, the evaluation and mechanism analysis of “decoupling”—Taking the comparative analysis of China and the United States as an example. J. Hohai Univ. 2016, 18, 47–53. [Google Scholar]
- Hao, Y.; Hu, X.L.; Chen, H.Y. On the relationship between water use and economic growth in China: New evidence from simultaneous equation model analysis. J. Clean. Prod. 2019, 235, 953–965. [Google Scholar] [CrossRef]
- Gedefaw, M.; Wang, H.; Yan, D.; Qin, T.; Wang, K.; Girma, A.; Abiyu, A. Water resources allocation systems under irrigation expansion and climate change scenario in Awash River Basin of Ethiopia. Water 2019, 11, 1966. [Google Scholar] [CrossRef]
- Arain, H.; Han, L.; Meo, M.S. Nexus of FDI, population, energy production, and water resources in South Asia: A fresh insight from dynamic common correlated effects (DCCE). Environ. Sci. Pollut. R. 2019, 26, 27128–27137. [Google Scholar] [CrossRef]
- Alexandratos, S.D.; Barak, N.; Bauer, D.; Davidson, F.T.; Gibney, B.R.; Hubbard, S.S.; Taft, H.L.; Westerhof, P. Sustaining water resources: Environmental and economic impact. ACS Sustain. Chem. Eng. 2019, 7, 2879–2888. [Google Scholar] [CrossRef]
- Li, Z.X.; Li, Y.H. Empirical analysis of coupling coordination of urbanization and ecological environment—A case study of Dalian. J. Hainan Norm. Univ. 2013, 26, 307–313. [Google Scholar]
- Wu, X.T.; Guan, H. Coupling relationship between economic development and water environment in Zhengzhou City. J. Jiangsu Norm. Univ. 2016, 34, 72–75. [Google Scholar]
- Hu, Z.R. Study on coupling coordinated development of water use efficiency and economic development in Hangzhou City. Water Resour. Power 2016, 34, 149–152. [Google Scholar]
- Geng, F.; Dong, Z.C.; Guan, X.K. Relationship between water use efficiency and economic development in Nanjing City based on coupling coordination degree model. J. Econ. Water Resour. 2017, 35, 21–25. [Google Scholar]
- Meng, Q.S. Information Theory; Xi’an Jiaotong University Press: Xi’an, China, 1989; pp. 19–36. [Google Scholar]
- Qiu, W.H. Management Decisions and Application of Entropy; Mechanical Industry Press: Beijing, China, 2001; pp. 32–86. [Google Scholar]
- Ren, J.T. Research on Coupling Coordination between Water Use Efficiency and Economic Development—A Case Study in Zhang Ye City of Gansu Province. Master’s Thesis, Lanzhou University, Lanzhou, China, June 2018. [Google Scholar]
- Wang, H.J.; Zhang, Y.J. Interaction between the Eastern Industrial Agglomeration and Financial Development in China: A study based on Coupling Coordination Degree Model. J. Beijing Jiaotong Univ. 2015, 14, 7–12. [Google Scholar]
- Wang, G.X.; Liu, T. Coupling relationship change between urbanization and eco-environment of resource-based cities in Central China. China Popul. Resour. Environ. 2017, 27, 80–88. [Google Scholar] [CrossRef]
- Wu, A.D.; Liu, D.G. The relationship between financial development and industrial structure upgrading in China—Based on the coupling coordination model. South China Financ. 2017, 3, 28–36. [Google Scholar]
- Liao, Z.B. Quantitative evaluation and classification system of coordinated development of environment and economy. Trop. Geogr. 1999, 19, 171–177. [Google Scholar]
- Li, P.; Li, S.; Guo, L.; Liu, C.; Qi, Q. Analysis on Coupling Coordination Degree between Intensive Urban Land Use and Urbanization in Hebei Province. Res. Soil Water Conserv. 2013, 20, 238–249. [Google Scholar]
© 2020 by the authors. Licensee MDPI, Basel, Switzerland. This article is an open access article distributed under the terms and conditions of the Creative Commons Attribution (CC BY) license (http://creativecommons.org/licenses/by/4.0/).


