Article

Increasing Efficiency of Field Water Re-Injection during Water-Flooding in Mature Hydrocarbon Reservoirs: A Case Study from the Sava Depression, Northern Croatia

1
Faculty of Mining, Geology and Petroleum Engineering, University of Zagreb, HR-10000 Zagreb, Croatia
2
INA-Plc., HR-10000 Zagreb, Croatia
3
Faculty of Science, University of Zagreb, HR-10000 Zagreb, Croatia
*
Author to whom correspondence should be addressed.
Sustainability 2020, 12(3), 786; https://doi.org/10.3390/su12030786
Submission received: 25 December 2019 / Revised: 11 January 2020 / Accepted: 19 January 2020 / Published: 21 January 2020

Abstract

:
The authors analyse the process of water re-injection in the hydrocarbon reservoirs/fields in the Upper Miocene sandstone reservoirs, located in the western part of the Sava Depression (Croatia). Namely, this is the “A” field with “L” reservoir that currently produces hydrocarbons using a secondary recovery method, i.e., water injection (in fact, re-injection of the field waters). Three regional reservoir variables were analysed: Porosity, permeability and injected water volumes. The quantity of data was small for porosity reservoir “L” and included 25 points; for permeability and injected volumes of water, 10 points each were measured. This study defined selection of mapping algorithms among methods designed for small datasets (fewer than 20 points). Namely, those are inverse distance weighting and nearest and natural neighbourhood. Results were tested using cross-validation and isoline shape recognition, and the inverse distance weighting method is described as the most appropriate approach for mapping permeability and injected volumes in reservoir “L”. Obtained maps made possible the application of the modified geological probability calculation as a tool for prediction of success for future injection (with probability of 0.56). Consequently, it was possible to plan future injection more efficiently, with smaller injected volumes and higher hydrocarbon recovery. Prevention of useless injection, decreasing number of injection wells, saving energy and funds invested in such processes lead to lower environmental impact during the hydrocarbon production.

1. Introduction

Numerous geological variables are analysed numerically and spatially. The results are applied for creation of different geological models with different scales. This study analysed injected water volumes into the Neogene hydrocarbon reservoir located in the Sava Depression (Northern Croatia) as primary and accompanied porosities and permeability as secondary variables. The selected field and reservoir are named as “field A/reservoir L” in the Lower Pontian sandstones of the Kloštar Ivanić Formation. In both reservoirs a currently active water-flooding regime for increasing recovery and period of production is present. All used datasets were small, i.e., contained fewer than 20 measured points projected at the reservoir 2D section. Consequently, this was a challenging task, depending on: (a) distribution of injection and measurement wells, (b) number of fault zones, (c) number of wells with production and log data.
The results should show how to map the injected water volumes in similar reservoirs and geological provinces, which is one of the often skipped tasks in observation of production history. The reason could be in “fluidity” of such variables (volumes), where cumulative values cannot be simply summed as injected quantities because water can migrate via many more paths than can be recognised from structural maps, seismic data, logs or cores. A similar statement could be given for almost any injection/EOR/IOR process, especially when injected fluid is CO2, with much larger movability and smaller molecules (e.g., [1]).
In fact, carbon dioxide (CO2) injection is one of the most effective methods for improving hydrocarbon recovery. The minimum miscibility pressure (MMP) has a great effect on the performance of CO2 flooding, which is a numerically demanding task that could be successfully solved with different algorithms like artificial intelligence (AI) methods, e.g., using artificial neural networks [2]).
Particular water injection systems are still the main recovery systems in the Sava Depression as was shown in [3], where smart planning of injection facilities and overall costs were crucial for the extension of the production period from the mature fields. However, in future, some heavy oil reservoirs (like the abandoned Križ Oilfield) could be considered as a target for application of microbial enhanced oil recovery (MEOR), as was shown as a successful pilot project on low-temperature heavy oil reservoirs in Russia [4].

2. Applied Interpolation Methods

All selected statistical interpolation methods were from the primary group of methods created for the small datasets, namely inverse distance weighting, nearest neighbourhood and natural neighbourhood. All of them have simpler algorithms and are not characterised with separate functions for calculation of spatial model (like variogram in kriging).

2.1. Basics of the Inverse Distance Weighting (IDW) Interpolation Method

This is a widely used interpolation method, both for small and large datasets. The unknown value is calculated based on all known points and is inversely proportional to their distances. Equation (1), e.g., [5,6,7], is defined as:
Z I U = Z 1 d 1 P + Z 2 d 2 P + Z n d n P 1 d 1 P + 1 d 2 P + 1 d n P
where:
  • Z I U is estimated value;
  • d1dn is distance between estimated value and known value 1 … n;
  • p is power (distance) exponent;
  • z1 … zn is known values at locations 1 … n.
The mapping results are greatly influenced by power exponent, which could stress the influence of more distance points and smooth the map (for p ≤ 2) or force very local estimation (p > 2) and even, for large “p”, result in zonal estimation, i.e., in maps like Voronoi polygons. This method has been proved for mapping problems in the Croatian part of the Pannonian Basin System (CPBS) for all datasets where clustering was not largely imposed and for datasets smaller than 15 points too (e.g., [8,9].

2.2. Basics of the Nearest Neighbourhood (NN) Estimation Method

This is the simplest statistical estimation method when unknown point is estimated only from the closest known value. The results are valued polygons, like Voronoi diagrams. The distance between the points is Euclidian Equation (2):
d ( x , T ) = ( X 1 T 1 ) 2 + + ( X n T n ) 2
where:
  • d is distance;
  • n is nth pair of points;
  • x and T are unknown and measured points.
The method is meaningful only when applied for very small datasets, like five or fewer points. The output is not a map but a schematic polygon view.

2.3. Basics of the Natural Neighbourhood (NaN) Estimation Method

This method’s modification of NN and results are also shown as Voronoi diagrams (polygons). The unknown point is estimated from the several nearest points (e.g., [10,11,12]) using Equation (3):
X ( x , y ) = i = 1 n ( w i A ( X i , Y i ) )
where:
  • X(x,y) is estimated value in point (x,y);
  • A(Xi,Yi) is known value in point (Xi,Yi);
  • w i is proportion of polygon “I” in total area.

2.4. Cross-Validation as Numerical Estimation of Mapping Error

The cross-validation is a numerical procedure, which can be applied also as an error-based comparison tool for several maps with the same input but interpolated sequentially with two or more methods. The procedure is repeated as many times as there are measured (hard) values, dropping one known point out and calculating the estimation in the same location from the rest of the hard data (Equation (4)). The result is often named mean square error (MSE; e.g., [8,13,14]). This value is often the criterion for the most appropriate map selection in the CPBS (e.g., [15,16]).
M S E = 1 n i = 1 n ( S V P ) i 2
where:
  • M S E is mean square error value;
  • n is number of known values;
  • SV is measured value of point “I”;
  • P is estimated value of point “I”;
  • i is ith point.

2.5. Geological Probability Calculation as a Tool for Estimation for Presence of the Subsurface Fluid-Rock System

Geological probability calculation is a deterministic method developed for estimation of hydrocarbon system existence. It is a quantitative procedure based on geological categories’ probabilities for selected play and prospect. Such probability tables are constructed from expert knowledge and are unique for any geological province, like the CPBS (e.g., [17,18,19]). The basic independent categories are trap, reservoir, migration, source rock and hydrocarbon preservation. The final value is named as probability of success (POS), resulting from Equation (5):
POS = p(t) × (r) × p(m) × p(s) × p(p)
where:
  • POS is geological probability of success (%);
  • p(t) is trap probability (%);
  • p(r) is reservoir probability (%);
  • p(m) is migration probability (%);
  • p(s) is source rock probability (%);
  • p(p) is preservation probability (%).
In this paper the probability classes valid for the Croatian part of the Pannonian Basin System (CPBS) are used as follows: 1—proven event, 0.75—very probable, 0.5—probable event, 0.25—possible, 0.05—unknown or non-existent event (e.g., [18]). Each class is accompanied by one or more geological events for each category. The method could be easily modified for estimation of specific properties of such subsurface systems, which was also applied in this paper.

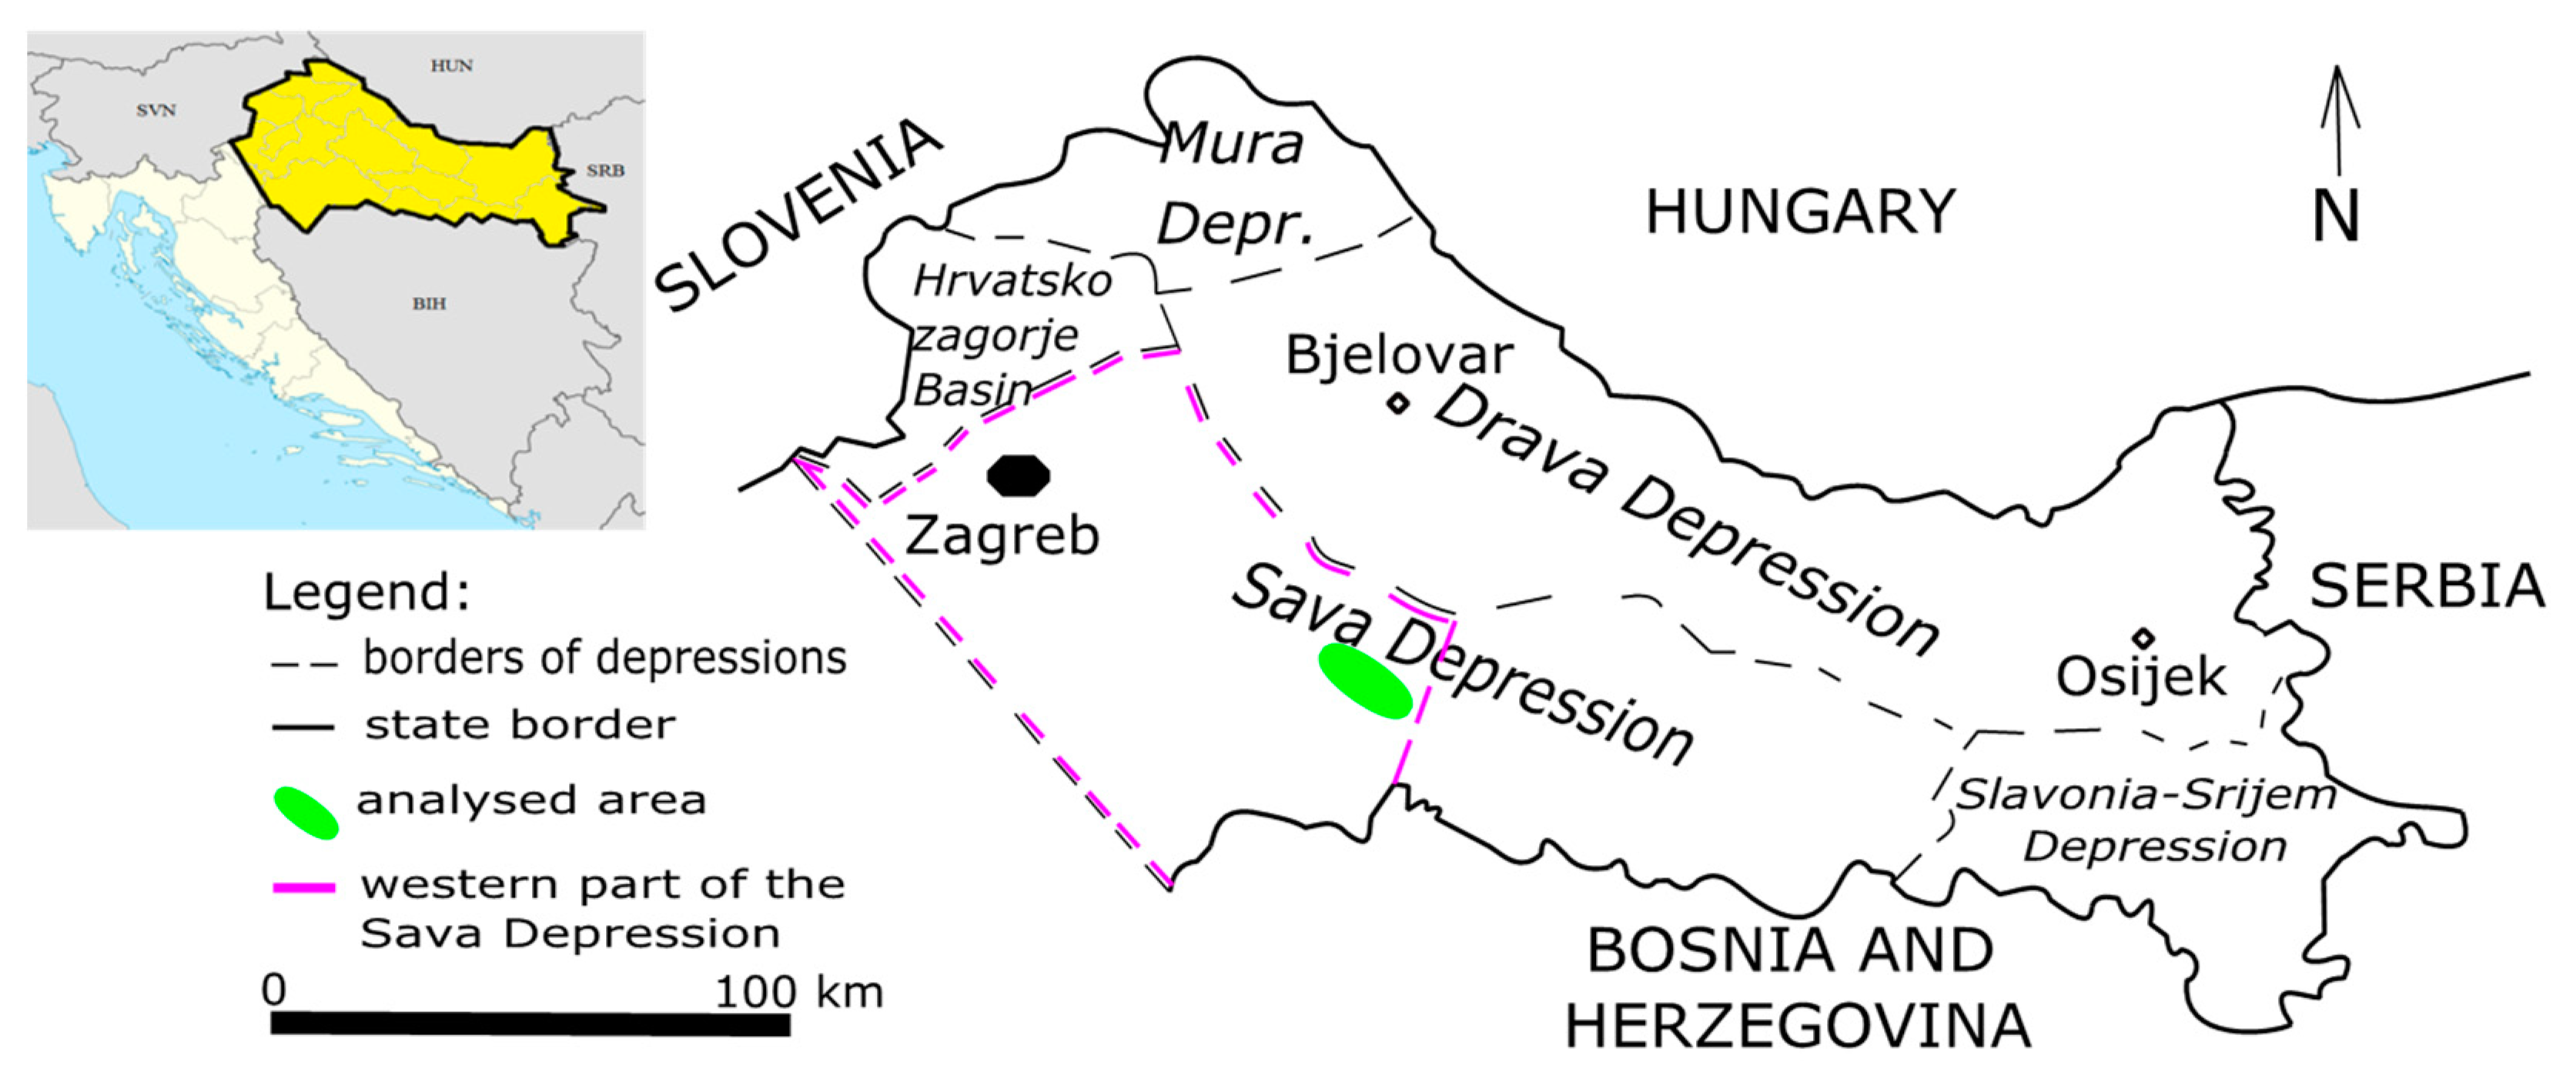
3. Geographical Location of Analysed Reservoirs

The selected sandstone reservoir “L” is part of an oil field, here named as ”A“, situated about 90 km SE from Zagreb (Figure 1), the Croatian capital, in the Sisak-Moslavina County. The field terrain is crossed by highway A3 and a pan-European railway. The prospect “A” covers 14 km2.

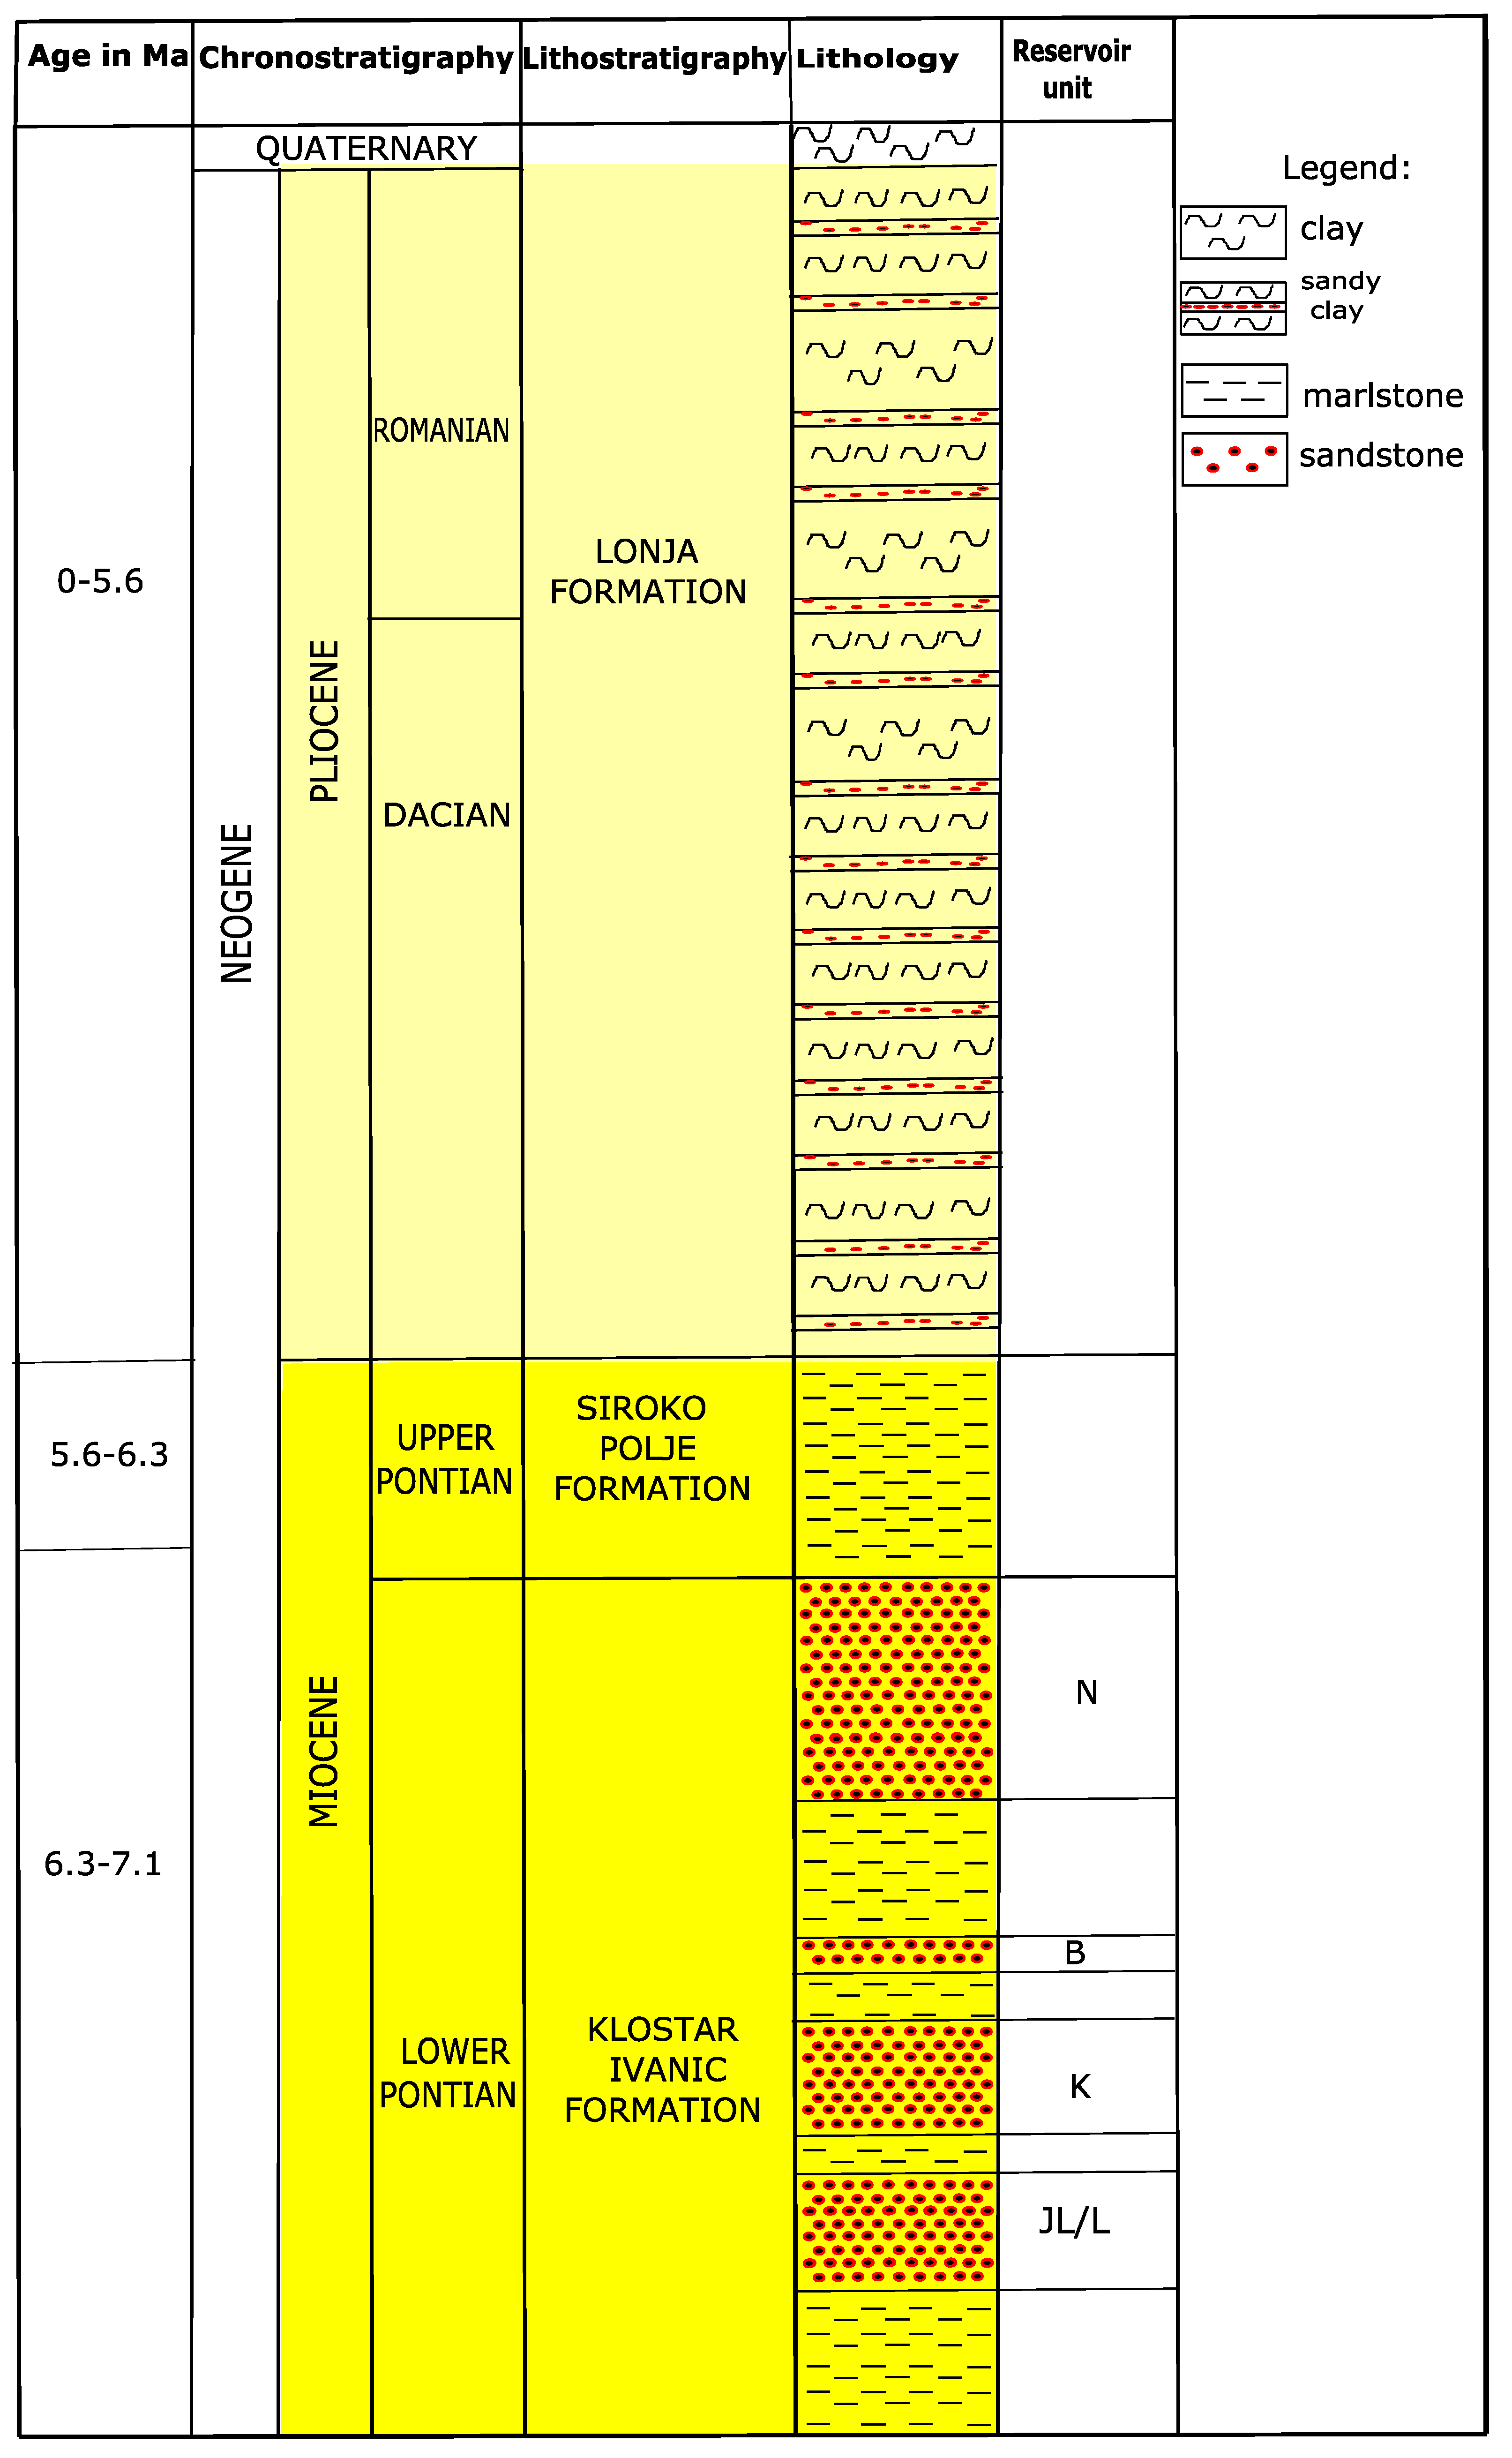
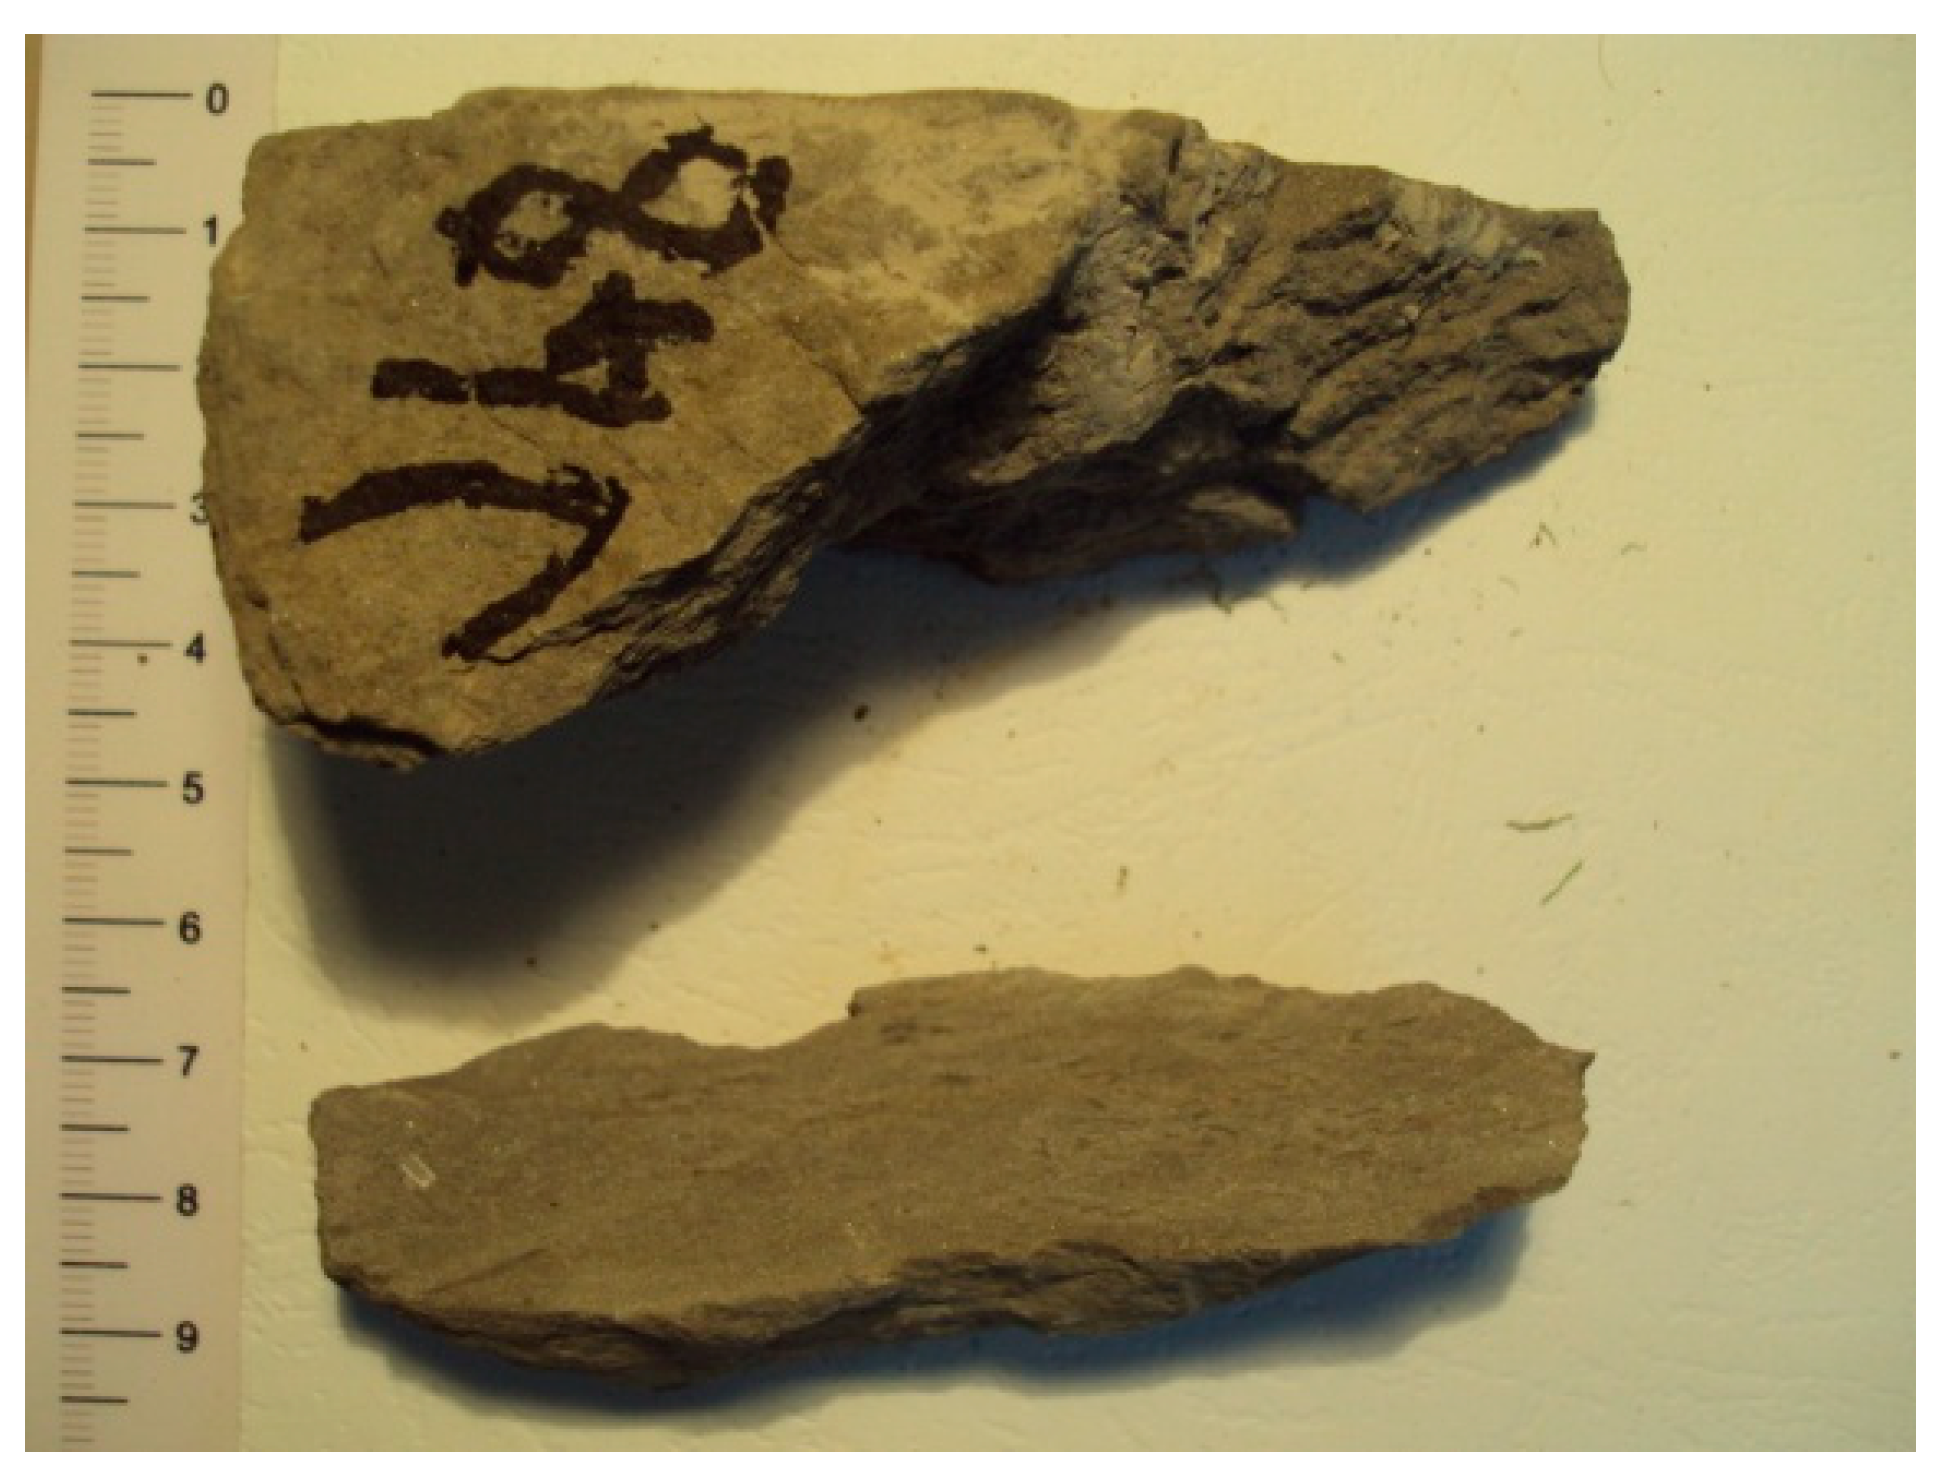
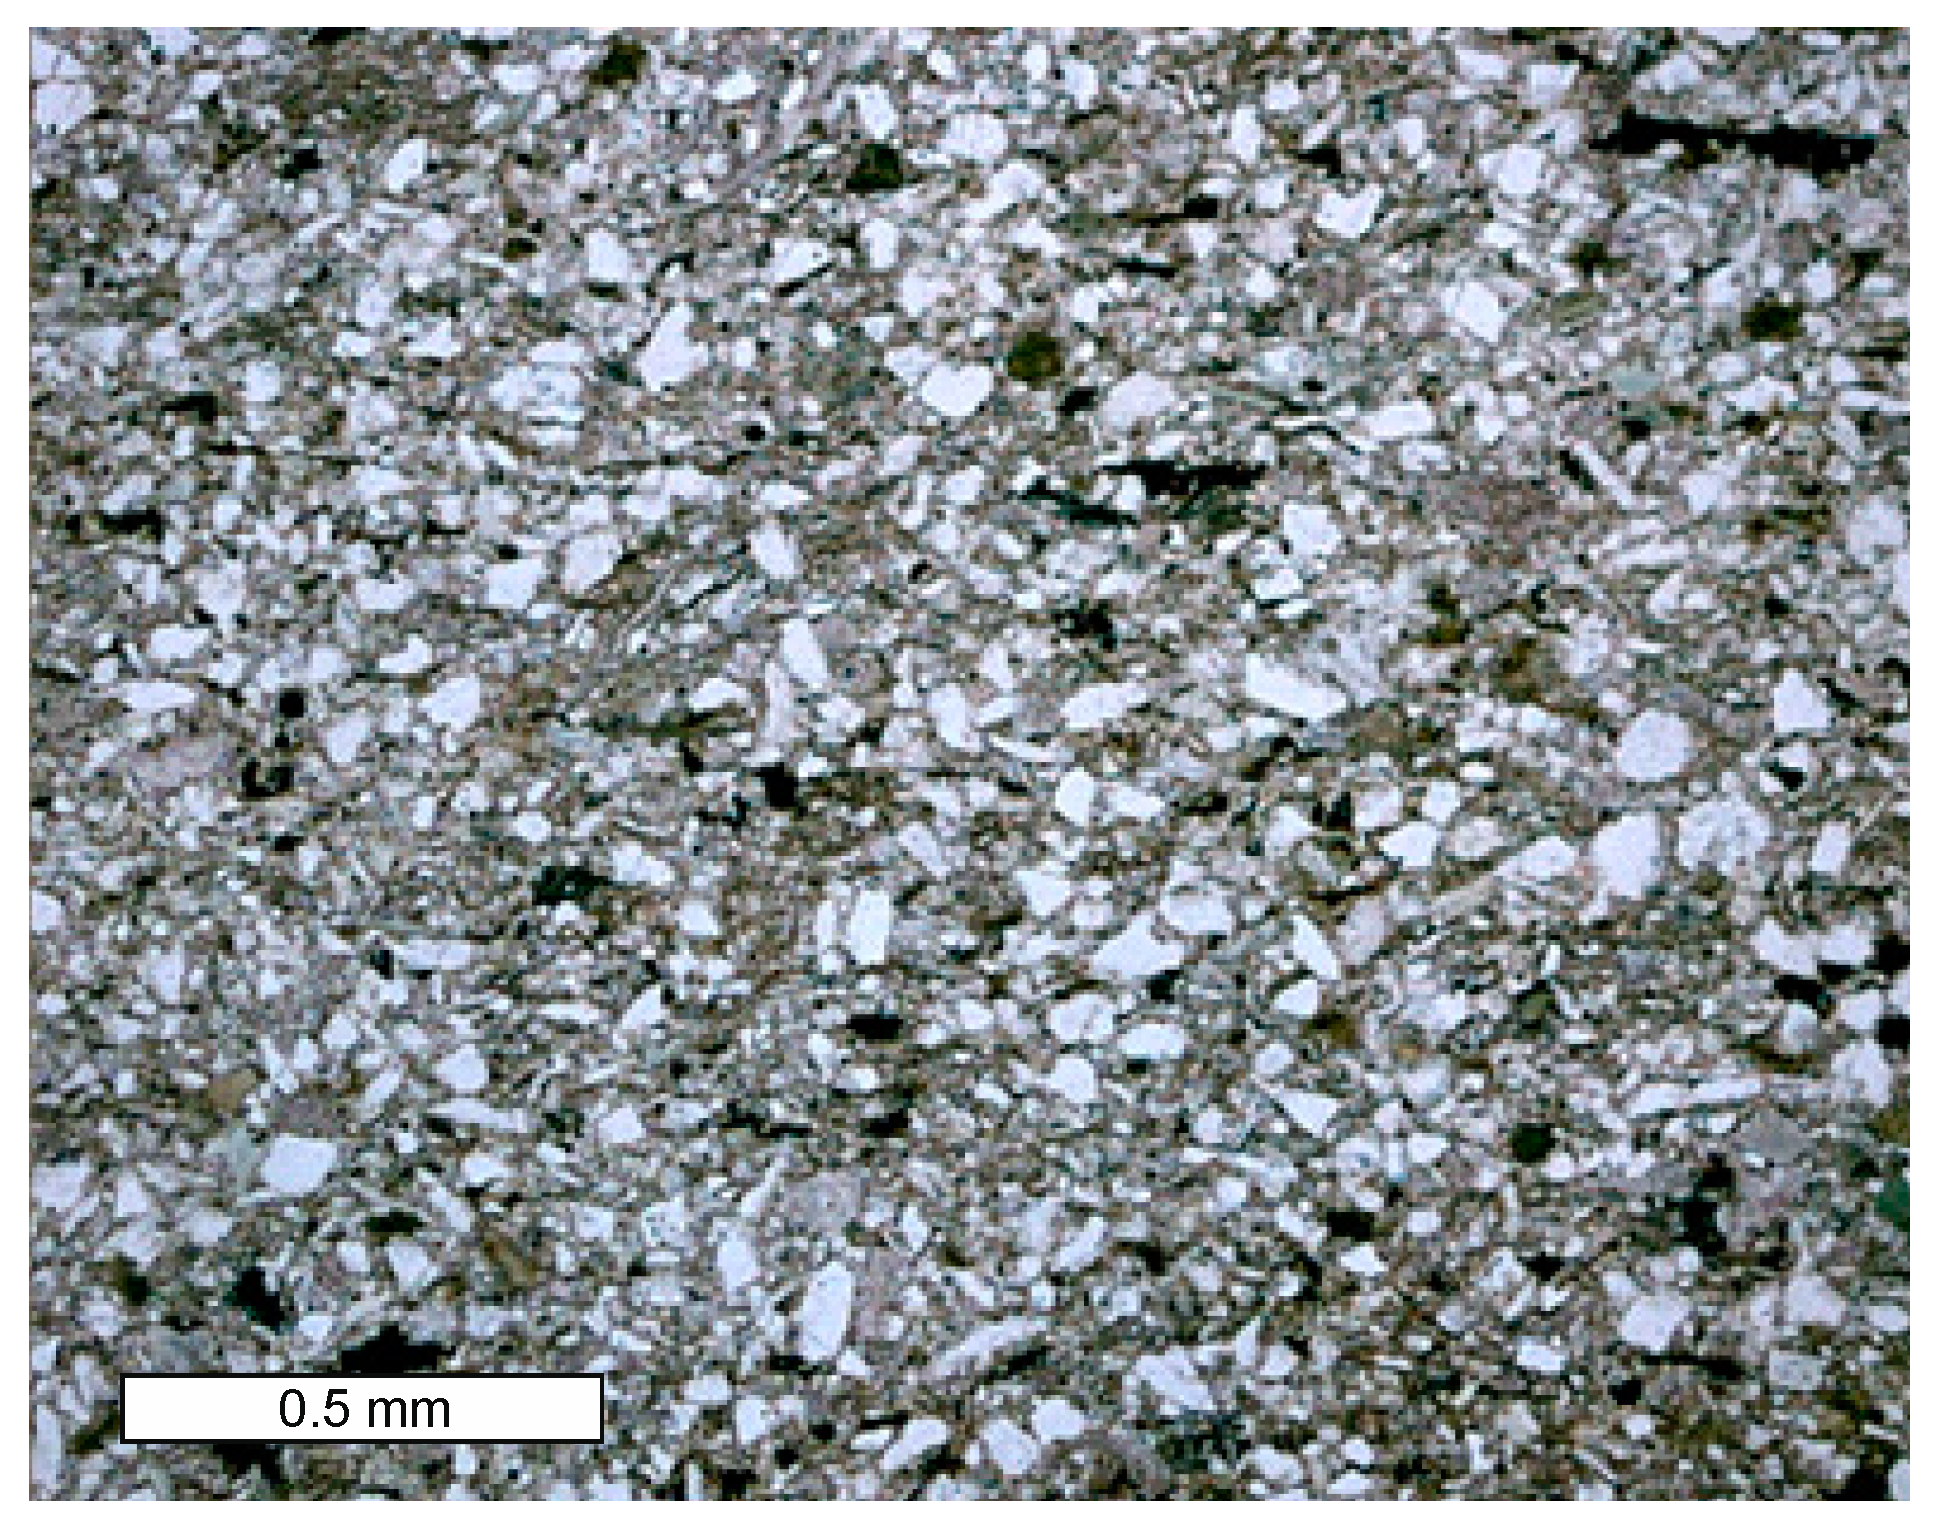
4. The Basic Geology of the Researched Neogene Sandstone Reservoirs

The analysed field is situated in the Sava Depression, which belongs to the Croatian part of the Pannonian Basin System (CPBS). The maximum thickness of Neogene deposits in the western part of the depression (8000 km2) reached more than 5000 m [16]. The mapped sandstones belong to the Kloštar Ivanić Formation (Lower Pontian, 7.1–6.5 Ma), deposited in the slightly brackish environment of the late Pannonian Lake. The huge quantities of sand and silt detritus had been transported by turbidites, and, in the meantime, the calcite-rich mud was deposited in the calm, lacustrine environment. Consequently, the Upper Miocene deposits in the CPBS are represented by a regular alteration of turbiditic sandstones and lacustrine marls (e.g., [20,21]). Therefore, all discovered hydrocarbon sandstone reservoirs in Northern Croatia are of such origin. Reservoirs in the middle part of the structure are medium-grained sandstones, which are laterally and gradually transformed into clayey siltstones (i.e., psammite detritus into pelite). A typical litho- and chronostratigraphical section of analysed reservoir is given in Figure 2. That includes Lower Pontian and younger sediments, as wells did not reach the deeper (older) rocks.
Lithologically, the Kloštar Ivanić Formation sandstones are well sorted. In older parts these are hard sandstones, changed in the youngest part into weakly consolidated, fine-grained sediment. Marls are compact and medium-hard in the younger part with a larger portion of clay. Average thickness of marls is 30–150 m and 20–150 m for sandstones.
The initial pressures were in the reservoir “L” (field “A”) 157.3 bars at 1367 m. This was higher than hydrostatic pressure, but during recovering they were depleted, i.e., experienced a drop in average reservoir pressure. Currently, these values are just slightly higher than hydrostatic.
An example of Upper Miocene sandstones (surface outcrop, Medvednica Mt., Northern Croatia) is given in Figure 3. These are thin layered to laminated grey-brown fine sandstones, passing into cleavaged grey siltites and marls.
Laminated fine sandstones (quartz arenites) predominantly consist (Figure 4) of single quartz grains (white), poorly rounded and partly sorted, and subordinately of mica flakes (elongated) and carbonate grains (pink to red coloured). Carbonate grains are mainly planktonic foraminifera (Globigerinae), followed by some bioclasts. Grains are cemented together with sparry calcite cement. Primary porosity is mainly of intergranular and intragranular (intraskeletal) type, and it is partly reduced by secondary diagenetic pyrite within globigerinid ventricles (black).

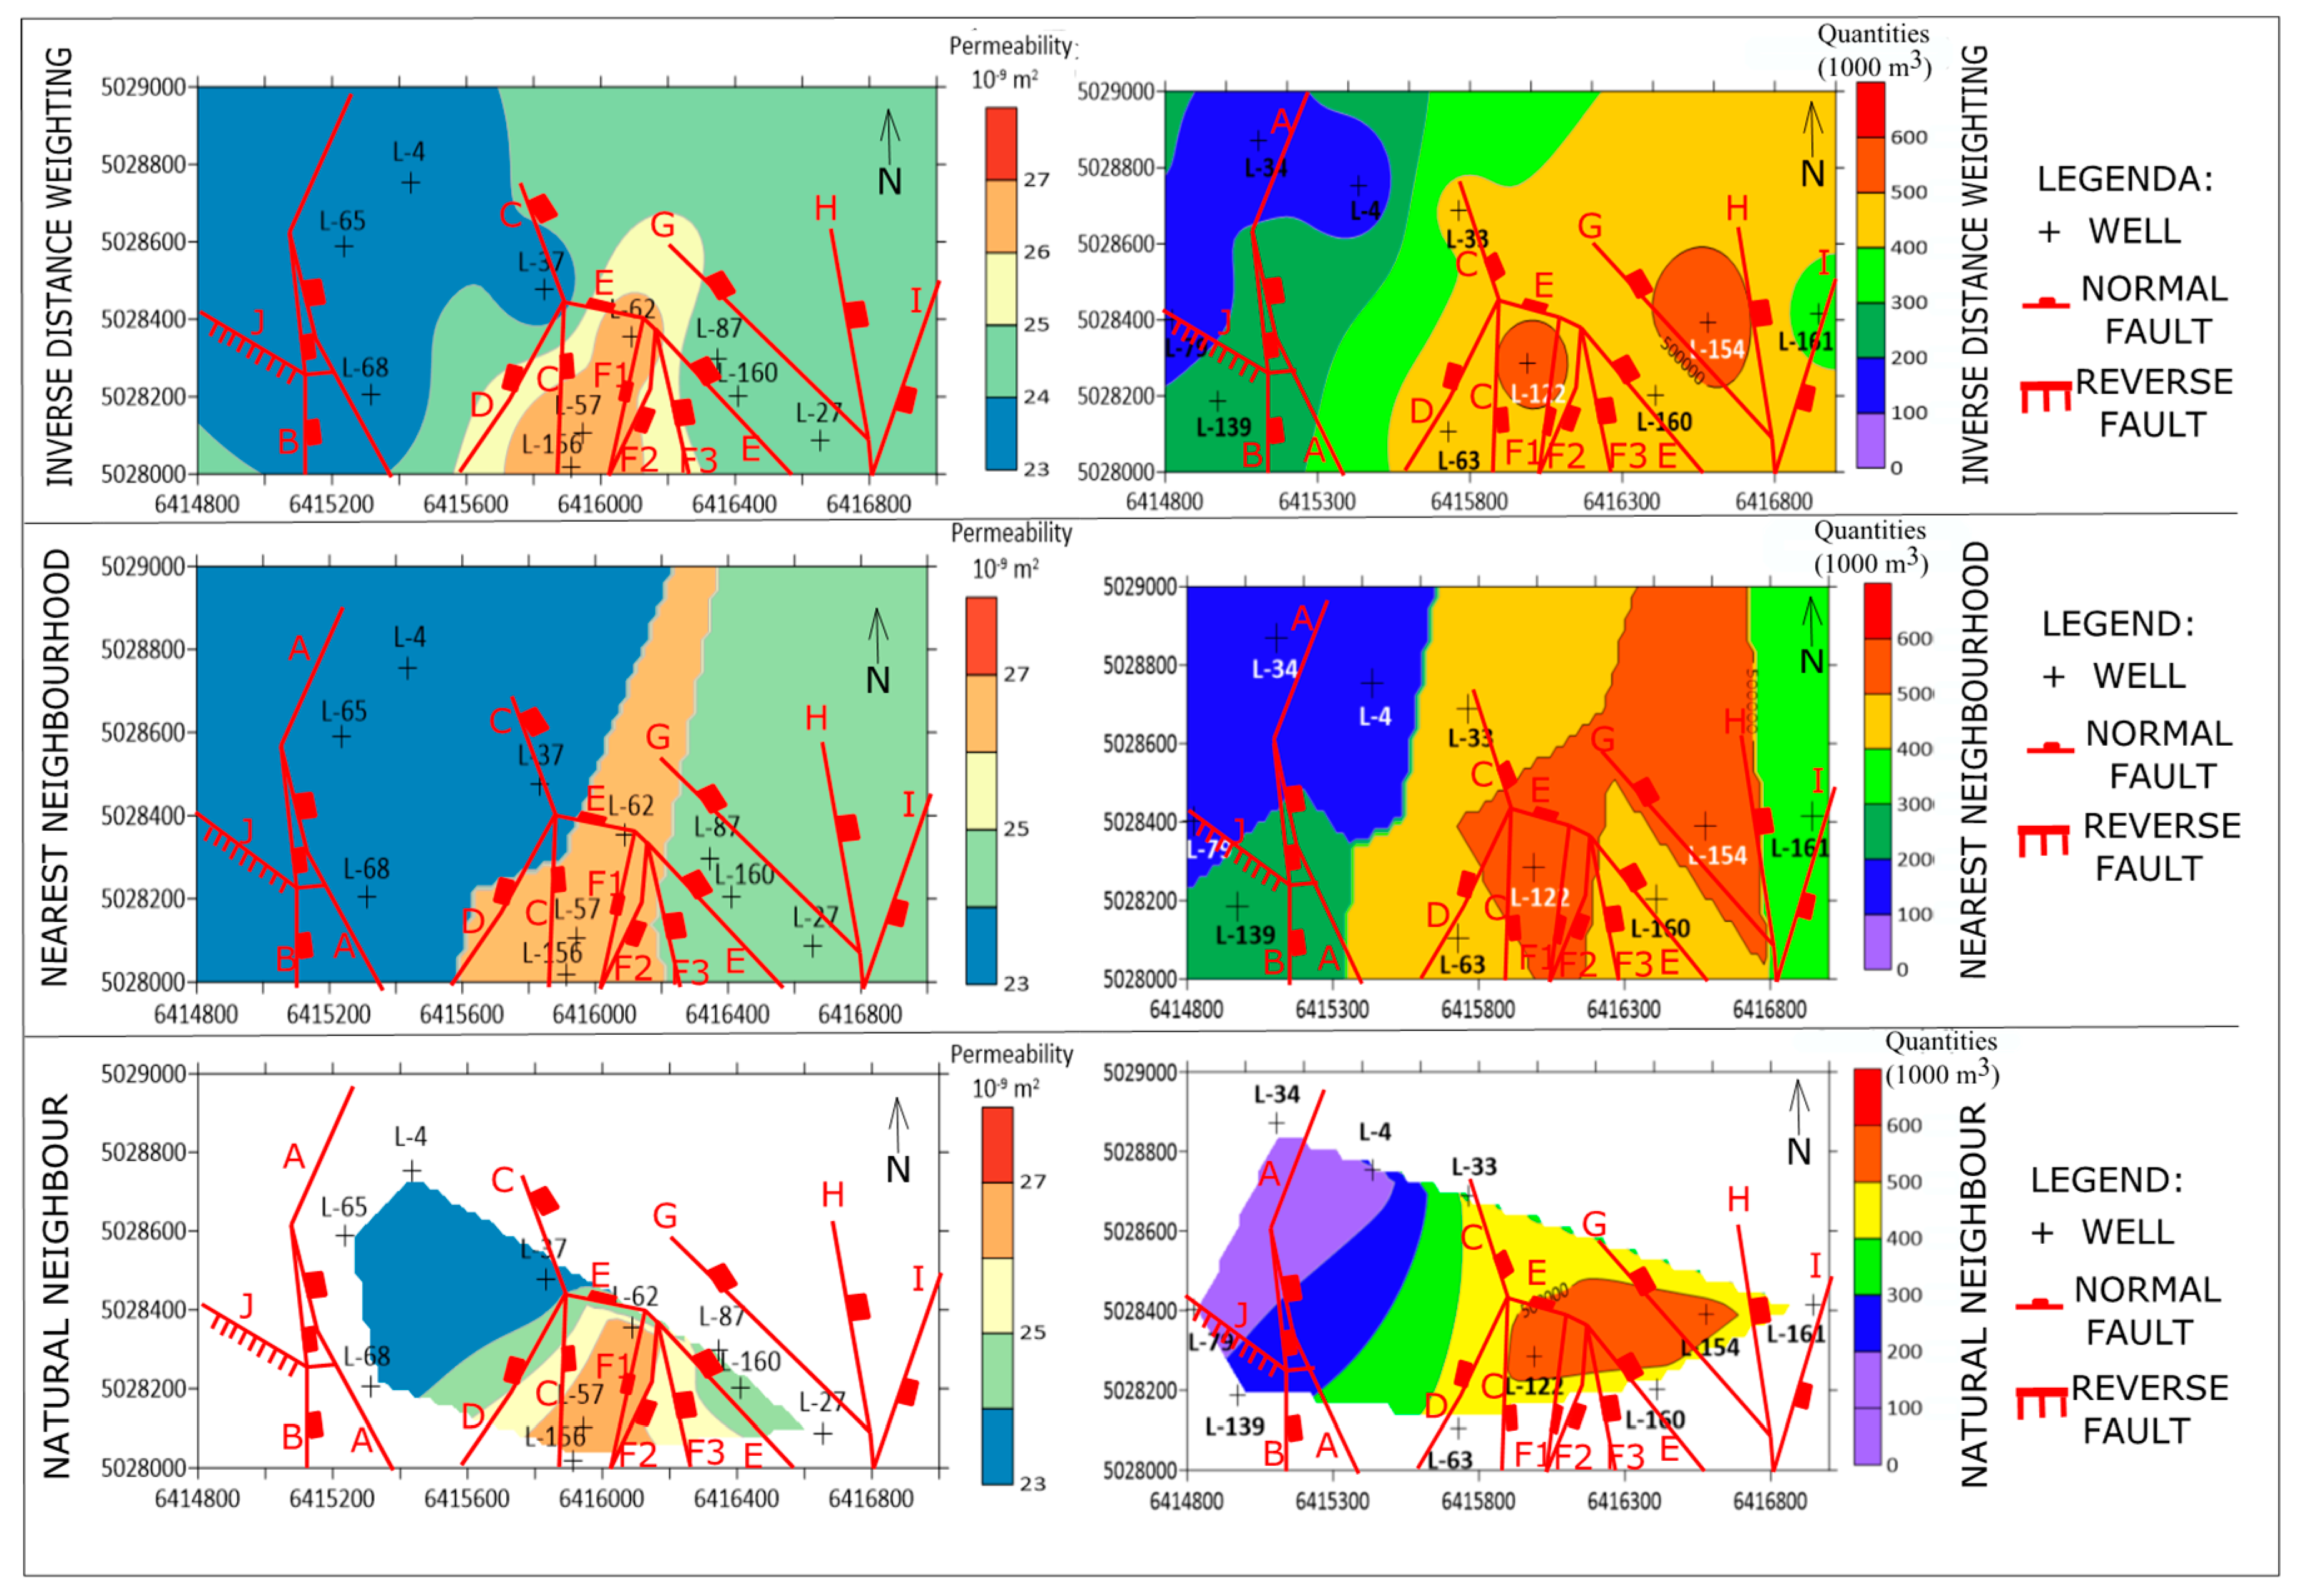
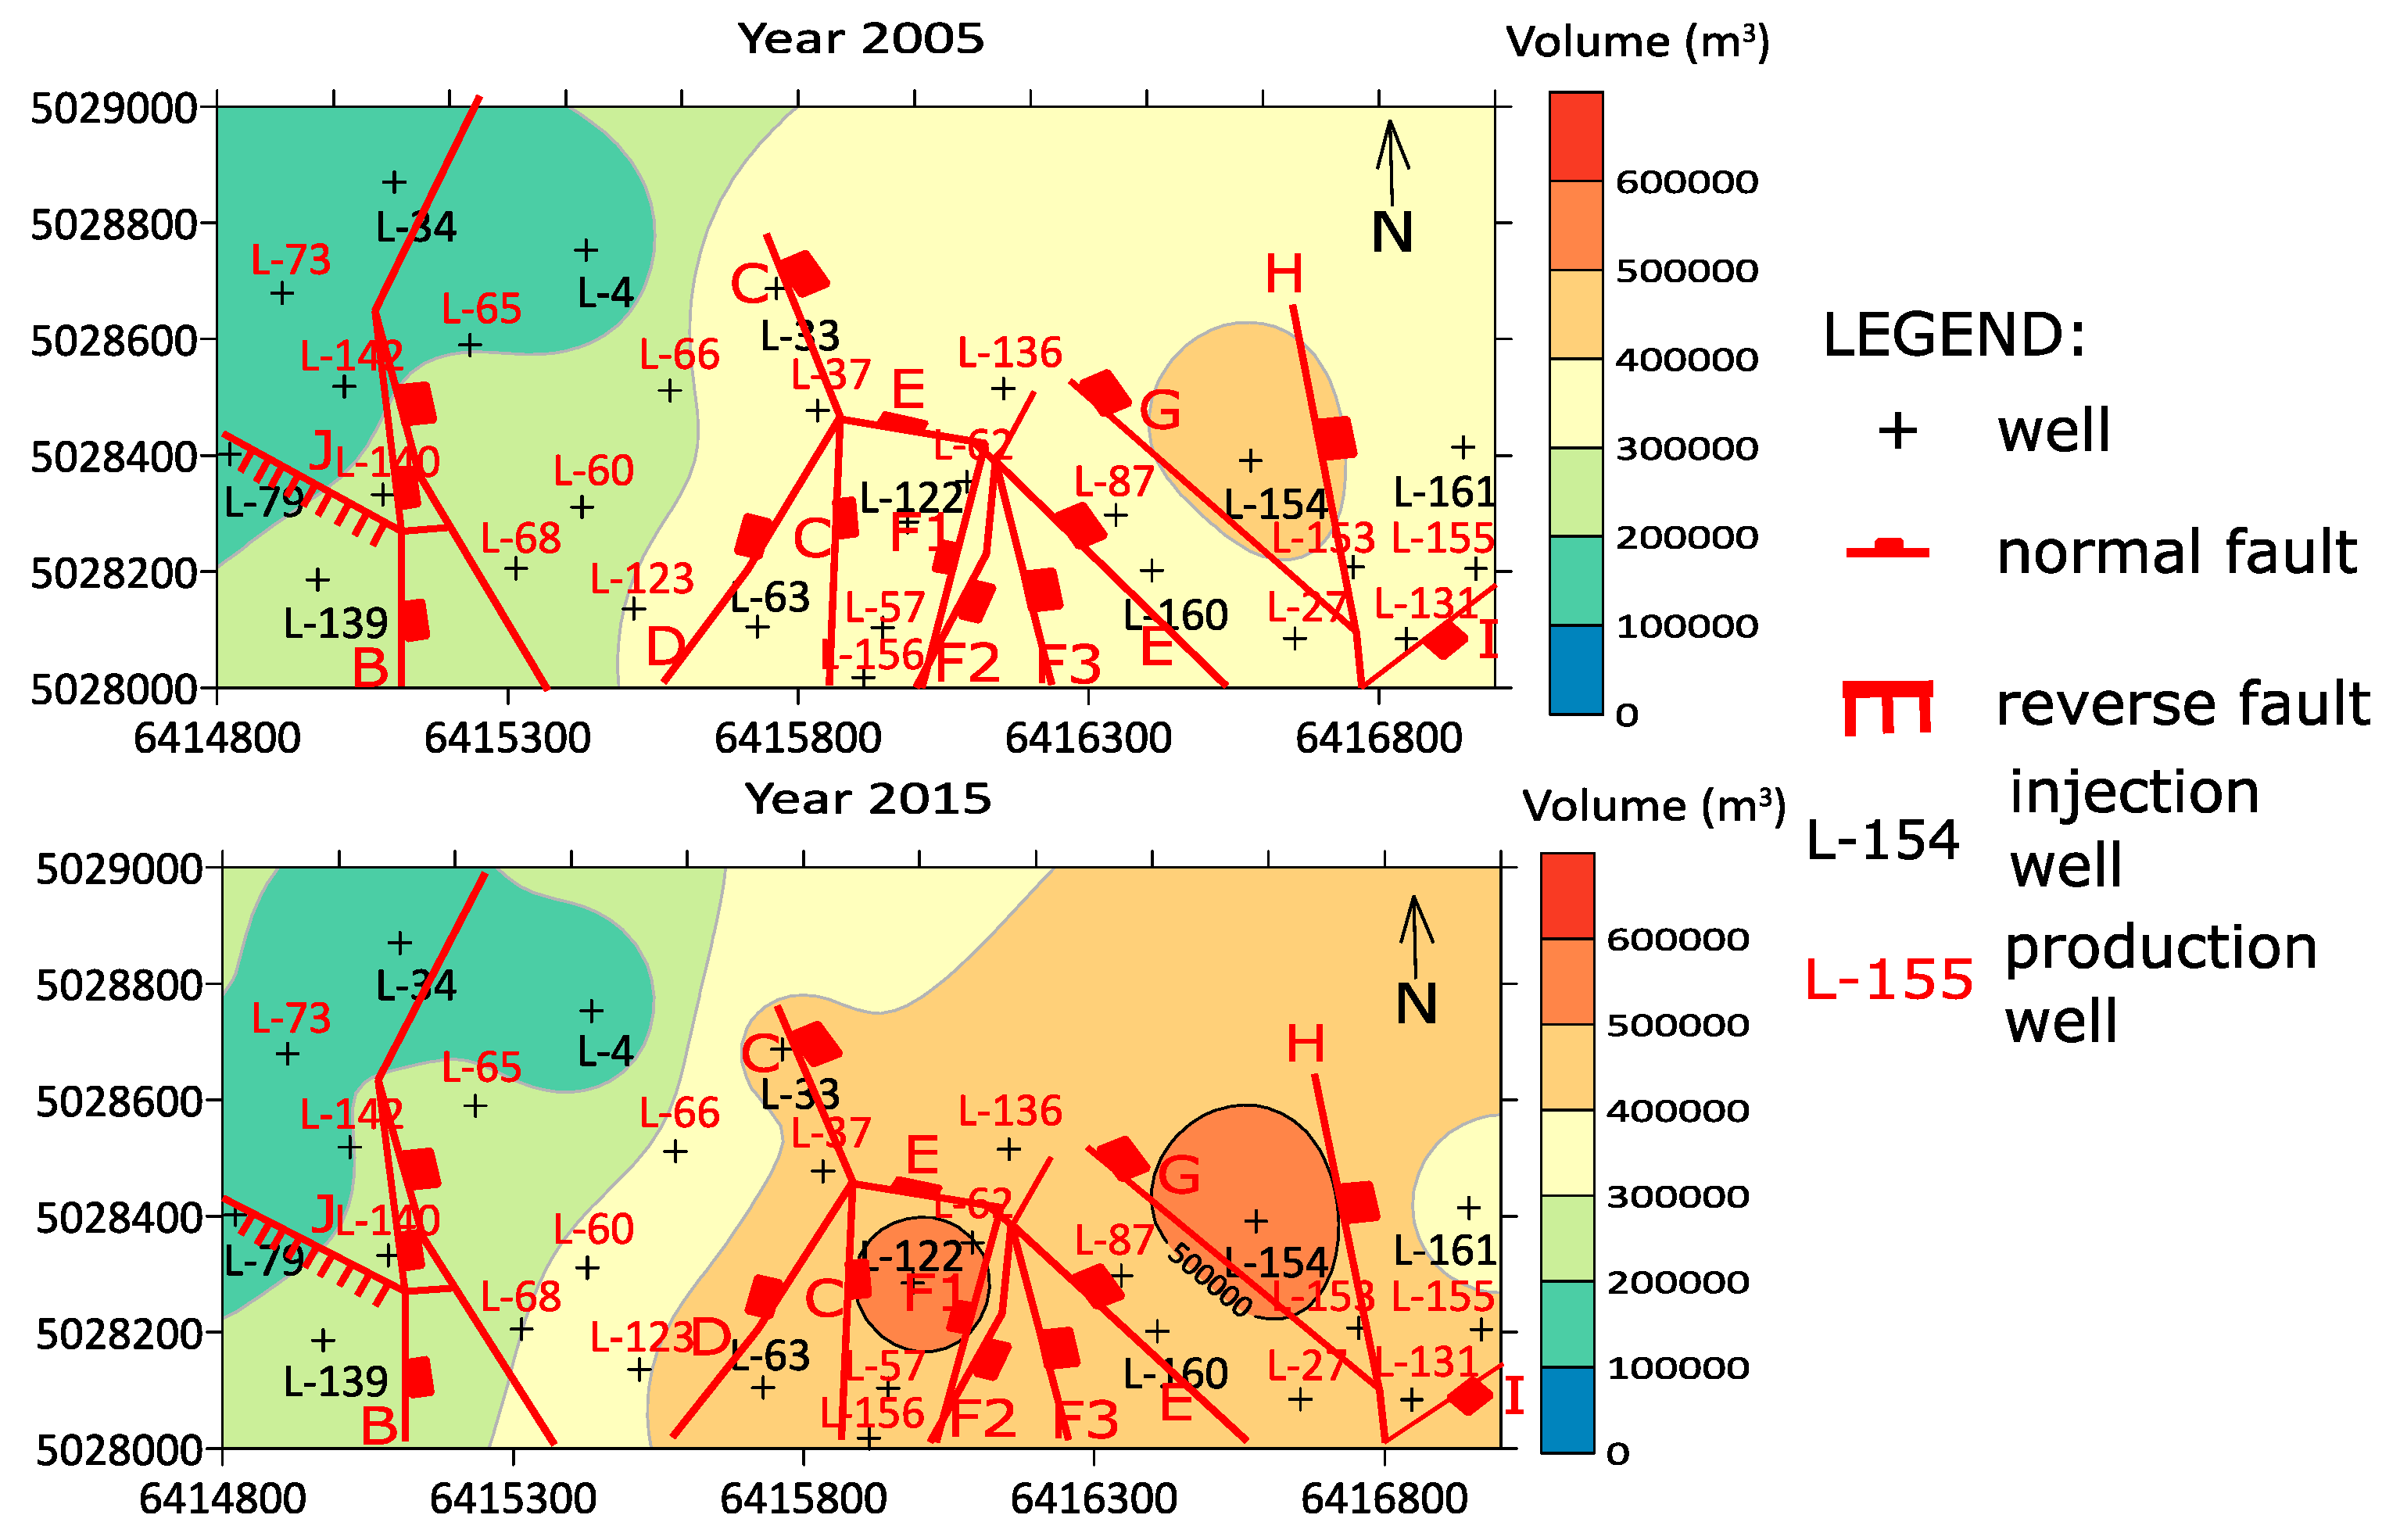
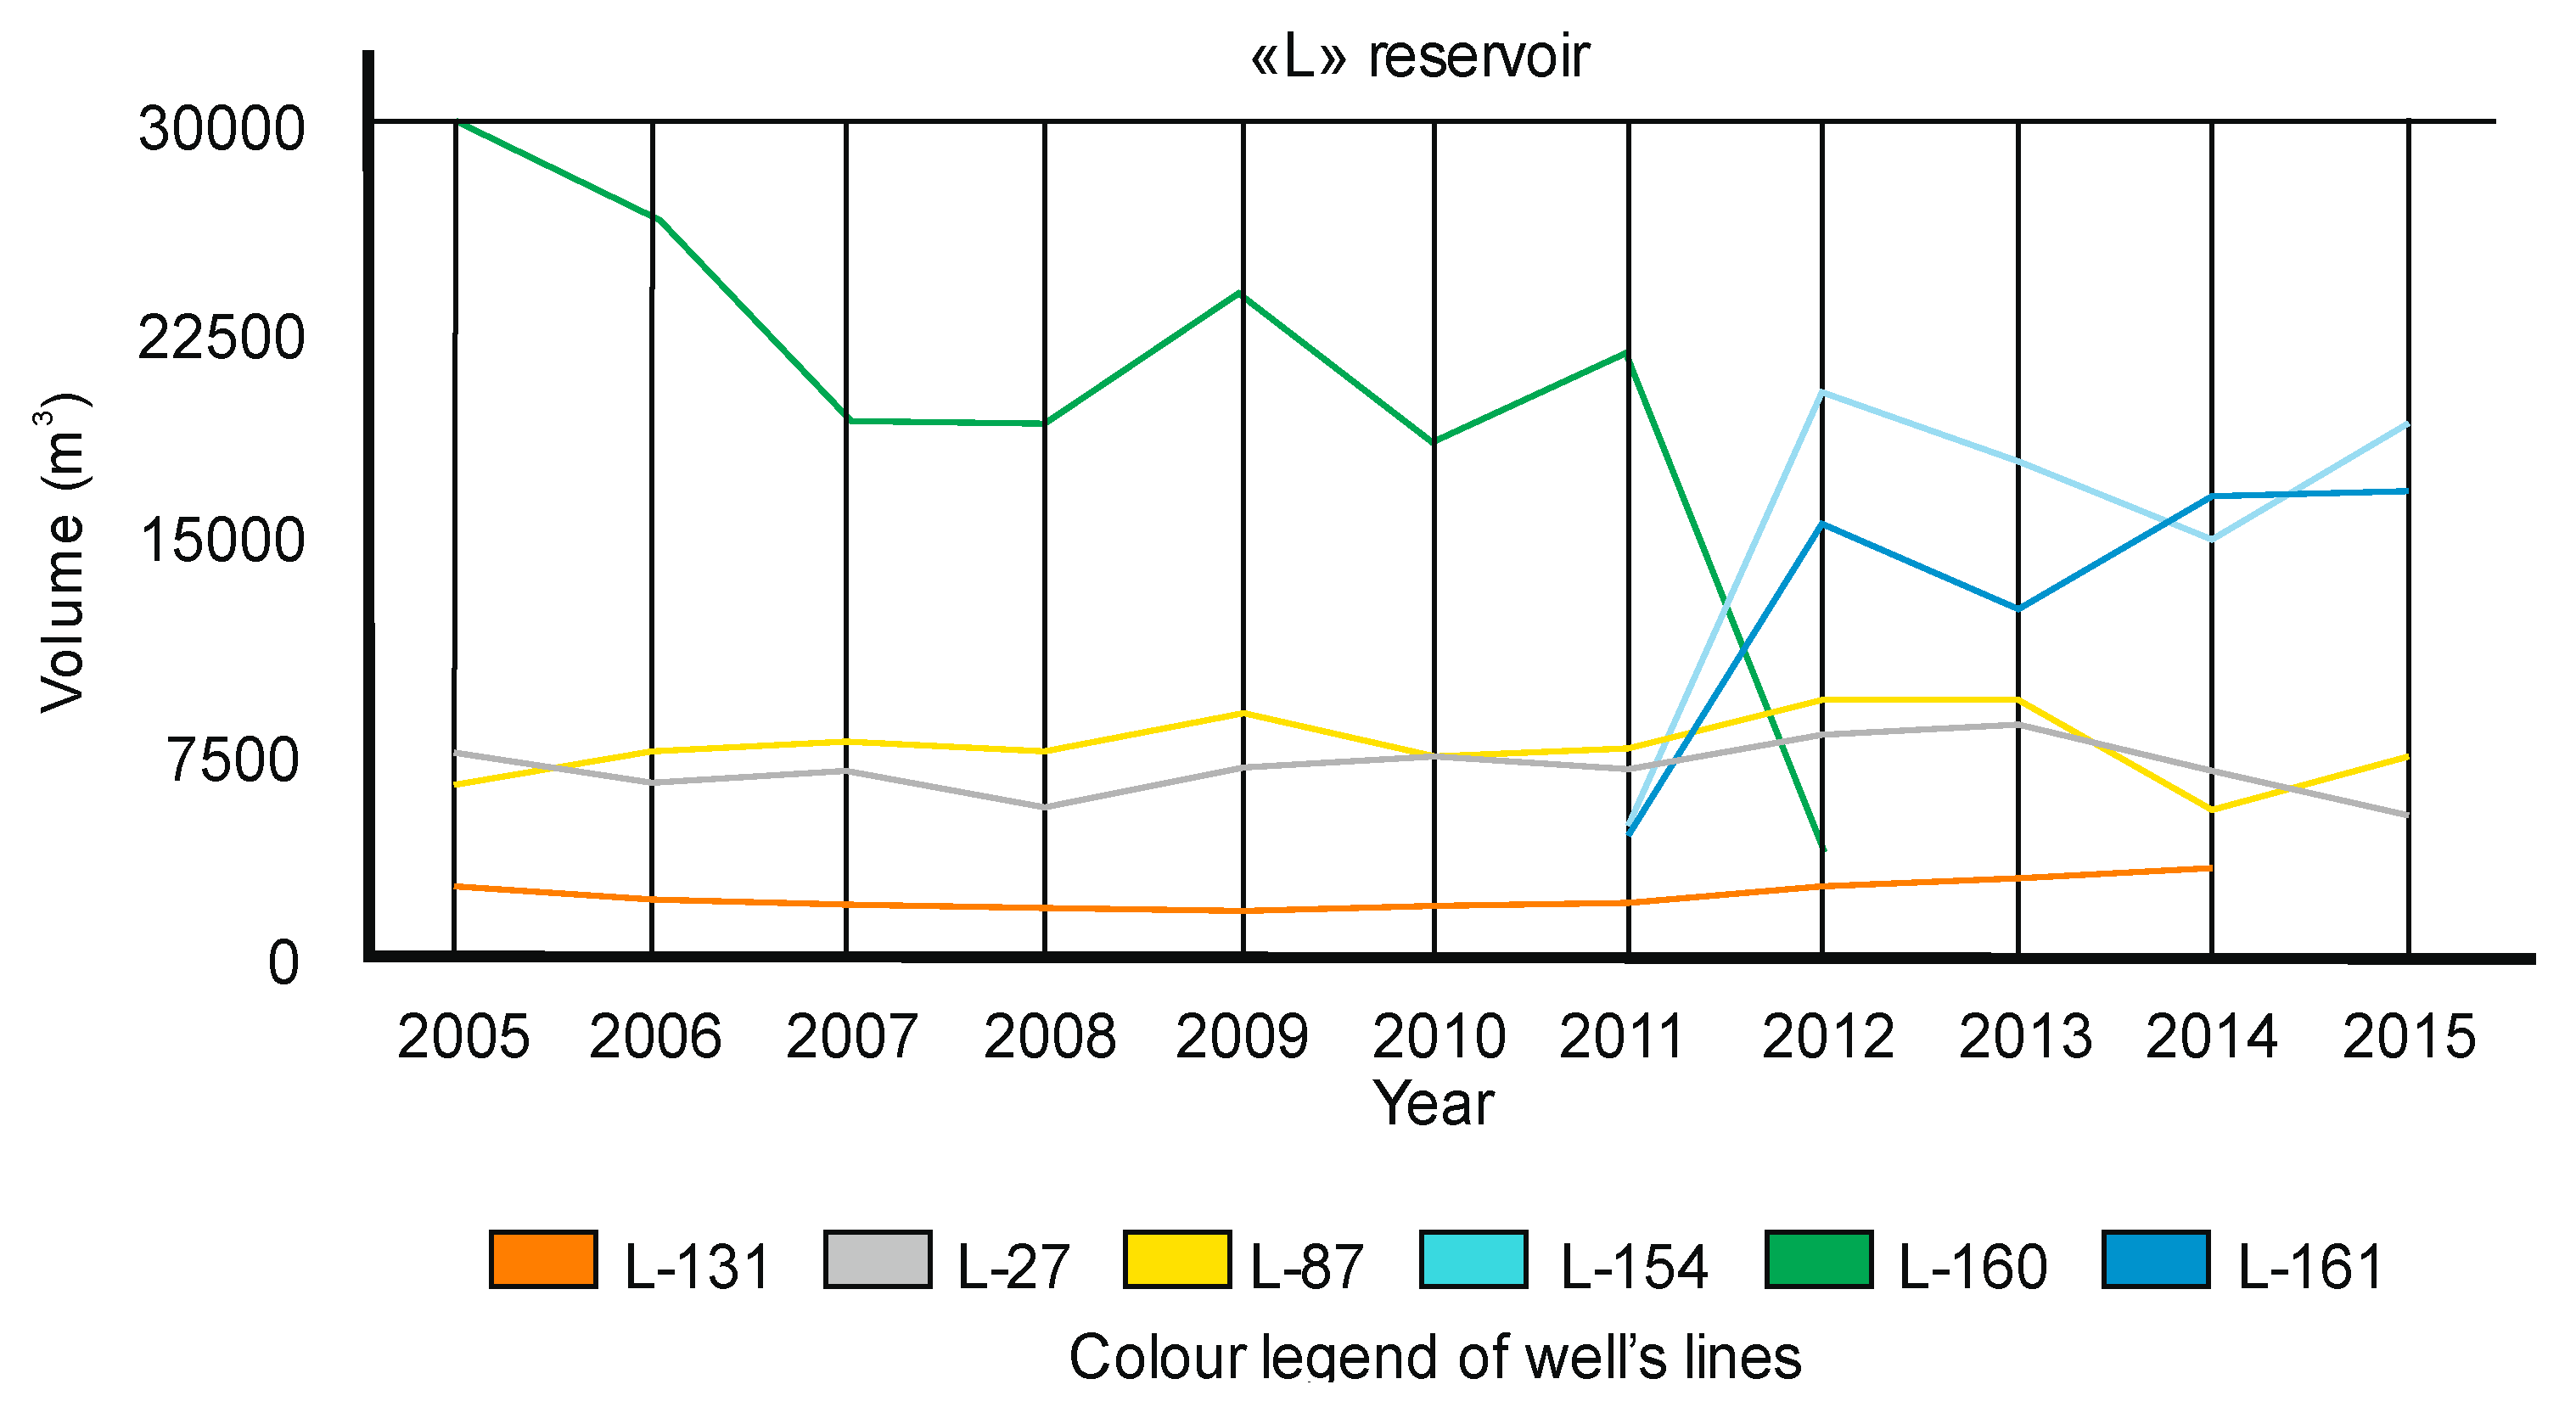
5. Mapping of the Reservoir “L” (Field “A”)

Three variables had been considered in the reservoir analysis. Those are porosity, permeability and injected water volumes. All of them are crucial in the process of optimising the water injection. The mean values for the reservoir are porosity 18.4% (oil saturation) and 19.7% (gas), permeability 17.5 × 10⁻³ µm2. The production started in 1962 and is currently supported by the water injection. Here, a part of the reservoir “L” is outlined with 10 currently active injection wells. For all of them, data about injected volumes and permeabilities are available (Figure 5).
The cross-validation for Figure 5 is given in Table 1.
The injected volumes are a dynamical variable, depending on the number of injection wells as well as injected quantities. The following summarises cumulative volumes recorded in 2005 and 2015 retrospectively based on 10 wells active between 1985–2015. Such datasets are mapped with IDW (Figure 6) as the most appropriate algorithm (Table 1) for this variable.
The cumulative IDW map (Figure 6) clearly outlines the main directions of water flooding. It can be recognised that volumes in the eastern part are lower than in the western part. This is a direct reflection of changes in lithological properties of sandstone, from the east (higher permeability, lower silty content) toward the west (fewer permeable varieties). The distribution of injected volumes is additionally influenced by fault zones, acting as barriers between the east and the west part of the field. Interestingly, within the fault zone there is a highly permeable matrix zone (Figure 5), but tectonic contacts are impermeable. Consequently, water flooding was less successful in the western part, but even there the clear response between the injected wells in L-154, 160, 161 and recovered volumes in L-27, 87, 131 wells can be observed at Figure 7.

6. Modified Geological Probability Applied for Estimation of Water Injection Successfulness

The western part of the depression is a well explored area, with numerous wells and seismic data. The discovered fields are equipped with infrastructural facilities. Using the basic geological probability calculation, POS value for the wider area of the field “A” is 0.42. The value is higher than 0.2, which legitimises further exploration (e.g., [18]). This locality is in the secondary production phase, where reservoir pressure is maintained by the water injection. Moreover, the basic POS calculation valid for the CPBS (e.g., [17,18,22]) can be easily modified for estimation of injection efficiency on the future production. In such a case, some basic categories could be neglected (source rocks, migration) as they are important only for the exploration phase and not for the developing one. However, other categories can be emphasised during the development, like reservoir pressure and field water. Moreover, water injection (e.g., [3,23,24,25]) is a cost effective process even for fluids with water portion larger than 90%.
In this case, modified POS is applied. Modified and basic values are slightly different, because they are based on the same two crucial categories (trap, reservoir). The modification has been done in the category “hydrocarbon preservation” (Table 2).
In the modified version, the injection is divided into subcategories regarding the percentage of production wells where increased hydrocarbon recovering is observed. The five subcategories, based on production wells with positive response, are: (a) >95%, (b) 75%–95%, (c) 50%–75%, (d) 25%–50%, (e) less than 25% of wells. In the analysed field, the response is observed for more than 95% of wells, so the modified POS calculation can be summarised by categories as follows: Trap 0.75, reservoir 1.0, hydrocarbon preservation 0.75. Consequently, modified POS is 0.56, and it is larger than the value of the regional basic POS. The result means that there is a 56.25% chance to expect that injected volumes result in increased production (oil and water) in recovering wells.

7. Risk-Neutral Value for Future Water Injection

The efficiency and benefits for a quality water injection system eventually need to be financially evaluated. Such tasks could be completed by using a risk-neutral value (RNV). The first examples of RNV calculation in the CPBS were done in the Bjelovar Subdepression [18]. The result, including POS, offered economic and geological input for planning sustainability development of hydrocarbon production in that area. A similar procedure has been repeated here but using the modified POS, with the aim of evaluating the most efficient method of future water injection. The costs of water separation are 4.55–9.16 HRK/m3. The costs of water injection for a single system [3] are 8.68 ± 2.00 HRK/m3. The costs also include equipment maintenance. In case of the occurrence of sand during the production of hydrocarbons for the Klostar Ivanic Formation, according to [26,27], continuous production of hydrocarbons is ensured, and thus in the model the given production time. The observed period is 10 years, and desired response in recovered fluid has been set at 0.5%, 1% and 2%. Discount rate was 10%. The annual budget available for the injection process in the western part of the depression (regional costs) is 35 × 106 USD. The average oil price is 390 $/m3 (February 2019). Applied POS is 0.56, using risk-averse function of 1/5 of annual capital investments (7). All data are summarised in Table 3.
The net present value (NPV) is increased following the higher fluid volume, i.e., the larger recovery. The NPV is the highest when response yielded 2% larger recovery, i.e., 10.11 × 10⁶ USD. The expected monetary value (EMV) is 4.42 × 10⁶ USD and utility units (U) 5.34 × 10⁶ USD. However, regarding the regional exploration level, expected annual budget and increased recovery, the additional 1% scenario is set as realistic. In such a case, the equivalent value of 1.21 × 10⁶ USD is recommended for investment in the future water injection.

8. Discussion

The analysed reservoir “L” in the field “A” represents a typical Upper Miocene (Lower Pontian) sandstone reservoir in the Sava Depression. The portion of sandy detritus reached 72% with porosity varying between 14.5% and 23.9%. The appropriate interpolation is a key method for better understanding of reservoir variables’ distribution as well as the water injection results. As quantity of data was low (<20 points), included variables (porosity, permeability, injected volumes) were interpolated using three interpolation methods (IDW, NN, NaN). In such cases, the degree of uncertainty is always large. Partially, it comes from the mathematical background, where spatial dependence is simply represented by distance or is not considered at all, like in the polygonal estimations. However, in a small dataset it yields to lower error than using equations like variograms, which would force “artificial” spatial dependence. Even in cases when “artificial” data are generated, like in using jack-knifing algorithm, the detailed geological expertise and knowledge have to be applied to make such approaches meaningfully accepted.
Therefore, the results from this study were checked by two other classical mapping tools for error estimations. These are the cross-validation and the visual interpretation (bull-eying, batter-fling). Both resulted in selection of the IDW as the most appropriate interpolation. It was especially emphasised for injected volumes as only dynamic variables with cumulative values per decades were observed. Moreover, the permeability distribution highly determined the spreading of injection volumes.
Using the modified POS calculation, it was possible to estimate future costs optimised by risk and production variables. Some categories are dropped (source rocks, migration) and other were replaced (field water activity with response on injection). Modified POS of 56.25% was used for economic evaluation with neutral monetary value. Three cases are selected for periods of 10, 20 and 30 years of future production, with increase of recovery 1%, 2% and 3%. The highest value for money equivalent has been calculated for a 20-years period with maximal investment 2.32 × 10⁶ USD (with 50 × 106 USD regional annual budget) worth to spend for discovering particular satellite reservoirs and/or 1.17 × 10⁶ USD (with 35 × 106 annual regional budget) to invest in maintaining water injection in existing reservoir “L”.
The “simpler mathematical interpolation/estimation” methods have been, up to now, applied several times in the CPBS in the reservoir of several fields, like Beničanci, Stari-Gradac [28,29] and Kloštar Ivanić [5] Fields.
However, in those cases, selected variables did not include injected water volumes because the data were not systemised enough to perform such a task, so this is the first time that such an approach has been done in Croatia. However, similar topics have been published worldwide, although with some differences regarding collected data. For example, [30] gave results of mapping in the areas where water and gas had been injected and observed through 4D seismic methods. Water-flood monitoring can be done also by chemical tracer, as shown by [31] for the Romanian oil reservoirs. Another study [32] showed a case study of waterflood optimisation. Their optimisation involved the analysis of the effects of production and injection zone and eventually mapping of waterflood pattern, accompanied with maps of reservoir permeability, porosity and net-to-gross ratio.
However, all of these analyses relied on many more data and additional techniques (like seismic) than those available in analysis presented in this paper. Consequently, such water-flooding observations need to be strongly divided in categories as follows:
(a)
Water-flooding monitored from basic production, logging and geological data;
(b)
Water-flooding analysed with additional laboratory tests (like using tracers);
(c)
Water-flooding observed on time scale (4D) using seismic and continuous in-site measurements and logging.

9. Conclusions

Consequently, it could be concluded that:
  • The mapping of reservoir variables, and specially of the injected volumes, is the most sensitive task in the analysis of such injection systems.
  • The most appropriate interpolation for such a variable is IDW in cases when quantity of data is low (20 points or fewer). This has been proven for sandstone reservoirs in the Sava Depression but could be valid for similar hydrocarbon systems everywhere.
  • It is recommended to analyse injected volumes during several time intervals, like decades as used in this study, and compare results with permeability’s and fault zone’s distribution.
  • In such cases, geological expertise could support selection of the most appropriate map for the injected volumes, based on reservoir tectonics and lithological zonation.
  • The results are crucial for optimisation of future injection projects in the sandstone reservoirs and obtaining higher recovery with lower operational costs.
  • The obtained maps could significantly help to optimise the injection volumes, decrease the applied water quantities and eventually reduce the water environmental impact.

Author Contributions

T.M. led the research and selected the fields for analyses. J.I. collected data, selected methods and interpolated maps. J.V. and J.S. prepared regional geology presentation and U.B. visualised samples and connected with regional geology. All authors have read and agreed to the published version of the manuscript.

Funding

This research (analyses) was partially supported with the project “Mathematical methods in geology IV” (led by T.M.). Funds were given from the University of Zagreb, Faculty of Mining, Geology and Petroleum Engineering, for the 2019 year.

Acknowledgments

Some data from technical documentation of INA Plc. are used and presented in some maps and tables, collected during the doctoral research of J. Ivšinović.

Conflicts of Interest

The authors declare no conflict of interest. The funders had no role in the design of the study; in the collection, analyses, or interpretation of data; in the writing of the manuscript, or in the decision to publish the results.

References

  1. Jia Jyun, B.; Tsau, S.; Barati, R. A review of the current progress of CO2 injection EOR and carbon storage in shale oil reservoirs. Fuel 2019, 236, 404–427. [Google Scholar]
  2. Hassan, A.; Elkatatny, S.; Abdulraheem, A. Intelligent Prediction of Minimum Miscibility Pressure (MMP) During CO2 Flooding Using Artificial Intelligence Techniques. Sustainability 2019, 11, 7020. [Google Scholar] [CrossRef] [Green Version]
  3. Ivšinović, J. The analysis of water injection systems in sandstone hydrocarbon reservoirs, case study from the western part of the Sava Depression. Rud. Geol. Naft. Zb. 2017, 32, 17–24. [Google Scholar] [CrossRef]
  4. Nazina, T.; Sokolova, D.; Grouzdev, D.; Semenova, E.; Babich, T.; Bidzhieva, S.; Serdukov, D.; Volkov, D.; Bugaev, K.; Ershov, A.; et al. The Potential Application of Microorganisms for Sustainable Petroleum Recovery from Heavy Oil Reservoirs. Sustainability 2020, 12, 15. [Google Scholar] [CrossRef] [Green Version]
  5. Balić, D.; Velić, J.; Malvić, T. Selection of the most appropriate interpolation method for sandstone reservoirs in the Kloštar oil and gas field. Geol. Croat. 2008, 61, 27–35. [Google Scholar]
  6. Medved, I.; Pribičević, B.; Medak, D.; Kuzmanić, I. Usporedba metoda interpolacije batimetrijskih mjerenja za praćenje promjena volumena jezera (Comparison of Interpolation Methods of Bathymetry Data Used for Monitoring of Lake Volume Change). Geod. List 2010, 2, 71–86. [Google Scholar]
  7. Ly, S.; Charles, C.; Degré, A. Geostatistical interpolation of daily rainfall at catchment scale: The use of several variogram models in the Ourthe and Ambleve catchments, Belgium. Hydrol. Earth Syst. Sci. 2011, 15, 2259–2274. [Google Scholar] [CrossRef] [Green Version]
  8. Husanović, E.; Malvić, T. Review of deterministic geostatistical mapping methods in Croatian hydrocarbon reservoirs and advantages of such approach. Nafta 2014, 65, 57–63. [Google Scholar]
  9. Ivšinović, J. Deep mapping of hydrocarbon reservoirs in the case of a small number of data on the example of the Lower Pontian reservoirs of the western part of Sava Depression. In Proceedings of the 2nd Croatian Congress on Geomathematics and Geological Terminology, Zagreb, Croatia, 6 October 2018; Malvić, T., Velić, J., Rajić, R., Eds.; University of Zagreb, Faculty of Mining, Geology and Petroleum Engineering: Zagreb, Croatia, 2018; pp. 59–65. [Google Scholar]
  10. Traversoni, L. Natural neighbour finite elements. Trans. Ecol. Environ. 1994, 8, 291–297. [Google Scholar]
  11. Boissonnat, J.-D.; Cazals, F. Natural neighbor coordinates of points on a surface. Comput. Geom. 2001, 19, 155–173. [Google Scholar] [CrossRef] [Green Version]
  12. Tsidaev, A. Parallel Algorithm for Natural Neighbor Interpolation. In Proceedings of the 2nd Ural Workshop on Parallel, Distributed, and Cloud Computing for Young Scientists, Russia, 2016; Sozykin, A., Akimova, E., Ustalov, D., Eds.; Ural-PDC: Yekaterinburg, Russia, 2016; pp. 78–83. [Google Scholar]
  13. Rodrıguez, J.D.; Perez, A.; Lozano, J.A. Sensitivity Analysis of k-Fold Cross Validation in Prediction Error Estimation. IEEE Trans. Pattern Anal. Mach. Intell. 2010, 3, 569–575. [Google Scholar] [CrossRef] [PubMed]
  14. Arlot, S.; Lerasle, M. Choice of V for V -Fold Cross-Validation in Least-Squares Density Estimation. J. Mach. Learn. Res. 2016, 17, 1–50. [Google Scholar]
  15. Malvić, T.; Ivšinović, J.; Velić, J.; Rajić, R. Kriging with a Small Number of Data Points Supported by Jack- Knifing, a Case Study in the Sava Depression (Northern Croatia). Geosciences 2019, 9, 36. [Google Scholar] [CrossRef] [Green Version]
  16. Malvić, T.; Ivšinović, J.; Velić, J.; Rajić, R. Interpolation of Small Datasets in the Sandstone Hydrocarbon Reservoirs, Case Study of the Sava Depression, Croatia. Geosciences 2019, 9, 201. [Google Scholar] [CrossRef] [Green Version]
  17. Malvić, T. Oil-Geological Relations and Probability of Discovering New Hydrocarbon Reserves in the Bjelovar Sag. Ph.D. Thesis, University of Zagreb, Zagreb, Croatia, 2003. [Google Scholar]
  18. Malvić, T.; Rusan, I. Investment risk assessment of potential hydrocarbon discoveries in a mature basin. Case study from the Bjelovar Sub-Basin, Croatia. Oil GasEur. Mag. 2009, 35, 67–72. [Google Scholar]
  19. Malvić, T. Stochastical approach in deterministic calculation of geological risk-theory and example (Stohastički pristup u determinističkom izračunu geološkog rizika- teorija i primjer). Nafta 2009, 60, 658–662. [Google Scholar]
  20. Velić, J. Geologija Ležišta Nafte i Plina (Geology of Oil and Gas); Faculty of Mining-Geology-Petroleum Engineering Zagreb: Zagreb, Croatia, 2007; p. 342. [Google Scholar]
  21. Malvić, T. Review of Miocene shallow marine and lacustrine depositional environments in Northern Croatia. Geol. Q. 2012, 56, 493–504. [Google Scholar] [CrossRef] [Green Version]
  22. Režić, M.; Varenina, A. A new freeware program for the Probability of Success calculation of new gas discoveries within the Croatian part of the Po depression. Rud. Geol. Naft. Zb. 2017, 32, 49–55. [Google Scholar] [CrossRef] [Green Version]
  23. Ivšinović, J.; Dekanić, I. The basics of model for marginal testing of costs for disposal of extracted formation water. Rud. Geol. Naft. Zb. 2015, 30, 85–99. [Google Scholar] [CrossRef] [Green Version]
  24. Ivšinović, J. Statistička obrada troškova odvajanja pridobivene slojne vode iz pješčenjačkih ležišta Savske depresije (Statistical analysis of the costs of separating the produced formation water from a sandstone reservoir of Sava Depression). In Proceedings of the 1st Croatian Congress on Geomathematics and Geological Terminology, Zagreb, Croatia, 29 October 2016; Malvić, T., Velić, J., Eds.; University of Zagreb, Faculty of Mining, Geology and Petroleum Engineering: Zagreb, Croatia, 2016; pp. 69–74. (In Croatian) [Google Scholar]
  25. Ivšinović, J. The cost analysis of the separation of produced formation water from the hydrocarbon reservoir using the example of the upper Miocene sandstone deposits of the Sava Depression. Rud. Geol. Naft. Zb. 2018, 33, 35–43. [Google Scholar] [CrossRef] [Green Version]
  26. Ivšinović, J. The relationship between sandstone depositional environment and water injection system, a case study from the Upper Miocene hydrocarbon reservoir in northern Croatia. In Proceedings of the 2nd Croatian Congress on Geomathematics and Geological Terminology, Zagreb, Croatia, 6 October 2018; Malvić, T., Velić, J., Rajić, R., Eds.; University of Zagreb, Faculty of Mining, Geology and Petroleum Engineering: Zagreb, Croatia, 2018; pp. 65–75. [Google Scholar]
  27. Ivšinović, J.; Pleteš, V.; Marinić, M. Production of hydrocarbons from weakly consolidated sandstone reservoirs in the Croatian part of the Pannonian basin system. Min. Miner. Depos. 2018, 12, 116–121. [Google Scholar] [CrossRef]
  28. Malvić, T.; Đureković, M. Application of methods: Inverse distance weighting, ordinary kriging and collocated cokriging in porosity evaluation, and comparison of results on the Beničanci and Stari Gradac fields in Croatia. Nafta 2003, 54, 331–340. [Google Scholar]
  29. Smoljanović, S.; Malvić, T. Improvements in reservoir characterization applying geostatistical modelling (estimation & stochastic simulations vs. standard interpolation methods), Case study from Croatia. Nafta 2005, 56, 57–63. [Google Scholar]
  30. Araújo Côrtea, G.; Pereira Leiteb, E. Mapping of water and gas injection areas through modeling and interpretation of 4D seismic from reservoir simulation models. J. Pet. Sci. Eng. 2017, 153, 288–296. [Google Scholar] [CrossRef]
  31. Zecheru, M.; Goran, N. The Use of Chemical Tracers to Water Injection Processes Applied on Romanian Reservoirs; EDP Sciences: Les Ulis, France, 2013. [Google Scholar] [CrossRef] [Green Version]
  32. Ogbeiwi, P.; Aladeitan, Y.; Udebhulu, D. An approach to waterflood optimization: Case study of the reservoir X. J. Pet. Explor. Prod. Technol. 2018, 8, 271–289. [Google Scholar] [CrossRef]
Figure 1. Geographical location of the field ”A“ in Northern Croatia.
Sustainability 12 00786 g001
Figure 2. Typical geological section of analysed field.
Sustainability 12 00786 g002
Figure 3. Typical sandstone samples from outcrop (the left scale is in centimetres/cm).
Sustainability 12 00786 g003
Figure 4. Micro photograph of the sandstone sample.
Sustainability 12 00786 g004
Figure 5. Permeability (left) and injected volume (right) maps interpolated using inverse distance weighting (IDW), nearest neighbourhood (NN) and natural neighbourhood (NaN) in reservoir “L”—present-day values [16].
Sustainability 12 00786 g005
Figure 6. Cumulative volumes of injected waters in 2005 and 2015 interpolated with IDW.
Sustainability 12 00786 g006
Figure 7. Comparison between the injected (L-154,160,161 wells) water volumes and recovered oil (L-27,87,131 wells) in reservoir “L”.
Sustainability 12 00786 g007
Table 1. Cross-validation for the reservoir “L”.
VariableNo. of PointsCross-Validation
IDWNNNaN
Volume101.21 × 10102.64 × 10102.36 × 1010
Permeability101.412.223.48
Table 2. Probability of success (POS) modification in the category “hydrocarbon preservation” (grey-coloured items are deleted, yellow-highlighted items applied as modifications).
Hydrocarbon Preservation
Field WaterProbabilityInjection of Field WaterProbability
Aquifer is still1.00Recovered quantities have been increased in >95% of wells1.00
Aquifer is active0.75Recovered quantities have been increased in 75%–95% of wells0.75
Reservoir is infiltrated with field water from surrounding rocks0.50Recovered quantities have been increased in 50%–75% of wells0.50
Reservoir is infiltrated with surface water0.25Recovered quantities have been increased in 25%–50% of wells0.25
Data are not available0.05Recovered quantities have not been observed or have been increased in less than 25% of wells0.05
Table 3. Calculation of risk-neutral value (of cash flow) for three scenarios in reservoir “L” (from left—0.5%, 1%, 2% higher recovery).
DescriptionReservoir “L”
Production period (years)101010
Discount rate (%)101010
Net present value (106 $)1.504.9810.11
Geological probability (POS)0.560.560.56
Expected monetary value (106 $)0.662.184.42
CAPEX for recovery maintenance (106 $)353535
Risk averse function777
Utility units (106 $)1.343.565.34
The first approximation of utility function0.030.030.03
Hydrocarbon production costs (106 $)0.580.781.17
Risk adjusted value ($)0.262.034.46
Expected utility units ($)0.641.111.05
Risk-neutral equivalents (RN$)0.681.211.15

