A Practical Index to Estimate Mangrove Conservation Status: The Forests from La Paz Bay, Mexico as a Case Study

 and
and
Abstract
:1. Introduction
1.1. Theoretical Background
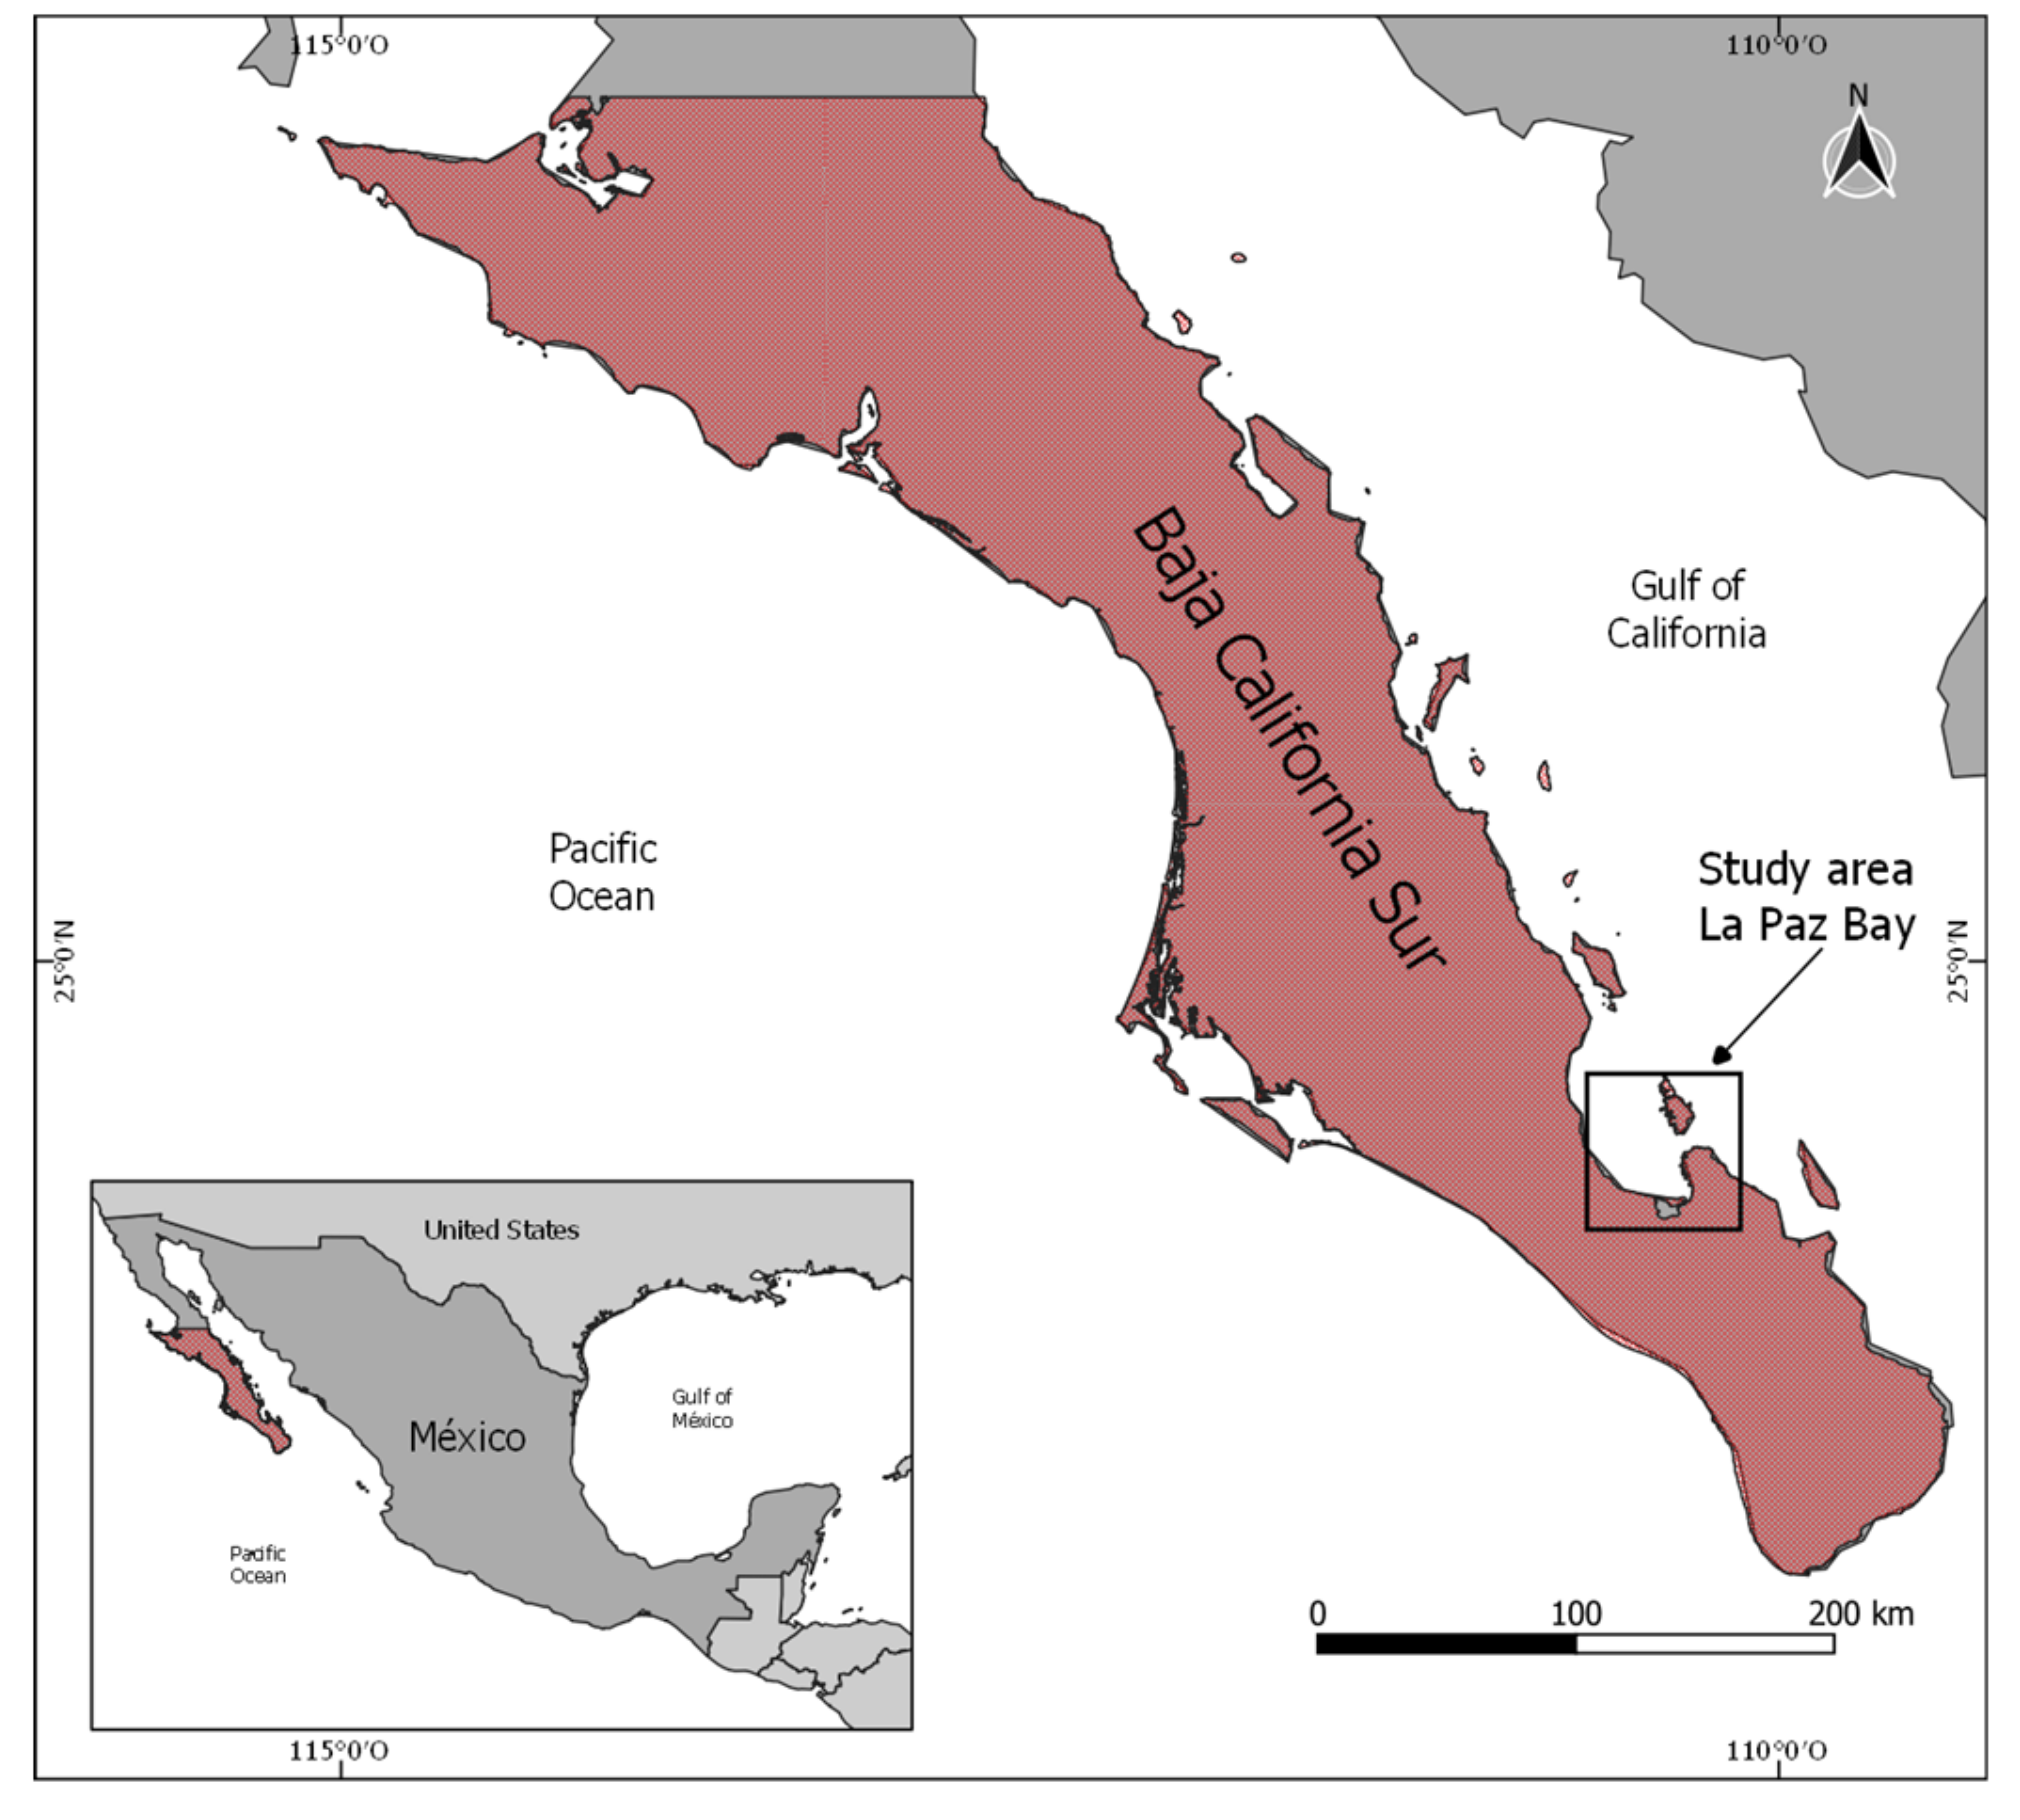
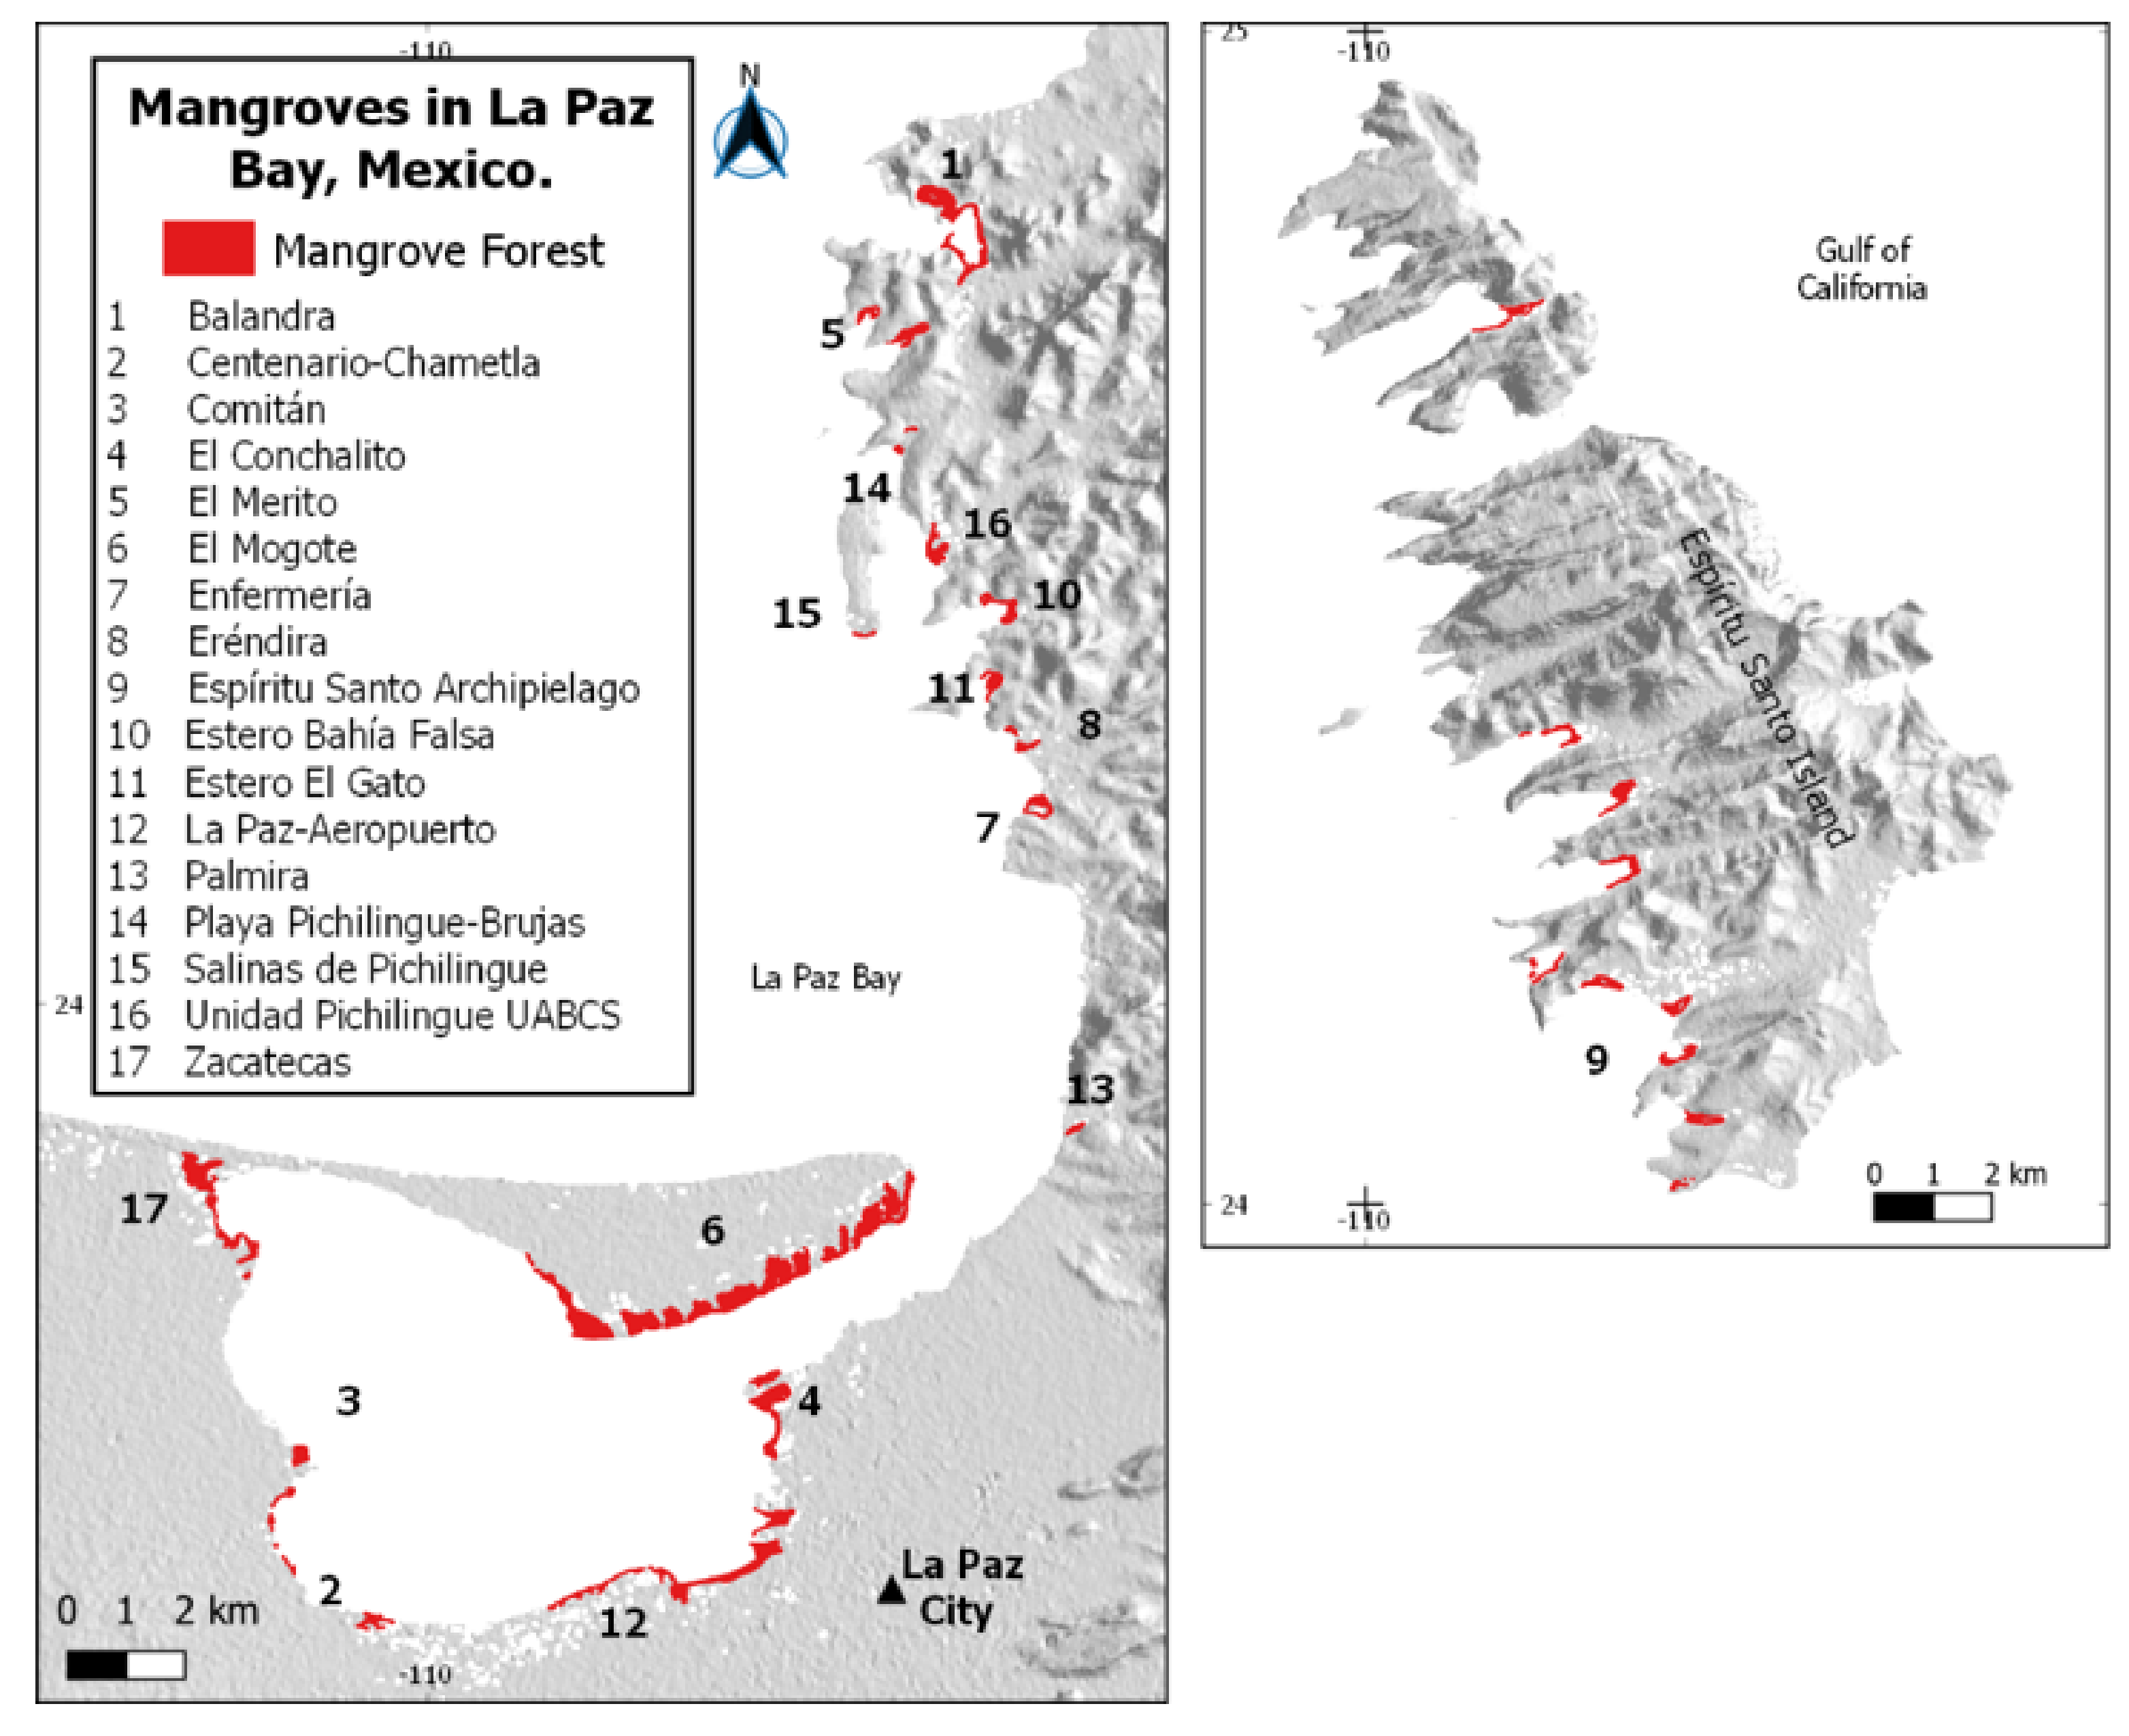
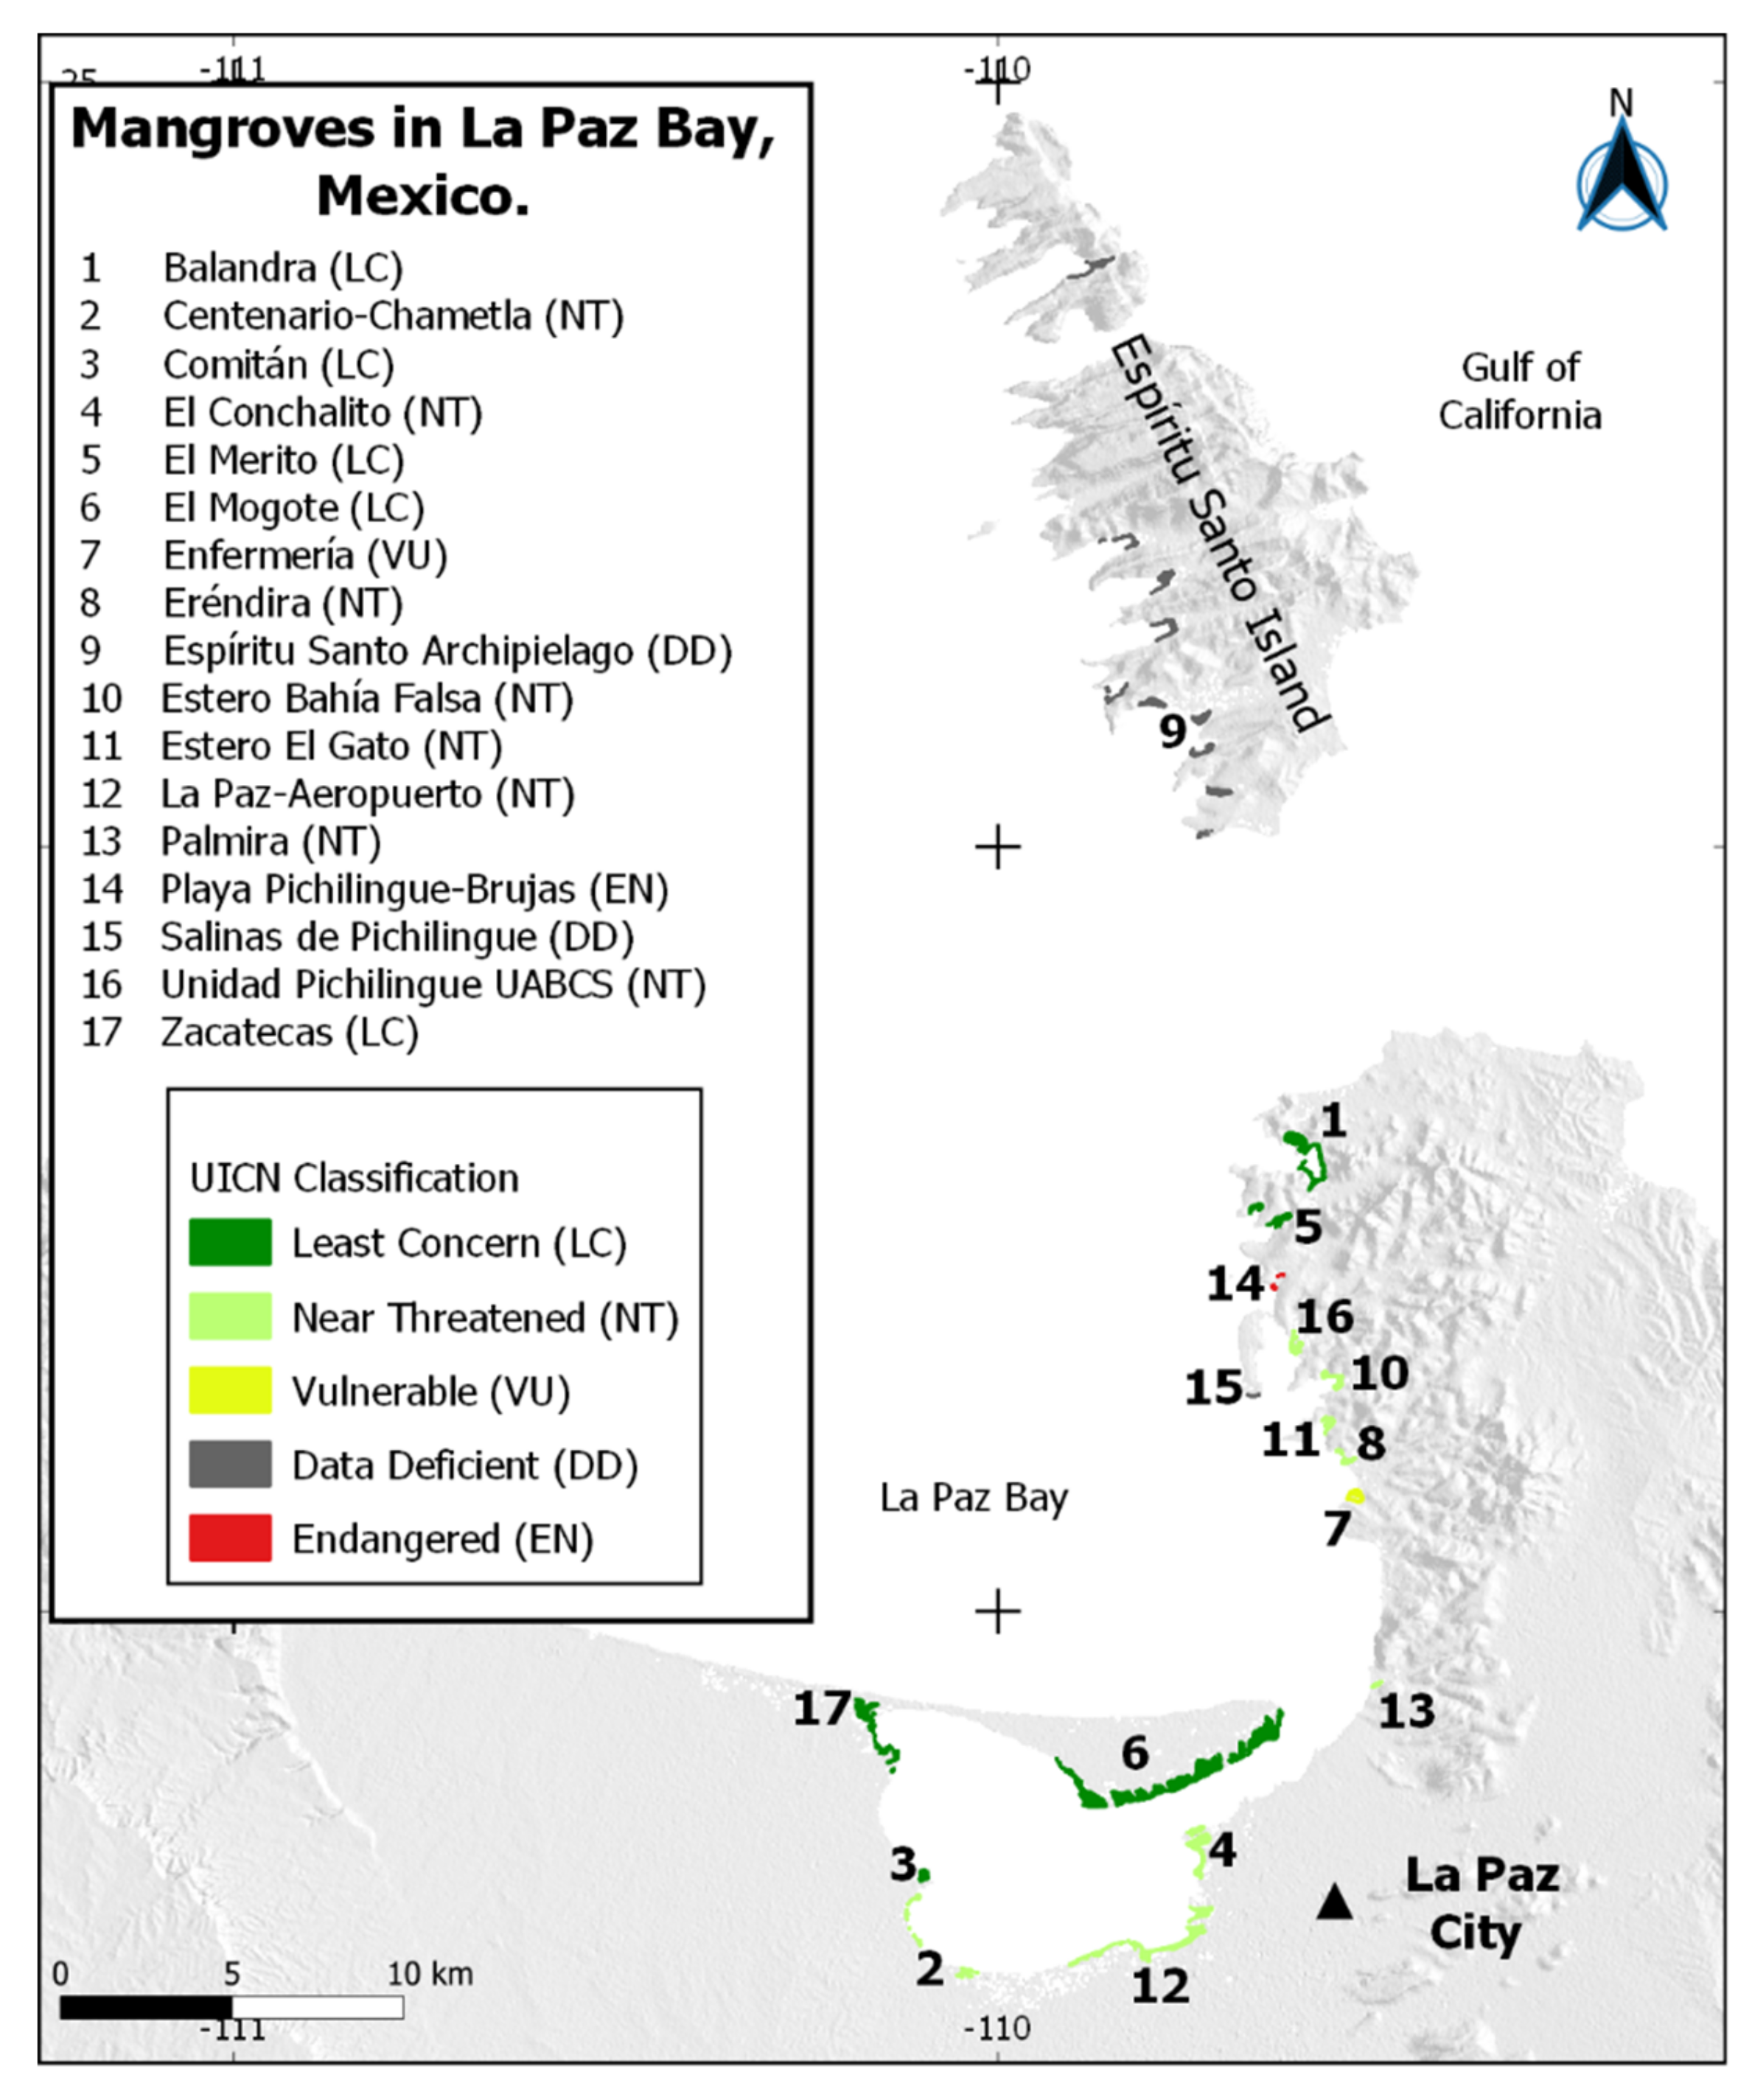
1.2. Study Area
2. Materials and Methods
2.1. Study Design
2.2. Index Development and AHP
2.3. Remaining Vegetation Index (RVI)
2.4. Delphi Method Survey
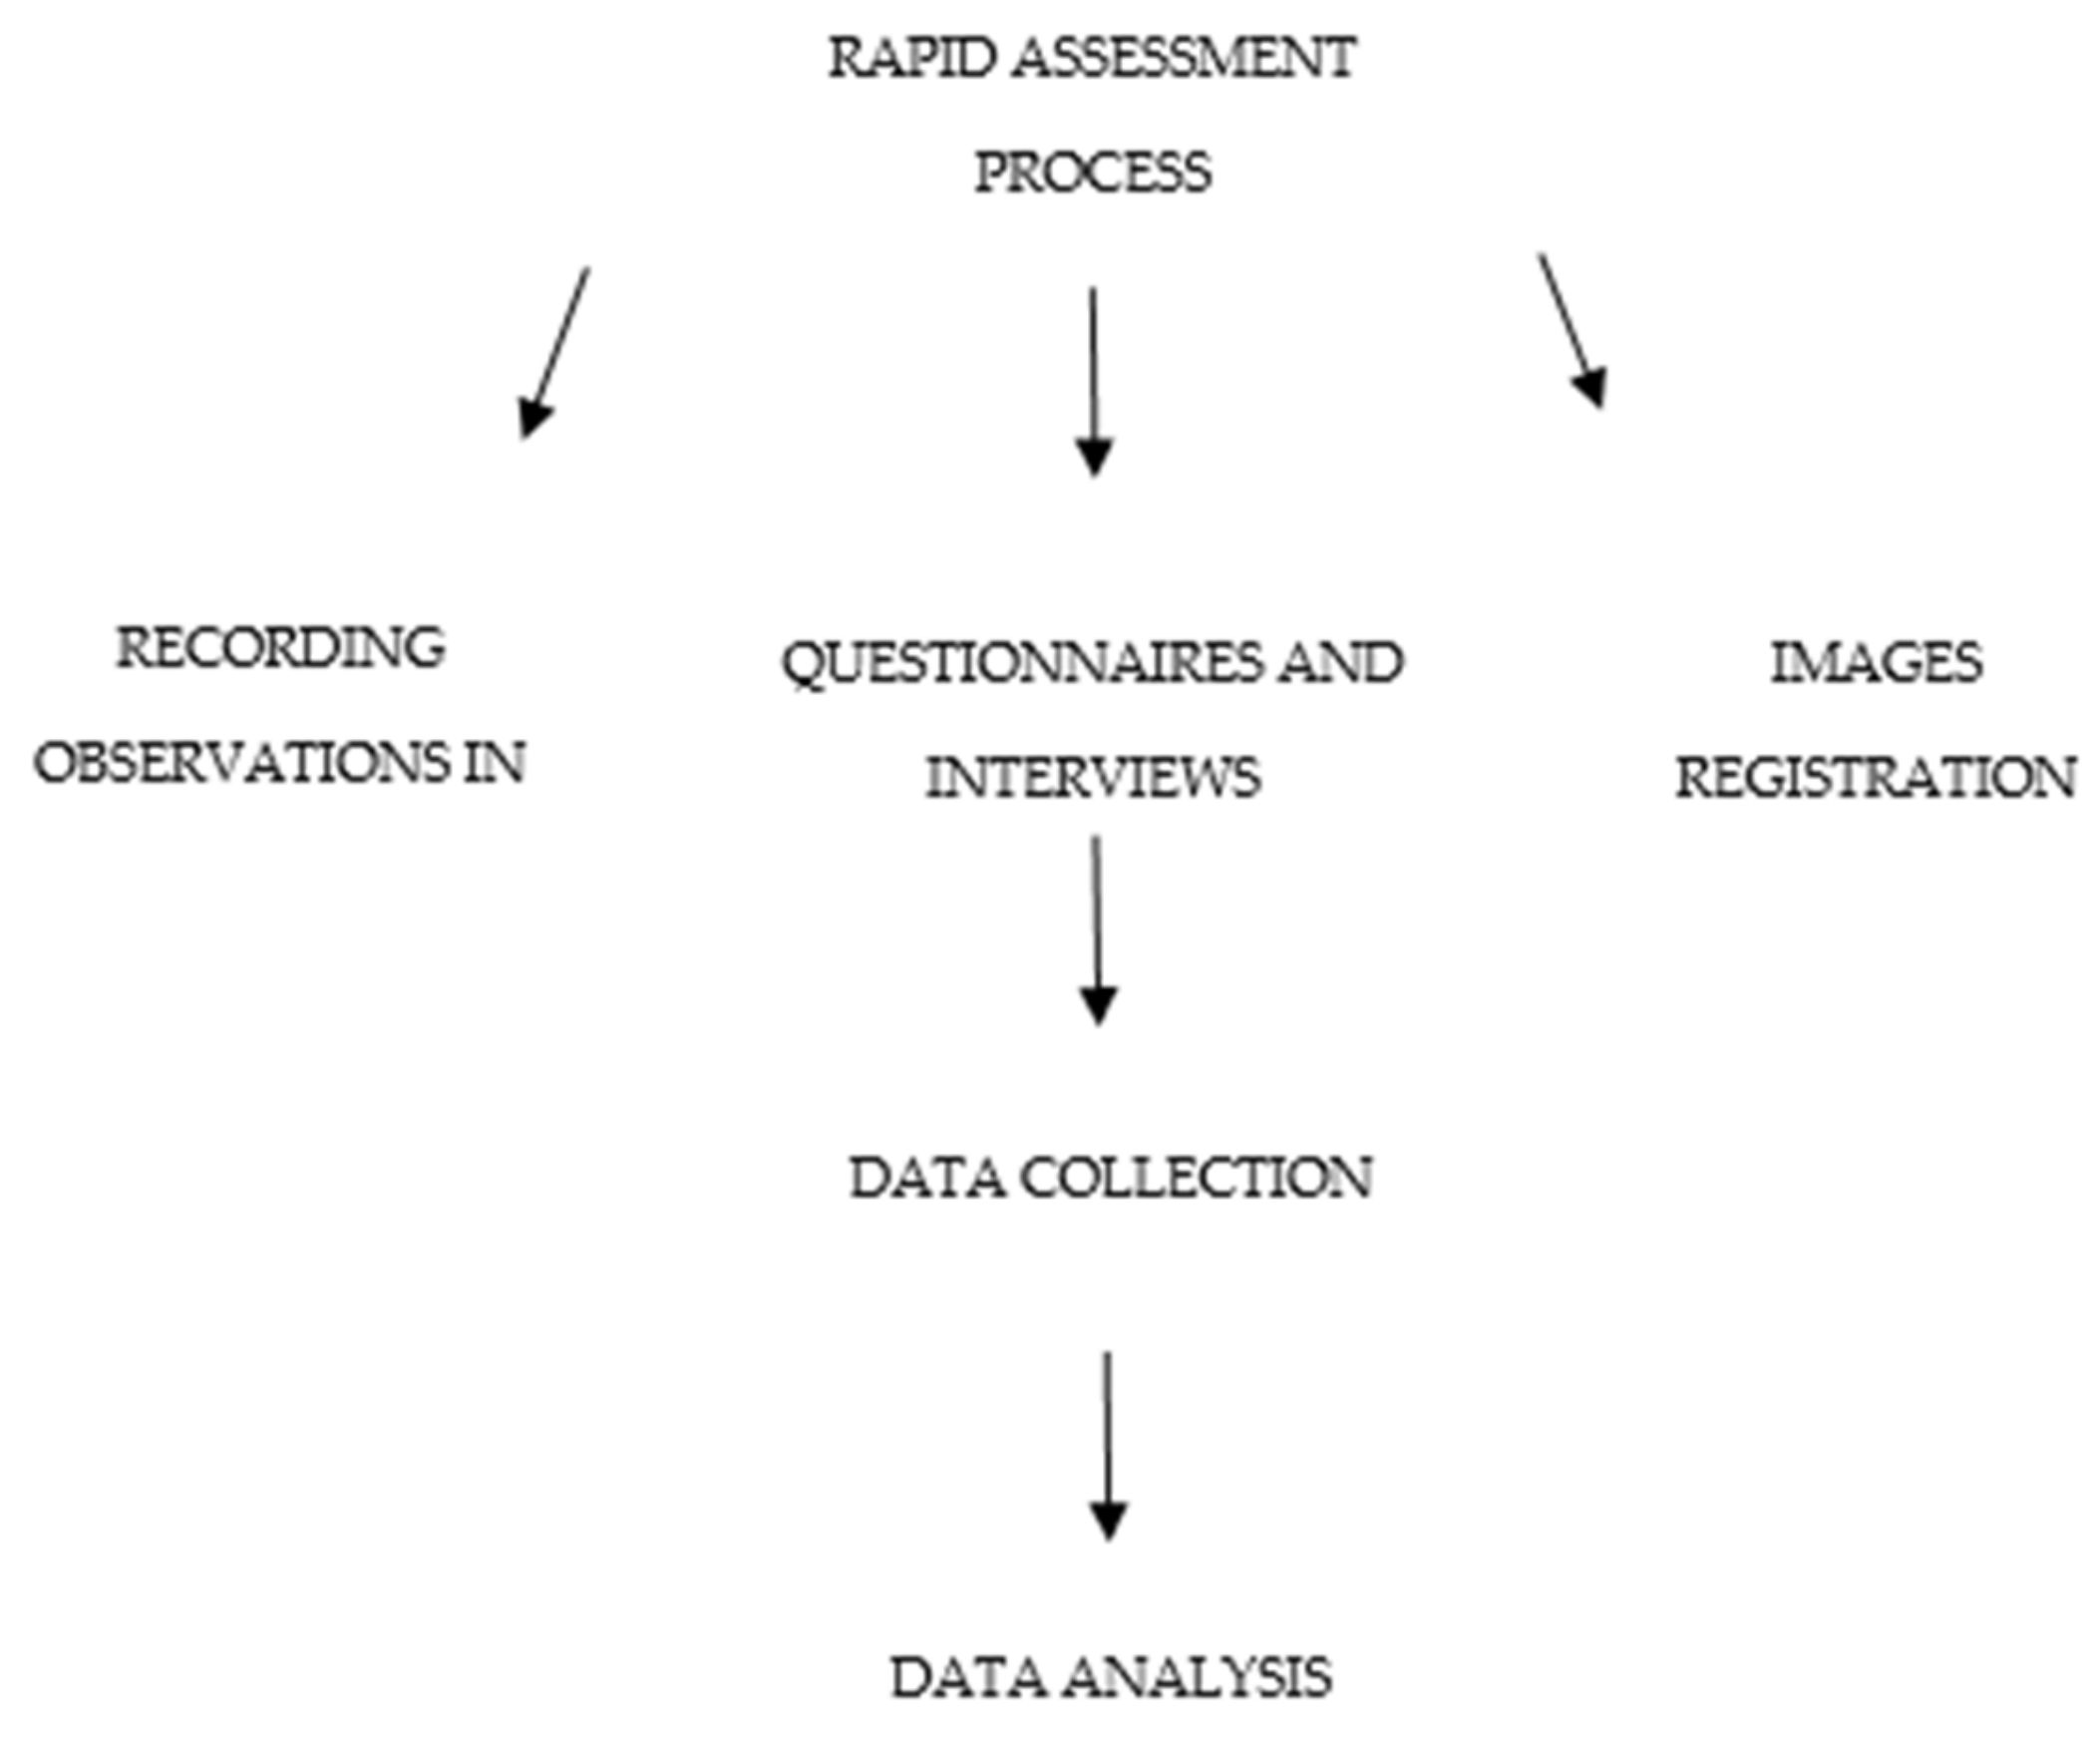
2.5. Rapid Assessment Questionnaire
2.6. Application of the Integrative Mangrove Conservation Status Index
3. Results
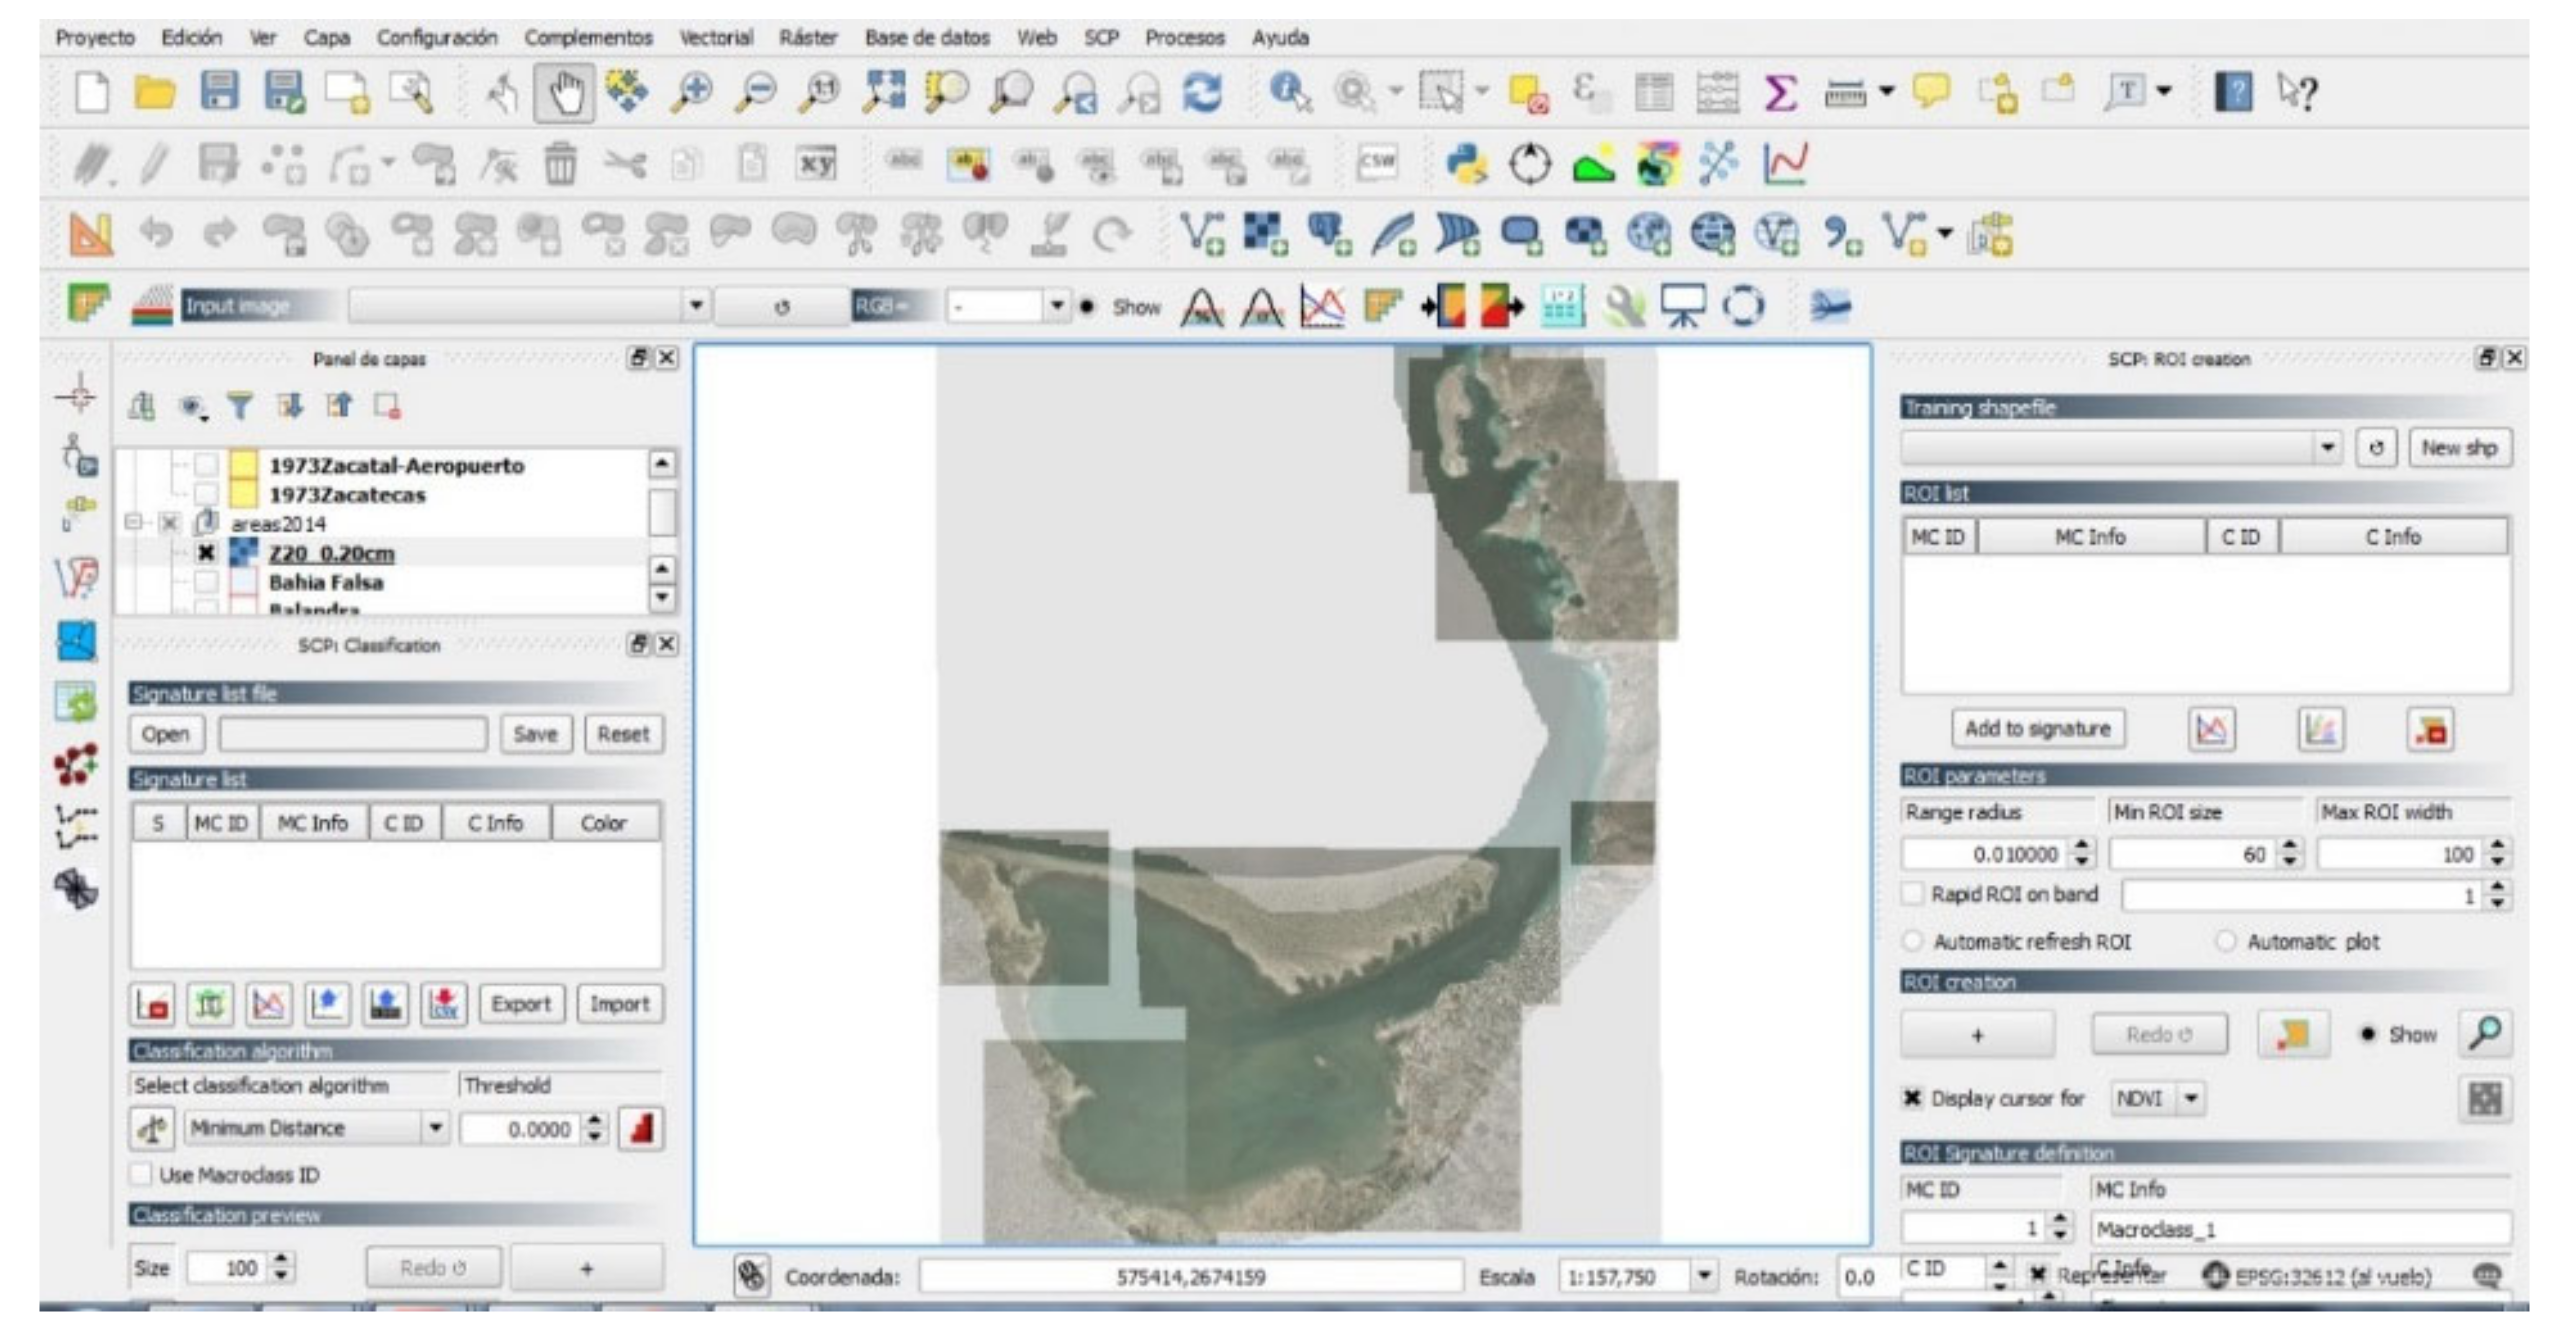
3.1. Spatial Analysis and Remaining Vegetation Index (RVI)
3.2. Delphi Method Survey
3.3. Rapid Assessment Questionnaire
3.4. Application of the Index
4. Discussion
5. Conclusions
Author Contributions
Funding
Acknowledgments
Conflicts of Interest
Appendix A

| Scale Values | Values Definition | Definition |
|---|---|---|
| 1 | Equal importance | An equal level of importance for both evaluation elements that are being compared |
| 3 | Somewhat more or weak importance | One element is slightly more important or relevant than the other |
| 5 | Much more or essential importance | One element is more important or essential than the other. |
| 7 | Very much or demonstrated importance | One element is much more important or relevant than the other |
| 9 | Extreme or absolute importance | One element is definitely more important than the other |
Appendix B
| 1. FIRST ROUND |
| 2. 🡇 |
| 3. PREPARE QUESTIONNAIRE |
| 4. 🡇 |
| 5. SELECT EXPERTS IN ORDER TO OBTAIN THEIR OPINION |
| 6. 🡇 |
| 7. INVITE THEM TO PARTICIPATE ON DELPHI |
| 8. 🡇 |
| 9. COLLECT ANSWERS, ANALYSE, AND PROVIDE FEEDBACK |
| 10. 🡇 |
| 11. SECOND ROUND |
| 12. 🡇 |
| 13. PREPARE AND SEND QUESTIONNAIRE |
| 14. 🡇 |
| 15. COLLECT ANSWERS, ANALYSE, AND PROVIDE FEEDBACK |
| 16. 🡇 |
| 17. REPEAT ROUNDS UNTIL CONSENSUS IS REACHED |
Appendix C

Appendix D
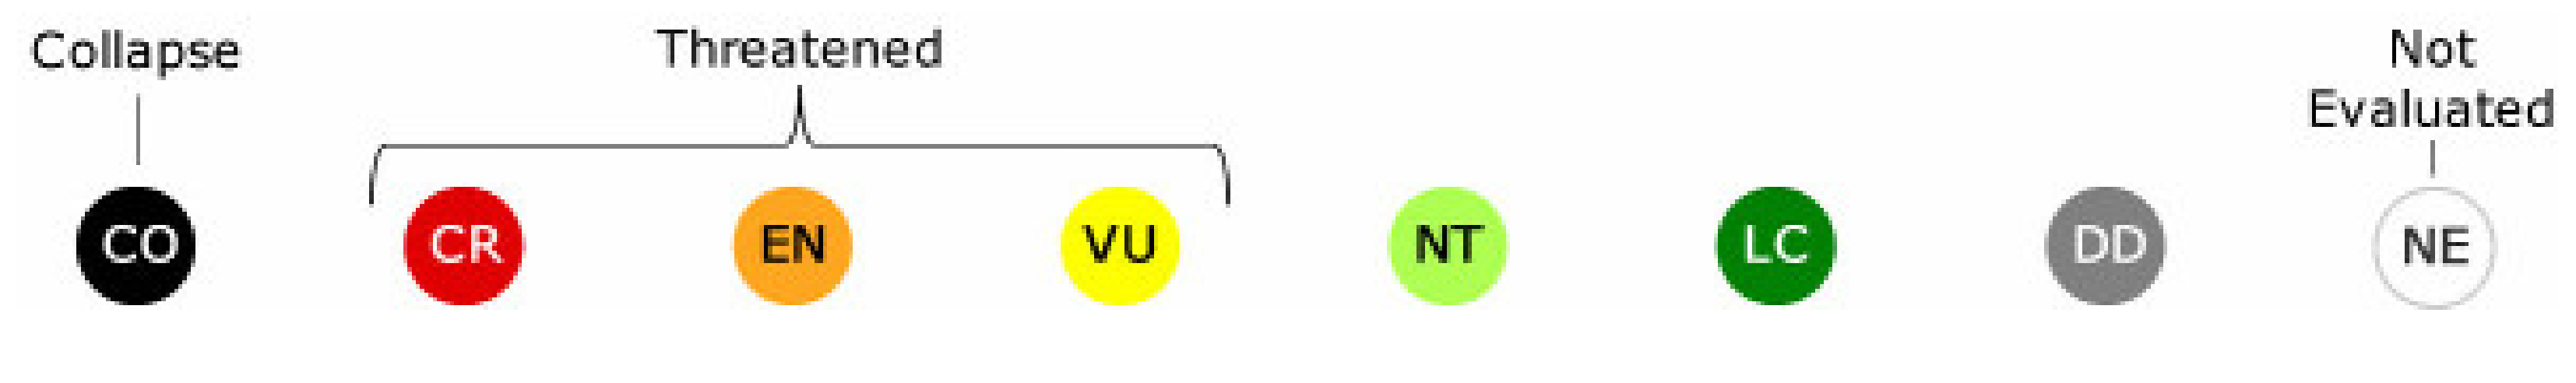
| IUCN Red List of Ecosystems | Score |
|---|---|
| Collapsed (CO) | 0 |
| Critically endangered (CR) | 01–20 |
| Endangered (EN) | 21–40 |
| Vulnerable (VU) | 41–60 |
| Near Threatened (NT) | 61–80 |
| Least Concern (LC) | 81–100 |
| Data Deficient (DD) | N/A |
| Not Evaluated (NE) | N/A |
- Collapsed (CO)
- Critically Endangered (CR)
- Endangered (EN)
- Vulnerable (VU)
- Near Threatened (NT)
- Least Concern (LC)
- Data Deficient (DD)
- Not Evaluated (NE)
References
- Spalding, M.D.; Kainuma, M.; Collins, L. World atlas of Mangroves; Earthscan: London, UK, 2010; pp. 24–25. [Google Scholar]
- Van Bochove, J.; Sullivan, E.; Nakamura, E. The Importance of Mangrove to People: A Call to Action; United Nations Environment Programme, World Conservation Monitoring Centre: Cambridge, UK, 2014; pp. 43–45. [Google Scholar]
- Vo, Q.T.; Kuenzer, C.; Vo, Q.M.; Moder, F.; Oppelt, N. Review of valuation methods for mangrove ecosystem services. Ecol. Indic. 2012, 23, 431–446. [Google Scholar] [CrossRef]
- Atkinson, S.C.; Jupiter, S.D.; Adams, V.M.; Ingram, J.C.; Narayan, S.; Klein, C.J.; Possingham, H.P. Prioritising mangrove ecosystem services results in spatially variable management priorities. PLoS ONE 2016, 11, e0151992. [Google Scholar] [CrossRef] [PubMed] [Green Version]
- Kadykalo, A.N.; López-Rodríguez, M.D.; Ainscough, J.; Droste, N.; Ryu, H.; Ávila-Flores, G.; Harmáčková, Z. Disentangling ‘ecosystem services’ and ‘nature’s contributions to people’. Ecosyst. People 2019, 15, 269–287. [Google Scholar] [CrossRef] [Green Version]
- Roldán, V.A.; Galván, D.E.; Lopes, P.F.; López, J.; Bellamy, A.S.; Gallego, F.; Barriga, A.M. Are we seeing the whole picture in land-sea systems? Opportunities and challenges for operationalizing the ES concept. Ecosyst. Serv. 2019, 38, 100966. [Google Scholar] [CrossRef]
- Sandilyan, S.; Kathiresan, K. Mangrove conservation: A global perspective. Biodivers. Conserv. 2012, 21, 3523–3542. [Google Scholar] [CrossRef]
- Romañach, S.S.; DeAngelis, D.L.; Koh, H.L.; Li, Y.; Teh, S.Y.; Barizan, R.S.R.; Zhai, L. Conservation and restoration of mangroves: Global status, perspectives, and prognosis. Ocean Coast. Manag. 2018, 154, 72–82. [Google Scholar] [CrossRef]
- Verdugo, F.F.; Casasola, P.M.; Hernández, C.M.A.; Rosas, H.L.; Pardo, D.B.; Bello, A.C.T. La topografía y el hidroperiodo: Dos factores que condicionan la restauración de los humedales costeros. Boletín Soc. Botánica México 2007, 80, 33–47. [Google Scholar]
- FAO. The World’s Mangroves 1980–2005; FAO Forestry Paper 153; FAO: Rome, Italy, 2007; p. 77. [Google Scholar]
- Duke, N.C.; Meynecke, J.O.; Dittmann, S.; Ellison, A.M.; Anger, K.; Berger, U.; Koedam, N. A world without mangroves? Science 2007, 317, 41–42. [Google Scholar] [CrossRef] [Green Version]
- Giri, C.; Ochieng, E.; Tieszen, L.L.; Zhu, Z.; Singh, A.; Loveland, T.; Duke, N. Status and distribution of mangrove forests of the world using earth observation satellite data. Glob. Ecol. Biogeogr. 2011, 20, 154–159. [Google Scholar] [CrossRef]
- Sitios de Manglar con Relevancia Biológica y Con Necesidades de Rehabilitación Ecológica. Available online: http://www.biodiversidad.gob.mx/ecosistemas/manglares2013/sitioPacNorte.html (accessed on 20 September 2019).
- Dávalos-Sotelo, R. El papel de la investigación científica en la creación de las áreas naturales protegidas. Madera y Bosques 2016, 22, 7–13. [Google Scholar] [CrossRef] [Green Version]
- Ávila-Flores, G.; Juárez-Mancilla, J.; Hinojosa-Arango, G.O.; Covarrubias, A. The Use of the DPSIR Framework to estimate Impacts of Urbanization on Mangroves: A Case Study from La Paz, Baja California Sur, Mexico. In WIT Transactions on Ecology and the Environment; Sustainable City XII; Brebbia, C.A., Sendra, J.J., Eds.; WIT Press: Southampton, UK, 2017; Volume 223, pp. 459–469. [Google Scholar]
- Places to Go in 2020. The New York Times. Available online: https://www.nytimes.com/interactive/2020/travel/places-to-visit.html (accessed on 11 January 2020).
- González-Baheza, A.; Arizpe, O. Vulnerability assessment for supporting sustainable coastal city development: A case study of La Paz, Mexico. Clim. Dev. 2018, 10, 552–565. [Google Scholar] [CrossRef]
- Márquez, G. Colombia: Ambiente, pobreza, violencia. Fermentum Rev. Venez. Sociol. Antropol. 2003, 13, 25–37. [Google Scholar]
- Chauvaud, S.; Bouchon, C.; Manieres, R. Remote sensing techniques adapted to high resolution mapping of tropical coastal marine ecosystems (coral reefs, seagrass beds and mangrove). Int. J. Remote Sens. 1998, 19, 3625–3639. [Google Scholar] [CrossRef]
- Benfield, S.L.; Guzman, H.M.; Mair, J.M. Temporal mangrove dynamics in relation to coastal development in Pacific Panama. J. Environ. Manag. 2005, 76, 263–276. [Google Scholar] [CrossRef] [PubMed]
- Fromard, F.; Vega, C.; Proisy, C. Half a century of dynamic coastal change affecting mangrove shorelines of French Guiana. A case study based on remote sensing data analyses and field surveys. Mar. Geol. 2004, 208, 265–280. [Google Scholar] [CrossRef]
- Murray, M.R.; Zisman, S.A.; Furley, P.A.; Munro, D.M.; Gibson, J.; Ratter, J.; Bridgewater, S.; Minty, C.D.; Place, C.J. The mangroves of Belize. Part 1. Distribution, composition and classification. For. Ecol. Manag. 2003, 174, 265–279. [Google Scholar] [CrossRef]
- Cissell, J.R.; Delgado, A.M.; Sweetman, B.M.; Steinberg, M.K. Monitoring mangrove forest dynamics in Campeche, Mexico, using Landsat satellite data. Remote Sens. Appl. 2018, 9, 60–68. [Google Scholar] [CrossRef]
- Okoli, C.; Pawlowski, S.D. The Delphi method as a research tool: An example, design considerations and applications. Inf. Manag. 2004, 42, 15–29. [Google Scholar] [CrossRef] [Green Version]
- Hasson, F.; Keeney, S.; McKenna, H. Research guidelines for the Delphi survey technique. J. Adv. Nurs. 2000, 32, 1008–1015. [Google Scholar]
- Kelly, C. Guidelines for Rapid Environmental Impact Assessment in Disasters; Benfield Hazard Research Centre, University of London: London, UK, 2005. [Google Scholar]
- Rodríguez, J.P.; Rodríguez-Clark, K.M.; Baillie, J.E.; Ash, N.; Benson, J.; Boucher, T.; Keith, D.A. Establishing IUCN red list criteria for threatened ecosystems. Conserv. Biol. 2011, 25, 21–29. [Google Scholar] [CrossRef] [Green Version]
- Kovacs, J.M.; Vandenberg, C.V.; Wang, J.; Flores-Verdugo, F. The use of multipolarized spaceborne SAR backscatter for monitoring the health of a degraded mangrove forest. J. Coast. Res. 2008, 24, 248–254. [Google Scholar] [CrossRef]
- Chellamani, P.; Singh, C.P.; Panigrahy, S. Assessment of the health status of Indian mangrove ecosystems using multi temporal remote sensing data. Trop. Ecol. 2014, 55, 245–253. [Google Scholar]
- Faridah-Hanum, I.; Yusoff, F.M.; Fitrianto, A.; Ainuddin, N.A.; Gandaseca, S.; Zaiton, S.; Shamsuddin, I. Development of a comprehensive mangrove quality index (MQI) in Matang Mangrove: Assessing mangrove ecosystem health. Ecol. Indic. 2019, 102, 103–117. [Google Scholar] [CrossRef]
- Wątróbski, J.; Ziemba, E.; Karczmarczyk, A.; Jankowski, J. An index to measure the sustainable information society: The Polish households case. Sustainability 2018, 10, 3223. [Google Scholar] [CrossRef] [Green Version]
- Chowdhury, A.; Maiti, S.K. Assessing the ecological health risk in a conserved mangrove ecosystem due to heavy metal pollution: A case study from Sundarbans Biosphere Reserve, India. Hum. Ecol. Risk Assess. 2016, 22, 1519–1541. [Google Scholar] [CrossRef]
- Aguirre-Rubí, J.R.; Ortiz-Zarragoitia, M.; Izagirre, U.; Etxebarria, N.; Espinoza, F.; Marigómez, I. Prospective biomonitor and sentinel bivalve species for pollution monitoring and ecosystem health disturbance assessment in mangrove–lined Nicaraguan coasts. Sci. Total Environ. 2019, 649, 186–200. [Google Scholar] [CrossRef] [PubMed]
- Ávila-Flores, G.; Riosmena-Rodríguez, R. Integrated environmental assessment and scenarios of mangrove community in the Gulf of California case study ‘Manglar Enfermería’. In The Arid Mangrove Forest from Baja California Peninsula 2; Nova Publishers: New York, NY, USA, 2016; Volume 2, pp. 131–150. [Google Scholar]
- Flores-de-Santiago, F.; Kovacs, J.M.; Flores-Verdugo, F. Discrimination of 3 dominant mangrove species from the Pacific coast of Mexico by spectroscopy on intact leaves. Cienc. Mar. 2018, 44, 185–202. [Google Scholar] [CrossRef] [Green Version]
- Pham, T.D.; Yokoya, N.; Bui, D.T.; Yoshino, K.; Friess, D.A. Remote sensing approaches for monitoring mangrove species, structure, and biomass: Opportunities and challenges. Remote Sens. 2019, 11, 230. [Google Scholar] [CrossRef] [Green Version]
- Wątróbski, J.; Jankowski, J.; Ziemba, P.; Karczmarczyk, A.; Zioło, M. Generalised framework for multi-criteria method selection. Omega 2019, 86, 107–124. [Google Scholar] [CrossRef]
- López-Portillo, J.; Lewis, R.R.; Saenger, P.; Rovai, A.; Koedam, N.; Dahdouh-Guebas, F.; Rivera-Monroy, V.H. Mangrove forest restoration and rehabilitation. In Mangrove Ecosystems: A Global Biogeographic Perspective; Springer: Cham, Germany, 2017; pp. 301–345. [Google Scholar]
- Reyes, M.A.; Tovilla, C. Restauración de áreas alteradas de manglar con Rhizophora mangle en la Costa de Chiapas. Madera Bosques 2002, 8, 103–114. [Google Scholar] [CrossRef]
- Avila-Flores, G. Diagnosis of the conservation status of mangroves in the city of La Paz. Master’s Thesis, Baja California Sur, Mexico, February 2016. [Google Scholar]
- Curnick, D.; Pettorelli, N.; Amir, A.; Balke, T.; Barbier, E.; Crooks, S.; Quarto, A. The value of small mangrove patches. Science 2019, 363, 239. [Google Scholar] [PubMed] [Green Version]
- Wind, Y.; Saaty, T.L. Marketing applications of the analytic hierarchy process. Manag. Sci. 1980, 26, 641–658. [Google Scholar] [CrossRef]
- Hsu, C.C.; Sandford, B.A. The Delphi technique: Making sense of consensus. Pract. Assess. Res. Eval. 2007, 12, 1–8. [Google Scholar]
- Gordon, T.J. The Delphi method. Futures Res. Methodol. 1994, 2, 1–30. [Google Scholar]
- Mukherjee, N.; Huge, J.; Sutherland, W.J.; McNeill, J.; Van Opstal, M.; Dahdouh-Guebas, F.; Koedam, N. The Delphi technique in ecology and biological conservation: Applications and guidelines. Methods Ecol. Evol. 2015, 6, 1097–1109. [Google Scholar] [CrossRef] [Green Version]
- Renzi, A.B.; Freitas, S. The Delphi method for future scenarios construction. Procedia Manuf. 2015, 3, 5785–5791. [Google Scholar] [CrossRef] [Green Version]
- Beebe, J. Basic Concepts and Techniques of Rapid Appraisal; Human organization: New York, NY, USA, 1995; pp. 2–51. [Google Scholar]
- Beebe, J. Rapid Assessment Process: An Introduction; AltaMira Press: Lanham, MD, USA, 2001. [Google Scholar]
- Hjortsø, C.N.; Christensen, S.M.; Tarp, P. Rapid stakeholder and conflict assessment for natural resource management using cognitive mapping: The case of Damdoi Forest Enterprise, Vietnam. Agric. Hum. Values 2005, 22, 149–167. [Google Scholar] [CrossRef]
- Pedersen, D.; Scrimshaw, N.S.; Gleason, G.R. Rapid Assessment Procedures: Qualitative Methodologies for Planning and Evaluation of Health Related Programmes; INFDC: Boston, MA, USA, 1992. [Google Scholar]
- Keith, D.A.; Rodríguez, J.P.; Brooks, T.M.; Burgman, M.A.; Barrow, E.G.; Bland, L.; Miller, R.M. The IUCN red list of ecosystems: Motivations, challenges, and applications. Conserv. Lett. 2015, 8, 214–226. [Google Scholar] [CrossRef] [Green Version]
- IUCN. Red List of Ecosystems Web. Available online: https://iucnrle.org/ (accessed on 25 October 2019).


| Criteria | Sub-Criteria | Number of Comparisons | Total | Weight | ||
|---|---|---|---|---|---|---|
| 1 | 2 | 3 | ||||
| MCSI | (1) Remnant Vegetation Index | 5 | 5 | 10 | 0.62 | |
| (2) Delphi Method Survey. | 1 | 3 | 4 | 0.25 | ||
| (3) Rapid Assessment Questionnaire. | 1 | 1 | 2 | 0.13 | ||
| Mangrove Community | Original Vegetation Area (m2) | Present Vegetation Area (m2) | Remaining Vegetation Index (Scores) |
|---|---|---|---|
| Balandra | 266,044.01 | 268,577.08 | 100.95 |
| Centenario-Chametla | 54,213.98 | 53,657.47 | 98.97 |
| Comitán | 43,982.36 | 42,448.27 | 96.51 |
| El Conchalito | 217,785.87 | 192,957.92 | 88.59 |
| El Merito | 81,397.13 | 81,373.77 | 99.97 |
| El Mogote | 1,247,826.06 | 1,254,511.24 | 100.53 |
| Enfermería | 56,953.15 | 37,968.09 | 66.66 |
| Eréndira | 23,627.20 | 23,969.85 | 101.45 |
| Espíritu Santo Archipelago | - | 523,773. 69 | N/A |
| Estero Bahía Falsa | 47,744.44 | 44,573.39 | 93.35 |
| Estero El Gato | 47,916.84 | 45,429.86 | 94.80 |
| La Paz-Aeropuerto | 160,633.55 | 360,491.36 | 224.41 |
| Palmira | 14,172.06 | 12,154.07 | 85.76 |
| Playa Pichilingue-Brujas | 11,210.63 | 3,025.02 | 26.98 |
| Salinas de Pichilingue | - | 2,971.47 | N/A |
| Unidad Pichilingue UABCS | 63,284.70 | 50,329.61 | 79.52 |
| Zacatecas | 227,058.89 | 259,119.05 | 114.11 |
| Based on your experience, what is the conservation status of the mangroves of the bay of La Paz? | ||
|---|---|---|
| Mangrove Communities | Conservation Status | I Don’t know. |
| Balandra | Bad 1 2 3 4 5 Good | |
| Mangrove Community | Expert Opinion 1 | Expert Opinion 2 | Expert Opinion 3 | Expert Opinion 4 | Expert Opinion 5 | Expert Opinion 6 | Expert Opinion 7 | Median |
|---|---|---|---|---|---|---|---|---|
| Balandra | 4 | 3 | 4 | 4 | 5 | 4 | 4 | 4 |
| Centenario-Chametla | 2 | 2 | 3 | 2 | 4 | 2 | 2 | 2 |
| Comitán | 2 | 4 | 4 | 4 | 3 | 3 | 4 | 4 |
| El Conchalito | 3 | 2 | 3 | 3 | 4 | 2 | 3 | 3 |
| El Merito | 5 | - | 5 | 5 | 4 | 5 | 5 | 5 |
| El Mogote | 3 | 3 | 4 | 4 | 4 | 4 | 4 | 4 |
| Enfermería | 1 | - | 2 | 2 | 3 | 3 | 2 | 2 |
| Eréndira | 2 | 2 | 2 | 2 | 1 | 4 | 2 | 2 |
| Espíritu Santo Archipelago | 5 | - | 5 | 5 | 3 | - | 5 | 5 |
| Estero Bahía Falsa | 3 | 3 | 3 | 2 | 3 | 3 | 3 | 3 |
| Estero El Gato | 4 | 3 | 3 | 4 | - | 3 | 4 | 3 |
| La Paz- Aeropuerto | 4 | 3 | 4 | 3 | 5 | 4 | 4 | 4 |
| Palmira | 4 | 2 | 2 | 2 | 3 | 2 | 2 | 2 |
| Playa Pichilingue-Brujas | 2 | 2 | 1 | 1 | 4 | 2 | 2 | 2 |
| Salinas de Pichilingue | - | - | 3 | 3 | - | - | - | - |
| Unidad Pichilingue UABCS | 2 | 3 | 3 | 3 | 4 | 3 | 3 | 3 |
| Zacatecas | 4 | - | 5 | 4 | 4 | 4 | 5 | 4 |
| Mangrove Community | Rapid Assessment Questionnaires |
|---|---|
| Balandra | 0.4944 |
| Centenario-Chametla | 0.6542 |
| Comitán | 0.2662 |
| El Conchalito | 0.5680 |
| El Merito | 0.3184 |
| El Mogote | 0.4486 |
| Enfermería | 0.5896 |
| Eréndira | 0.7260 |
| Espíritu Santo Archipelago | 0.2662 |
| Estero Bahía Falsa | 0.6382 |
| Estero El Gato | 0.5604 |
| La Paz-Aeropuerto | 0.8178 |
| Palmira | 0.8858 |
| Playa Pichilingue-Brujas | 0.8960 |
| Salinas de Pichilingue | 0.2884 |
| Unidad Pichilingue UABCS | 0.6504 |
| Zacatecas | 0.4026 |
| Mangrove Community | RVI Score | DM Score | RA Score | MCSI | IUCN Red List of Ecosystems |
|---|---|---|---|---|---|
| Balandra | 57 | 23.2 | 7.0784 | 87.2784 | Least Concern (LC) |
| Centenario-Chametla | 57 | 11.6 | 4.8412 | 73.4412 | Near Threatened (NT) |
| Comitán | 57 | 17.4 | 10.2732 | 84.6732 | Least Concern (LC) |
| Espíritu Santo Archipelago | - | 29 | 10.2732 | - | Data Deficient (DD) |
| El Conchalito | 54.6231 | 17.4 | 6.048 | 78.0711 | Near Threatened (NT) |
| El Merito | 57 | 29 | 9.5424 | 95.5424 | Least Concern (LC) |
| El Mogote | 57 | 23.2 | 7.7196 | 87.9196 | Least Concern (LC) |
| Enfermería | 41.8836 | 11.6 | 5.7456 | 59.2292 | Vulnerable (VU) |
| Eréndira | 57 | 11.6 | 3.836 | 72.436 | Near Threatened (NT) |
| Estero Bahía Falsa | 57 | 17.4 | 5.0652 | 79.4652 | Near Threatened (NT) |
| Estero El Gato | 57 | 17.4 | 6.1544 | 80.5544 | Near Threatened (NT) |
| La Paz-Aeropuerto | 57 | 17.4 | 2.5508 | 76.9508 | Near Threatened (NT) |
| Palmira | 53.8593 | 11.6 | 1.5988 | 67.0581 | Near Threatened (NT) |
| Playa Pichilingue-Brujas | 16.9575 | 11.6 | 1.456 | 30.0135 | Endangered (EN) |
| Salinas de Pichilingue | - | - | 9.9624 | - | Data Deficient (DD) |
| Pichilingue UABCS | 45.5316 | 17.4 | 4.8944 | 67.826 | Near Threatened (NT) |
| Zacatecas | 57 | 23.2 | 8.3636 | 88.5636 | Least Concern (LC) |
© 2020 by the authors. Licensee MDPI, Basel, Switzerland. This article is an open access article distributed under the terms and conditions of the Creative Commons Attribution (CC BY) license (http://creativecommons.org/licenses/by/4.0/).
Share and Cite
Ávila-Flores, G.; Juárez-Mancilla, J.; Hinojosa-Arango, G.; Cruz-Chávez, P.; López-Vivas, J.M.; Arizpe-Covarrubias, O. A Practical Index to Estimate Mangrove Conservation Status: The Forests from La Paz Bay, Mexico as a Case Study. Sustainability 2020, 12, 858. https://doi.org/10.3390/su12030858
Ávila-Flores G, Juárez-Mancilla J, Hinojosa-Arango G, Cruz-Chávez P, López-Vivas JM, Arizpe-Covarrubias O. A Practical Index to Estimate Mangrove Conservation Status: The Forests from La Paz Bay, Mexico as a Case Study. Sustainability. 2020; 12(3):858. https://doi.org/10.3390/su12030858
Chicago/Turabian StyleÁvila-Flores, Giovanni, Judith Juárez-Mancilla, Gustavo Hinojosa-Arango, Plácido Cruz-Chávez, Juan Manuel López-Vivas, and Oscar Arizpe-Covarrubias. 2020. "A Practical Index to Estimate Mangrove Conservation Status: The Forests from La Paz Bay, Mexico as a Case Study" Sustainability 12, no. 3: 858. https://doi.org/10.3390/su12030858