Article

Influential Factors on Injury Severity for Drivers of Light Trucks and Vans with Machine Learning Methods

by
Giovanny Pillajo-Quijia
1,*,
Blanca Arenas-Ramírez
1,
Camino González-Fernández
2 and
Francisco Aparicio-Izquierdo
1
1
University Institute of Automobile Research Francisco Aparicio Izquierdo (INSIA), Universidad Politécnica de Madrid (UPM), 28031 Madrid, Spain
2
Statistical Laboratory, Escuela Técnica Superior de Ingenieros Industriales, Universidad Politécnica de Madrid, 28006 Madrid, Spain
*
Author to whom correspondence should be addressed.
Sustainability 2020, 12(4), 1324; https://doi.org/10.3390/su12041324
Submission received: 31 December 2019 / Revised: 30 January 2020 / Accepted: 7 February 2020 / Published: 12 February 2020
(This article belongs to the Special Issue Sustainability in Transportation and the Built Environment)

Abstract

:
The study of road accidents and the adoption of measures to reduce them is one of the most important targets of the Sustainable Development Goals for 2030. To further progress in the improvement of road safety, it is necessary to focus studies on specific groups, such as light trucks and vans. Since 2013 in Spain, there has been an upturn in accidents in these two categories of vehicles and a renewed interest to deepen our understanding of the causes that encourage this behavior. This paper focuses on using machine learning methods to explain driver-injury severity in run-off-roadway and rollover types of accidents. A Random Forest (RF)-classification tree (CART) approach is used to select the relevant categorical variables (driver, vehicle, infrastructure, and environmental factors) to obtain models that classify, explain, and predict the severity of such accidents with good accuracy. A support vector machine and binomial logit models were applied in order to contrast the variable importance ranking and the performance analysis, and the results are convergent with the RF+CART approach (more than 70% accuracy). The resulting models highlight the importance of using safety belts, as well as psychophysical conditions (alcohol, drugs, or sleep deprivation) and injury localization for the two accident types.

Graphical Abstract

1. Introduction

Reducing road traffic injuries is one of the targets of the 17 Goals that were established by all United Nations member states in 2015 as part of the 2030 Agenda for Sustainable Development [1]. Goal 3, target 3.6 (Good health and Well-Being) states that by 2020, the number of deaths and injuries caused by traffic accidents worldwide [1,2] should be reduced by half. In 2018, the World Health Organization (WHO) indicated that, worldwide, each year more than 1.35 million people lose their lives due to traffic accidents, 20 to 50 million suffer injuries [3], and traffic accidents remain one of the leading causes of death for children and young adults [4]. The significant reduction in Spain between the years 2001 and 2018, decreasing from 135 to 39 deaths (the target is fewer than 37 by 2020) per million inhabitants, ranks it among the seven top safest countries in the European Union. This information was issued by the Directorate General of Traffic (DGT) of Spain and the WHO [5,6].
Constant technological revolution, the continuous growth of goods logistics and passenger transport, as well as growing access restrictions for industrial vehicles entering city centers, especially due to current pollution and traffic problems in big cities [7,8], have highlighted Light Trucks and vans (LTVs) as basic working tools. This suggests increased mobility and thus greater exposure to the risk of accidents. Therefore, the extended use of light vehicles (those under 3500 kg as their maximum authorized mass) and their own exploitation characteristics, such as loads or people transport, driver qualifications, risky driver behavior, and work related to commuting, as well as the different types of vehicles grouped under LTVs, are some of the concerns in the field of transport. These facts contribute to the European low emission mobility strategy [9] and reveal the interest in acquiring greater knowledge of the relationship between these factors and accidents.
LTVs represent 14% of the vehicle fleet in Spain, the second widest category after passenger cars. As shown in Figure 1, accidents involving LTVs, which increased by 2% in 2008 and by 5% in 2018, taking 2000 as the starting year. Furthermore, the fatality rate of LTV/TOTAL reached 15% in 2018, and the last 10 years have represented a decrease of around 50% in the number of deaths. It is important to note that there has been an upturn in the number of LTV casualty accidents (index Nº) since 2013 (exceeding the value of the year 2000) and in LTV fatality rates (increasing by 2%) from 2013 to 2018 [5]. Considering these increases, there has been a rising and renewed interest to deepen our understanding of the causes that encourage this behavior.
While the analysis of accidents and victims of LTVs is important, the research on driver-injury severity is interesting when considering the accidents with a single LTV involved and where the driver-injury is more severe. The driver, as an LTV operator, plays an important role in determining an injury’s severity outcome. This work analyzes the driver severity (the variable target) for the categorical predictor variables in accidents of the Rollover (RO) and Run-Off-Roadway (ROR) types with LTV involvement. The LTV designation applies to four groups of light vehicles, whose maximum authorized mass is <3500 kg. These vehicles include G1 Pick-up, G2 Chassis-cabin truck, G3 Van and combi, and G4 Passenger car-derived vehicles. This classification was defined in the Furgoseg Project [10,11] (see the definition in references [12,13]).
The initial database provided by DGT includes more than 100 variables, which gather information about each accident regarding its occurrence, the injured parties in the accident, and the environment. Due to the large number of categorical variable candidates for statistical treatment, selection using expert knowledge, treatment levels, and classes and pre-selection for the final models was held to turn this problem into a treatable one and further apply the classification models.
The Random Forest (RF) model [14], implemented through the CARET package (Classification and REgression Training), was applied to identify the relevant variables that influence injury severity. The Binomial Logit Model (BLM) and Support Vector Machine (SVM) models are used to contrast the ranking of importance of variables. Then, Classification and Regression Trees (CARTs) [15] were developed based on their explanatory and descriptive power. The CARET package was used as a common interface to integrate the relevant functions in order to estimate and to compare the performance of these four models: RF, CART, BLM, and SVM. These statistical tools were implemented in the free software R [16].
The final objective is to determine the important variables that are highly related to driver severity and provide a good prediction, as well as an interpretation, of the problem and to contribute to reducing accident rates or mitigating their consequences. Through this approach, the number of variables is reduced, and the ones that provide information of interest are selected with a statistical tool in order to determine the underlying relationships between the data and severity behavior.
This paper is organized into six sections: The first two sections deal with the Introduction and state-of-the-art, followed by the Materials and Methods, Results, and, finally, the Discussion and Conclusion.

2. Literature Review

Two aspects have been considered for the bibliographic review of accidents involving LTVs: the traffic driver-injury severity and the methodologies applied. For the accident severity analysis, there are two works to start with, both related to the review on the literature about statistical methods used for severity and its evolution [17,18]. In these two wide fields, traditional and non-traditional statistical methods are analyzed considering accident severity, and the ones of interest for this work with LTVs are described. Regarding the first type, there are regression model studies with bi-variable responses using the Binary Logit Model (BLM) [19], Logistic regression methods (LRM) [20], or the Ordered Probit Model (OPM) [21]. Other authors have developed Multinomial Logit Models (MLMs) [22,23,24,25] and Dynamic Macroeconomic models [13]. Among the non-traditional methods with two or multiple answer variables, there are the Artificial Neuronal Network (ANN) [26] and Classification And Regression Trees (CARTs) [27,28]. Similarly, other advanced tools have been combined, such as Machine Learning (ML) methods, including Conditional Inference Trees and Forest [29], Decision Trees (DT) and Decision rules (DR) [30,31,32], Random Forest (RF) and Boosted Regression Trees (BRTs) [33], RF and OPM models [34], CART (as a variable selection model) and Support Vector Machine (SVM) (as a predictive model) [35], RF for variable selection and ANN for prediction [36], and comparison ML methods and performance studies [37,38].
In detail, Toy and Hammitt [19] analyzed the risk of injury (two levels: serious injury or death) for a driver in two-vehicle crashes (sport utility vehicles (SUVs), vans, pickup trucks, and cars), using an accident sample in the United States through the application of LRM, with the main independent variables being the body type of each vehicle, the driver’s age, gender, and restraint used, and the configuration of the crash. The authors concluded that the SUV, pickups, and vans appeared to be more aggressive (i.e., posed a risk to others) and may be more crashworthy (self-protection) than cars. Using the odds ratio, they highlighted that pickup drivers themselves present a lower risk of severe injuries than car drivers. In a crash, driver injury severity is higher when the opponent vehicle is a pickup, rather than a car, due to vehicle characteristics like mass, stiffness, and geometry, as well as other influential factors.
Kononen et al. [20] developed Logit models to predict the probability of an accident where at least one or more of the passengers receives serious or incapacitating injuries (with an Injury Severity Score (ISS) of greater than or equal to 15). The parameters used were: changes in speed Delta-V (mph), type of vehicle (car, pickup truck, van, or sports utility), crashes with one involved vehicle (without overturns) vs. crashes with several vehicles (multiple collisions), impact direction (front/back/side), and the use of a seat belt for safety. The sample was taken from the database NASS-CDS from the United States for new vehicles (models from the year 2000 onwards). The most important factors in severity prediction were Delta-V (mph), safety belt use, and impact direction.
Zhu and Sirnivasan [21] applied OPM to study the influential explanatory variables in injury severity (three levels: killed/fatal, incapacitating injury, and non-incapacitating injury) of large-truck crashes, such as collision type (rollover, angle, sideswipe, rear end, head-on, multi-impact, others), the type of the involved vehicles (a large truck or light vehicles (car, van, pickup)), and the driver’s characteristics (age, distraction, seat belt use, vision, alcohol use). The results show that the most severe injuries are related to the truck driver’s distractions, alcohol use, and the car driver’s emotional factors (such as being in a hurry and being upset or clinically depressed). The type of vehicle is also a statistically significant factor. Vans are involved in more severe crashes than cars. When a crash involves a truck, a higher number of deaths is caused among the passengers of the cars or vans.
Khorashadi et al. [22] developed MLMs to investigate the factors that can have a significant influence on driver-injury severity categories (four levels: no injury, complaint of pain, visible injury, and severe/fatal injury) in accidents that involve large trucks and occur in rural and urban zones of California. The study analyzes collisions (rear end, broadside, other types) with single or multiple vehicles (the opponent vehicle: trailer, tractor, passenger cars). The results show that there are several factors that have an influence in the severity of the driver´s injuries: vehicle (type, occupancy, number of vehicles involved), environment (road lighting, rain, fog, and snow), road geometry (number of lanes, concrete median barrier), and traffic characteristics (travel time, stop and go, collision type and location).
Ulfarsson and Mannering [23] investigated injury severity (four levels: no injury, possible injury, evident injury, and fatal/disabling injury) and the differences according to the driver’s gender in accidents between one or two light vehicles (such as passenger cars, pickups, SUVs, and minivans) and with different types of accidents (overturned/rollover, run-off-roadway, struck an object, and others) by applying MLM. The study sample contains twenty-two thousand records of accidents in the state of Washington. Their results show significant differences in injury severity by gender, even in the same type of accident. The authors concluded that more studies, like naturalistic studies, are needed to better understand their results. They further suggested that risk compensation could be present in the case of certain vehicle types like LTVs because they could offer a self-protection driver perception. For both genders, the probability of high injury severity increases when the seat belt is not used.
In Spain, the national project of van accidents Furgoseg [10] carried out several research and development activities on the methods and tools used for statistical analysis, testing and experimentation, simulation, and calculation in the framework of “Integrated Accident Investigation Methodology (MIICA)” [11]. A time series analysis was done by Dadashova et al. [13] to study the frequency and severity of van accidents: a linear regression with variables transformed from Box-Cox and their autoregressive errors (DRAG, Demand for Road use, Accidents and their Gravity), as well as the Unobserved Components Model (UCM). With these macroeconomic models, factors related to the fleet, drivers, exposure variables, economic factors, as well as legislative actions were evaluated as influential on the outcomes selected. For higher injury severity in accidents, the most significant variables were the driver behavior surveillance, economic factors, and road infrastructure categories.
Behnood and Manering [24] studied the effects of passengers on driver-injury severity in single-vehicle crashes by using a random parameters logit model (LM) in order to obtain the differences in three crash scenarios: with one, two, or three occupants (driver included) alongside several variables for the environment, roadway and vehicle characteristics, and driver attributes. The results show that a passenger(s) age and gender are both influential factors, confirming the complexity of the interactions that must be researched.
Li et al. [25] studied driver injury severity in single-vehicle collisions with road characteristics in rural areas (straight and curved locations, slopes, signals, and lane numbers) and risky driver behavior due to alcohol and drug consumption and the non-use of seatbelts. The severity is higher if both conditions are present at the moment of the crash. The models selected were MLM and the Latent Classes Model (LCM).
Regarding non-traditional methodologies, Delen et al. [26] applied an ANN to model the relationships between the levels of severity (four levels: no injury, possible injury, non-incapacitating injury, and fatality) and the causal factors related to accidents that occurred in the United States. The factors considered were: type of vehicle (passenger cars, SUV, vans, and pickup/light trucks), crash type (single vehicle (rollover) or multiple vehicle crashes (striking/struck, front/back/side crash, rear-end, head-on), environmental information, and personal information. The non-use of a seat belt, being under the influence of alcohol and drugs, as well as the age and gender of the passenger and the types of their vehicles were influential factors in accidents. Among their conclusions, the authors noted that no factor alone is a key determinant, but a combination of them (such as the use seat belts, use of alcohol or drugs, a person’s age and gender, and vehicle role) could be a key determinant.
Chang and Wang [27] used reports of the National Traffic Accident Research of Taiwan for 2001 and applied CART to investigate the level of injury severity (three levels: fatality, injury, and no-injury), considering, among other risk factors, the following data: collision type (pedestrian-vehicle, head-on, sideswipe, rear-end, fixed object), driver, involved vehicle (car, pickup, large truck, bus, motorcycle, bicycle, and pedestrian), road types, and weather conditions. The authors concluded that the type of vehicle is the most critical factor to determine accident driver-injury severity. The authors included motorized vehicles and vulnerable users under the name “vehicle type”, and the tree split them into two branches. Pedestrians, motorcyclists, and cyclists are the most vulnerable when they are struck by motorized vehicles due to the severity level shown in the right branch of the tree. Chang and Chien [28] developed models based on CART to establish the relationships between driver severity (three levels: fatality, injury, no-injury) in accidents with trucks involved (weight >10,000 lb) in Taiwan. The study included variables related to driver, road, environmental conditions, contrary vehicle types (passenger cars, tractor-trailer, light trucks), type of collision (head-on, sideswipe, rear-end, overturn, collision with guardrail), and the accident characteristics (time, location). Among the most determinant variables that increase driver severity are driving under the effects of alcohol, the non-use of a seatbelt, and other light trucks as the contrary vehicle and head-on collision types.
Das et al. [29] studied severity (two levels: incapacitating injuries/fatalities and possible/non-incapacitating injuries) in different types of accidents (rear-end, head-on, sideswipe, single vehicle crashes) in urban arterial roads in Florida, using CART algorithms with Conditional Inference–Forest. The objective was to identify the influence of traffic, road type, vehicle, and driver variables. Automobiles, light trucks, heavy vehicles, and light slow-moving vehicles were analyzed. Among the most important variables that worsen accident severity are: alcohol and drug use, speed limit, the non-use of a seatbelt, and the driver/passenger belonging to age groups >55 or <3 years old. The application of DT carried out by Abellán et al. [30] using Information Root Node Variation (IRNV), and using CART, ID3, and C4.5 by De Oña et al. [31], have allowed researchers to extract useful decision rules to be used by road safety analysts in Granada (Spain). DTs allow the classification of accidents according to the severity of the crash (two levels): accidents with slightly injured (SI) occupants and accidents with killed or seriously injured (KSI) occupants. In the study, variables such as weather, road, and driver information, accident type (ROR, RO, fixed object collision (CO), or collision with pedestrian (CP)), and vehicle type, such as cars, trucks, motorbikes and others, were considered.
Zhou et al. [32] adjusted the CART models to Real-Time Ridesharing Vehicles to study the effects of several factors on crash severity. The 2018 crash data come from monthly Chicago police reports. The original data were resampled because the imbalance was strong (the most severe crashes were only 60 out of 2624 crashes), and the authors confirmed that the prediction results improved. Moreover, the model performance indicators, such as the ROC area and G-mean, were better. Several variables from these interesting crash data were identified as influential indicators for crash severity, such as actors involved (pedestrian, cyclist, or number of passengers, as well as both driver age and gender), traffic and environmental characteristics (traffic direction, traffic control device, weather and lighting conditions, and crash time), and vehicle features (manufacturing year and vehicle type).
Models based on RF and BRT were applied by Lee and Li [33] to predict driver severity (two levels: severe and non-severe) in accidents with one or two vehicles involved in Canada. The analyzed vehicles included cars, heavy-trucks, and light trucks. Accident, driver, environment, vehicle, infrastructure, and traffic characteristics were also considered. Ejection from a vehicle and head-on collisions were highlighted due to their high severity results. There are differences between heavy truck drivers and the rest of the drivers: severity risk increases with daily traffic, and the percentage of trucks increases with the age of the driver.
Wu and Xu [34] analyzed the driver behavior contributions to collisions in the United States on rural roads (two-lane and two-way roads) using the RF model. Data on contributing factors, such road features, environment, risk of crash from Naturalistic Driving (NDS), were studied by probit models. The authors concluded that curbs increase risky behavior, and driving errors are overrepresented among young drivers.
Chen et al. [35] investigated the severity patterns of drivers involved in light and heavy truck overturns in the U.S., using CART models to select the most significant factors (driver, crash-level, and vehicle-level), and, using SVM, they evaluated the variables´ influence on severity (in three levels: no injury, non-incapacitating injury, and incapacitating injury/fatality). Driving conditions, alcohol and drug use, and seatbelt use are associated with severe and fatal injuries.
Zhu et al. [36] investigated driver injury patterns (four levels: fatal/serious injury, evident injury, possible injury, and no injury) in ROR crashes with multi-class classification, based on an ML analysis (RF and binary ANN models), with records collected in Washington State from 2011 to 2013. Among the exploratory variables, the following were included: time variables, environment, vehicles (passenger car, pickup, truck, and others), and demographic variables. The results show that in fatal accidents or under severe injury, the main concurrent factors are lack of restraint, being female, truck usage, driver impairment, driver distraction, rollover accident type, overtaking maneuvers, and dawn/dusk conditions.
Mafi et al. [37] studied driver injuries in two passenger car collisions in signalized intersections in Miami, Florida, with driver, environmental, roadway, and vehicle characteristics, as well as crash identification variables. Within the data mining models selected, RF was superior to C4.5 and IB when studying prediction capability and cost. Between them, very important differences were observed regarding driver severity by age and gender.
Theofilatos et al. [38] compared the real-time predictive power of Machine Learning (ML) versus Deep Learning (DL) models, considering k-nearest neighbor, Naive Bayes, DT, RF, SVM, shallow neural network, and deep neural network models. The performance metrics used were Accuracy, Sensitivity, Specificity, and Area Under Curve (AUC), and the DL models were superior to those belonging to the ML field. The authors noted the good performance of the Naive Bayes model due to its minor complexity compared with other models.
As far as the authors know, there are extensive studies with parametric and non-parametric methods focused on the severity of drivers. However, no studies have been found that consider the classification of the vehicles defined within the same class. This type of classification specifically considers differences in mechanical characteristics. In this work, four types of LTVs were taken into account. This identification allows us to analyze the influence of these LTVs on the severity of the driver’s injuries in the two types of modeled accidents.

3. Materials and Methods

3.1. Data Description

A sample of 21,000 accidents with victims and LTVs was obtained from the Traffic Accident database (ADB) of the DGT over a period of nine years (2000–2008). These ADB databases containing environmental, accident type, occupant, and vehicle information were merged into the database of vehicle registrations (VRDB) in order to obtain a database with the characteristics of LTVs involved in traffic accidents, as well the latter corresponding data (DB LTVs). The LTV vehicles were classified into four groups considering their gross vehicle weight, tare weight (The weight of an empty car or other vehicle without cargo. Tare weight can also be called unladen weight.), engine cylinder capacity, and others features. The definitions of vehicle classification are presented in [12,13].
The sample selection process is shown in Figure 2. A preliminary filter-cleaning process was applied to the casualty accident database (ADB) in order to obtain only crashes with one LTV-driver involved with ≈14,690 cases (1LTV-ADB). In the second stage, the 1LTV-ADB was merged with the VRDB, producing DB LTVs, with 9052 records, where the accidents were identified by collision type (RO and ROR), along with the characteristics of the four LTV types. The remaining records (5638), up to 14,690, correspond to pedestrian accidents.
Driver injury severity, as the response variable, was re-coded into two levels: fatality and injury/incapacitation, labelled as DKSI: Driver Killed and Seriously Injured, and non-incapacitating injury and no injury as DSI: Driver Slightly Injured. These criteria were based on an analysis of the distributions of the samples of the four original driver-injury classes, among which there is an important imbalance of data (there are few dead drivers compared to the number of minor or unharmed drivers). As other authors point out [27,31,39], it is more efficient to work with balanced data, which is the approach that has been adopted in this work.
To identify the key variables that affect driver severity, 42 variables (primary data in DB LTVs) were analyzed by correlation analysis, as well as descriptive statistics and an RF methodology. These variables were grouped into four factors: (1) driver characteristics, (2) vehicle characteristics, (3) infrastructure, and (4) environmental conditions; some variables were re-coded, and the number of categories was reduced. For example, the condition of vehicle (CONDICLTV), original categories such as damaged/not damaged/unknown related to tires, brakes, lights, etc. were re-coded as with defect (WD), without defects (WOD), and unknown (UKN), respectively. PSYCHOP categories, such as the use of alcohol, drugs, or sleep deprivation, were recoded into WD, otherwise known as WOD or UKN, respectively. The numeric variables like the driver’s AGE variable, were recoded as categorical and segmented into <25 years, 25–35, 36–60, and >60 year groups.
The 25 selected variables are shown in Table 1, including the variable name, the category code, and the injury severity distribution (in count and percentage). The relative values add up to 100% horizontally. For example, the SEATBELT variable represents the use or non-use of a safety belt by the driver. In the sample, there are 1313 drivers (19%) who used a seatbelt at the moment of the accident and died or were severely injured, while drivers in 5537 cases (slightly over than 80%) were mildly injured or unharmed. From 1290 drivers, 46% who did not use a safety belt received severe lesions. These numbers are illustrative of its effect in severity reduction.
Table 1 highlights that the age of the involved drivers is more frequently related to the category of 36–60 years old (3580 drivers). However, more severe injuries are experienced by drivers older than 60 years (DKSI 28.44%). Regarding injury location (BODYINJURY variable), injury occurs more frequently in the upper body area (2724 cases), with higher severity present in the lower limbs (42.33%). Regarding LTV types, groups G3 and G4 present higher frequencies, although group G1 shows higher severity (30.26%). Regarding the AGELTV categorical variable, higher frequencies correspond to LTV <2 years old. However, the category with a slightly higher injury rate is reserved for those older than 10 years. Regarding the road function variable (ROADFUN), accidents with a higher frequency occur in rural areas and are more severe (27.68%) in the category where the road width is less than 3.25 m.
Regarding the time of the accident (HOUR variable), the accidents with higher frequency correspond to the category (07:00 to 18:00). However, the other two categories present a higher severity (27.56% and 25.35%). According to the SEASON variable, the summer season presents a higher number of accidents (2607 cases). The ACCTYPE variable collects a count of the two most severe types of accidents for the driver: Rollover (RO) and Run-Off-Roadway (ROR)—3445 and 5607 cases, respectively, with DKSI the most frequent type and ROR with greater severity.

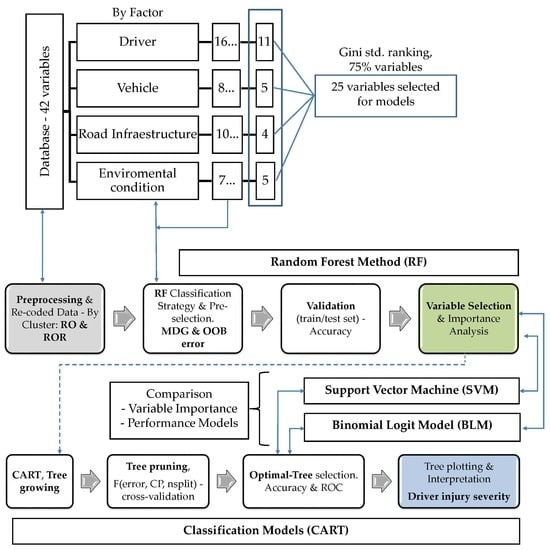
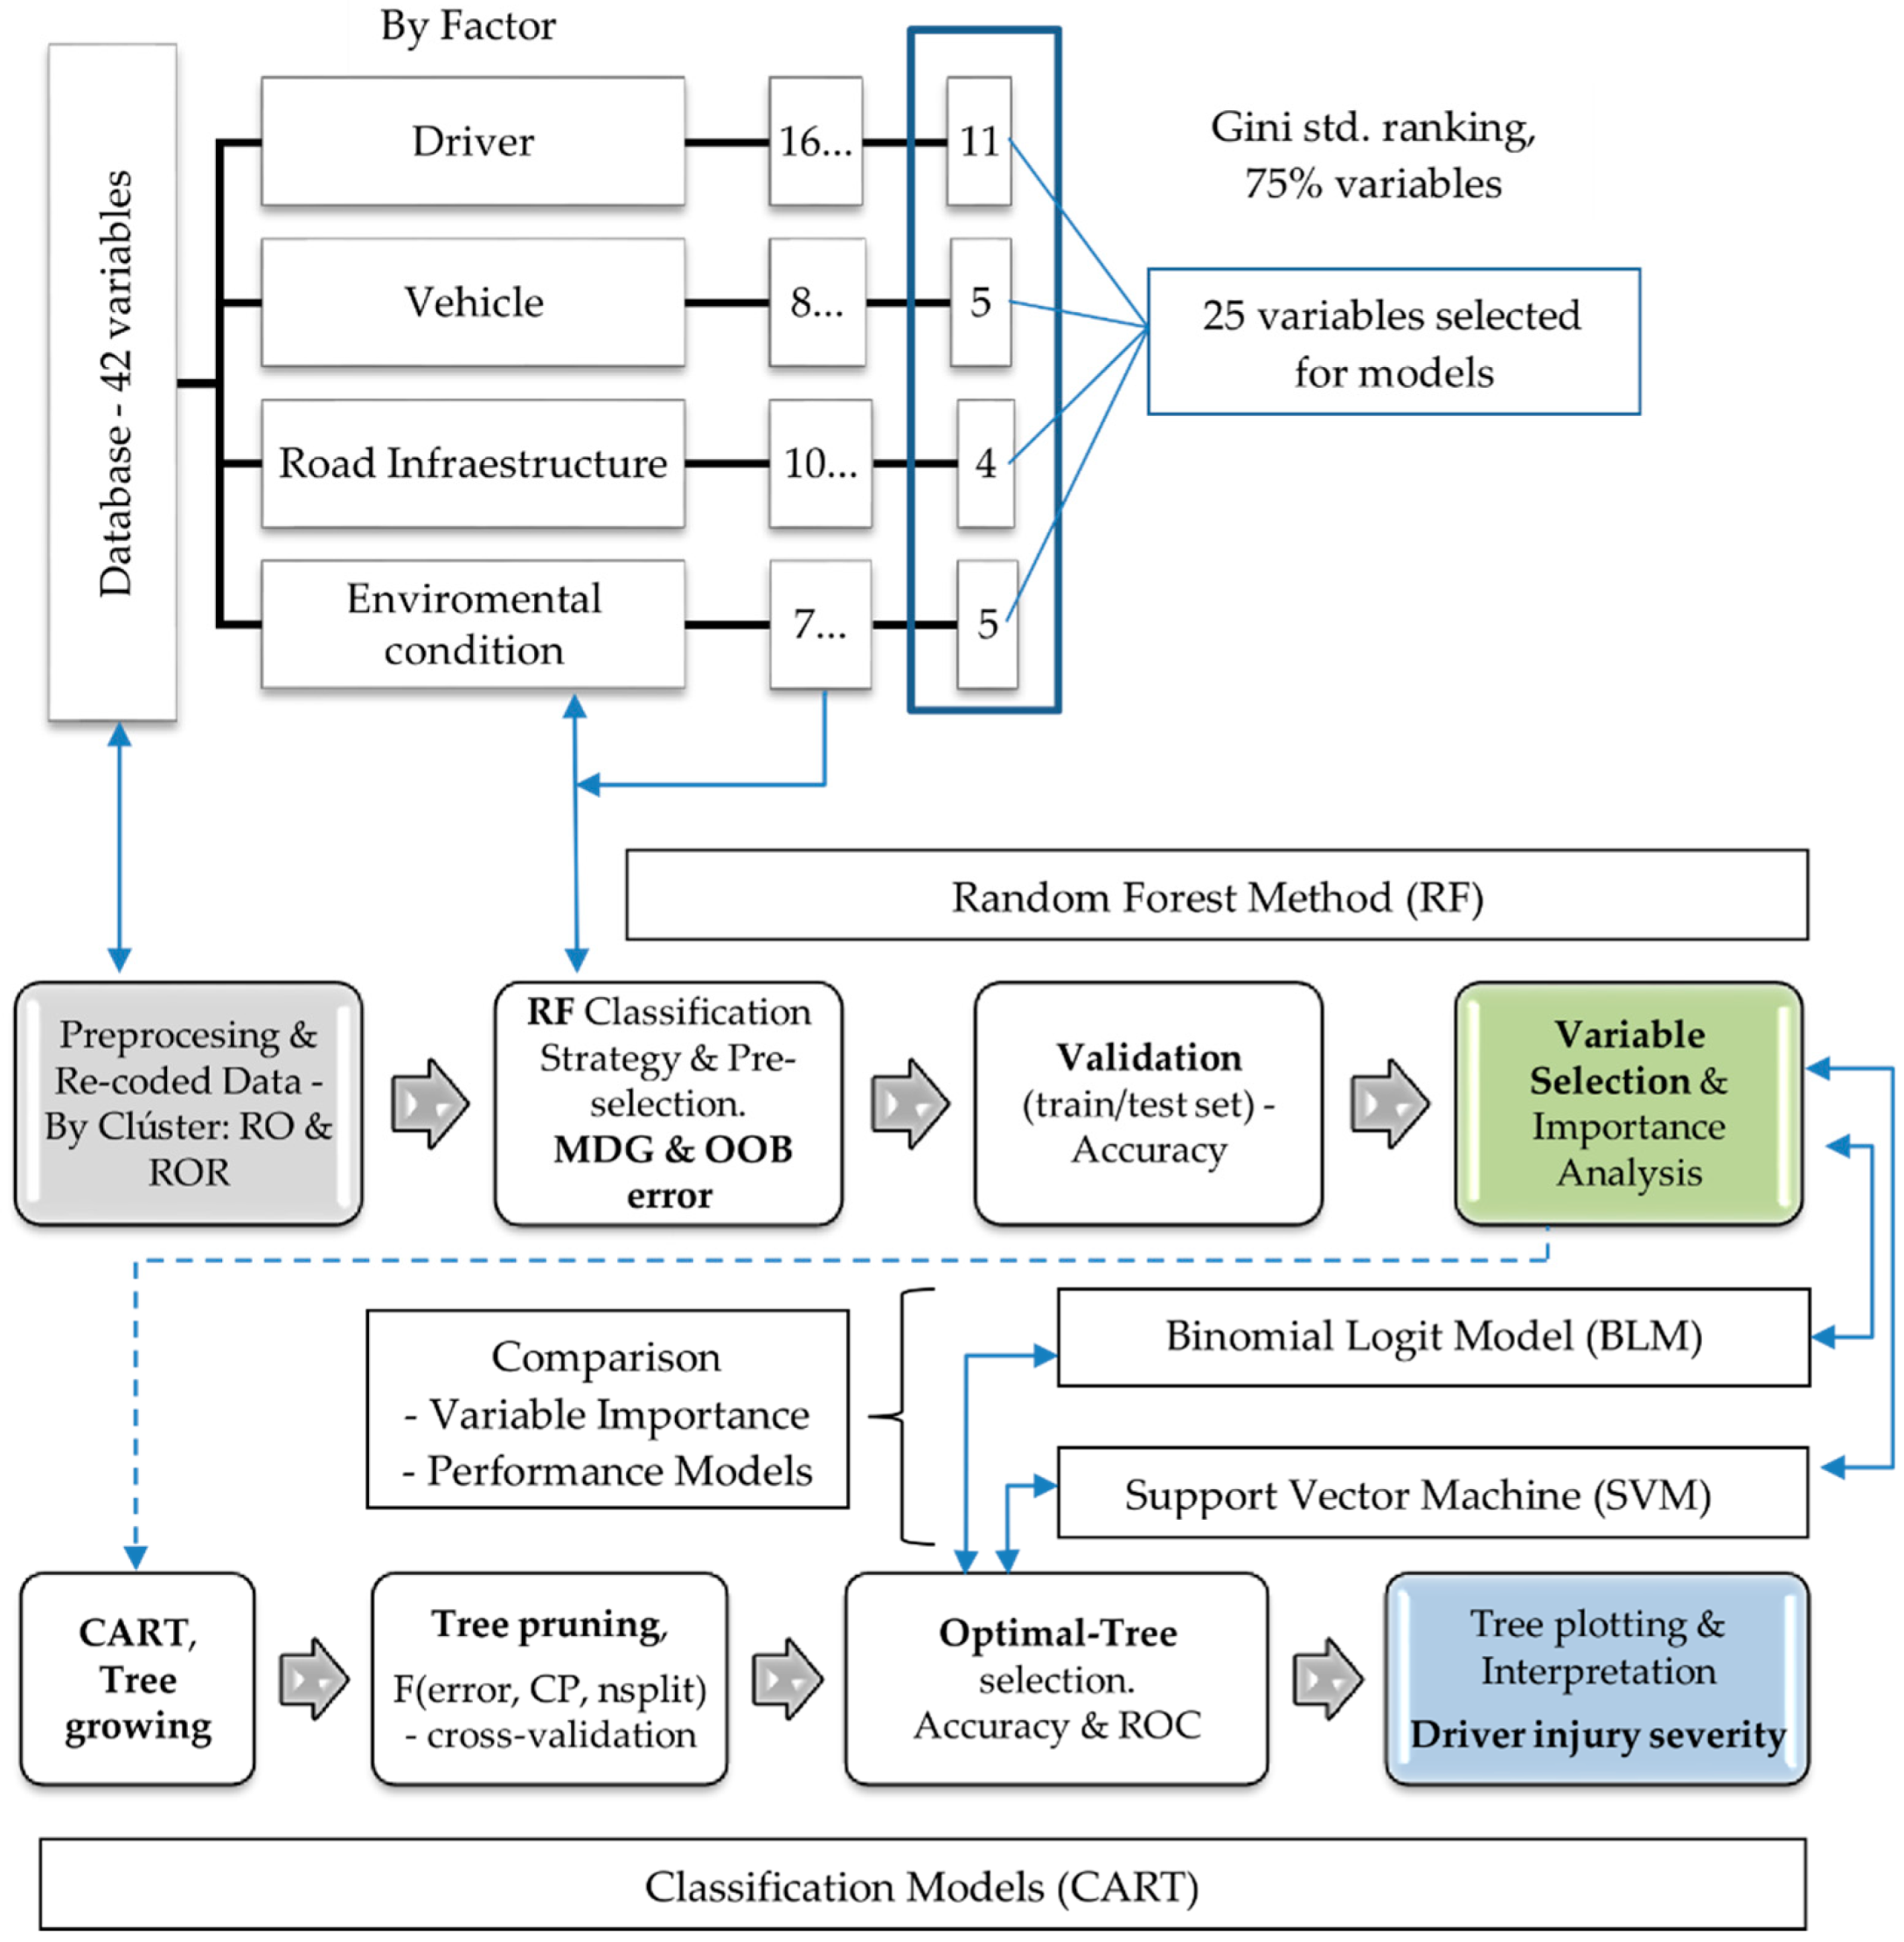
3.2. Methodology: An RF+CART Approach for LTV Driver-Injury Severity

In this work, an RF+CART approach was adopted to identify the important variables that are highly related to driver-injury severity and to select a fitted number of variables by RF. Random forest uses sampling without replacement to obtain subsets of data that are different for each tree in the forest. Also, the set of variables used in each partition in each tree is randomly selected. A particular tree can be plotted that can be optimal but would not be representative, since it is only adjusted to the subset of the selected variables. The CART models were developed to predict and analyze the underlying relationships between data and driver-injury severity because of the capacity for logical interpretation and visualization. The investigation was complemented with a contrast of the important RF variables for both the BLM and SVM models. Finally, the prediction performance of the four models (RF, CART, BLM, and SVM) was compared.
The general flow of the study is shown in Figure 3. Starting from 42 primary variables (including the target variable) of the DB LTVs, a conceptual framework for classifying them into four factors (driver, vehicle, infrastructure, and environmental conditions) was applied. The processing and analysis of this data concludes with the definition of four subsets of variables within each factor. Through RF, four severity models (final-mixed RF model: RF-FMM) were developed to identify the variables most strongly related to driver severity. A reduced number of variables were selected within each subset by applying the cut-off criterion established at a 75% Gini index value. The RF-FMM result is the variable importance ranking, which was contrasted with the respective contribution metrics of the variables for driver-injury severity in the BLM and SVM models.
The 25 significant RF variables that potentially affect driver-injury severity were considered and selected as input for the CART models and were adjusted following the common practice: firstly, a very large tree (with high complexity) was pruned, fixing the complexity with predictive capacity via the cost-complexity function. The two optimum trees (for RO and ROR crashes) were selected to analyze the underlying relationships between data and severity behavior due to their explanatory and descriptive power.
The BLM and SVM models were also used to compare the model’s prediction performance together (the RF+CART approach and BLM and SVM models). The CARET package was the common interface used to integrate the functions of the different R packages. This algorithm allows one to simplify the training of the models, tuning across and standardizing the inputs and outcomes of the functions. In this study, the RF, CART, BLM, and SVM algorithms were implemented in the free software environment R [16].
The RF+CART model combines the advantages of RF (which is robust when compared to overfitting, thereby decreasing the bias and the correlation and being more stable than only the CART model) for variable selection and the CART model’s capacity for logic interpretation and visualization. It is also possible to compare models (or the partial results) of different types of complexities—a parsimonious CART model as fully specified as the BLM and SVM models.
Both the RF and CART have been widely implemented in different areas; some of these studies are briefly described in the literature review section.

3.2.1. Random Forest Method—Variable Importance Ranking and Variable Selection

RF is a sophisticated version of the bagging procedure created by Breiman [14], where not only subsets of records are replicated, but a subset of the input variables is also chosen randomly [40] or used for application to a sensitivity analysis [41]. These represent the most sophisticated and efficient tree set techniques within the classical or most frequent approach.
The general architecture of the RF using decision trees is described as follows [42]:
  • Generate a bootstrap sample of size Nc from the overall data N to grow a treeB by randomly selecting the predictors X = {xi, i = 1, …, I} (this bootstrap sample will be identified as a cluster).
  • Use the predictor xi at the node n of the treeB to vote for class label kB in this node. At each node, the sample is refined until obtaining the best predictor for the split.
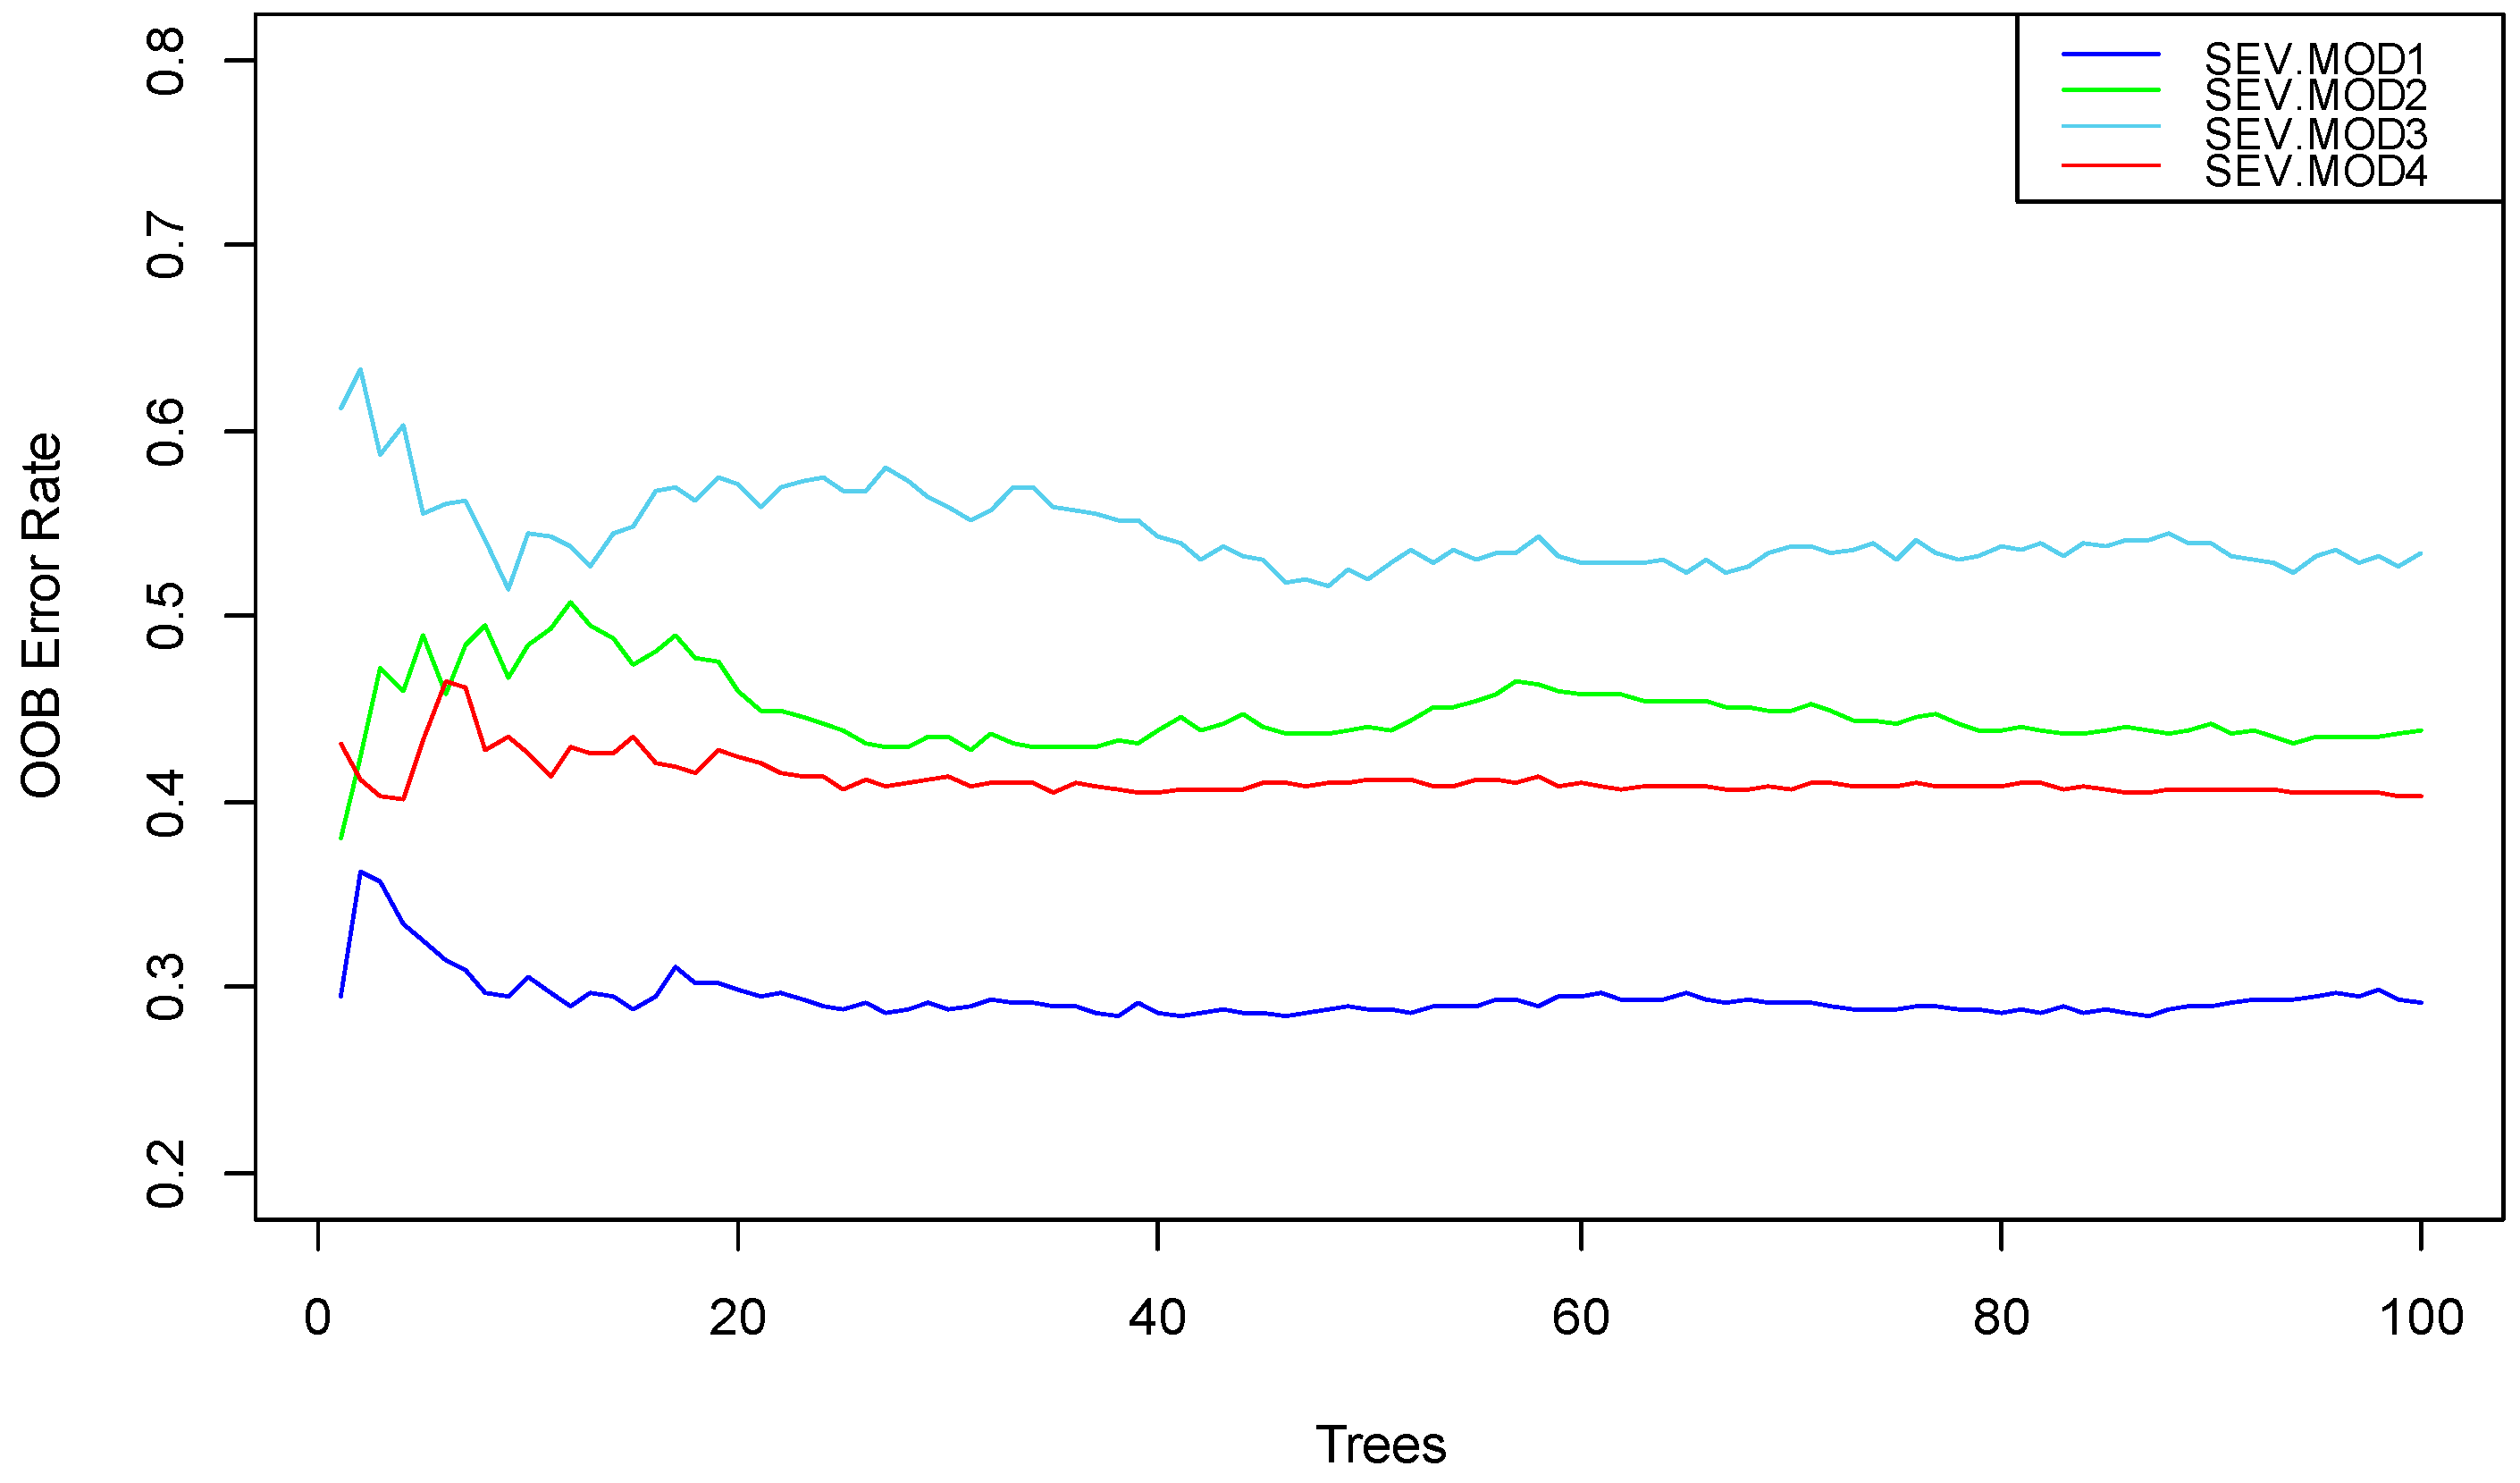
  • Run the out-of-bag (OOB) data (N-Nc) down the treeB to obtain the misclassification rate, and OOBERB is selected.
  • Repeat (1–2–3) for a large number of trees until the minimum out-of-bag error rate, OOBERB, is obtained.
  • Assign each observation to a final class k through a majority vote by averaging over the set of trees.
The variable importance ranking is measured by the Mean Decrease Accuracy ( M D A ) and the Mean Decrease Gini ( M D G ) . The classification accuracy measure computes the mean decrease in classification accuracy of the OOB data (N-Nc) [42]. The importance measure shows how much the mean squared error or impurity increase when the specified variable is randomly permuted. If the prediction error does not change by permuting the variable, then the importance measures will not be altered significantly, which in turn will change the Mean Squared Error (MSE) of the variable only slightly (low values). This suggests that the specified variable is not important. On the contrary, if the MSE significantly decreases during the permutation of the variable, then the variable is deemed as important. The classification accuracy measure of the variable is averaged over the number of trees, B, used to construct the RF:
M D A ( x i ) = t r e e = 1 B M D A tree   ( x i ) B
where MDA (xi) is the average importance rate of the variable xi, and MDAtree (xi) is the importance rate of the same variable in tree = {treeb, b = 1, …, B}.
The MDG computes the contribution of the variable to the homogeneity of the nodes and thus is represented in the resulting RF. The Gini coefficient is a measure of homogeneity from 0 (homogeneous) to 1 (heterogeneous):
M D G n ( x i ) = 1 k = 1 k p 2   ( k | n )
where the MDGn (xi) is the Gini impurity coefficient of variable xi at node n; p(k|n) is the probability of class k in at node n (weight), and K is the number of classes. Each time a specified variable is used to split a node, the Gini coefficients for the child nodes are calculated and compared to those of the parent node. Usually, after the split of a node, the impurity of the child node becomes smaller than that of the parent node. The changes in Gini are added for each variable and normalized at the end of the calculation. Summing up the Gini impurity measures for each variable over all the trees gives the importance rate, which is often consistent with the permutation importance measure [14]. Thus, the variable with the highest impurity is deemed as more important.
The variable importance ranking and variable selection approach with RF have been used in recent papers [21,33]. Fernández et al. [43] showed RF to be one of the best classifiers among the 17 families of models through the CARET package.
In this study, as a criterion, the upper RF variables with a Gini standard index (75% of the group variables) are selected from each subset, through which an RF-FMM is generated. This criterion allows one to analyze at least one variable of each factor that must be present, since, in a previous analysis with all the variables, information, which a priori did not seem relevant, was lost. The FMM that presents a minimum value of the Out-Of-Bag error (OOB) is pre-selected, followed by a cross validation between the training (67% sample) and test samples (33%) and calculating the performance of the classification. The significant RF variables were selected as the input for CART model training.

3.2.2. Classification Tree Model (CART)

CART is a supervised, nonparametric, binary segmentation learning technique—that is to say, the partitions of CART are recursively performed until a stop criterion is reached. Therefore, the tree is constructed by dividing data repeatedly. The most common algorithmic approach for CART, created by Breiman [15], initially produces a very large tree (high complexity) and then prunes it. In other words, the model cuts branches that do not add to its predictive capacity. It is also intensively dependent on strong computational resources, such as the R library—statistical computing [16]. In general, the CART model is developed in three steps: tree growing, tree pruning, and optimal-tree selection.
In the first step, the maximum homogeneity of the internal nodes is determined with an impure function i(t). Since the impure root node tr is constant for any of the splits and possible divisions, the maximum homogeneity of the left tl and the right tr internal nodes will be equivalent to the maximization of the change of the impurity function Δi(t) [15,40]:
Δ i ( t ) = i ( t r ) P l i ( t l ) P r i ( t r )
where Pl and Pr are the probabilities of the left and right nodes.
The second step is tree pruning. The principle of this step involves using a mechanism to create a sequence of smaller trees by cutting off increasingly important nodes. The pruning process relies on a complexity parameter that is defined through a cost function of misclassification of the data and tree size. The tree misclassification cost can be defined as
R ( T ) = τ ϵ T ¯ P ( t ) r ( t ) .
To find the optimal tree size, one can use a cross-validation procedure (train/test set sample), which is based on finding the optimal ratio between the complexity of the tree and the misclassification error. The cost-complexity function is defined as
R α ( T ) = R ( T ) +   α | T ¯ |
where T ¯ is the tree complexity, and α is the complexity parameter (CP).
These classification models work without any pre-defined underlying relationships between the target and the predictors, especially when the values of the target variable and the predictors are discrete or categorical [27].
Chen et al. [35] applied the CART method to select variables, using it as an input in the SVM model. Chang and Wang [27] and Chang and Chien [28] applied CART to study the level of injury severity in different accident types. Das et al. [29] applied CART algorithms with Conditional Inference–Forest. De Oña et al. [31] applied CART to extract useful decision rules for road safety analysis.
In this work, CART models were developed to predict and analyze the underlying relationships between data and the severity behavior in the injury severity of RO and ROR crashes.
To reduce type-1 errors considering cross validation, the dataset was split randomly into two parts: a training set (70% of the data) and a testing set (the remaining 30%), as done in previous works [31,39].

3.3. The Contrasting Purposes of Models

The variable importance ranking and the model prediction performance of the RF+CART approach were compared with the respective contributed metrics of the variables regarding the driver-injury severity of the Binary Logit Model (BLM) and Support Vector Machine (SVM) models.

3.3.1. Binary Logit Model (BLM)

Logit Model (LM) or logistic regression is a special type of generalized linear model. The BLM is the simplest form of a LM, since BLM describes the relationship of independent variables to binary outcome variables, and the logistic function must lie in a range between 0 and 1. This modelling approach is usually used for traffic injury severity [17,18,19,44].
The starting equation is
  P ( Y = 1   |   X ) = e x p ( b o +   i = 1 i b i x i ) 1 + e x p ( b o +   i = 1 i b i x i )
where P ( Y = 1   |   X ) is the probability occurrence (Y) of driver injury severity (KDSI = 1), X is n independent variables x1, …, xn that influence driver severity, bo is a constant parameter, and bi is a vector of the model parameters (coefficients).
To analyze the importance rate of the model variables, we analyzed the values of their respective coefficients (bi), as well as the proportional change of the probabilities of the occurrence or non-occurrence of an event through the ODDS-Ratio (OR). The ODDS is calculated as the coefficient between the probability of the occurrence and the probability of the non-occurrence of an event under certain conditions, which is obtained according to the following Equations (7)–(9):
  O D D S = P ( o c u r r e n c e ) P ( n o n   o c u r r e n c e )
  P ( o c u r r e n c e ) = 1 1 + e ( b o + b i X )
  P ( n o n o c u r r e n c e ) = 1   P ( o c u r r e n c e ) .
Considering a model with more than one predictive variable Xj, the OR of Xj is calculated as
  O R = O D D S   a f t e r   c h a n g e   i n   a n   X j   u n i t O D D S   b e f o r e   t h e   c h a n g e .
The calculation for variable Xj is made by keeping the rest of the predictive variables constant. The OR values are a good measure of the effects of the variables in the model. When their values are higher than 1, the variable has a significant effect.

3.3.2. Support Vector Machine (SVM)

The SVM model is initially used to perform binary classification because of the way it creates a hyperplane to discriminate between two classes. SVM is a supervised machine learning model developed by Vapnik for classification and regression analyses [45]. In the classification case, the SVM searches to find the curve that is able to separate and classify the training data, guaranteeing that the separation between the curve and certain observations of the training group (support vectors) is as large as possible.
The training dataset of n points, xi ∈ Rn, for i = 1, 2, …, n, is defined as the vectors (explanatory variables), and the training dataset relative to the variable target is defined as yi ∈ Rn. Any hyperplane can be written as a set of points X satisfying
W · X b = 0
where W is aa two-category classification with a training set (xi,yi), the SVM model needs to solve the next optimization problem [46]:
min w , b , ξ 1 2 w T w + C i = 1 N ξ i Subject   t o   y i   ( w T   ( x i ) + b ) 1 ξ i ,   ξ i 0
where ξ are slack variables, and C is a tuning parameter to balance the parameter between the margin size and classification error. For nonlinear classification problems, the kernel functions allow us to non-linearly transform separable spaces to linearly separable ones. Several kernels (radial and polynomial) were analyzed depending on their costs, and the best results obtained with the radial basis function (RBF) for driver severity classification were applied.

3.4. Performance of Classification Models

The performance of RF and CART is compared with BLM and SVM based on four parameters that evaluate the goodness of the classification method: the accuracy, sensitivity, specificity, and receiver operating characteristic curve (ROC area). Table 4 indicates the parameters of the four models for RO and ROR type crashes. The CARET package [47] was used as a common interface to integrate the functions of the different R packages that were applied in this study.
The relationship between sensitivity and specificity is shown graphically by the receiver operator characteristic (ROC). The optimal cut-off value should be determined when both are balanced. A larger area under the ROC curve (ROC area) represents the highest classification accuracy of the model, as shown in Figure 9.
Sensitivity is defined as the capacity to give a positive result for true cases and to correctly identify a proportion of DKSI cases. Specificity is defined as the capacity to give a true result for negative cases; and correctly identify a proportion of DSI, as follows:
S e n s i t i v i t y = T r u e   P o s i t i v e s   T P ( T r u e   P o s i t i v e s   T P   +   F a l s e   N e g a t i v e s   F N )  
S p e c i f i c i t y = T r u e   N e g a t i v e s   T N ( T r u e   N e g a t i v e s   T N +   F a l s e   P o s i t i v e s   F P )  
A c c u r a c y = T P + T N ( T P + T N + F N + F P ) .
In Equation (15), the accuracy is the model’s precision, which refers to the percentage of cases correctly classified (in this case, considering both categories).

4. Results

4.1. Analysis of the Importance of the Variables

Regarding the select key variables, the Gini index value and the classification error by RF were used. An analysis is shown in Figure 4 for an RO-type accident. Here, the most important variables for each factor are highlighted separately in the SEV.MOD1 model, with the variables of (a) factors such as the use of a seatbelt, psychophysical condition, location of serious injury, age, and driver infractions, among others. The SEV.MOD2 model highlights (b) factors such as the number of occupants, the age of the vehicle, and the LTV groups. The SEV.MOD3 model includes (c) factors such as road function, location of the accident, and lane width, and the SEV.MOD4 model includes variables of (d) factors such as crash time, season, and luminosity.
Then, the OOB classification error curves according to each factor group are observed, as shown in Figure 5, where the values tend to stabilize for ntree = 100. Furthermore, this graph also indicates the degree of the relationship with the driver’s injury severity. The values for the driver factor have a lower OOB error (~30%) than those for environmental conditions (~40%) and for LTV vehicles (~45%), and those with a greater OOB error pertain to road infrastructure (~50%).
The RF results are compared with the BLM and SVM methods in terms of the importance of their variables.
A reduced number of variables was selected relatively for each factor by applying the cut-off criterion established by a 75% Gini index value. The selected variables were combined in a final-mixed RF model (RF-FMM), as shown in Table 2. Its OOB error rate is 30.59%, which is acceptable considering that a large percentage of categorical variables are studied. The normalized importance (Gini index and accuracy measure) of the variables by RF was also analyzed. The 10 most important variables that contribute to classifying the driver-injury severity level are shown in Table 2: SEATBELT, BODYINJURY, PSYCHO, AGE, and OCUPANT. These variables have higher relative percentages and correspond to the significant variable order in the two contrasted models (BLM and SVM).
In Table 2 and Table 3, the statistics of the three methods are given. For RF, MDG, and MDA, the metrics are the corresponding for assessment of the variable importance ranking. For the BLM model, coefficient B, their significant level (Pr) and the values of the Odds Ratio (OR) are shown. For the BLM model, we analyze the effect variable through its coefficient. The most significant are the SEATBELT variable (case RO), as the use of a safety belt reduces severity. Following the common practice of interpretation, because B = −1.26, the probability of having a higher crash severity is reduced by 71.63% ((exp(−1.26)−1) × 100). In a similar way, when the driver does not present any type of psychophysical effect (PSYCHOP-WOD), severity can be reduced by 69.27% ((exp(−1.18)−1) × 100). For the SVM, the metrics obtained by the Kernel RBF (through the CARET package and its importance-variable function) is shown. Here, the top five variables coincide with the RF ranking, giving them greater influence on severity, as the four of them belong to the driver factor. In an accident, the driver factor has the highest influence, according to the scientific literature.
Variables with the highest importance for both types of RO and ROR accidents are those related to the driver factor and also have the highest relevance for the three methods (RF, BLM, and SVM): SEATBELT, BODYINJURY, and PSYCHOP. For the type of accident RO, the most relevant are the driver variables, as previously mentioned; in second place are the infrastructure factors (ROADFUN and ACCLOC), followed by the vehicle factors (OCUPANT, AGELTV, and LTV) and environmental conditions (SEASON and HOUR). For the ROR case, the environmental condition variables are slightly more important than those for the vehicle and infrastructure.

4.2. CART Models

The 25 RF significant variables of RF-FMM that potentially affect driver-injury severity were selected as input for the CART models. In being applied to RO, the misclassification error of tree growth is 20.6%. The next step is to select an optimal tree, which is determined by a compromise between goodness of fit and tree size. In case of an RO collision, there is a corresponding pruned tree = 10 (CP = 0.001), as shown in Figure 6. For an ROR collision, the pruned tree is 8 (CP = 0.0985). These tree results were interpreted graphically (see Figure 7 and Figure 8).

4.2.1. Driver Injury Severity in a Rollover (RO Collision)

The analysis sample of these accidents consisted of 3445 rollover accidents (38.06% of total accidents in this study). The training and validation samples were divided and the values assigned as N. training = 2316 (70%) and N. validation = 993 (30%).
The overall misclassification was 21.3%, which is considered an acceptable value for models with predictive categorical variables—that is to say, it has 78.7% good predictions for classification. Figure 7 shows the results of the classification tree (CT), with the most important variables that are critical in classifying driver-injury severity. CT includes 13 splits and 14 terminal nodes (TN). Terminal nodes (TN) in a green color show, on the right zone, the drivers with mild injuries or DSI, and those in the left zone in a blue color show the driver TNs with severe injuries or DKSI. Regarding the TN color intensity, where the green color is darker, the severity will be milder. The opposite is true for the blue color; where it is darker, driver severity will be higher.
By analyzing the hierarchy of the selected categorical variables in the tree structure, which determine differences in driver severity for overturn accidents (RO collisions) with one LTV involvement, the following fundamental ideas can be extracted:
  • SEATBELT: Safety belt use/non-use.
According to the results shown for both opposite ends (the final nodes, TN 3 and TN 16), it is determined that the severity associated with the non-use of a safety belt is higher (DKSI), with a high probability (83%).
  • ROADFUN: Urban/rural roads.
The severity associated with RO-collisions on interurban or rural roads is higher than the severity of those that occur on urban roads. Both opposite branches show significant differences, with an increase in right to left severity: DSI to DKSI (urban vs. interurban). In node TN 5, mild injuries are identified (DSI), and in the nodes between TN 19 and TN 16, which are located to their left, higher severe injuries (DKSI) are observed.
  • PSYCHOP: Psychophysical driver condition.
Harmfulness according to this classifier decreases from left to right, as indicated by the color code of the tree in Figure 7. The CT-RO classifies the levels of this non-ordinal variable clearly in two different groups: those injured with a known condition (PSYCHOP-WD and PSYCHOP-WOD) and those injured with an unknown condition (PSYCHOP-UKN). This is shown in the nodes between TN 72 and TN 19 and in TN 16–17. Delimited by TN 72 and TN 19, the psychophysical conditions related to alcohol use, drugs, sleepiness, distraction, etc., (PSYCHOP-WD), and normal conditions (PSYCHOP-WOD), are distributed. In TN 16–17 the unknown condition cases (PSYCHOP-UKN) are classified. The severity in these last nodes corresponds to the cases with a higher severity and a higher probability of occurrence. Analyzing the interaction between factors, this result is influenced by the non-use of a seat belt and accidents on rural roads with drivers aged over 25 years old.
A priori, this result could be counter-intuitive, but it is reasonable when this variable is collected in the BGA during the moment of accident occurrence. Further, identification of the categories of this variable that relate to mortal or severely injured victims is not possible to determine in situ, either by using the available resources or by the urgency of the victim´s mobilization to hospital centers, especially from interurban zones.
  • AGE: Age.
A driver´s age is a factor of influence in the results of severity in the case of an RO occurrence. Young driver injuries (<35 years old) from the vehicles involved in the accidents are of a milder nature than the injuries obtained for the rest of the age groups (>35 years old). The probability of lesions for both identified groups is high, as determined by TN 72 and TN 75. An explanation for this result could be the overconfidence of more adult drivers and the assumption of risky behavior, such as speed, continuous driving over the recommended time limits, etc.
  • LANEWD: Road lane width.
The cut-off value of the lane width is 3.75 m. The CT classifies this value into two groups according to the types of roads: (1) roads with wide lanes (>3.75 m) that could correspond to higher capacity roads, and (2) roads with a narrower lane width, which are associated with lower level roads than the first ones (see TN 19 and the ones between TN 72 and TN 75, respectively). The cases with DKSI severity occur in this latter group of roads, while lower DSI injury is observed for roads of the first group. As accepted by the scientific community, higher capacity roads are safer.
  • LTV: Type of vehicle.
The vans of this study are classified into four groups: G1 pick-ups, G2 chassis-cabin trucks, G3 van and combi-type commercial vehicles, and G4 passenger car-derived vehicles. The CT identifies differences in driver severity according to two groups: light trucks and the other types. The driver-injury severity of light trucks is lower than that of the other types of LTVs (TN 75 and TN 296–297, respectively). Contributing to these results are the constructive and dynamic behavioral differences of light trucks and the rest of the LTVs considered in this work.
  • OCUPANT: Number of passengers.
In RO accidents with van involvement, the probability of injury is high (DKSI) when the driver is alone. The opposite result is obtained for a higher number of passengers (TN 296–297 and TN 149 respectively). A plausible explanation for this result is the collaboration of passengers to maintain driver alertness.
  • SEASON: Season of the year.
Driver-injury severity is increased (DKSI) with a higher probability when accidents occur in summer compared to the rest of the seasons of the year (see TN 72 and TN 146 to TN 296 respectively). The good climate conditions in the summer months induce trips with different patterns than those in colder months.
  • PLANTRIP: Planning a trip.
The accident type severity of RO injuries is more easily distinguished when trips are of a medium distance (between 50 and 200 km), compared to short and long trips (see TN 146 and TN 588–589, respectively), resulting in DKSI severity in the first group, while the second group presents more mild cases of DSI injuries. Medium trips can be driven through conventional roads (rural zones) where police controls are at a minimum.
  • HOUR: Hour of the accident occurrence.
The time slots identified as different are clear: daytime hours form one group (12–18 h), while the other times form another. Severity is higher during nighttime hours or when there is a lack of visibility, or during the first labor hours of the day with high traffic density, which results in TN 296 compared to TN 297, which results in mild DSI injuries with a higher probability. An explanation of this pattern (higher severity during nighttime hours) could be due to lower surveillance by the control authorities but also to a lack of visibility and deficient illumination of the surrounding conditions.
  • BODYINJURY: Injury localization.
Injury localization in victims in RO-type accidents determines the severity result. Injuries are more severe (DKSI) when they are produced in the upper zone of the body (TN 568–569). The opposite is true for the central or lower zones, which result in DSI severity (TN 295). This result is reasonable, with conditioning factors such as the non-use of a safety belt and the accident having occurred on rural roads.

4.2.2. Driver Injury Severity by Run-Off-Roadway (ROR Collision)

The analysis sample of these accidents consists of 5607 accidents (62% of accidents with LTVs). The training and validation samples are divided, and values are assigned: N. training = 3925 and N. validation = 1682. The overall misclassification of CT is 22.95%, which is considered an acceptable value for models with predictive categorical variables. Thus, this model offers 77.05% good predictions for classification.
The output is shown in Figure 8. Among the main profiles that distinguish the driver severity classification in ROR types of accidents, we highlight the following:
  • SEATBELT: Safety belt use/non-use.
This is the most important variable in severity classification and divides the data into two branches. The right side indicates that when using a safety belt, the driver´s injury severity decreases, as shown in TN 13–7. On the left branch, severity increases when not using a safety belt (terminal nodes placed between TN 4 and TN 11; both included).
  • PSYCHOP: Psychophysical driver conditions.
This variable is classified into three groups: cases with unknown conditions of psychophysical status, resulting in serious or fatal injuries (TN 4 and TN 12). As explained in the RO collision analysis, the status of this group is confirmed posteriori in the hospital center. The second group includes those who do not present any psychophysical defects. Accordingly, members of this group receive mild injuries or remain unharmed (DSI; see TN 11). The third group with known conditions (alcohol use, drugs, sleepiness, distraction, etc.) is classified in cases with higher severity risks (DKSI; see TN 20–84–86), with node of a higher probability appearing in TN 20; this result may be due to the factor concurrence of the non-use of a safety belt.
  • BODYINJURY: Injury location.
Drivers who present injuries in the upper or central zones of their bodies are conditioned to the use of a safety belt, and experience only mild severity (DSI; TN 7). If the injuries originate in the lower zones and are conditioned to the non-use of a safety belt, the severity of the injuries is higher (DKSI; see TN 20)—likewise for the probability regarding injuries that are obtained when a safety belt is used (TN 12). This fact could be explained by the characteristics of the lateral dynamics at the exit of the road, followed by a subsequent crash (or not) with the lateral objects of the road.
  • SEASON: Season of the year.
In accidents of an ROR type, the CT classifies severity based on the winter season (see TN 84–85) and the rest of the seasons (TN 86–87). These results present slight severity differences in terms of probabilities, with spring, summer, and autumn cases presenting a higher probability of DKSI (TN 86) than the rest of the nodes. The conditioning factor may be the psychophysical status of the driver and the demands of mobility by the LTVs in the seasons of the year with better weather conditions and more time with natural light, generally leading to more activity.
  • AGELTV: Age of the vehicle.
This variable has a cut-off point at 10 years of age. DKSI occurs when the vehicle is less than 10 years of age (TN 84), while DSI occurs when the vehicle is older (TN 85). It is understood that LTVs are of commercial use, with a high mobility demand; the newest presents a higher accident frequency. In the mobility study performed in the Furgoseg Project and ITV-DGT, it was determined that the newest vehicles drive more kilometers than those of a greater age [7].
  • TRIPPURP: Trip purpose.
A work purpose (i.e., work entrance or exit) results in a higher injury severity of the driver (DKSI) (see TN 86) when compared to DSI severity, in cases featuring driving during work or for leisure purposes (see TN 87). Stress, distraction, or impatience could be considered determinants when driving during high traffic density hours, together with psychophysical conditions (alcohol, drugs, sleepiness, etc.) and the non-use of a safety belt.

4.3. Performance Analysis

As shown in Table 4, the accuracy rates of the RF and CART models do not have significant differences with the comparative models, which indicates that they are correct alternatives to the models being classified. As they contain non-balanced samples in their classes (variable targets), sensibility and specificity statistics are somewhat different for both types of accidents (RO and ROR). Using these values and calculating the ROC area gives us a more general idea of the model behavior used to predict both the reference class and the counterpart. This process measures the model performance to predict high severity DKSI, as well as low severity DSI. In these cases, the model BLM has better global performance and predictive power, followed by SVM, RF, and CART, for both types of accidents. It should be indicated that, although the CART model has lower predictive power than the comparison models, CART offers higher descriptive and explanatory power, as it can describe the relationships between independent variables and their significance in the model, when compared to the two models of a higher complexity (the cases of SVM and RF), in a case when the data analysis is run with more than 10 categorical variables (in the case of BLM).
As shown in Figure 9, the curves for the BLM model are softer, and the values with higher predictive performance are obtained for both types of accidents (RO and ROR). The performance values indicate that some unobserved variables that occur during an accident may be missing.

5. Discussion

The proposed approach (RF+CART) results are reasonable. The RF model provides a variable importance ranking in order to select a reduced but appropriate number of variables that are highly related to driver-injury severity and LTV involvement. The 25 RF significant variables of the final model were selected as inputs for the CART models. The BLM and SVM models were developed to contrast the significant RF variable rankings and to compare the prediction performance. The results were convergent and coherent for the two accident types.
The variable importance analysis showed that the variables related to driver characteristics present the highest influence in the accident types of rollover (RO) and Run-Off-Roadway (ROR). Of less, albeit similar, importance compared to driver factors are the factors related to infrastructure, vehicle, and environmental conditions. Thus, it is very important to focus our attention on the driver as an operator of the vehicle, which is the factor that most strongly contributes to the occurrence of accidents. It is essential to control the risk factors in driving and their effects on accidents regarding the evaluation of traffic safety and the sustainable development of transport [48,49].
The CART results for both accident types show that the most relevant variables that classify severity agree in a similar way with the RF model results. The following variables are highlighted: the use/non-use of a safety belt (SEATBELT), the driver presenting or not presenting psychophysical conditions (PSYCHOP), and the injury’s localization (BODYINJURY).
The results presented in this study are consistent. A higher probability for DKSI severity occurs when the driver does not use a safety belt. The results for the logistic model application [20,23] indicate that the probability of higher severity is associated with the same variable in accidents with the involvement of similar cars, as analyzed here. Drivers in accidents with a single vehicle (RO) in rural zones have a greater likelihood of receiving more serious injuries (DKSI) when they are under the influence of alcohol (a psychophysical condition) and have a lower likelihood in urban zones (similar to the referenced results [50]).
Likewise, our results agree with the studies that applied a non-parametric model analysis, where the concurrent variables that increase severity are alcohol and drug influence (psychophysical conditions) and the non-use of a safety belt, as shown in the references [26,28,29], especially in RO collision types [35] and in the case of an ROR collision [36]. Moreover, no factor alone is a key determinant; only a combination of factors are [26].
In accordance with the driver’s age, the CART-RO type shows DKSI severity for drivers over 25 years old and less severity for drivers under 25. The study in [51] indicates that a driver’s driving ability decreases with age, which can increase risk, as shown by the scientific evidence. Regarding the vehicle factor, the CART-RO type reveals that the severity for light trucks is lower than that for other LTV types. The referenced authors [21,27,32] found that light trucks present lower accident severity compared to smaller sized vehicles such as vans, pickups, or tourism derivatives.
The prediction performance (accuracy and ROC area) for CART and RF presents acceptable values for the predictive driver-injury severity with categorical variables. The performance values might indicate that some unobserved variables that occur during an accident may be missing [49]. Various studies have analyzed the CART model’s performance using the parameters described here. In some of these studies, the ROC-area indicator was proven superior for the severity analysis [32,33]. The study in [52] analyzes severity using two, three, and five categories of severity; when only two categories are used, the results indicate less variance and more robustness. The performance of the BLM and SVM models was shown to be superior. However, these models have lower explanatory power and complex formulations when many variables are used.
Approaches with RF were used in recent papers [21,32]. Chen et al. [35] applied the CART method to select variables and used them as input in the SVM model. Some applications of RF and CART were presented in the literature review section. Fernández et al. [43], in their study, showed that one of the best classifiers among the 17 families of models is RF using the CARET package.

6. Conclusions

The approach presented in this study allowed us to identify significant categorical variables related to driver severity by selecting a reduced number of variables. The CART model was applied with significant RF variables; in this way, a better classification rate was obtained. Two accident types (RO and ROR collision) were analyzed in order to determine the underlying relationships between the explanatory variables and driver-injury severity. The CART model was applied according to the capacity related to logical interpretation and visualization. The 25 explanatory categorical variables related to drivers, vehicles, infrastructure, and environmental factors were used. The most relevant variables to predict driver-injury severity are highlighted as follows: the use/non-use of a safety belt, the psychophysical conditions of the driver (sleepiness, alcohol, and drug influence), and the injury localization.
The statistical techniques of data mining and machine learning are adequate for identifying and understanding the phenomena that occur while driving and the subsequent occurrence of a traffic accident. They allow one to perform classifications with categorical variables. Applying RF methods reduces the variance in predictions by aggregating variables according to their nature (factor) and analyzing their existing correlations. The aims of the process are to filter repeated information and reduce the number of predictive variables through the value of the level of importance in the model. The obtained results with the RF+CART approach present good predictive performance with acceptable precision (~77%). In the comparison between the traditional logistic statistical model BLM and SVM machine learning techniques, better general predictive performance is obtained for the first case. The CART model has similar precision to both models and is superior in its descriptive and explanatory power for the predictor variables (which, for the aims of this study, makes CART more advantageous). The classification tree model permits us to extract information and interpretations easily with good accuracy.
The psychophysical defects of the driver (alcohol, drugs, sleep, sudden illness, fatigue, or concern) in concurrence with other factors, such as a planned trip (measured in km intervals) and the number of years with a driving permit, allow researchers to classify the severity of injuries that the driver may suffer when involved in run-off-road accidents. These accidents can be linked to distractions, as well as a loss of concentration and vehicle control, since psychophysical defects modify a driver’s alertness and can affect the time of the driver’s response when faced with an emergency situation.
In rollover accidents, the type of van (size, mass, and height of the center of gravity under certain load conditions), combined with the planned trip variables, constitute factors that classify the degree of severity.
With the findings of this approach, we have sought to contribute to the decision-making of control authorities and to supplement the third objective frame (health and wellbeing) of sustainable development (Sustainable Developed Goals) for the 2030 Agenda, established by United Nations. In this Agenda, a specific target (3.6) was set for 2020: reducing by half the number of deaths and injuries caused by traffic accidents. The last revision of the SDG progress in 2019 stated that “the transformation is not advancing at the necessary speed or scale to meet the Sustainable Development Goals by 2030.” The evidence in our study could lead to the adoption of new measures and controls to enhance road safety.

Author Contributions

All authors contributed to the research presented in this paper and to the preparation of the final manuscript. The conceptualization was outlined by G.P.-Q., B.A.-R., and F.A.-I. The methodology was developed by G.P.-Q., B.A.-R., and C.G.-F.; the formal analysis was by G.P.-Q., B.A.-R., F.A.-I., and C.G.-F.; writing—original draft preparation G.P.-Q. and B.A.-R.; writing—review and editing G.P.-Q., B.A.-R., and C.G.-F. All authors have read and agreed to the published version of the manuscript.

Funding

This research received no external funding.

Acknowledgments

The authors would like to thank the General Directorate of Traffic (DGT) and General Directorate of Highways (DGC) of the Ministry of Transportation (MFOM) for the access to the databases. The authors are also thankful to the Community of Madrid, which has contributed to this work through the SEGVAUTO-TRIES-CM (S2013-MIT2713) Program. In addition, the first author is thankful to the National Secretary of Higher Education, Science, Technology and Innovation (SENESCYT—Ecuador) for the fellowship (grant number 2015-AR2Q8464).

Conflicts of Interest

The authors declare no conflict of interest.

References

  1. United Nations (UN). Transforming our World: The 2030 Agenda for Sustainable Development. Available online: https://sustainabledevelopment.un.org/post2015/summit (accessed on 5 December 2019).
  2. World Health Organization. Decade of Action for Road Safety 2011–2020. Available online: http://www.who.int/roadsafety/decade_of_action/en/ (accessed on 18 November 2019).
  3. World Health Organization (WHO). Road Traffic Injuries. 2018. Available online: http://www.who.int/mediacentre/factsheets/fs358/en/ (accessed on 17 November 2019).
  4. United Nations (UN). Special Edition: Progress towards the Sustainable Development Goals. 2019. Available online: https://sustainabledevelopment.un.org/sdgsummit#documentation (accessed on 5 December 2019).
  5. Directorate General of Traffic (DGT). Las Principales Cifras de la Siniestralidad Vial. España. 2018. Available online: http://www.dgt.es/es/seguridad-vial/estadisticas-e-indicadores/publicaciones/principales-cifras-siniestralidad/ (accessed on 18 November 2019).
  6. World Health Organization (WHO). Global Status Report on Road Safety 2015. Available online: http://www.who.int/violence_injury_prevention/road_safety_status/2015/en/ (accessed on 18 November 2019).
  7. Instituto para la Diversificación y Ahorro de la Energía, (IDAE). Plan Nacional Integrado de Energía y Clima 2021–2030 (PNIEC) España. Available online: https://energia.gob.es/es-es/Participacion/Paginas/PNIEC.aspx (accessed on 10 January 2020).
  8. Transport & Environment. Emission Reduction Strategies for the Transport Sector in Spain. Available online: https://www.transportenvironment.org/publications/emission-reduction-strategies-transport-sector-spain (accessed on 10 January 2020).
  9. European Commission. A Clean Planet for all A European strategic Long-Term Vision for a Prosperous, modern, Competitive and Climate Neutral Economy COM/2018/773. Available online: https://eur-lex.europa.eu/legal-content/EN/TXT/?uri=CELEX%3A52018DC0773 (accessed on 10 January 2020).
  10. Development and application of an integrated methodology for the study of road accidents with involvement of vans of the Spanish national research plan 2008–2011. Available online: http://insia-upm.es/portfolio-items/proyecto-furgoseg/?lang=en (accessed on 2 September 2019).
  11. Aparicio, F.; Arenas, B. An integrated methodology for the scientific research of road accidents. Gen. Overv. Secur. Vialis 2017, 9, 57–67. [Google Scholar] [CrossRef]
  12. Automotive Studies Institute. Intern report FURGOSEG project. Available online: http://www.ideauto.es/ (accessed on 2 September 2019).
  13. Dadashova, B.; Arenas, B.; Mira, J.; Izquierdo, F. Explanatory and prediction power of two macro models. An application to van-involved accidents in Spain. Transp. Policy 2014, 32, 203–217. [Google Scholar] [CrossRef]
  14. Breiman, L. Random forests. Mach. Learn. 2001, 45, 5–32. [Google Scholar] [CrossRef] [Green Version]
  15. Breiman, L.; Friedman, J.; Stone, C.J.; Olshen, R.A. Classification and Regression Trees; CRC Press: Boca Raton, FL, USA, 1984. [Google Scholar]
  16. The R Foundation. R: A Language and Environment for Statistical Computing. Available online: https://www.R-project.org/ (accessed on 30 November 2019).
  17. Savolainen, P.T.; Mannering, F.L.; Lord, D.; Quddus, M.A. The statistical analysis of highway crash-injury severities: A review and assessment of methodological alternatives. Accid. Anal. Prev. 2011, 43, 1666–1676. [Google Scholar] [CrossRef]
  18. Mannering, F.L.; Bhat, C.R. Analytic methods in accident research: Methodological frontier and future directions. Anal. Methods Accid. Res. 2014, 1, 1–22. [Google Scholar] [CrossRef]
  19. Toy, E.L.; Hammitt, J.K. Safety impacts of SUVs, vans, and pickup trucks in two-vehicle crashes. Risk Anal. 2003, 23, 641–650. [Google Scholar] [CrossRef]
  20. Kononen, D.W.; Flannagan, C.A.C.; Wang, S.C. Identification and validation of a logistic regression model for predicting serious injuries associated with motor vehicle crashes. Accid. Anal. Prev. 2011, 43, 112–122. [Google Scholar] [CrossRef]
  21. Zhu, X.; Srinivasan, S. A comprehensive analysis of factors influencing the injury severity of large-truck crashes. Accid. Anal. Prev. 2011, 43, 49–57. [Google Scholar] [CrossRef]
  22. Khorashadi, A.; Niemeier, D.; Shankar, V.; Mannering, F. Differences in rural and urban driver-injury severities in accidents involving large-trucks: An exploratory analysis. Accid. Anal. Prev. 2005, 37, 910–921. [Google Scholar] [CrossRef]
  23. Ulfarsson, G.F.; Mannering, F.L. Differences in male and female injury severities in sport-utility vehicle, minivan, pickup and passenger car accidents. Accid. Anal. Prev. 2004, 36, 135–147. [Google Scholar] [CrossRef]
  24. Behnood, A.; Mannering, F. The effect of passengers on driver-injury severities in single-vehicle crashes: A random parameters heterogeneity-in-means approach. Anal. Methods Accid. Res. 2017, 14, 41–53. [Google Scholar] [CrossRef]
  25. Li, Z.; Ci, Y.; Chen, C.; Zhang, G.; Wu, Q.; Qian, Z.; Prevedouros, P.D.; Ma, D.T. Investigation of driver injury severities in rural single-vehicle crashes under rain conditions using mixed logit and latent class models. Accid. Anal. Prev. 2019, 124, 219–229. [Google Scholar] [CrossRef]
  26. Delen, D.; Sharda, R.; Bessonov, M. Identifying significant predictors of injury severity in traffic accidents using a series of artificial neural networks. Accid. Anal. Prev. 2006, 38, 434–444. [Google Scholar] [CrossRef]
  27. Chang, L.; Wang, H. Analysis of traffic injury severity: An application of non-parametric classification tree techniques. Accid. Anal. Prev. 2006, 38, 1019–1027. [Google Scholar] [CrossRef]
  28. Chang, L.; Chien, J. Analysis of driver injury severity in truck-involved accidents using a non-parametric classification tree model. Saf. Sci. 2013, 51, 17–22. [Google Scholar] [CrossRef]
  29. Das, A.; Abdel-Aty, M.; Pande, A. Using conditional inference forests to identify the factors affecting crash severity on arterial corridors. J. Saf. Res. 2009, 40, 317–327. [Google Scholar] [CrossRef] [Green Version]
  30. Abellan, J.; Lopez, G.; de Ona, J. Analysis of traffic accident severity using Decision Rules via Decision Trees. Expert Syst. Appl. 2013, 40, 6047–6054. [Google Scholar] [CrossRef] [Green Version]
  31. De Oña, J.; López, G.; Abellán, J. Extracting decision rules from police accident reports through decision trees. Accid. Anal. Prev. 2013, 50, 1151–1160. [Google Scholar] [CrossRef] [Green Version]
  32. Zhou, B.; Zhang, X.; Zhang, S.; Li, Z.; Liu, X. Analysis of Factors Affecting Real-Time Ridesharing Vehicle Crash Severity. Sustainability 2019, 11, 3334. [Google Scholar] [CrossRef] [Green Version]
  33. Lee, C.; Li, X. Predicting Driver Injury Severity in Single-Vehicle and Two-Vehicle Crashes with Boosted Regression Trees. Transp. Res. Rec. 2015, 2514, 138–148. [Google Scholar] [CrossRef]
  34. Wu, J.; Xu, H. Driver behavior analysis on rural 2-lane, 2-way highways using SHRP 2 NDS data. Traffic Inj. Prev. 2018, 19, 838–843. [Google Scholar] [CrossRef]
  35. Chen, C.; Zhang, G.; Qian, Z.; Tarefder, R.A.; Tian, Z. Investigating driver injury severity patterns in rollover crashes using support vector machine models. Accid. Anal. Prev. 2016, 90, 128–139. [Google Scholar] [CrossRef]
  36. Zhu, M.; Li, Y.; Wang, Y. Design and experiment verification of a novel analysis framework for recognition of driver injury patterns: From a multi-class classification perspective. Accid. Anal. Prev. 2018, 120, 152–164. [Google Scholar] [CrossRef]
  37. Mafi, S.; AbdelRazig, Y.; Doczy, R. Machine Learning Methods to Analyze Injury Severity of Drivers from Different Age and Gender Groups. Transp. Res. Rec. 2018, 2672, 171–183. [Google Scholar] [CrossRef]
  38. Theofilatos, A.; Chen, C.; Antoniou, C. Comparing Machine Learning and Deep Learning Methods for Real-Time Crash Prediction. Transp. Res. Rec. 2019, 2673, 169–178. [Google Scholar] [CrossRef]
  39. Tavakoli Kashani, A.; Shariat-Mohaymany, A.; Ranjbari, A. A data mining approach to identify key factors of traffic injury severity. PROMET-Traffic Transp. 2011, 23, 11–17. [Google Scholar] [CrossRef] [Green Version]
  40. Hastie, T.; Tibshirani, R.; Friedman, J. The Elements of Statistical Learning: Data Mining, Inference, and Prediction; Springer Science & Business Media: New York, NY, USA, 2009. [Google Scholar]
  41. Grömping, U. Variable importance assessment in regression: Linear regression versus random forest. Am. Stat. 2009, 63, 308–319. [Google Scholar] [CrossRef]
  42. Verikas, A.; Gelzinis, A.; Bacauskiene, M. Mining data with random forests: A survey and results of new tests. Pattern Recognit. 2011, 44, 330–349. [Google Scholar] [CrossRef]
  43. Fernandez-Delgado, M.; Cernadas, E.; Barro, S.; Amorim, D. Do we Need Hundreds of Classifiers to Solve Real World Classification Problems? J. Mach. Learn. Res. 2014, 15, 3133–3181. [Google Scholar]
  44. Al-Ghamdi, A.S. Using logistic regression to estimate the influence of accident factors on accident severity. Accid. Anal. Prev. 2002, 34, 729–741. [Google Scholar] [CrossRef]
  45. Vapnik, V. Statistical Learning Theory; Wiley: New York, NY, USA, 1998. [Google Scholar]
  46. Cortes, C.; Vapnik, V. Support-vector networks. Mach. Learn. 1995, 20, 273–297. [Google Scholar] [CrossRef]
  47. Kuhn, M. Building Predictive Models in R Using the caret Package. J. Stat. Softw. 2008, 28, 1–26. [Google Scholar] [CrossRef] [Green Version]
  48. Cioca, L.; Ivascu, L. Risk Indicators and Road Accident Analysis for the Period 2012–2016. Sustainability 2017, 9, 1530. [Google Scholar] [CrossRef] [Green Version]
  49. Laureshyn, A.; Svensson, Å.; Hydén, C. Evaluation of traffic safety, based on micro-level behavioural data: Theoretical framework and first implementation. Accid. Anal. Prev. 2010, 42, 1637–1646. [Google Scholar] [CrossRef] [PubMed]
  50. Wu, Q.; Zhang, G.; Zhu, X.; Liu, X.C.; Tarefder, R. Analysis of driver injury severity in single-vehicle crashes on rural and urban roadways. Accid. Anal. Prev. 2016, 94, 35–45. [Google Scholar] [CrossRef] [PubMed]
  51. Lee, H.C.; Lee, A.H.; Cameron, D.; Li-Tsang, C. Using a driving simulator to identify older drivers at inflated risk of motor vehicle crashes. J. Saf. Res. 2003, 34, 453–459. [Google Scholar] [CrossRef] [PubMed]
  52. Jeong, H.; Jang, Y.; Bowman, P.J.; Masoud, N. Classification of motor vehicle crash injury severity: A hybrid approach for imbalanced data. Accid. Anal. Prev. 2018, 120, 250–261. [Google Scholar] [CrossRef]
Figure 1. Casualty accidents and fatalities, involvement of Light Trucks and vans (LTVs) of ≤3500 kg.
Sustainability 12 01324 g001
Figure 2. Database of driver accidents in a single-light truck and van (LTV) crash.
Sustainability 12 01324 g002
Figure 3. General research flow based on the classification models (An RF+CART approach).
Sustainability 12 01324 g003
Figure 4. Importance of RF variables (Gini criterion) for RO collision. (a) Factors linked to the driver (SEV.MOD1); (b) factors linked to the vehicle (SEV.MOD2); (c) factors linked to infrastructure (SEV.MOD3), and (d) factors linked to environmental conditions (SEV.MOD4).
Sustainability 12 01324 g004
Figure 5. The relationship Out-Of-Bag (OOB) error and number of trees in the RO collision.
Sustainability 12 01324 g005
Figure 6. The relation between the CP/tree size and the relative error for an RO collision.
Sustainability 12 01324 g006
Figure 7. Classification Tree for RO collisions (Good predictions: 78.07%).
Sustainability 12 01324 g007
Figure 8. Classification Tree for ROR collisions (Good predictions: 77.05%).
Sustainability 12 01324 g008
Figure 9. ROC curves and ROC area of classifications model. (a) RO collision; (b) ROR collision.
Sustainability 12 01324 g009
Table 1. Variable definitions and data description.
VariableCategoriesCodeDriver Injury Severity
DKSI: Driver Killed and Seriously Injured%DSI: Driver Slightly Injured%Total
SEVERITY: Driver Injury SeverityDKSI/DSI207622.93%697677.07%9052
ACCTYPE: collision type
RolloverRO71120.64%273479.36%3445
Run-Off-RoadwayROR136524.34%424275.66%5607
Explanatory variables
Driver Characteristics
TRIPPURP: trip purpose
Within workWW88623.27%292276.73%3808
Non-work relatedNW26025.59%75674.41%1016
Leisure timeLT92123.79%295176.21%3872
ACTION: action of driver
Go straightGOS193324.17%606375.83%7996
StopSTP41.61%24598.39%249
OvertakingOVT6718.46%29681.54%363
Sudden maneuverSM159.74%13990.26%154
OtherOT4718.22%21181.78%258
LICENSE: driver license
Type BB184224.08%580675.92%7648
With restrictionWR22616.74%112483.26%1350
OtherOT713.73%4486.27%51
PSYCHOP: psychophysical conditions
With defectsWD141520.60%545379.40%6868
Without defectsWOD19418.56%85181.44%1045
UnknownUKN46741.00%67259.00%1139
INFSPEED: infractions for speeding
InfractionINF71623.28%236076.72%3076
No infractionNINF88321.87%315478.13%4037
UnknownUKN47724.60%146275.40%1939
INFDRIV: driver’s infractions
DistractionDIST46120.80%175579.20%2216
InfractionINF34516.02%180983.98%2154
No infractionNINF127027.24%339372.76%4663
PLANTRIP: Planned trip (km)
<50<5092224.16%289575.84%3817
50–20050–20061524.12%193575.88%2550
>200>20028923.55%93876.45%1227
UnknownUKN25017.15%120882.85%1458
SEATBELT: driver seatbelt use
Seatbelt is used—YESYES131319.17%553780.83%6850
Seatbelt not used—NONO60046.51%69053.49%1290
UnknownUKN16317.87%74982.13%912
BODYINJURY: location of serious injury
Upper bodyUP70525.88%201974.12%2724
CenterC52324.76%158975.24%2112
Lower bodyLW24042.33%32757.67%567
Whole bodyWB29143.56%37756.44%668
UnknownUKN29113.76%182486.24%2115
AGE: driver age
<25<2534519.87%139180.13%1736
25–3525–3564820.88%245579.12%3103
36–6036–6090325.22%267774.78%3580
>60>6018028.44%45371.56%633
GENDER: driver gender
MaleM190323.25%628176.75%8184
FemaleF17319.93%69580.07%868
Vehicle Characteristics
AGELTV: vehicle age
<2<265724.34%204275.66%2699
3–53–543122.34%149877.66%1929
6–106–1047924.06%151275.94%1991
>10>1045925.43%134674.57%1805
CONDICLTV: condition of vehicle
With defectsWD7921.01%29778.99%376
Without defectsWOD195122.91%656477.09%8515
UnknownUKN4628.57%11571.43%161
LTV: group of light trucks and vans
Pick-upG15930.26%13669.74%195
Chassis-cabin truckG228922.39%100277.61%1291
Van and combiG386823.16%288076.84%3748
Passenger car-derived vehicleG486022.52%295877.48%3818
OCUPANT: occupants involved
11146626.74%401773.26%5483
2–32–351917.57%243582.43%2954
4–94–98815.09%49584.91%583
UnknownUKN39.38%2990.62%32
GROSSW: gross vehicle weight (kg)
<1500<150027427.29%73072.71%1004
1500–19991500–200067721.08%253578.92%3212
2000–24992000–250022825.19%67774.81%905
2500–30002500–300031724.73%96575.27%1282
>3000>300058021.90%206978.10%2649
Road Infrastructure Characteristics
ROADFUN: road function
UrbanURB9316.01%48883.99%581
RuralRUR198323.41%648876.59%8471
LANEWD: lane width (m)
<3.25<3.2547027.68%122872.32%1698
3.25–3.753.25–3.75148923.11%495476.89%6443
>3.75>3.7511321.24%41978.76%532
SHOULDR: shoulder type, width (m)
Non-existent or impassableNE60821.70%219478.30%2802
<1.5<1.571024.24%221975.76%2929
1.5–2.491.5–2.566322.71%225677.29%2919
>2.5>2.59424.87%28475.13%378
ACCLOC: accident location—road curvature or intersection
Straight roadSR95422.96%320177.04%4155
Curve roadCR100323.41%328176.59%4284
At Intersection with streetIS2615.57%14184.43%167
At Intersection with highwayIH9320.85%35379.15%446
Environmental Conditions
VISIBLTY: sight distance
Restriction: building, topography, atmospheric, otherVR40423.95%128376.05%1687
Without restrictionOKV167023.88%532276.12%6992
LIGHT: lighting condition
Daylight, sufficient (night)DLS124420.89%471179.11%5955
Dusk, insufficient, without lighting (night)INL83226.86%226573.14%3097
WEATHER: weather
SunnySUN168124.00%532376.00%7004
AdverseADV39519.29%165380.71%2048
HOUR: crash time
00:00–05:590–628827.56%75772.44%1045
07:00–11:596–1259420.94%224279.06%2836
12:00–17:5912–1862721.22%232878.78%2955
18:00–23:5918–2452625.35%154974.65%2075
SEASON: month—season
AutumnAUT51023.09%169976.91%2209
SpringSPR52123.56%169076.44%2211
SummerSUM55721.37%205078.63%2607
WinterWIN48824.10%153775.90%2025
Table 2. Variable importance ranking (10th)—RO collision model.
VariableRFBLM *SVM
(Kernel RBF)
MDG
Nrm (%)
MDA
Nrm (%)
Coef. BPrORMetric
SEATBELT100.00100.00−1.26 (YES)0.0000 **3.570.551
BODYINJURY50.6873.900.79 (LW)0.0000 **2.190.082
PSYCHOP24.2855.62−1.18 (WOD)0.0000 **3.220.034
AGE11.8019.710.47 ([>60])0.0000 **1.610.014
OCUPANT11.3423.000.17 ([1])0.0065 **1.190.025
ACTION10.0819.29-0.1026-0.018
ROADFUN9.1229.02−0.50 (URB)0.0005 **1.640.110
ACCLOC7.8623.28-0.9167-0.017
INFDRIV7.122.58−0.406 (NINF)0.0000 **1.500.007
LTV5.874.43-0.3397-0.024
* DKSI reference class = 1, ** p < 0.05.
Table 3. Variable importance ranking (11th)—ROR collision model.
VariableRFBLM *SVM
(Kernel RBF)
MDG
Nrm (%)
MDA
Nrm (%)
Coef. BPrORMetric
SEATBELT62.04100.00−1.11 (YES)0.0000 **3.030.4860
PSYCHOP48.2660.02−1.17 (WOD)0.0000 **3.220.1360
BODYINJURY100.0087.250.87 (LW)0.0000 **2.380.1650
SEASON69.433.92-0.9129-0.0220
AGELTV65.14-0.32 (>10)0.0072 **1.380.0040
TRIPPURP41.76--0.9754-0.0280
HOUR58.626.00-0.8692-0.0010
PLANTRIP58.526.20-0.4117-0.0010
ACCLOC40.589.06-0.6063-0.0050
INFDRIV38.2916.570.31 (NINF)0.0062 **1.370.0150
OCUPANT33.3110.25-0.9039-0.0080
* DKSI reference class = 1, ** p < 0.05.
Table 4. Performance comparison for parametric and non-parametric models of RO- and ROR-type crashes.
RO-TypeRFCARTBLMSVM
Accuracy0.77400.78070.79190.7908
Sensitivity0.57140.40510.65710.7083
Specificity0.78240.79760.79740.7931
ROC area0.65800.63970.72640.6561
ROR-Type
Accuracy0.73250.77050.73840.7428
Sensitivity0.75490.76110.74620.7435
Specificity0.58050.50810.65520.7333
ROC area0.67380.62420.70650.7042

