Non-Parametric Model for Evaluating the Performance of Chinese Commercial Banks’ Product Innovation


School of Economics and Management, Tongji University, Shanghai 200092, China
*
Author to whom correspondence should be addressed.
Sustainability 2020, 12(4), 1523; https://doi.org/10.3390/su12041523
Submission received: 16 January 2020
/
Revised: 10 February 2020
/
Accepted: 14 February 2020
/
Published: 18 February 2020
(This article belongs to the Special Issue Sustainability, Digital Transformation and Fintech: The New Challenges of the Banking Industry)
Abstract
:A thorough analysis of commercial banks’ product innovation performance is essential to promoting bank product innovation capabilities and sustainable development. In this paper, the product innovation performance of commercial banks is defined as the conversion efficiency of input and output factors. The credit risk of product innovation of banks is considered as an undesirable output and incorporated in the performance evaluation system. Depending on whether there is a synchronous relationship between innovation income and risks, a Fixed Correlation model (FCM) and a Variable Correlation model (VCM) are then constructed based on Data Envelopment Analysis (DEA) method for the evaluation of commercial bank product innovation performance. In addition, an output optimization model of the objective function is also constructed to estimate the target income of commercial banks’ product innovation in the FCM and VCM. Finally, the proposed model is applied to Chinese listed commercial banks for estimating the performance and target income of product innovation.
1. Introduction
In recent years, Chinese commercial banks continue to strengthen their capability of innovation and risk management through product innovation, which is also regarded as an important strategy for the improvement of their core competitiveness [1,2]. A thorough analysis of commercial banks’ product innovation performance is essential to promoting the banks’ competitiveness and sustainable development [3]. Regarding the definition of bank product innovation, Roberts and Amit [4] divide the innovative activities of banks into product innovation, service innovation, process innovation and channel innovation, where product innovation mainly refers to the innovation of corporate and personal banking business; Lerner and Tufano [5] hold that financial innovation of banks includes product and process innovation. Based on the Guidelines for the Financial Innovation of Commercial Banks, issued by the China Banking Regulatory Commission, this paper defines the product innovation of commercial banks as innovations in business and products carried out to meet the demand of customers.
To our best knowledge, the performance of a certain commercial bank product innovation depends on various factors in the innovation process, as examples, R&D personnel, expenses and income obtained from innovative products [6]. R&D personnel and expenses could be regarded as input factors in the process of bank product innovation, while income is an output factor. Thus, the product innovation performance of commercial banks could be defined as the conversion efficiency of input and output factors. The DEA method is introduced in this paper to evaluate the performance of Chinese commercial banks’ product innovation, since it is a total factor efficiency evaluation method that can evaluate the efficiency of decision making units (DMU) with multiple inputs into multiple outputs [7]. As a non-parametric total factor productivity evaluation method, the DEA method can effectively avoid model misspecification. As such, it has been widely used in estimating total-factor efficiencies [8,9].
Although banks can generate more revenue through innovative products [2], it is noted that different from other industries’ innovation, financial product innovation also creates potential risks for bank operations. Calmès and Théoret [10], Aktan et al. [11] analyzed the statistics of commercial banks in Canada and Istanbul, respectively, and found that the growth of the innovative products may lead to an increase of risks for commercial banks. Therefore, it is of great significance to consider the impact of product innovation risks when analyzing the performance of commercial banks’ product innovation. According to the Core Indicators for the Risk Management of Commercial Banks released by the China Banking Regulatory Commission, risks faced by commercial banks mainly include the liquidity risk, the credit risk, the market risk and the operational risk. Considering the reality of product innovation in Chinese commercial banks, it could be discovered that commission revenue related to loans and quasi-loans are the main source of banks’ handling charge income [12], the credit risk can be seen as the major risk involved in the process of product innovation. As such, in this paper, the credit risk is considered as an undesirable output and is incorporated in the performance evaluation system.
As a research on the evaluation of bank product innovation performance, the main contribution of this article lies in the fact that the FCM and VCM are constructed based on DEA for evaluating commercial banks’ product innovation performance. To be specific, it assigns a weak disposability setting and a strong disposability setting to undesirable output, according to the relationship between the innovation income and risk. In addition, an output optimization model of the objective function is also constructed to estimate the target income of commercial banks’ product innovation in the FCM and VCM. Finally, the proposed model is applied to Chinese listed commercial banks for estimating the performance and target income of product innovation.
The remaining parts of this paper are as follows. Section 2 is a literature review. In Section 3, the DEA-based methodology is introduced to calculate the performance of Chinese commercial banks’ product innovation and estimate the target income of product innovation. Section 4 illustrates sampling and data sources, corresponding empirical results, further discussion and suggestions. Conclusion follows in Section 5.
2. Literature Review
Performance evaluation is a well-studied subject in the existing literature. In particular, the non-parametric DEA method has been widely used. For example, Vlontzos et al. [13] used DEA to evaluate energy performance and environmental performance. Cai et al. [14] used DEA to analyze the efficiency of China’s photovoltaic industry. DEA is also broadly used in studies related to commercial banks. Wang et al. [15] analyzed the efficiency of 16 major Chinese commercial banks during the period 2003–2011 using DEA approach; Liu et al. [16] constructed production possibility sets using the free-disposal axioms and utilized the corresponding DEA model with undesirable intermediate variables to evaluate the efficiency of listed Chinese banks; Ohsato and Takahashi [17] applied a slack-based measure DEA model to evaluate the management efficiency of regional banks in Japan. Undesirable outputs have attracted growing attention from scholars in research on performance evaluation and other bank-related issues. For instance, Wang et al. [15] proposed a DEA model considering undesirable outputs and applied it to the performance evaluation of 26 Chinese commercial banks.
In addition, DEA can also be utilized to discuss the improvement objectives of inputs and outputs while evaluating performance. In existing research, three methodologies are most frequently used. This first involves the investigation of slack variables associated with outputs and is now widely applied in studies where DEA is utilized to evaluate performance [18]; the second estimates potential optimization using an inverse DEA model [19]. Inverse DEA was first developed by Wei et al. [20], which estimates inputs/outputs with a given proficiency; the third uses objective functions with specific directions to calculate optimal variables [21].
In studies concerning banks’ product innovation, Wenqiang et al. [22] used stochastic frontier analysis to evaluate the efficiency of bank innovation and analyzed the main driving factors for bank product innovation. Lyu [23] investigated the overall innovation and managerial innovation capabilities of listed Chinese banks. There are also scholars who analyze the factors that affect the innovation performance of commercial products. As examples, Rossignoli and Arnaboldi [24] studied relations between innovation, performance and risks of commercial banks in financial crisis. Wen [25] studied the relationship between internet finance and commercial banks’ innovation performance; Zeng et al. [26] investigated the impact of financial supervision on product innovation of commercial banks.
It could be found that, in the existing literature, quantitative research on commercial banks’ product innovation performance is still scarce and rarely touches on the impact of risks. The current research related to commercial banks’ product innovation and risks is mostly built upon the discussion of relations between income structure, non-interest income and commercial banks’ profit-making ability. Few studies so far have incorporated risks associated with product innovation into performance evaluation. Thus, this paper proposes a DEA-based non-parametric model to evaluate and analyze commercial banks’ product innovation performance, which including the credit risk associated with product innovation.
3. Methodology
This section first introduces the input–output process of commercial bank product innovation. Subsequently, a bank product innovation performance evaluation model based on the DEA is constructed. Finally, an optimization model is also established to estimate the target income of bank product innovation.
3.1. Input and Output Variables
Before using DEA to evaluate the performance, input and output variables should be determined. There is a wide variety of input/output variables used for the evaluation of commercial banks’ performance, which differs according to the objective of the evaluation. It is generally agreed that commercial banks’ product innovation income is realized through the input of innovation-related personnel and funds [22].
Considering the reality of Chinese commercial banks’ product innovation, Lyu [23] and Wenqiang, Jihui and Hua [22] note that input factors related to commercial banks’ product innovation include fixed assets, the number of employees, as well as the handling charge and commission expense, while output factors include the handling charge and commission income. Different from commercial banks’ traditional interest income, the handling charge and commission income refer to earnings generated by intermediary services such as consultation, guarantee, escrow services, etc. They can reflect the output of commercial banks’ product innovation activity [27]. Similarly, the handling charge and commission expense can reflect the financial input related to commercial banks’ product innovation. Given the fact that better-educated employees make a greater contribution to innovation [28,29], employees holding a bachelor’s degree or above (educated personnel) are selected to constitute the innovation personnel. Commercial banks’ fixed assets, as the basis for bank operation, are treated as another input factor in this study.
Through analyzing the structure of the handling charge and commission income, this study has found that loan-related commissions revenue is the main component of the banks’ product innovation income [12]. The related credit risk is therefore included in this study as a major risk. According to the Notice of the China Banking Regulatory Commission on Further Strengthening Credit Risk Management, released in 2016, commercial banks’ off-balance-sheet loans should be convertible into risk assets with a conversion coefficient of 100%, which can be regarded as normal commercial loans. According to the Administrative Measures for the Loan Loss Reserves of Commercial Banks, issued by the China Banking Regulatory Commission in 2012, commercial banks should create a credit provision tantamount to 1% of normal quasi-loans. Thus, this paper sets 1% of commercial banks’ off-balance-sheet loans as the anticipated non-performing loans to measure the product innovation risk. Figure 1 shows the process of commercial banks’ product innovation factoring in risk impact, where fixed assets (F), product educated personnel (L) and product innovation funds (K) generate product innovation income (Rt) and product innovation credit risk (B).
3.2. Models for the Evaluation of Commercial Banks’ Product Innovation Performance
Based on the input and output variables discussed in Section 3.1, commercial banks’ product innovation performance is defined as the input–output conversion efficiency, and the DEA model is introduced to evaluate the product innovation performance. Suppose there are n DMUs, noted as DMUj (j = 1, 2, …, n), a performance evaluation model can be constructed as follows.
In Model (1), λ is the intensity variable of each DMU, and the objective function represents the proxy of each DMU’s efficiency. Since Model (1) is an output-oriented DEA method, the range of is set to be [1, +∞]. In this paper, is used to represent the performance. The value of 1 indicates that the DMU is in DEA efficient, otherwise, the DMU is inefficient.
Additionally, different from the traditional DEA model, Model (1) places an equality constraint on Bi, the product innovation risk. The equation indicates that undesirable and desirable outputs are correlated [30], which could be regarded as a model with a weak disposability setting [31]. Based on such a setting, it could be understood that the product innovation income of commercial banks and the corresponding credit risk reflect the same trends. The risk will increase with the expansion of product innovation.
On the other hand, as commercial banks’ risk management techniques and capability improve, the product innovation risk can be lowered without reducing income. In that case, no synchronous relationship exists between commercial banks’ product innovation income and related risk. Based on this assumption, Model (2) is constructed.
Different from Model (1), Model (2) places an inequality constraint on Bi and can be regarded as a DEA model with a strong disposability setting [30]. With this setting, changes of the undesirable output do not affect the desirable output. In other words, the fact that commercial banks’ product innovation income and related credit risk change in the same trend is neglected. Therefore, the weak disposability and strong disposability settings represent a product innovation with and without risk management technique optimization, respectively.
A strong disposability setting implies that commercial banks manage credit risk through the improvement of risk management techniques and capability. In fact, relevant government agencies in China have already developed policies and carried out reforms to better control risks in the banking sector and maintain financial stability. Major commercial banks have also taken various measures to strengthen their risk management ability. Policy support, together with the development of technologies such as the Internet and big data, has made it possible to build a model based on the strong disposability of credit risk. On the other hand, when a weak disposability setting applies, it can be understood that even with policy support and cooperation between banks and companies, it is still difficult to optimize risk management ability in the short term. With this setting, commercial banks’ risk management techniques cannot be optimized within a short period of time, potential credit risk and product innovation income remain in a synchronous relationship.
In this paper, the model that features a synchronous relationship between commercial banks’ product innovation income and associated risks is defined as the FCM. In addition, if commercial banks can improve their risk management techniques without any restraint, potential credit risk may also be subject to the influence of these techniques. Therefore, this study also proposes a model with a strong disposability setting, which defined as the VCM.
3.3. Models for the Estimation of Product Innovation Target Income
Analyzing the target output of DMUs is crucial for DEA-based performance evaluation. Considering the existence of both desirable and undesirable outputs in this study, an output optimization model of the objective function can be constructed to independently estimate the target income of commercial banks’ product innovation. According to the relationship between commercial banks’ product innovation income and associated risks, two models—Model (3) and Model (4)—are proposed for the estimation of product innovation target income.
In Model (3), the optimal target can be obtained by calculating the optimal and . is the rate of change of product innovation income and non-performing loans. In this study, the values of product innovation income and potential credit risk cannot be negative (i.e., must be a positive number). The optimal output obtained through Model (3) can represent the anticipated goals of bank operations. In this study, it can be seen as the target income of commercial banks’ product innovation.
Model (4) ignores the synchronous relationship between product innovation income and risks. In other words, the growth of commercial banks’ product innovation income could also be realized by optimizing risk management techniques. Since credit risk control is an important instrument for commercial banks to realize anticipated goals, the ratio of potential credit risk to product innovation income optimization should be less than the actual rate of risk management technique optimization (). The constraint is therefore placed on Model (4). Other variables and constraints in Model (4) are the same as those in Model (3).
As discussed above, in the VCM, the added value of commercial banks’ product innovation income is mainly influenced by risk management techniques and the scale of product innovation; while in the FCM, the latter is the only influential factor. Therefore, the gap between the added values of product innovation income in the VCM and FCM can reflect the profit generated by the optimization of risk management techniques. This is shown by Formulas (5)–(7).
In the Formulas (5)–(7), is the product innovation target income in the VCM; and means the target income in the FCM. and represent the added values of product innovation income in the FCM and VCM, respectively. As mentioned above, could be regarded as the innovation income brought about by optimizing risk management techniques. The ratio in this paper is defined as RII, which means the ratio of product innovation target income increase to actual income.
To make a clear description, all the acronyms mentioned in this paper are listed in the following nomenclatures.
| Nomenclatures | |
| CNY | Chinese Yuan |
| DEA | Data Envelopment Analysis |
| DMU | Decision-Making Unit |
| FCM | Fixed Correlation Model |
| VCM | Variable Correlation Model |
| RII | The Ratio of Product Innovation Target Income Increase to Actual Income |
4. Empirical Analysis
4.1. Sampling and Data Source
In this paper, 25 commercial banks listed in China’s stock market were selected as samples. According to the categorization of China’s commercial banks, these samples were divided into four groups—state-owned commercial banks, joint-stock commercial banks, urban commercial banks and rural commercial banks—as shown in Table 1. All data were obtained from the annual reports released by these listed commercial banks. Related descriptive statistics are shown in Table 2.
4.2. Product Innovation Performance Analysis
Based on the data of the 25 commercial banks in 2013, 2015 and 2017, their product innovation performance values in specific years can be obtained through Models (1) and (2). The results are shown in Figure 2. The efficiency change of the four types of commercial banks during the observation period can be found in Figure 3.
It can be discovered that the average efficiency of the 25 banks was 0.7665 in 2013 in the FCM. The efficiency of joint-stock banks was at the highest level, followed by state-owned banks. Their efficiency values, 0.9218 and 0.8722, respectively, were higher than those of urban commercial banks (0.7755) and rural commercial banks (0.3996). Among joint-stock banks, five (PAB, SPDB, CMBC, IB and CEB) were efficient in the DEA model; while HXB was the only one in the group that had an efficiency value (0.5248) lower than the yearly average. During the period, the efficiency value of HXB was the lowest among all joint-stock banks, indicating that its product innovation performance was not yet on par with its counterparts in this group. Among state-owned banks, the BCM and the BC had efficiency values of 0.6067 and 0.7545 respectively. The other banks in this group all had an efficiency value of 1.
The efficiency values of joint-stock and urban commercial banks were consistently on the rise during the observed period, while those of state-owned banks took on an opposite trend. The efficiency values of the four groups of banks during the observed period in the FCM are shown in Figure 3a. In 2017, the efficiency value of joint-stock banks was 0.9681 and their innovation performance remained in the leading position; whereas urban commercial banks’ product innovation efficiency value had been rising for all three years under observation, overtaking that of state-owned banks (0.7215) to reach 0.8836 in 2017. In the VCM, the same conclusions apply. The efficiency value of state-owned banks under this model was slightly higher than that of their joint-stock counterparts in 2013, but assuming a trend similar to the FCM. This can be seen in Figure 3b.
As mentioned in this article, the difference between the FCM and the VCM is whether to consider the synchronous relationship between credit risk and product innovation income. In order to analyze this relationship, this article presents the scatter plots of commercial bank product innovation revenue and risk in 2013, 2015 and 2017, as shown in Figure 4. The data on the ordinate axis represent product innovation revenue, and the data on the abscissa axis represent anticipated non-performing loans. Obvious linear relationships are observed in the scatter plots below. Therefore, the rationality of the assumptions in the FCM model proposed in this paper is also verified.
4.3. Analyzing the Target Income of Commercial Banks’ Product Innovation
Analyzing the target output of DMUs is crucial for DEA-based performance evaluation. In this paper commercial banks’ product innovation target income in the FCM and VCM can be obtained by using Model (3), Model (4). Added values of income in the FCM and VCM can be calculated using Formulas (5) and (6), respectively. The results are shown in Table 3.
In Table 3, the 25 selected commercial banks differ significantly in the added value of product innovation income. Since product innovation income changes in the same trend with the associated credit risk, it is found that the optimized product innovation income is lower than the actual income. In terms of income changes, although the values of most state-owned banks were positive, a few still saw a decline in income, e.g., the BCM (−5.300, −16.441, −2.966). This is different from what was observed in joint-stock and urban commercial banks. In the VCM, the values of the 25 selected banks’ income change were all above 0, implying that enhancing commercial banks’ risk management ability can effectively raise their product innovation income.
Figure 5a,b show the RII values in the FCM and VCM, respectively, and Figure 6 shows the average RII values of different types of banks during the observed period. Average RII of four types of commercial banks in 2013, 2015 and 2017 can be found in Table 4. According to Figure 5a, in the FCM, the average rates of change of joint-stock and urban commercial banks’ product innovation income were all below 0, indicating that reducing the scale of product innovation may lead to the reduction of both the income and the credit risk associated with innovation. During the observed period, rural commercial banks had the highest RII. Although the average RII of state-owned banks was lower than that of rural banks, the former was apparently on an upward trajectory. Among rural commercial banks, the RII of WXRB was the highest, standing at 200.27%, followed by CSRB’s 122.20%. Among state-owned banks, ABC had the greatest RII increase. This indicates that commercial banks can scale up product innovation by strengthening their product innovation capability.
In the VCM, the RIIs of the four groups of banks were all above 0, mainly because the impact of banks’ risk management ability was not considered. Rural commercial banks had an average RII of 327.58% during the observed period, the highest among all four groups, while the average RIIs of urban, state-owned and joint-stock commercial banks were 62.62%, 46.23% and 14.53%, respectively. Therefore, banks with an RII above 0 can increase the scale of product innovation to generate more income, while those with an RII below 0 should properly control the scale of product innovation.
4.4. Findings and Discussions
This section analyzed the data of 25 selected listed Chinese commercial banks between 2013 and 2017 and discussed their product innovation performance using the proposed DEA-based model. Findings of the empirical analysis are as follows: (1) the four groups of commercial banks differed significantly in their product innovation performance between 2013 and 2017. Among them, joint-stock commercial banks had the best innovation performance, while rural commercial banks had the lowest performance value. (2) During the observed period, the efficiency values of joint-stock and urban commercial banks were consistently on the rise, while those of state-owned banks were on a downward trajectory. (3) Restrained by the existing risk management ability, joint-stock and urban commercial banks need to control the scale of product innovation and subsequently reduce related income to boost performance. Upgrading the risk management ability can effectively lift product innovation income.
According to the research conclusions, the following management suggestions are proposed for the innovation and development of commercial banks: (1) Rural commercial banks should further increase the importance and investment of product innovation, optimize resource allocation, expand the scale of innovative product business, and enhance product innovation capabilities; (2) under the current level of risk, joint-stock commercial banks and city commercial banks need to properly control the scale of product innovation to control product innovation risks; (3) all types of commercial banks should increase their risk management capabilities and use platforms and tools such as the Internet and big data to strengthen their risk management capabilities.
5. Conclusions
This study proposes a DEA-based non-parametric model to estimate the performance and target income of Chinese commercial banks’ product innovation. The product innovation performance of commercial banks is defined as the conversion efficiency of input and output. The credit risk of product innovation of banks is considered as an undesirable output and incorporated in the performance evaluation system. The main contribution of this article lies in the fact that the FCM and VCM are constructed for evaluating commercial banks’ product innovation performance. In addition, an output optimization model of the objective function is also constructed to estimate the target income of commercial banks’ product innovation in the FCM and VCM. Finally, the proposed model is applied to Chinese listed commercial banks for estimating the performance and target income of product innovation. Some management suggestions have also been put forward to help the sustainable development of commercial banks.
Generally, three further research directions can be drawn from this research. Firstly, the Malmquist index can be introduced in a dynamic analysis of the performance of banks’ product innovation. Secondly, it will be interesting to discuss the impact of risk on bank product innovation performance if product innovation risk is uncertain. Thirdly, some suitable methods can be proposed to select data for estimating the performance under the big data environment.
Author Contributions
Conceptualization, L.S. and T.X.; data curation, Y.S.; funding acquisition, J.Y.; methodology, T.X.; supervision, J.Y.; writing—original draft, T.X.; writing—review and editing, L.S. All authors have read and agreed to the published version of the manuscript.
Funding
This research was funded by National Natural Science Foundation of China, grant number 71671125.
Conflicts of Interest
The authors declare no conflict of interest.
References
- Norden, L.; Silva Buston, C.; Wagner, W. Financial innovation and bank behavior: Evidence from credit markets. Soc. Sci. Electron. Publ. 2014, 43, 130–145. [Google Scholar] [CrossRef]
- Wang, F.; Huang, M.; Shou, Z. Business expansion and firm efficiency in the commercial banking industry: Evidence from the US and China. Asia Pac. J. Manag. 2015, 32, 551–569. [Google Scholar] [CrossRef]
- Zhao, J.H.; Min, D.; Mathematics, D.O.; University, L.N. Empirical analysis on the influence factors of commerical bank’s intermediary business Innovation—A case of CCB. Technol. Dev. Enterp. 2015, 22, 27. [Google Scholar]
- Roberts, P.W.; Amit, R. The Dynamics of Innovative Activity and Competitive Advantage: The Case of Australian Retail Banking, 1981 to 1995. Organ. Sci. 2003, 14, 107–122. [Google Scholar] [CrossRef]
- Lerner, J.; Tufano, P. The Consequences of Financial Innovation: A Counterfactual Research Agenda. NBER Work. Pap. 2011, 3, 41–85. [Google Scholar]
- Lepetit, L.; Nys, E.; Rous, P.; Tarazi, A. The Provision of Services, Interest Margins and Loan Pricing in European Banking. Ssrn Electron. J. 2006. [Google Scholar] [CrossRef] [Green Version]
- Zhu, J.; Price, C.C.; Zhu, J.; Hillier, F.S. Data Envelopment Analysis: A Handbook of empirical Studies and Applications; Springer: Berlin, Germany, 2015; Volume 238, pp. 267–280. [Google Scholar]
- Xie, L.; Chen, C.L.; Yu, Y.H. Dynamic Assessment of Environmental Efficiency in Chinese Industry: A Multiple DEA Model with a Gini Criterion Approach. Sustainability 2019, 11, 2294. [Google Scholar] [CrossRef] [Green Version]
- Yang, W.X.; Li, L.G. Analysis of Total Factor Efficiency of Water Resource and Energy in China: A Study Based on DEA-SBM Model. Sustainability 2017, 9, 1316. [Google Scholar] [CrossRef] [Green Version]
- Calmès, C.; Théoret, R. The impact of off-balance-sheet activities on banks returns: An application of the ARCH-M to Canadian data. J. Bank. Financ. 2010, 34, 1719–1728. [Google Scholar] [CrossRef]
- Aktan, B.; Chan, S.-G.; Zikovic, S.; Evrim-Mandaci, P. Off-Balance Sheet Activities Impact on Commercial Banks Performance: An Emerging Market Perspective. Econ. Res. 2013, 26, 117–132. [Google Scholar] [CrossRef] [Green Version]
- Chateau, J.P.D. Marking-to-model credit and operational risks of loan commitments: A Basel-2 advanced internal ratings-based approach. Int. Rev. Financ. Anal. 2009, 18, 260–270. [Google Scholar] [CrossRef]
- Vlontzos, G.; Niavis, S.; Manos, B. A DEA approach for estimating the agricultural energy and environmental efficiency of EU countries. Renew. Sustain. Energy Rev. 2014, 40, 91–96. [Google Scholar] [CrossRef]
- Cai, H.; Liang, L.; Tang, J.; Wang, Q.; Wei, L.; Xie, J. An Empirical Study on the Efficiency and Influencing Factors of the Photovoltaic Industry in China and an Analysis of Its Influencing Factors. Sustainability 2019, 11, 6693. [Google Scholar] [CrossRef] [Green Version]
- Wang, K.; Huang, W.; Wu, J.; Liu, Y.-N. Efficiency measures of the Chinese commercial banking system using an additive two-stage DEA. Omega 2014, 44, 5–20. [Google Scholar] [CrossRef]
- Liu, W.; Zhou, Z.; Ma, C.; Liu, D.; Shen, W. Two-stage DEA models with undesirable input-intermediate-outputs. Omega 2015, 56, 74–87. [Google Scholar] [CrossRef]
- Ohsato, S.; Takahashi, M. Management Efficiency in Japanese Regional Banks: A Network DEA. Procedia Soc. Behav. Sci. 2015, 172, 511–518. [Google Scholar] [CrossRef] [Green Version]
- Bian, Y.; He, P.; Xu, H. Estimation of potential energy saving and carbon dioxide emission reduction in China based on an extended non-radial DEA approach. Energy Policy 2013, 63, 962–971. [Google Scholar] [CrossRef]
- Gattoufi, S.; Amin, G.R.; Emrouznejad, A. A new inverse DEA method for merging banks. IMA J. Manag. Math. 2014, 25, 73–87. [Google Scholar] [CrossRef] [Green Version]
- Wei, Q.; Zhang, J.; Zhang, X. An inverse DEA model for inputs/outputs estimate. Eur. J. Oper. Res. 2000, 121, 151–163. [Google Scholar] [CrossRef]
- Fukuyama, H.; Matousek, R. Modelling bank performance: A network DEA approach. Eur. J. Oper. Res. 2017, 259, 721–732. [Google Scholar] [CrossRef]
- Wenqiang, Y.; Jihui, G.; Hua, L. The Internal Driving Force of Commercial Bank Transformation and Upgrading—Based on the Perspective of Innovation Efficiency. Financ. Forum 2017, 22, 13. [Google Scholar]
- Lyu, X. The Evaluation of the Innovation Capability of A-Share Listed Banks under the Impact of Internet Banking: Based on Generalized DEA Model of Panel Data. J. Account. Econ. 2016, 23, 253–271. [Google Scholar]
- Rossignoli, B.; Arnaboldi, F. Financial innovation: Theoretical issues and empirical evidence in Italy and in the UK. Int. Rev. Econ. 2009, 56, 275–301. [Google Scholar] [CrossRef]
- Wen, L. Research on the Relationship between Internet Finance and Commercial Bank’s Innovation Performance—Based on the Analysis of MOA Theory. Financ. Theory Pract. 2017, 38, 6. [Google Scholar]
- Zeng, W.; Chen, S.; Zhou, Z.B. The Impact of Financial Supervision on Commercial Bank’s Product Innovation-the Research Based on Two-stage DEA Model. Chin. J. Manag. Sci. 2016, 24, 1–7. [Google Scholar]
- Linyun, C.; Sitai, Y. Research on Intermediary Business and Business Performance of Commercial Banks. Times Financ. 2017, 38, 2. [Google Scholar]
- Mottaleb, K.A.; Sonobe, T. What determines the performance of small enterprises in developing countries? Evidence from the handloom industry in Bangladesh. Int. J. Bus. Glob. 2013, 10, 39–55. [Google Scholar] [CrossRef] [Green Version]
- Heffernan, S.A.; Fu, X.; Fu, M. The Determinants of Financial Innovation. Soc. Sci. Electron. Publ. 2009. [Google Scholar] [CrossRef]
- Yang, H.L.; Pollitt, M. The necessity of distinguishing weak and strong disposability among undesirable outputs in DEA: Environmental performance of Chinese coal-fired power plants. Energy Policy 2010, 38, 4440–4444. [Google Scholar] [CrossRef]
- Fare, R.; Grosskopf, S.; Pasurka, C. Effects on relative efficiency in electric power generation due to environmental controls. Resour. Energy 1986, 8, 167–184. [Google Scholar] [CrossRef]
Figure 1.
Commercial Bank Product Innovation Process Considering Risk Impact.

Figure 2.
Product Innovation Performance in 2013, 2015 and 2017.
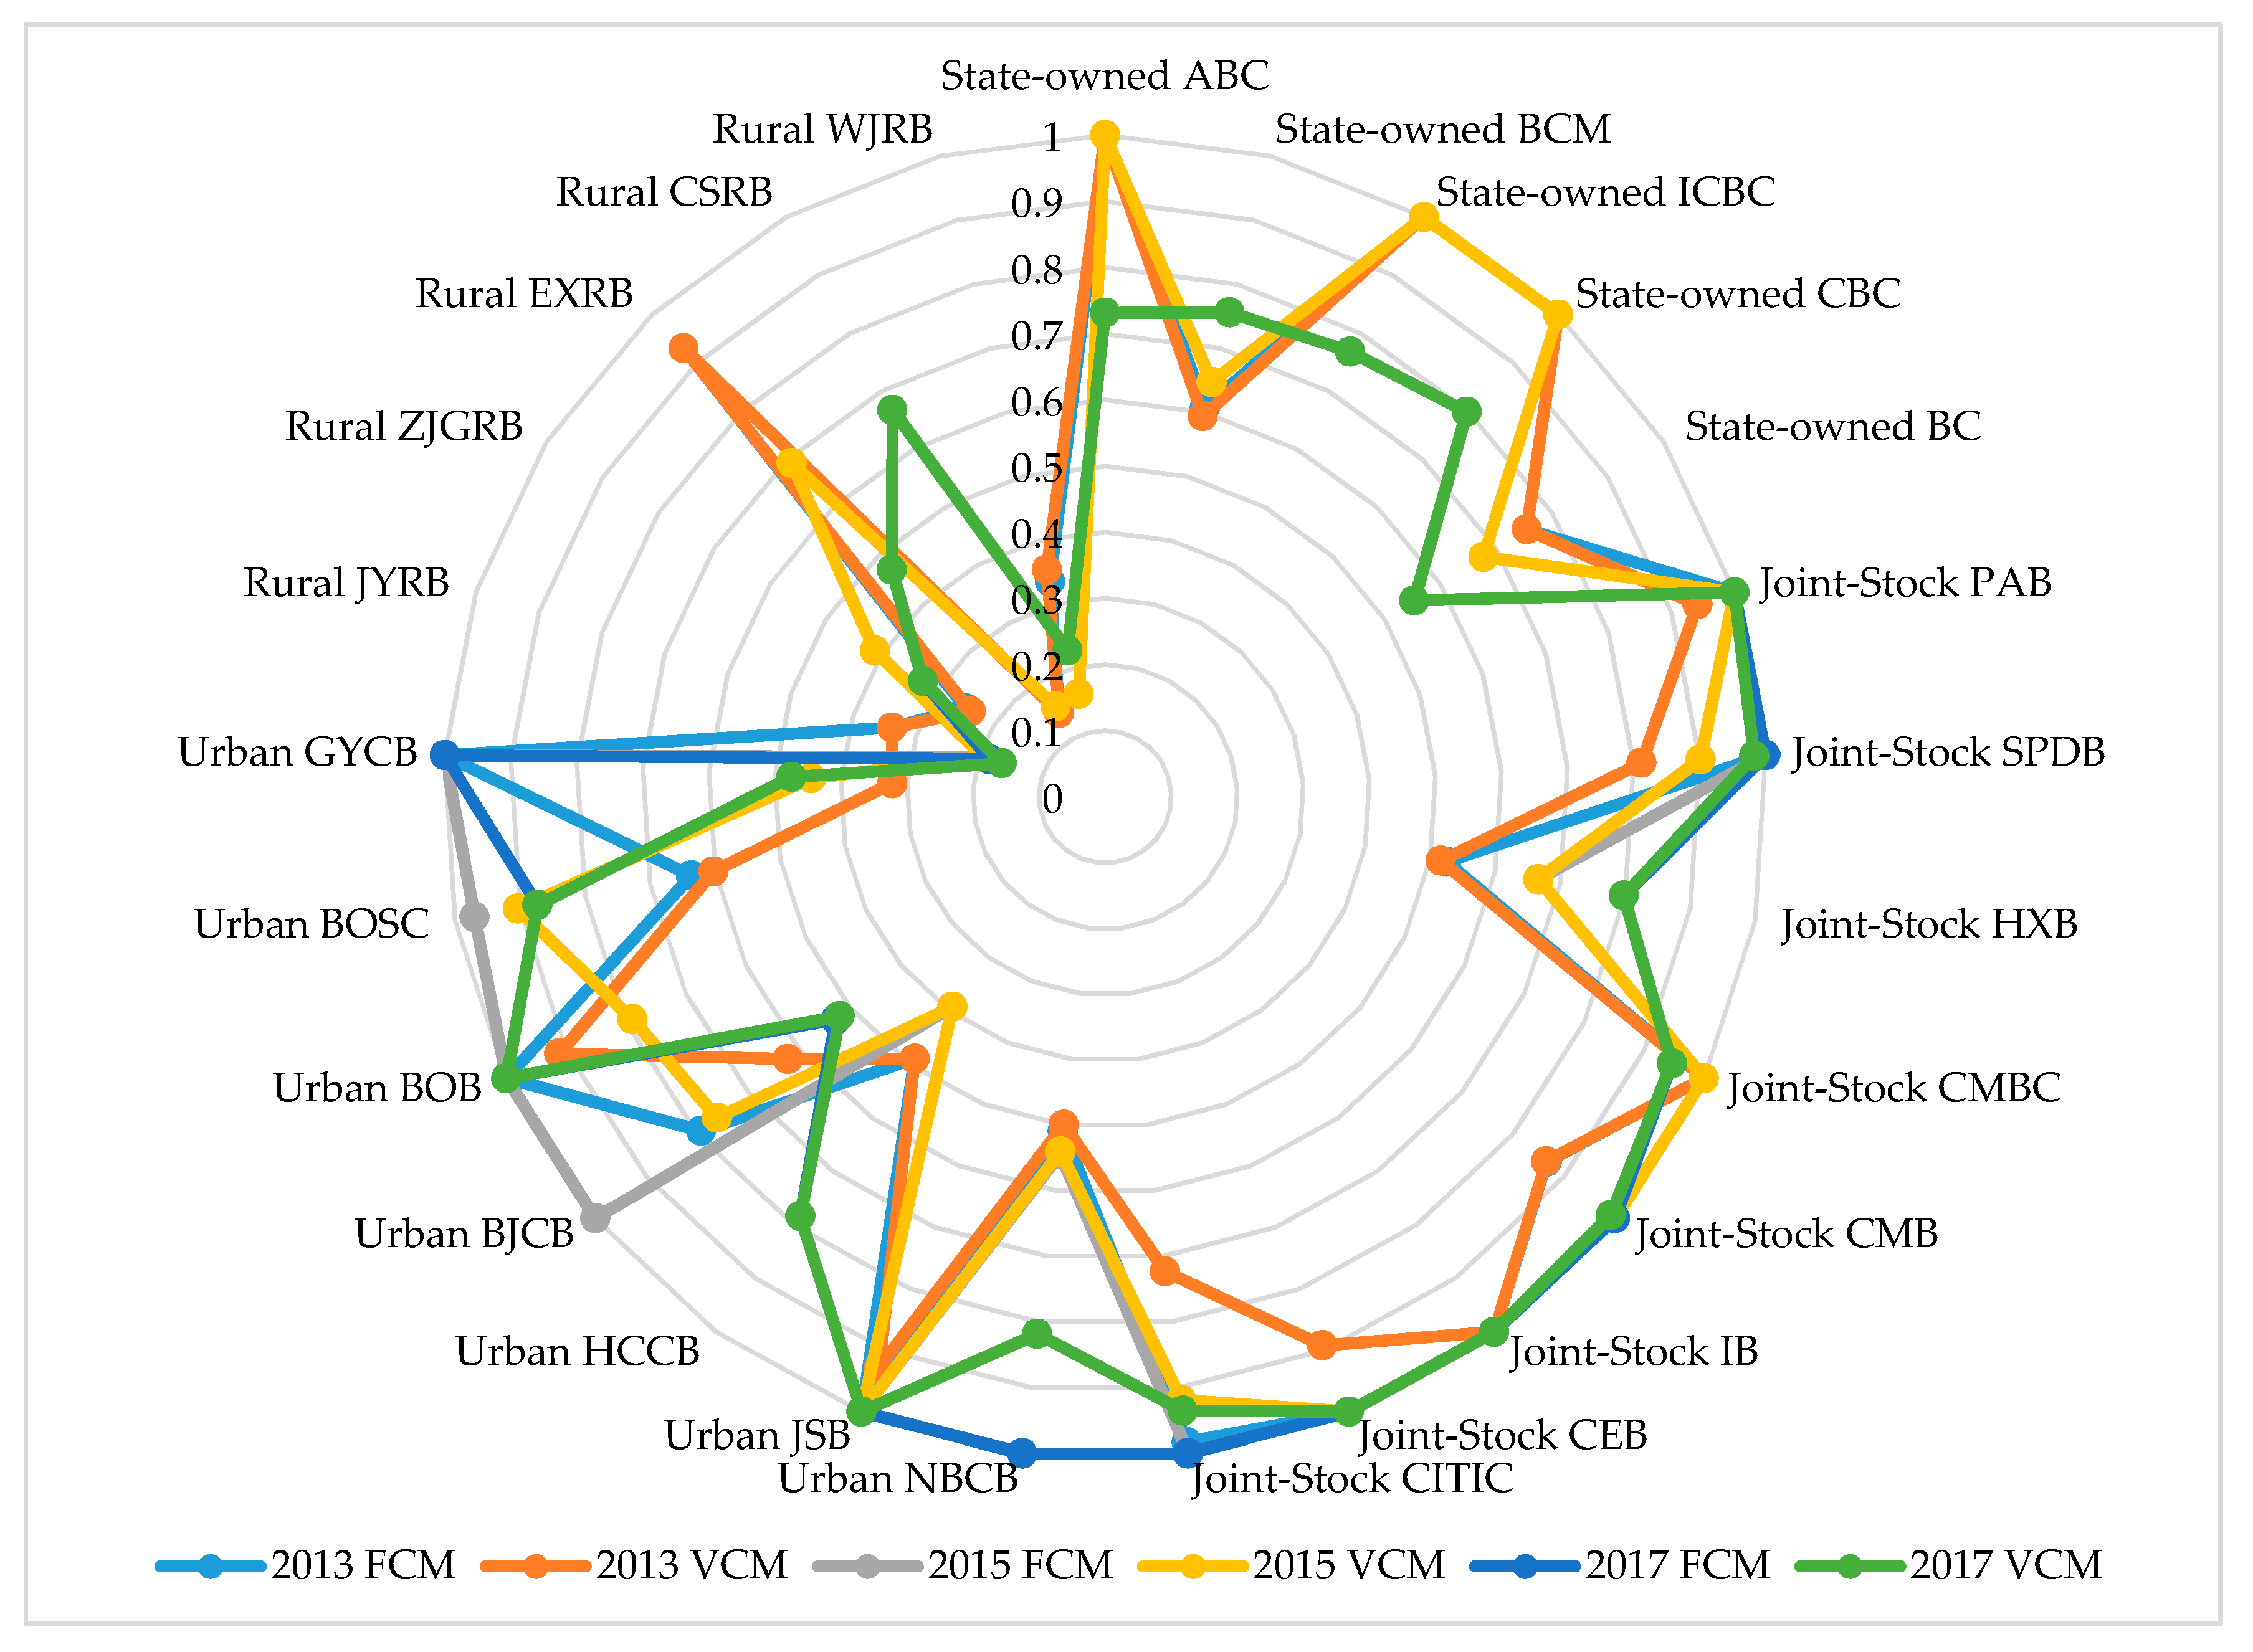
Figure 3.
Innovation Performance changes in the FCM (a) and VCM (b) in 2013, 2015 and 2017.
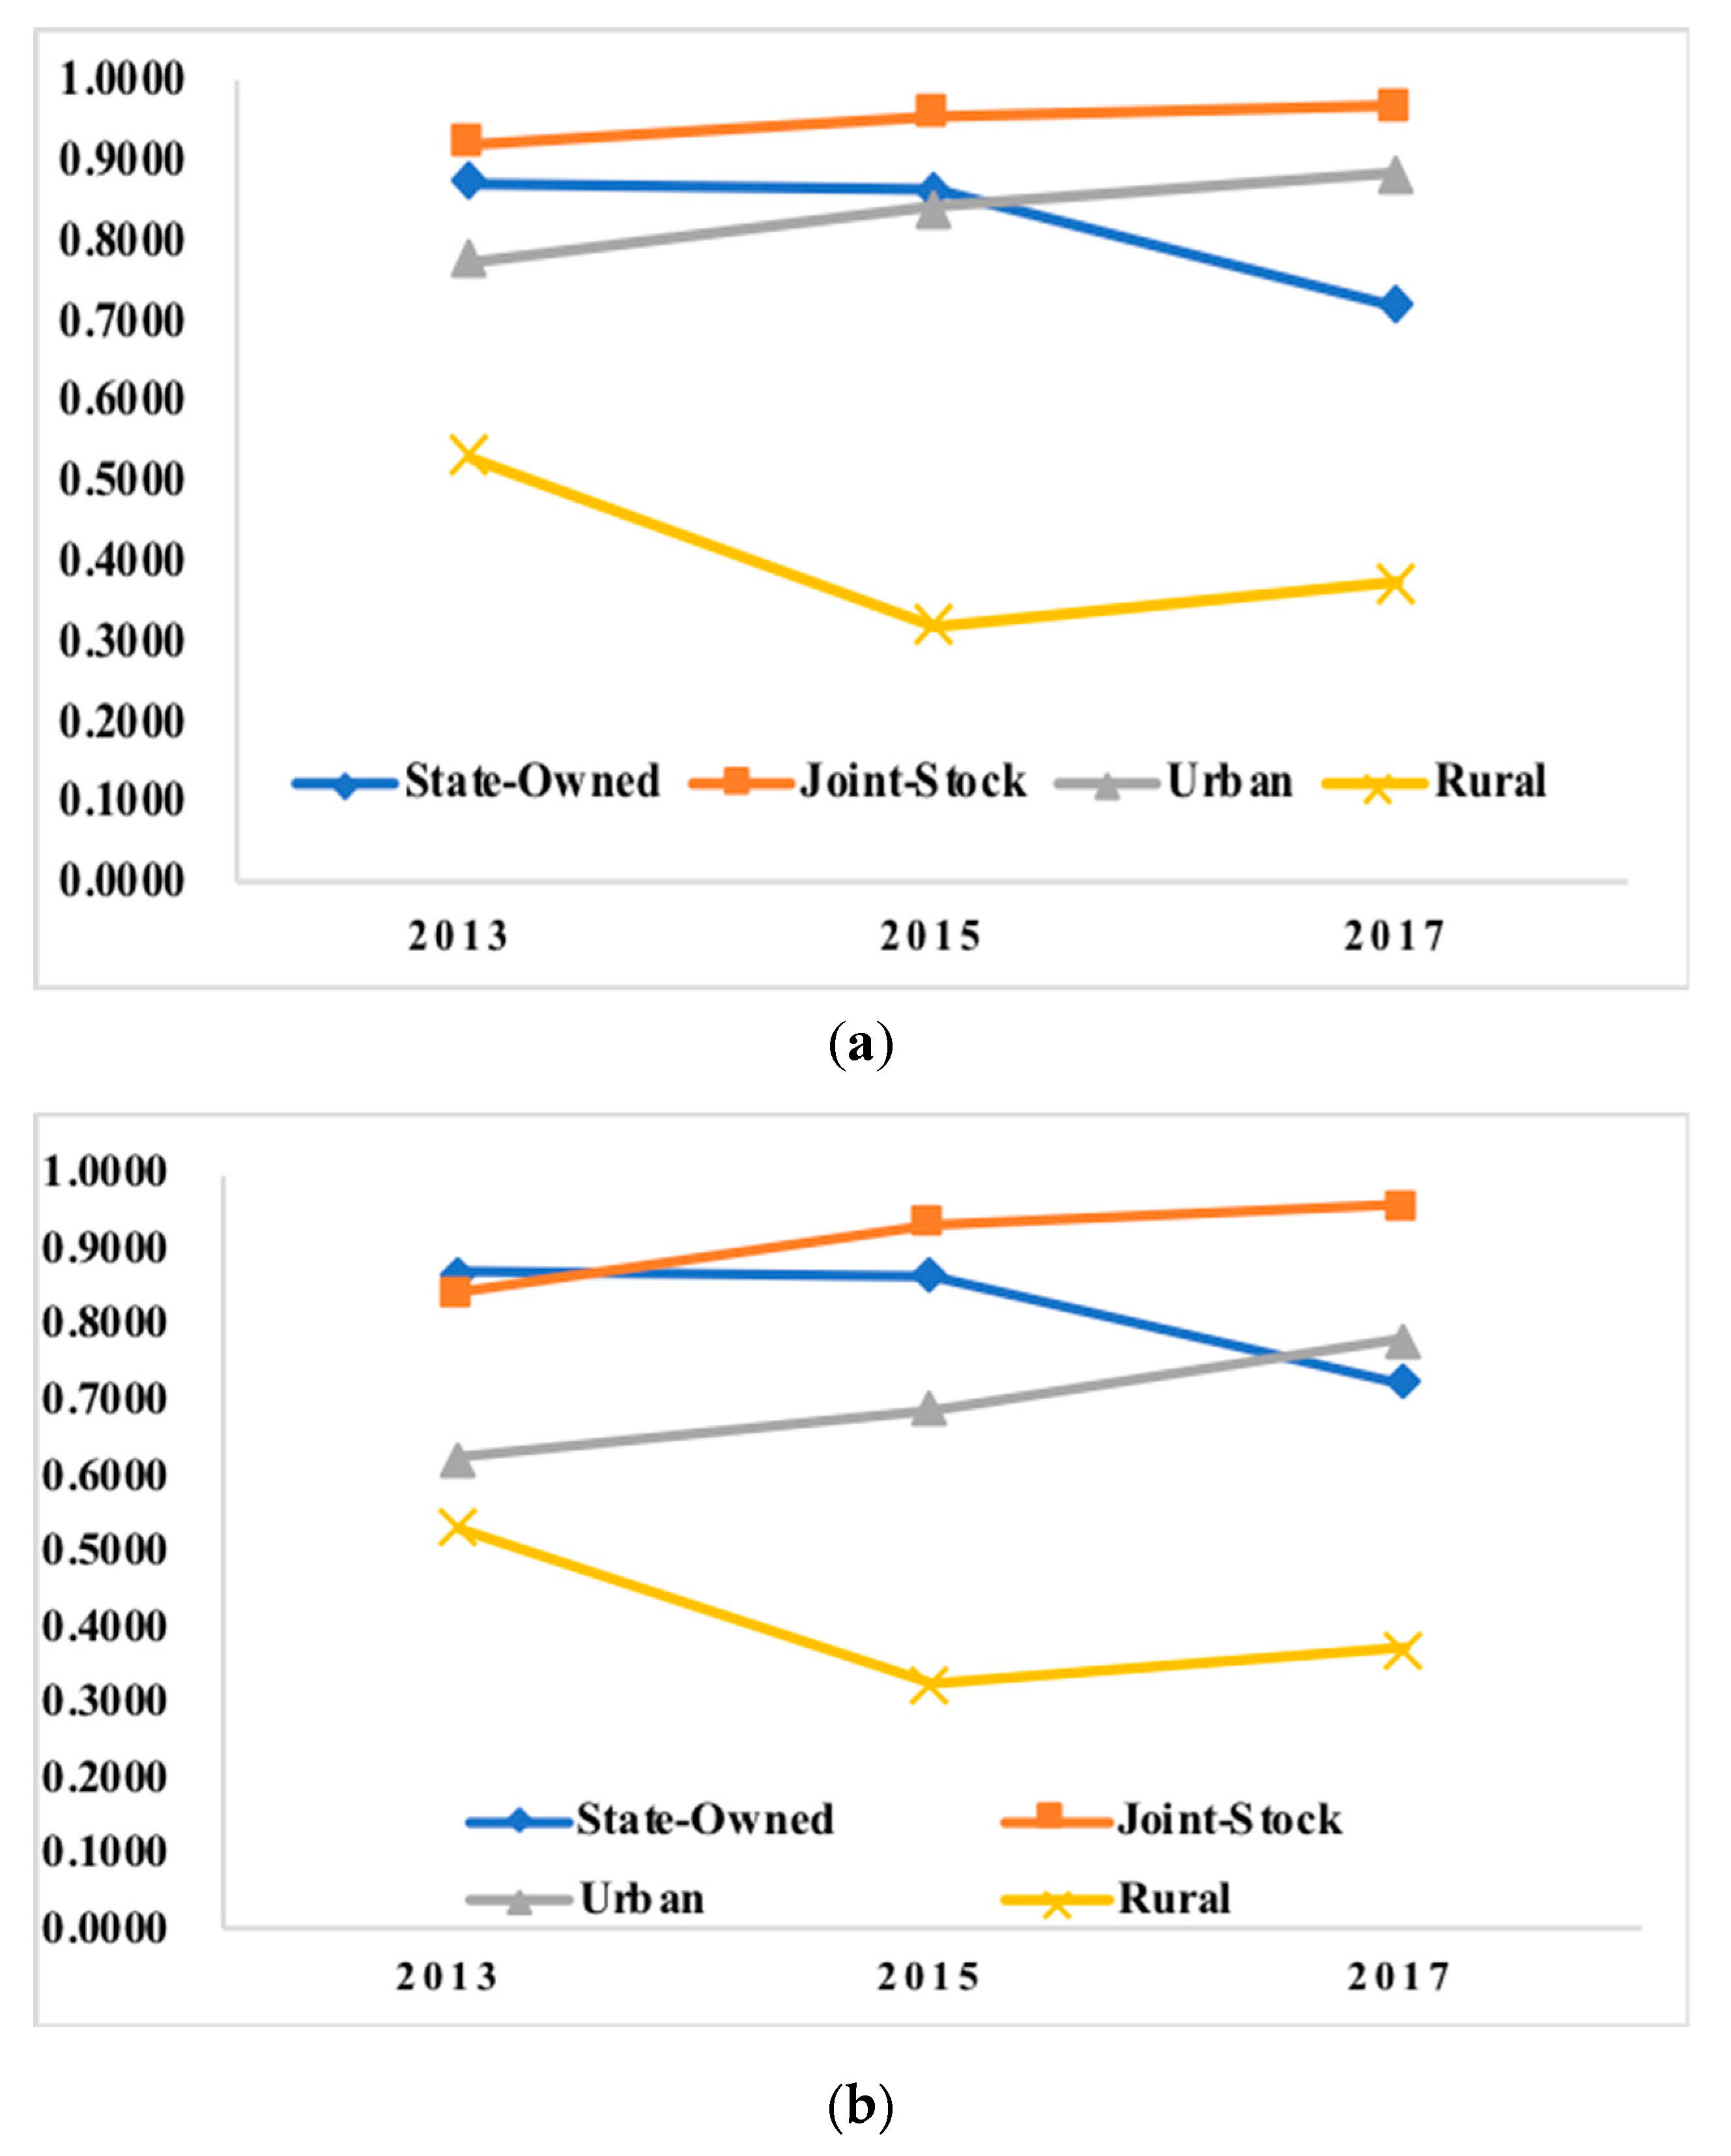
Figure 4.
Relationship between product innovation target income and risk of commercial banks in 2013 (a), 2015 (b), and 2017 (c).
Figure 4.
Relationship between product innovation target income and risk of commercial banks in 2013 (a), 2015 (b), and 2017 (c).
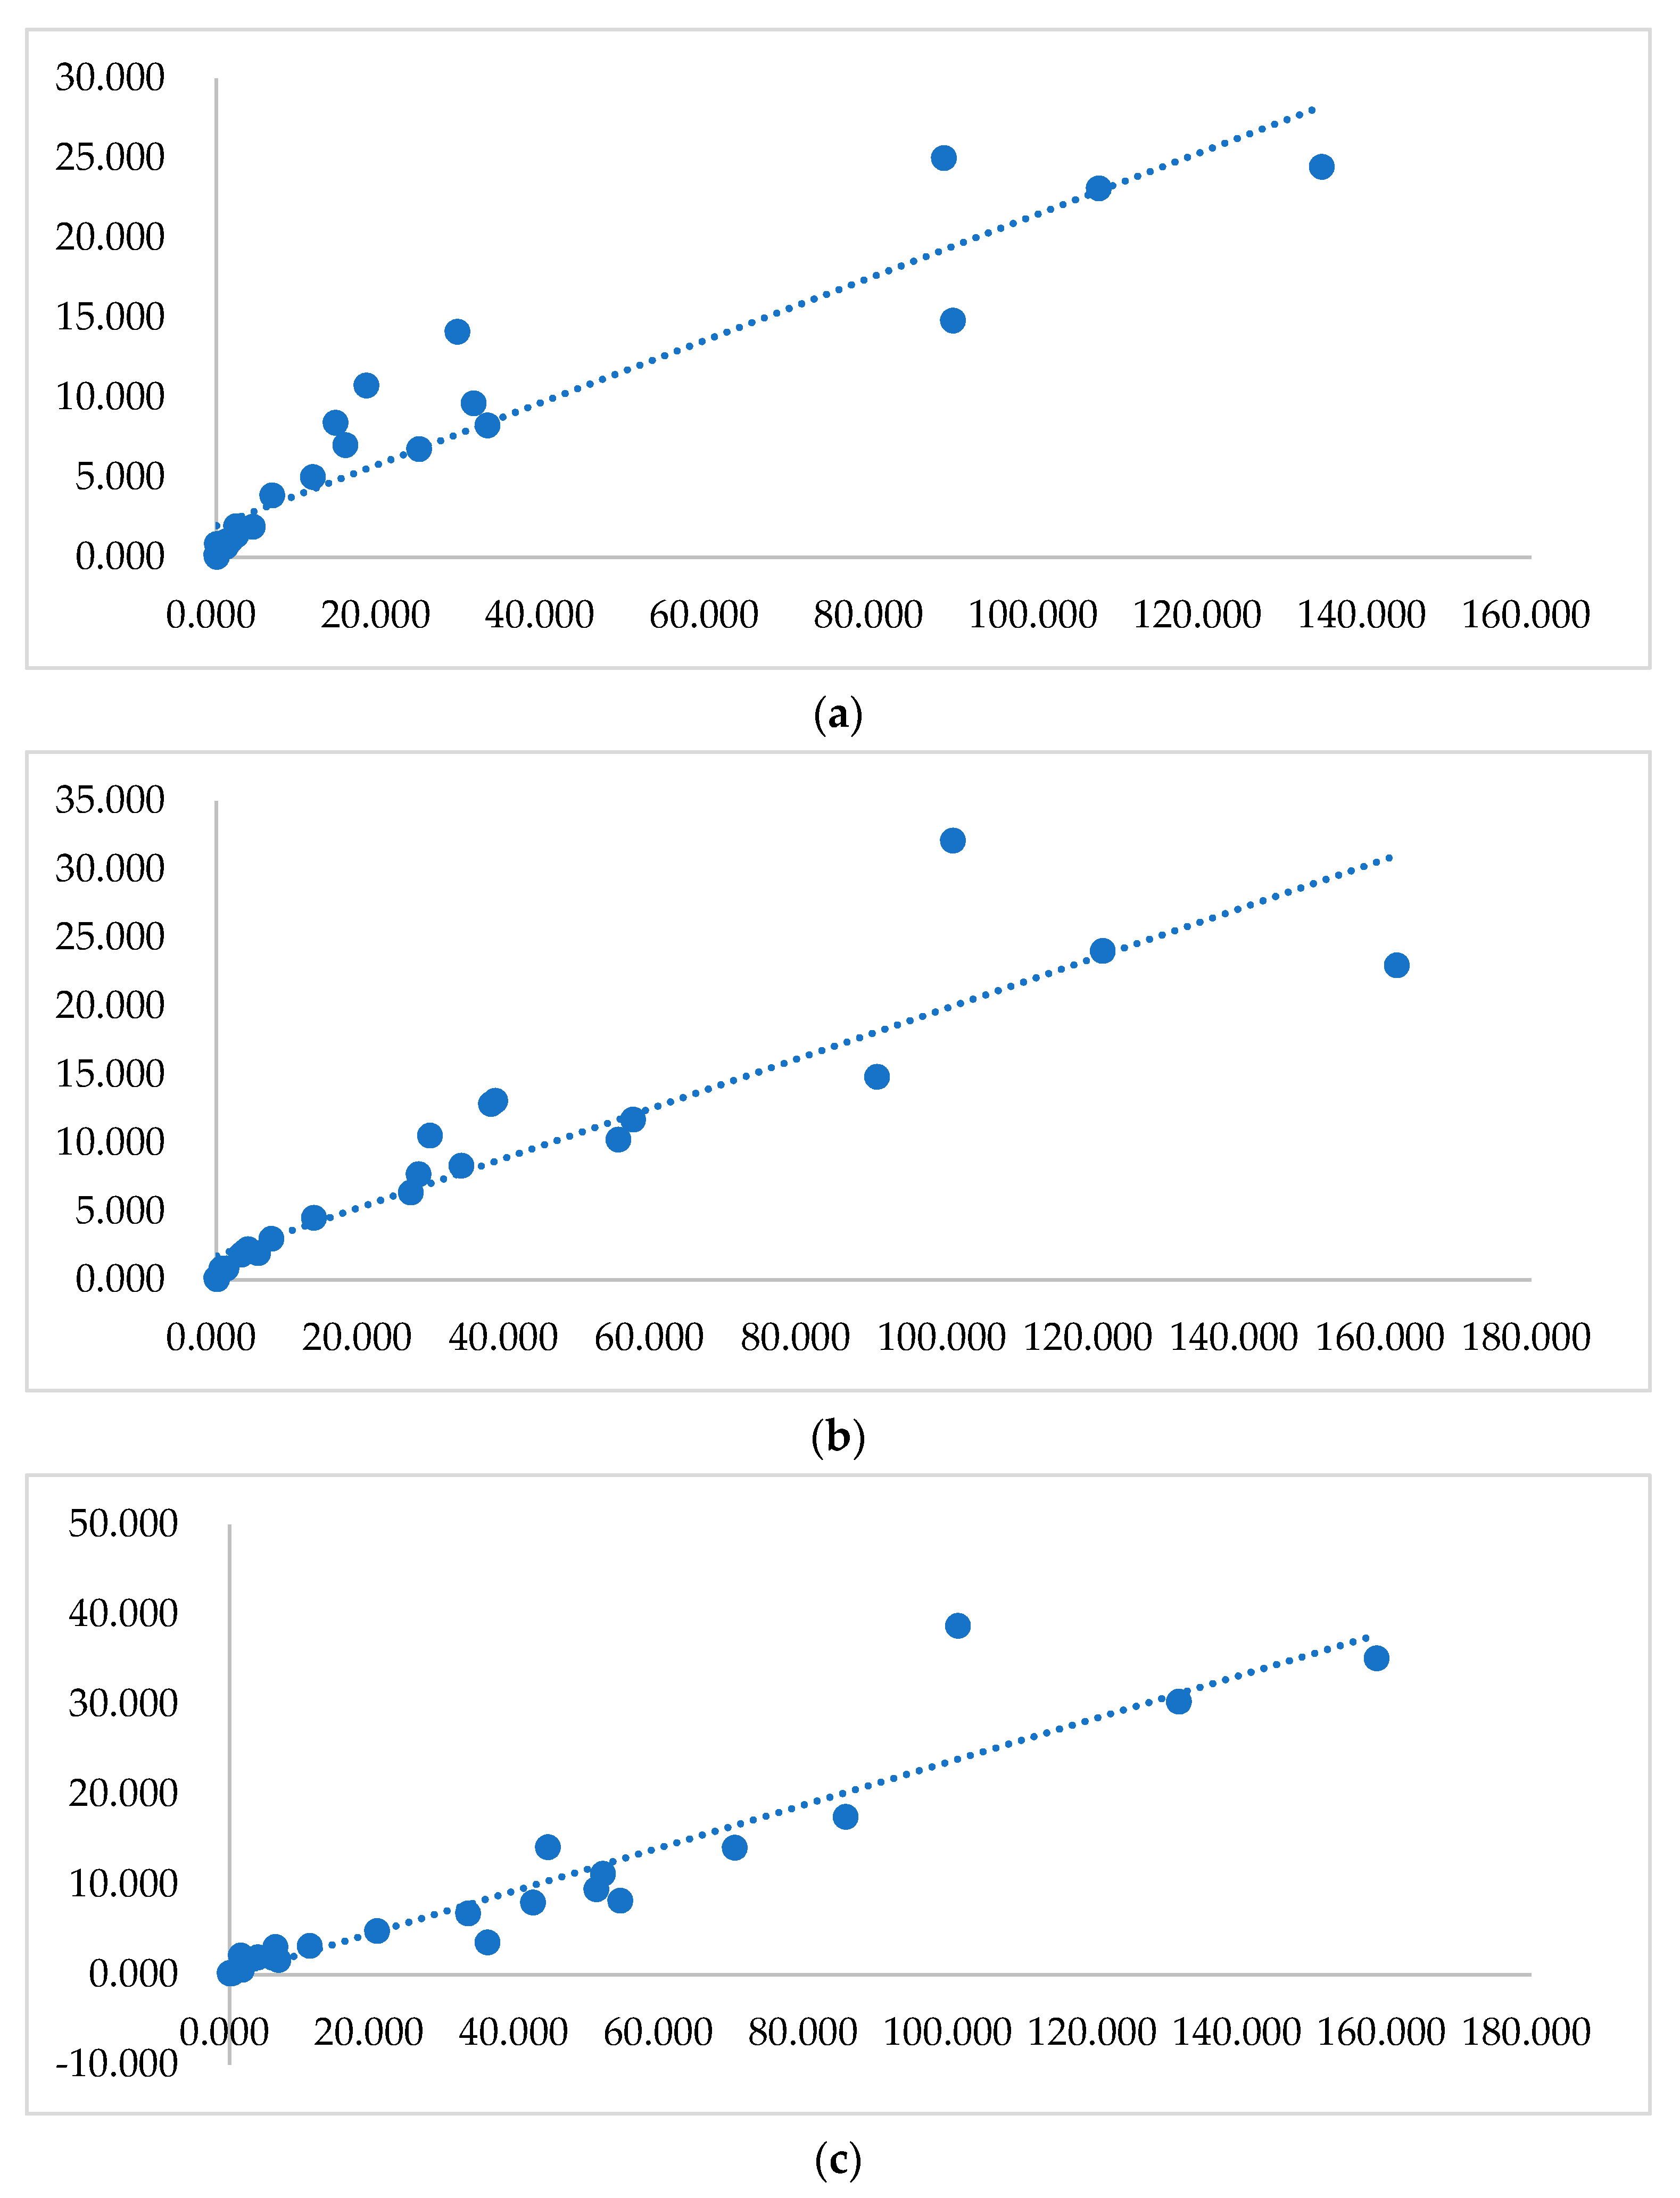
Figure 5.
RII of each bank in the FCM (a) and VCM (b) in 2013, 2015 and 2017.
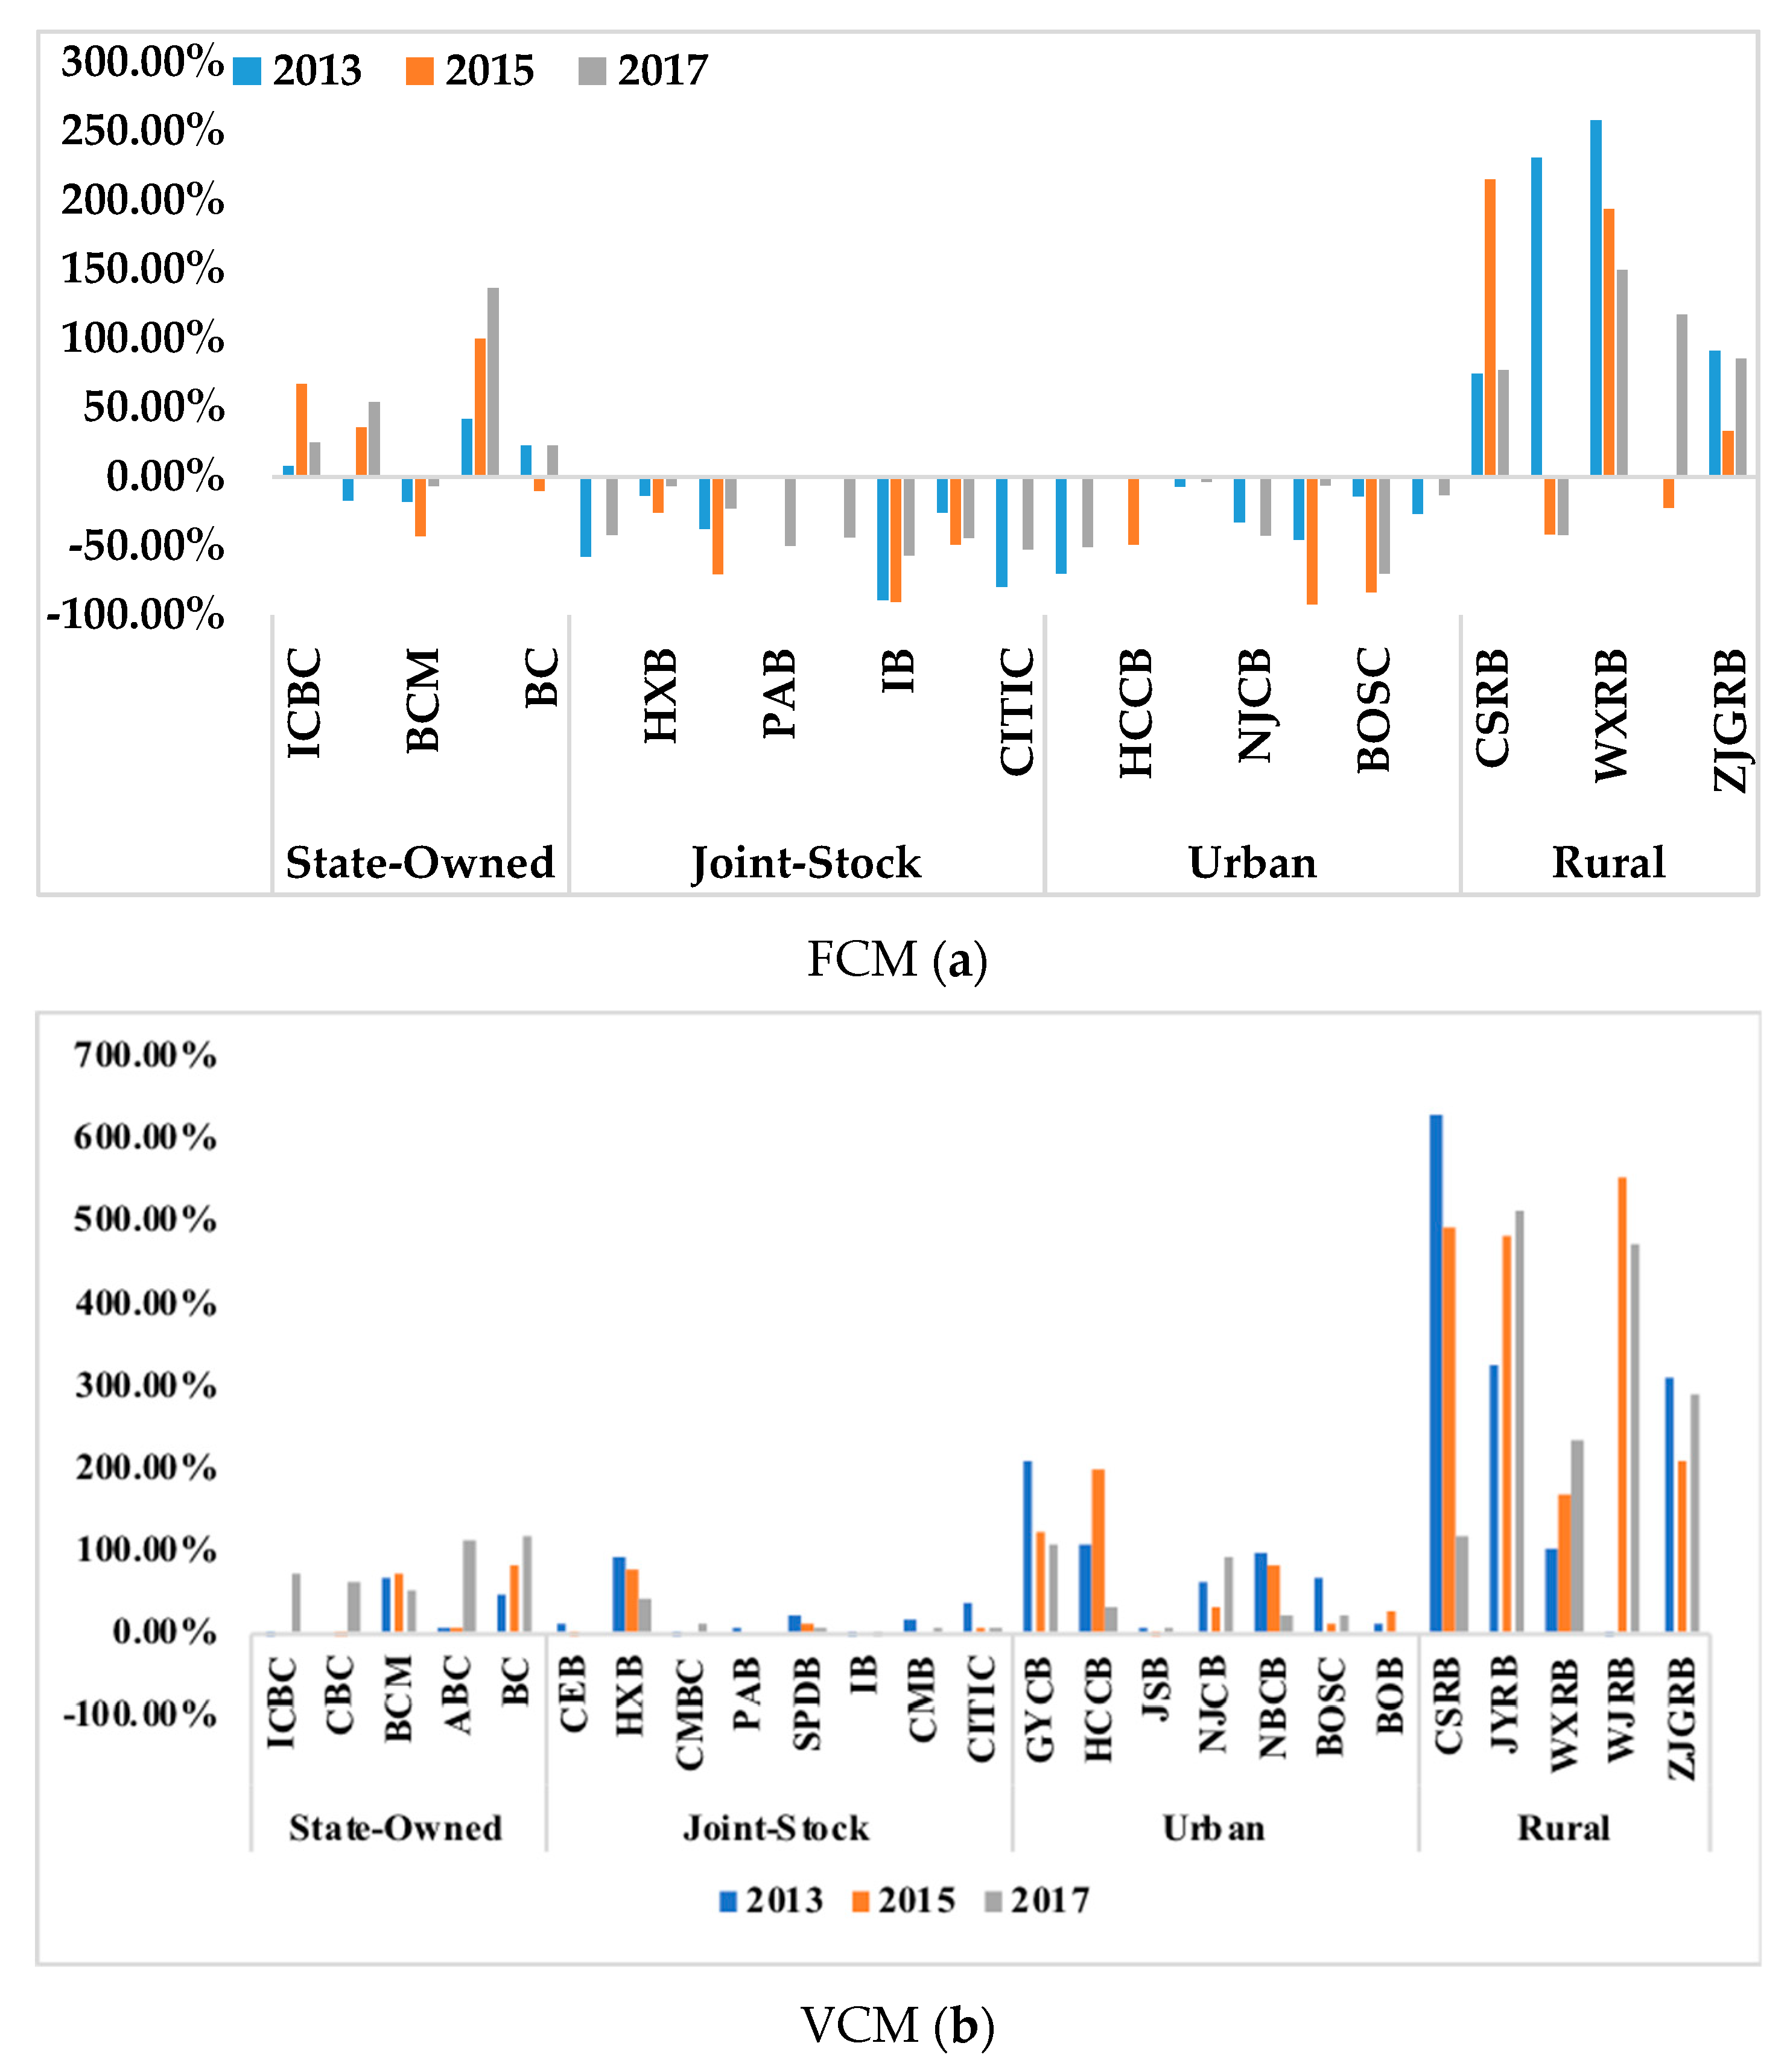
Figure 6.
Added-Value of Product Innovation Income after Risk Management Ability Optimization.


Table 1.
Sample Commercial Banks and Categorization.
| Bank Type | Bank Name |
|---|---|
| State-Owned | Industrial and Commercial Bank of China (ICBC), Agricultural Bank of China (ABC), Bank of China (BC), China Construction Bank (CBC), Bank of Communications (BCM) |
| Joint-Stock | China Merchants Bank (CMB), Shanghai Pudong Development Bank (SPDB), China CITIC Bank (CITIC), China Everbright Bank (CEB), Huaxia Bank (HXB), China Minsheng Bank (CMBC), China Guangfa Bank (CGB), Industrial Bank (IB), Ping An Bank (PAB), China Zheshang Bank (CZB), Evergrowing Bank Bank (EB), China Bohai Bank (CBB) |
| Urban | Bank of Ningbo (NBCB), Bank of Jiangsu (JSB), Bank of Hangzhou (HCCB), Bank of Nanjing (NJCN), Bank of Beijing (BOB), Bank of Shanghai (BOSC), Bank of Guiyang (GYCB) |
| Rural | Jiangyin Rural Commercial Bank (JYRB), Rural Commercial Bank of Zhangjiagang (ZJGRB), Wuxi Rural Commercial Bank (WXRB), Changshu Rural Commercial Bank (CSRB), Wujiang Rural Commercial Bank (WJRB) |
Table 2.
Descriptive Statistics.
| Year | Parameter | Fixed Assets | No. of Employees Holding Bachelor’s Degree and above | Handling Charge and Commission Expense | Handling Charge and Commission Income | Anticipated Non-Performing Loans |
|---|---|---|---|---|---|---|
| Unit | 109 CNY | 103 | 109 CNY | 109 CNY | 109 CNY | |
| 2013 | Minimum | 0.335 | 0.703 | 0.001 | 0.050 | 0.019 |
| Maximum | 158.968 | 221.393 | 12.224 | 134.550 | 24.998 | |
| Average | 29.937 | 49.639 | 1.769 | 24.815 | 6.815 | |
| Standard Deviation | 52.467 | 74.346 | 2.879 | 38.035 | 7.932 | |
| 2015 | Minimum | 0.418 | 0.772 | 0.010 | 0.067 | 0.043 |
| Maximum | 195.401 | 249.961 | 18.279 | 161.670 | 32.100 | |
| Average | 37.834 | 55.985 | 2.628 | 32.851 | 7.700 | |
| Standard Deviation | 62.940 | 82.489 | 4.182 | 43.414 | 8.611 | |
| 2017 | Minimum | 0.626 | 1.080 | 0.023 | 0.077 | 0.079 |
| Maximum | 216.156 | 276.062 | 19.041 | 158.666 | 38.706 | |
| Average | 44.253 | 61.245 | 3.930 | 36.659 | 8.656 | |
| Standard Deviation | 69.497 | 88.953 | 5.175 | 43.816 | 11.065 |
Table 3.
Added values of income in the FCM and VCM in 2013, 2015 and 2017.
| Type | DMU | 2013 | 2015 | 2017 | |||
|---|---|---|---|---|---|---|---|
| State-Owned | ICBC | 10.618 | 29.982 | 108.126 | 130.000 | 39.200 | 74.244 |
| CBC | −18.387 | 0.000 | 43.102 | 69.999 | 71.054 | 84.468 | |
| BCM | −5.300 | 20.112 | −16.441 | 17.588 | −2.966 | 23.977 | |
| ABC | 37.603 | 50.003 | 90.386 | 100.001 | 116.235 | 126.221 | |
| BC | 19.887 | 42.935 | −10.462 | 42.791 | 22.661 | 59.785 | |
| Joint-Stock | CEB | −9.070 | 1.907 | 0.000 | 0.000 | −13.895 | 0.000 |
| HXB | −0.946 | 6.422 | −3.479 | 10.308 | −1.333 | 8.886 | |
| CMBC | −12.470 | 0.002 | −38.745 | 0.000 | −12.337 | 5.689 | |
| PAB | 0.000 | 0.737 | 0.000 | 0.000 | −17.763 | 0.000 | |
| SPDB | 0.000 | 3.366 | 0.000 | 3.201 | −22.272 | 0.886 | |
| IB | −22.065 | 0.004 | −30.398 | 0.000 | −23.944 | 0.002 | |
| CMB | −8.156 | 4.895 | −27.989 | 0.000 | −30.845 | 0.563 | |
| CITIC | −14.538 | 7.005 | 0.000 | 3.292 | −27.074 | 3.566 | |
| Urban | BOB | −3.125 | 0.434 | 0.000 | 0.918 | −5.661 | 0.000 |
| GYCB | 0.000 | 0.246 | −0.713 | 2.881 | 0.000 | 1.771 | |
| HCCB | −0.088 | 1.333 | 0.000 | 0.000 | −0.062 | 0.579 | |
| JSB | −0.803 | 0.188 | 0.000 | 1.078 | −2.571 | 0.000 | |
| NJCB | −0.567 | 0.755 | −4.055 | 3.737 | −0.245 | 3.646 | |
| NBCB | −0.253 | 1.797 | −4.837 | 0.617 | −4.450 | 1.415 | |
| BOSC | −0.670 | 1.642 | 0.000 | 2.022 | −0.886 | 1.403 | |
| Rural | CSRB | 0.050 | 0.226 | 0.228 | 0.522 | 0.367 | 0.560 |
| JYRB | 0.170 | 0.241 | −0.028 | 0.121 | −0.032 | 0.092 | |
| WXRB | 0.276 | 0.312 | 0.356 | 0.413 | 0.294 | 0.464 | |
| WJRB | −0.016 | 0.002 | 0.016 | 0.089 | 0.112 | 0.355 | |
| ZJGRB | 0.046 | 0.157 | 0.034 | 0.215 | 0.120 | 0.410 | |
Table 4.
Average RII of Four Types of Commercial Banks in 2013, 2015 and 2017.
| Type | 2013 | 2015 | 2017 | Average | |
|---|---|---|---|---|---|
| F C M | State-Owned | 7.43% | 29.78% | 46.18% | 27.79% |
| Joint-Stock | −37.95% | −29.46% | −39.81% | −35.74% | |
| Urban | −28.03% | −32.09% | −26.52% | −28.88% | |
| Rural | 130.76% | 75.47% | 77.46% | 94.57% | |
| V C M | State-Owned | 23.37% | 30.84% | 84.49% | 46.23% |
| Joint-Stock | 23.61% | 12.05% | 7.93% | 14.53% | |
| Urban | 80.15% | 67.96% | 39.76% | 62.62% | |
| Rural | 274.52% | 381.80% | 326.43% | 327.58% | |
© 2020 by the authors. Licensee MDPI, Basel, Switzerland. This article is an open access article distributed under the terms and conditions of the Creative Commons Attribution (CC BY) license (http://creativecommons.org/licenses/by/4.0/).
Share and Cite
MDPI and ACS Style
Shao, L.; You, J.; Xu, T.; Shao, Y. Non-Parametric Model for Evaluating the Performance of Chinese Commercial Banks’ Product Innovation. Sustainability 2020, 12, 1523. https://doi.org/10.3390/su12041523
AMA Style
Shao L, You J, Xu T, Shao Y. Non-Parametric Model for Evaluating the Performance of Chinese Commercial Banks’ Product Innovation. Sustainability. 2020; 12(4):1523. https://doi.org/10.3390/su12041523
Chicago/Turabian StyleShao, Luning, Jianxin You, Tao Xu, and Yilei Shao. 2020. "Non-Parametric Model for Evaluating the Performance of Chinese Commercial Banks’ Product Innovation" Sustainability 12, no. 4: 1523. https://doi.org/10.3390/su12041523
Note that from the first issue of 2016, this journal uses article numbers instead of page numbers. See further details here.