Article

The Optimum Performance of Building Integrated Photovoltaic (BIPV) Windows Under a Semi-Arid Climate in Algerian Office Buildings

by
Abdelhakim Mesloub
1,*,
Ghazy Abdullah Albaqawy
1 and
Mohd Zin Kandar
2
1
Department of Architectural Engineering, Ha’il University, Ha’il 2440, Saudi Arabia
2
Department of Architecture, Universiti Sains Islam Malaysia, Nilai, Negeri Sembilan 71800, Malaysia
*
Author to whom correspondence should be addressed.
Sustainability 2020, 12(4), 1654; https://doi.org/10.3390/su12041654
Submission received: 5 January 2020 / Revised: 15 February 2020 / Accepted: 19 February 2020 / Published: 22 February 2020
(This article belongs to the Special Issue Renewable Energy and Energy Saving: Worldwide Research Trends)

Abstract

:
Recently, Building Integrated Photovoltaic (BIPV) windows have become an alternative energy solution to achieve a zero-energy building (ZEB) and provide visual comfort. In Algeria, some problems arise due to the high energy consumption levels of the building sector. Large amounts of this energy are lost through the external envelope façade, because of the poorness of the window’s design. Therefore, this research aimed to investigate the optimum BIPV window performance for overall energy consumption (OEC) in terms of energy output, heating and cooling load, and artificial lighting to ensure visual comfort and energy savings in typical office buildings under a semi-arid climate. Field measurements of the tested office were carried out during a critical period. The data have been validated and used to develop a model for an OEC simulation. Extensive simulations using graphical optimization methods are applied to the base-model, as well as nine commercially-available BIPV modules with different Window Wall Ratios (WWRs), cardinal orientations, and tilt angles. The results of the investigation from the site measurements show a significant amount of energy output compared to the energy demand. This study revealed that the optimum BIPV window design includes double-glazing PV modules (A) with medium WWR and 20% VLT in the southern façade and 30% VLT toward the east–west axis. The maximum energy savings that can be achieved are 60% toward the south orientation by double-glazing PV module (D). On the other hand, the PV modules significantly minimize the glare index compared to the base-model. The data extracted from the simulation established that the energy output percentages in a 3D model can be used by architects and designers in early stages. In the end, the adoption of optimum BIPV windows shows a significant enough improvement in their overall energy savings and visual comfort to consider them essential under a semi-arid climate.

Graphical Abstract

1. Introduction

Buildings need to be energy efficient and fully utilize renewable energy to cover their energy demands. Global environmental awareness and expanding energy demands are increasing alongside the stable progress in renewable energy technologies seeking to create new prospects for renewable energy resources [1]. Many studies show that this new sector plays a vital role and many countries, such as Algeria, have taken measures to ensure sustainability in the utilization of global alternative energy resources [2,3]. The vital portion of energy consumption in the building sector is marked by a solid annual growth rate of 6.28%, which needs to be considered in terms of energy savings [4]. In contrast, the sector of energy consumption among Algerian buildings alone consumes around 42% of the overall amount used by all sectors. From another perspective, a study showed that there are no building regulations or any recommendations for daylighting and window-to-wall ratios (WWR) for public buildings. Thus, poor window designs and the absence of regulations in Algeria are leading to higher energy consumption [5]. However, electric lighting now comprises 25% of the total energy consumption, making it one of the main consumers of electricity in buildings [6]. The Algerian government has acknowledged advancing sustainable solutions, such as solar photovoltaic energy and greenhouse gas emissions, to fight climate change and facilitate the reduction of fossil fuels [7].
To preserve energy, windows can be used. This can be fulfilled by using Photovoltaic (PV) cells embedded into the windows. With the increase in the usage of glass and windows in the facades of the buildings, it has become a trend to produce electricity from windows and glass [8]. This can be achieved by using PV panels embedded in the windows. The design considerations for Building Integrated Photovoltaic (BIPV) windows in an office require examining the climate and solar conditions that are affected by the location and building type. Therefore, several design variables can strongly influence the impact of BIPV windows on energy performance and visual comfort. Various architectural variables, such as orientation, size of the window (WWR), and BIPV window types and daylight control are used to carry out simulations [9,10,11].
A pleasant and visual indoor environment is offered by daylighting as a natural lighting source for people in office rooms. The light passing through a building façade helps to achieve daylighting (any semi-transparent material or window glazing). There have been a few studies carried out on the performance of BIPV window daylighting and lighting energy. Certain authors have proposed methods to evaluate and optimize the daylighting and visual comfort for first generation BIPV window (STPV) applications. While some studies used daylight autonomy metrics [12,13], across the Diva and Dysim software tools under a tropical climate [14,15]. Other studies conducted a luminous test under real conditions to achieve a visual comfort level in accordance with European standards. By comparing the two BIPV window modules with 20% transparency, the results indicated the energy consumption of lighting for the mono-crystalline (m-Si) module to be slightly lower than that of the Copper Indium Selenide (CIS) [16]. Miyazaki et al. used a continuous dimming control for artificial lighting metric and proposed 10%–80% energy savings for different transmittance solar cells by considering the center of the office as the reference point. This result revealed the optimum solar cell transmittances to be 80% and 30% WWR in the Japanese context, although smaller cell transmittance values contributed less to electricity consumption [17]. Another perspective concerning the application of BIPV windows (poly-crystalline modules) is the skylight, as this study was conducted on a residential building roof with a south orientation and a 30-degree tilt angle. Since the direct daylight illuminance calculation model was used for the evaluation, semi-transparent PV top light systems were found to have contributed significantly towards lighting energy savings compared to the conventional glass used in Japan [18].
Modern architecture rarely employs Building Integrated Photovoltaic (BIPV) windows. However, only a few studies have investigated the overall energy performance of BIPV windows instead of conventional windows. These studies considered the three main aspects of the overall energy of BIPV windows—the energy output (electrical), daylighting (optical), and heat gain/loss (thermal)—through the use of modeling and experimental approaches.
The optimum PV inclination and orientation level, only in terms of energy output, also depend on the local climate, load consumption temporal profile, and latitude [19]; for example, the south orientation was found to be the ideal orientation for building façades facing the northern hemisphere near the equator [20]. Nevertheless, skylights facing the equator with an inclined angle against the building altitude will maximise their generation of electricity [21]. The performance of PV arrays at different orientations and tilt angles for Guangzhou city (latitude 27°N) was investigated by Chen Wei et al. According to their report, the monthly average energy output of the PV arrays at different angle-settings has nearly the same trend in the spectrum according to their monthly average solar radiation incidence. This finding proves that the amount of solar radiation on a PV array is the major factor that determines its system’s efficiency. For the energy output plots of PV arrays, it was also concluded that the optimum yearly energy output value can be achieved from a PV array facing south with a tilt angle of 19° [22]. Yang et al. investigated the optimal tilt angle and azimuth angle for a wide range of locations in China by means of a specifically developed mathematical equation based on an anisotropic model. The results showed the optimal tilt angle for the maximum yearly solar radiation to be usually smaller than the local latitude, except for areas where the beam radiation occupies a great portion of the total solar radiation [23].
A previous study focused on the estimation of energy savings in a Japanese office building using different transmittance values for the semi-transparent solar cell by modeling a standard floor of an office building based on the Architectural Institute (AIJ) in Japan and applying an amorphous silicon solar cell under Japan’s climate. Consequently, compared to the standard model, the total reduction was 55% [17]. Ng, Mithraratne, and Kua evaluated the overall energy performance of six commercially available semi-transparent PV modules under a tropical climate, based on their Net Electricity Benefit (NEB), and compare them with conventional windows used in Singapore in terms of total electricity consumption. Their findings revealed that even in orientations that do not receive direct solar gains, BIPV can be adopted; moreover, PV efficiencies and good thermal properties are essential to achieve a better NEB performance [24]. Lu and Law (2013) estimated the overall energy performance corresponding to the five orientations of a semi-transparent BIPV window system installed in a typical office in Hong Kong by integrating the simulation results of thermal, power, and visual behaviours. The main finding of the work was that the system would lead to an annual electrical benefit of about 1300 kWh [10]. In the same context, a comparison of the overall energy performance was carried out in Hong Kong using a semi-transparent BIPV window and double-glazed window. The results revealed that a semi-transparent BIPV window can save up to 16% total electricity per year, and the best orientation is south–west [11]. Another comparison study was performed in five cities in China between double skin façades and an insulating glass unit through experimentation and simulations. The results show that the performance of the Photovoltaic Insulated Glass Unit (PV-IGU) offered 2% better performance than the ventilated PV-Double skin façade. In contrast, the PV-DSF had a better reduction in solar heat gain compared to PV-IGU, while the PV-IGU was better than the PV-DSF in terms of thermal insulation [25]. An et al. focused only on the cooling and heating performance of an amorphous silicon PV module in Korea using a comparison study between different types of PV glass (single, double glazing). Their results revealed a reduction of 18% in cooling and heating loads [26]. Georgios Martinopoulos et al. assessed a nine story office building in terms of its energy performance and thermal comfort for a number of various building integrated retrofitting measures; they found that the shading scenario can reduce total energy consumption by 33% [27].
Recently, European countries have given the utmost importance to this technology to help achieve a Zero Energy Building (ZEB). In this context, an assessment of four BIPV configurations, namely: vertical, tilted PV façade, semi-transparent BIPV and photovoltaic shading device, in terms of energy demand and visual comfort under semi-continental climate. The results indicated that semi-transparent BIPV eliminated the disturbing glare and resulted in a decrease of 20% on the cooling demand compared to the reference case. On the other hand, the annual heating and lighting loads were covered by the annual PV energy output and also a reduction in the cooling loads, approaching the zero-energy standard in most of the cases [28]. As a consequence, to date, a balanced solution for the overall energy performance of semi-transparent BIPV windows has been limited in terms of the WWR, transparency, and efficiency of the available product markets seeking to maximize the energy savings of the BIPV module in buildings and ensure visual comfort at the same time, particularly under the semi-arid climate in Algeria.

2. Methods

2.1. Field Measurement

As shown in Figure 1, a typical office room in Tebessa city facing the east–south was selected to study the energy output, heat gain, and heat loss, as well as for daylighting measurements. The selected room is on the 3rd floor and free from shading and any obstacles to ensure it receives the maximum amount of solar radiance. The experiment was conducted during the critical period of summer, with the field-measured data recorded systematically using proper interval times. The floor area of the room was representative of the office room size for all government staff (12 m2), according to the DLEP and DUC Algerian standard. An off-grid photovoltaic window system was designed and used to measure, evaluate, and validate the maximum power direct current (DC) from the PV window module. This system consists of four main components: a photovoltaic window with visible light transmittance (VLT) 20%, (2) solar charge controllers (maximum power point tracker (MPPT) with a built-in data logger (DC energy output), a battery, a load element (fluorescent lamp at 12 volts). These elements were covered with a box during the experiment, so they had an effect on the daylighting measurements. Furthermore, four illuminance meters (HOBO Pendant Temperature/Light Data Logger) were arranged inside to measure the indoor temperature and internal WPI, and one illuminance light meter was placed outside the office to measure the external illuminance and outdoor temperature; a heat flux meter (fluxDaq+) was used to measure the heat gain and loss of the PV module. The details of the electrical and thermo–optical characteristics of the PV module are stated in Table 1.
To produce correct results and predict the actual consumption, validation is a major approach that has to be done using building simulation tools. Therefore, the accuracy of the comprehensive performance of the energy factors (energy output, heat gain/loss, indoor and outdoor temperature, and cell temperature) was validated through Energy Plus, whereas the indoor and outdoor illuminance was validated through IES-VE by comparing the experimental data to the simulated results. This validation is based on the mean bias error (MBE) and the coefficient of variation of the root mean square error (CV RMSE) indicators, which are strongly recommended for energy models by the ASHRAE14 Guidelines.
M B E ( % )   =    i   =   1 N p ( m i s i ) i   =   1 N p ( m i )
  C V   R M S E   =    i   =   1 N p ( m i s i ) 2 / N p m
where mi is the measured value, si is the simulated value, and n is the number of measured data points. The results of the accepted model should be less than 10% for MBE and 30% for CV RMSE [29].

2.2. Computer Simulation with Energy Plus and IES-VE

To adequately assess the characteristics of the current overall energy design practice of the BIPV window, a series of simulations were performed for the basic model (Geometric A) that represents the common construction practices of offices in Algeria [30] with the same PV module used in the experiment. Moreover, an extensive simulation was carried out by modeling 65 BIPV windows at different tilt angles and orientations at once in order to obtain a general picture of the design implications for various BIPV window systems (Geometric B) and to estimate their application impacts on building energy production and energy savings as shown in Figure 2. Algeria–Tebessa TMY data were used Meteonorm data-base, to determine the office buildings’ energy use for artificial lighting, cooling, and heating electricity usage, as well as the photovoltaic electricity generated [31]. Several parameters evaluated the overall energy performance of the thin-film PV windows (amorphous silicon, micromorph). These parameters were the size of the window, the main orientations, the tilt angle, and the different levels of visible effective transmittance (VLT), Solar Heat Gain Coefficient (SHGC), U-value, and energy efficiency (n), as seen in Table 2.
In this study, the nine commercially-available BIPV modules selected were the Auria Solar (Micromorph) Red, Schott Solar double-glazed amorphous silicon (Voltarlux ASI-ISO-E1.2), Hanwa Makmax single-glazed silicon (KN-42), and six modules of Onyx Solar single laminated and double-glazed silicon, with transparency values ranging from 10% to 30% (See Figure A7). All of the modules were made from thin-film solar technologies that can accommodate the studied climate (semi-arid) and had shown better performance at high temperature levels, as well as better shade tolerance, than alternative modules [32]. These modules included both single- and double-glazed units, which consisted of different constructions and technologies as shown in Table 2.
The position and WWR of the BIPV windows used in geometric model C were based on daylighting and view designs, rather than energy output and heat gain–loss factors. The daylight zone, which is associated with window size, is defined as an area with a depth that is two times the window’s height (measured from the ground) in a direction parallel to the window; the daylight area spreads horizontally, equal to the window width, plus one metre on either side of the aperture. Consequently, all of the BIPV windows were positioned in the middle part of the wall. To achieve the minimum line of sight, the distance between the floor and the bottom part of the BIPV window (10%–70% WWR) was set at 0.9 m, which is slightly higher than the working plane of 0.85 m. As shown in Figure 3, a distance of 2.1 m between the floor and the top portion of the BIPV window (10%–40% WWR) was found to be the most optimal height for the full penetration of daylight into the room.
The assessment of energy savings and the optimisation procedure consisted of three stages:
  • The first stage involved estimating the current situation’s overall energy consumption for the base-model;
  • The second stage involved using different BIPV window modules instead of conventional windows to estimate the energy output based on the cardinal and intermediate orientation, with different tilted angles from horizontal to vertical, with an interval of 10 degrees (geometric b; Figure 2). This stage also involved evaluating conversion efficiency (n) and PV cell temperature, the heating and cooling load, as well as artificial lighting and a constant internal load (computer load);
  • The last stage included optimizing the design of the BIPV window by balancing the WWR and physical factors through the use of the geometric model (C). The potential total electricity savings and their visual comfort criteria when installed in an office building were then estimated and compared with those of the base model.
The following sections provide the simulation of the overall energy models, as shown in Figure 4.

2.2.1. Energy Output Model Simulation

This study employed the equivalent one-diode model. This model uses an empirical relationship to predict the operating performance of the PV, based on conditions such as the PV cell temperature and an estimation of the conversion efficiency for each time-step. This model consists of a diode, a DC current source, and a series of resistors [33]. The following equation presents the equivalent one diode module (3)
I = I L   I 0   [ exp ( q γ k t c   ( V + I R s ) ) 1 ]  
where I is current [A], V is voltage [V], Rs is the resistance of the module series [Ω], Tc is the module temperature [K], Io is the diode that reverses the saturation current, γ is the empirical PV curve-fitting parameter, I is the current, IL is the module’s photocurrent, q is the electron charge constant. However, the four parameters in this model, IL, Io, γ, and Rs, are empirical values that cannot be determined directly through physical measurements. The EnergyPlus model calculates these values from manufactures’ catalog data. Meanwhile, the Integrated Surface Outside Face option is applied to estimate the cell temperature [11]. The energy exported from the surface as electricity becomes a sink in the internal source modeling for the heat transfer surface [34].

2.2.2. Thermal Simulation

The thermal transmittance coefficient (U-value) and solar heat gain coefficient (SHGC) are the two parameters typically used for thermal characterization, comparisons between BIPV window systems, and as the input for building energy performance simulations [35]. The SHGC is estimated through energy balance equations integrated into EnergyPlus models, which can be employed to express conductive, convective, and radiative heat transfer phenomena [36]. The heating and cooling load is a necessary critical factor required in the overall energy consumption assessment. For this study, the Ideal Loads Air Systems (ILAS) component that was built in Energy Plus was used to represent an ideal HVAC system. This component is assumed to supply cooling or heating air to the related zone, to meet the zone load up to the specified limit required by the user. As shown in Table 3, with a coefficient of performance (COP) of 1, the ILAS model is connected to the outdoor air and supplies the necessary quantity of cooling and heating energy required to meet the temperature set points of the building’s indoor air temperature. However, the heating and cooling systems were only turned on during the working hours, as stipulated by the Algerian regulation policy schedule. The thermal properties of external building element characteristics are summarized in Table 4.

2.2.3. Daylighting Simulation

In this study, a combination of the daylighting control method and dynamic daylight climate-based metrics (Useful Daylight illuminance) were used to evaluate daylighting performance and energy savings [37,38]. The daylighting performance of the BIPV windows demonstrated the amount of illuminance that is accepted and the capability of the lighting on the systems under both cloudy and clear sky conditions to perform a transitional shift and be displayed similarly to regular glass material [39]. The selected performance indicator of daylighting quantity is based on the International Standard (ISO), as shown in Table 5. The approach of IES-VE was used to model the potential for the daylighting of BIPV windows. This method was used considering the finding that visible light transmittance (VLT) is viewed as the most fitting element for estimating work plane illuminance (WPI) in the tested offices at the reference points [39]. The finishing materials of the offices were selected from among materials that are generally used in Algerian office buildings:
  • Floor: stone coverings, with a reflection coefficient of 25%;
  • Walls: cream paint, with a reflection coefficient of 70%;
  • Ceiling: white paint, with a reflection coefficient of 90%;
  • Ground coverings: concrete, with a reflection coefficient of 30%.
It is assumed that there is no building in the vicinity that could obstruct direct light from entering the windows.

2.3. Criteria for Optimum BIPV Window Design

The yearly evaluation of energy performance employed a graphical optimization method that combines (1) the visual comfort criteria shown by UDI, where the shaded areas (in the graph) cover less than 50% of the occupancy hours, with a value of 300–750 lux for the UDI curve. Beyond this area are the given visual criteria to be met. Next, in agreement with the CEI Glare Index (CGI), only the best PV modules achieved the requirements of UDI to assess the quantity of glare in the four design days alongside the base-model. (2) By considering the WWR in a cardinal orientation, the overall energy consumption (OEC) is then calculated, where a lower value indicates a more energy efficient building, as shown in Figure 5. The following relation is used to evaluate the overall energy consumption (OEC)
O v e r a l l   E n e r g y   C o n s u m p t i o n   ( O E C ) =    C o o l i n g   e n e r g y   c o n s u m p t i o n + H e a t i n g   e n e r g y   c o n s u m p t i o n   +   L i g h t i n g   e n e r g y   c o n s u m p t i o n +   E l e c t r i c a l   e q u i p e m e n t   e n e r g y   c o n s u m p t i o n P V   e n e r g y   o u t p u t   [ k W h m 2 ]

2.4. Climatic Conditions (Vertical Solar Radiance)

The consideration of climatic conditions has been demonstrated to be an important factor in investigating the energy output of BIPV window applications, especially solar radiance [40]. Global solar radiation and sunshine duration values are available on a mean daily or monthly basis. However, the diffuse, direct, and cloud cover data are rarely recorded on an hourly basis. Some present databases have been created based on the interpolation and extrapolation of the available data for estimating solar radiation at each point in the world. These databases include the Meteonorm database, which is used in this research [31].
Figure 6 identifies the annual horizontal and tilted 90° (vertical) global radiation information together with its diffused component. As is clearly shown, the amount of global horizontal irradiance (GHI) which reaches 1929 kWh annually, is more than the vertical radiance on a different azimuth. The highest amount of radiation is received on the south azimuth, with 72% compared to GHI, and the lowest amount is found on the north azimuth (24%), primarily due to the absence of direct solar radiance. However, the east and west azimuth reveal a difference of 60% which is approximately the same amount as the symmetric incidence of solar radiance, as shown in the sun’s path. The diffuse radiance on the vertical façade of the azimuth represents a significant percentage difference compared to GHI, which can reach up to 90% for the north azimuth and between 40% and 46% for S, E, and W.

3. Result and Discussion

3.1. Empirical Validation of the Overall Energy Performance BIPV Window

Figure 7 shows that the simulated WPI in reference points A1 and B1 is similar to the measured result. The highest illuminance level was 370 lux during the morning period for reference point A1, while the B reference point does not exceed 200 lux due to the low transparency and its distance from the tested PV module. On the other hand, the indoor air temperature was between 25 and 28 °C, which is slightly higher than the comfortable air temperature inside the office. This result demonstrates that the measured and simulated air temperatures were consistent (less than 2.3%). This outcome provides a good prediction for the cooling and heating loads during the next part of the simulation. The outcomes from the EnergyPlus dynamic reproduction include hourly heat gains and losses, and achievements via BIPV window indicate great dependability with thw experiment model, where the Mean bias error of heat gain is 2.61%, and 8.64% for heat loss. However, the heat loss happens around evening time of the summer season, which is not within the investigation period from 8a.m. to 17p.m.
The daily energy output data were also compared with the simulated and tilted solar radiance for greater accuracy. A remarkably more fluctuating trend of power generation was observed in spring (May) than in the summer season due to the variations in sky conditions in the spring season, as shown in Figure 8. The monthly average of the energy output was between 213 Wh in May (at least) and 245 Wh in July as the maximum. However, the monthly total amount of energy output ranged up to 7 kWh per month, which is a considerable amount when compared to the energy consumption of a typical office. A validation of the energy output shows the perfect reliability of the model, where the mean bias error is between 0.48% to 2.21%, and the coefficient variation root mean square is between 11.95% in July because the sky conditions during this month are totally clear, while the coefficient variations is 22.7% in the spring season.

3.2. Evaluation of the energy output

The Figure 9 shows the significant differences in the energy output among the different months under the semi-arid climate in Algeria. The southern-oriented BIPV windows produced less energy in the summer compared to the winter months since the sun passes quite close to the zenith during the summer season (height 81°) and during the winter season, it passes at low latitudes. The maximum monthly energy output is around 5.95 kWh/m2 in November, while the minimum energy output is around 2.8 kWh/m2 in June. Further, north is seen as the worst orientation for energy output of BIPV windows. Similar results were achieved in the west and east facades due to the symmetry of the incident solar energy, where the maximum output energy loss from the east to west façade did not exceed 14%.
As shown in Figure 10, based on the annual data, it can be seen that the most effective energy output during the year was 111.112 kWh/m2, which was obtained by facing the module toward the S–E/S/S–W facades, while the lowest energy output was obtained by facing the PV module to the north façade, producing an output that was about three times greater. Nevertheless, both the east and west facades were within the acceptable level of energy output. This indicates the significant role of the sun’s path in each season throughout the year in the design of BIPV windows. The energy output increased dramatically from the 90 to the 30 degree slope and then decreased up to the horizontal 0 slope. The highest energy output was obtained at the 30 degree slope. However, the vertical BIPV windows only produced 61.24% of energy compared to those installed at the 30 degree slope. This particular result is consistent with previous research conducted in Beirut, Lebanon [41].
Generally, the BIPV window facing the south façade achieved the highest energy output. However, this output decreased at the 30 degree slope by increasing the tilt angle in all orientations based on the ratio between the highest energy output facing the south slope (with 30 considered as 100%, with 178 kWh/y, and including the energy output of the other facades and tilted surface from the horizontal to the vertical façade). The tested PV module within the red line zone presents the best tilt angles and orientations for the PV module performance at higher than 90% of its capacity, mainly because this area receives the maximum amount of solar radiance. Moreover, this result revealed that a significant percentage of the 3D model can be used by architects and designers in Algeria.
On the other hand, the cell temperature and energy output of the thin film modules were investigated using the equivalent one diode model throughout the four design days (21st June, 21st September/March, and 21st December), thereby providing a general overview of the effects of cell temperature on the application of BIPV windows at different tilt angles (10°, 30°, 50°, 70°, and 90°) under semi-arid conditions.
The simulation of the solar cell temperature recorded the lowest value (7 °C) in the early winter morning, and the highest value was recorded to be 50 °C in the evening of the summer season. Accordingly, the PV module recorded the maximum energy output during summer. The graphs illustrated in Figure 11 demonstrate that by increasing the tilt angle from 10° to a vertical angle, using an interval of 20° towards the South facade, the cell temperature declined dramatically. Furthermore, during both the summer and winter afternoon, this method achieved a difference of 10 °C, particularly between 10 and 30 °C. A minimum reduction of at least 1 °C for the cell temperature was also recorded in the early morning between 8 a.m. and 9 a.m. These results further demonstrate that the effect on the energy output of increasing the cell temperature of the thin film modules was negligible compared to the solar radiance, due to the conversion efficiency of the solar cell line with the energy output. This result confirms that the use of thin film BIPV windows is appropriate under semi-arid climate conditions.

3.3. Evaluation of the Lighting Energy

In this study, thin-film BIPV window modules were treated as uniform optical properties. Three effective visible transmittance values of the BIPV window modules were simulated: 10%, 20%, and 30%. The minimum value of 10% was selected in order to ensure a certain minimum outside view. The graphs below describe the lighting electricity consumption as a function of solar cell transmittance and WWR. The annual total lighting electricity consumption reduced by increasing the solar cell transmittance. Meanwhile, this value decreased by increasing the WWR based on effective daylight availability. The results of lighting energy consumption can be summarised through two different scenarios:
  • Scenario one involves an increase in the WWR of the BIPV window from 10% to 100%; meanwhile, the VLT is kept constant at 10%, 20%, or 30%. The graph below shows a very steep decline in lighting energy from 10% to 60% WWR. For example, the yearly lighting energy consumption in the south with 30% of VLT was 19.1k Wh/m2, which diminished to only 1.8 kWh/m2 per year, as shown in Figure 12. Then, the energy gradually decreased due to sufficient daylight in the work plane (refer to Figure A1 for the other orientations);
  • Scenario two involves increasing the VLT by means of an interval of 10% and fixing the WWR. The decline percentage ranged between 6% and 10% in a small WWR, reaching up to 65%–80% with a large WWR of the PV modules; the maximum lighting energy reduction percentage was 80% and was achieved with a fully glazed PV module oriented toward the southern façade.

3.4. Evaluation of the Cooling and Heating Energy

The graph below depicts the variation in total cooling and heating energy consumption for the base-model of nine different BIPV modules as a function of the WWR in cardinal orientations. A positive correlation is observed between the WWR of the PV modules and the base-model with cooling energy consumption, where the larger WWR and the higher cooling load were caused by variations in the SHGC and U-values. The graphs in Figure 13 illustrate the three main divisions: (1) the double-glazed PV modules (A1, A2, A3, and C); (2) the single-glazed PV modules (B1, B2, B3, D, and E), and (3) the base-model. Consequently, the cooling loads changed considerably among these three divisions, where the result was very close, with a small WWR, and the difference between the three divisions was remarkably large for the WWR due to the increased solar heat gained by the PV module. Therefore, the best performance for energy savings based on the cooling load was achieved by the double-glazed PV modules, A1, A2, C, and A3. Moreover, the maximum value of the cooling load energy does not exceed 60 kWh/m2 in the cardinal orientation. Meanwhile, all PV modules were found to have less energy consumption than the base model, where the cooling energy consumption increased to more than three times greater than the large WWR of the south, east, and west facades, and more than double that of the north facade. The energy savings accounted for by the cooling load were very significant, reaching up to 108, 100, 86, and 29 kWh/m2 in the east, south, west, and north facades, respectively, compared to the double-glazed PV module. Moreover, approximately half of these percentages were acquired by applying a single PV module (B1, B2, B3, D, or E).
Inversely, the base-model consumed less heating energy than all PV modules in the cardinal orientations. Further, the rate of heating energy for the double-glazed PV modules was mostly constant, even with an increase in WWR. The heating energy consumption frequently decreased, except in the north façade due to the absence of solar transmission. The lowest value of the heating energy loads in the south facade, particularly in those with a large WWR, was due to the augmentation of the heat gain. Even though the east and west facades had the same performance, the west facade was slightly higher, with a large WWR. However, the peak heating energy consumption was achieved by the double-glazed PV modules (A1, A2, C, and A3), primarily due to their high insulation. Therefore, the energy savings of all PV modules were negative because the base-model had higher solar transmittance (SHGC). Refer to the Figure A2 and Figure A3 for graphs of the other orientations.

3.5. Evaluation of the Optimum Overall Energy Consumption (OEC)

The Overall Energy Consumption (OEC) of the base-model trend highlights that, within a semi-arid climate, employing bigger windows is counterproductive, as large windows create bigger areas for heat transfer in winter and in numerous days during spring and autumn. A larger cooling demand with bigger south-facing window sizes, as well as increasing the WWR for north-facing windows, results in a lower heating demand. It is also observed that smaller window sizes cannot be reduced randomly because electric lighting consumption is an issue, predominantly with 10% WWR, as shown in Figure 14. The highest OEC of the base-model was observed at the eastern and western façades. This result agrees with the findings of [30] which is the only study conducted on the overall energy performance of a typical office. The lowest energy use of the base-model was identified at 20% WWR for cardinal alignments. At the same time, the solutions with the lowest total OEC were found to have the highest percentage of visual comfort or UDI300-750 lux, unless the east facade did not meet the minimum requirement of the UDI. For the base-model with medium and large window sizes, the use of artificial light was found to be mostly insignificant, but the risk of glare was extremely high and exceeded the shaded area.
As shown in the Figure 15, the PV Modules with 10% VLT or less indicate that optimising the WWR against the OEC hindered visual comfort. The PV modules A1, B1, C, D, and E that were optimised to reduce the OEC with respect to increasing the WWR, did not meet the visual comfort criteria because of the low light transmittance of these PV modules. Consequently, the office setting was controlled by high electric lighting use. At the same time, the PV modules with between 20% and 30% VLT (A2, A3, B2, and B3) showed a reduction in the OEC from a small to a medium WWR, and, between 70% and 100%, the OEC increased again, thereby overcoming the energy output against the total heating load and lighting energy, as shown in Figure A4, Figure A5 and Figure A6.
The results demonstrate that the OEC of the PV modules, compared with the base-model, is inverse for the WWR. The trend of the PV modules with 10% VLT and less A1, B1, C, D, and E reduced significantly by increasing the WWR due to the increment of the energy output. In contrast, the OEC of the base-model increased after 20% of WWR, due to the increment of the cooling load with no energy output. Moreover, the optimum design solutions limited the PV modules and WWR for this particular type of climate. In this study, only four PV modules among the nine could meet the targets of both visual comfort in the cardinal orientation and the specific WWR. The main reason for selecting these four PV modules (A2, A3, B2, and B3) was due to the required degree of transparency for the VLT to achieve the minimum requirement of visual comfort.

3.6. Evaluation of Visual Comfort

To acquire more details about the quality of visual discomfort, specifically the uncomfortable glare issue that may be caused by the base-model or different configurations of PV modules, this study utilised CEI Glare Index (CGI) metrics to assess the glare status for each case, in addition to graphical presentations. Table 6 and Table 7 indicate that the means of the CGI values of the base-model varied from 18.85 to 28.23 during the studied time and cardinal orientations; the means of CGI only obtained acceptable values during the winter solstice, while the remaining design days provided uncomfortable values. On the other hand, the mean CGI for the optimum PV modules selected in this research ranges from 13.48 to 24.2. As consequence, these results precipitate a sharp decrease in the mean CGI values throughout the year compared to the base model. The PV module only exceeds the limit of 22 in an east orientation during the morning period, when the office is exposed directly to sunlight. Thus, the base-model aggravates this condition, since the average CGI values in all PV modules in each orientation are lower than the CGI values for the base model because of the large differences in terms of visible transparency (VLT). In all cases, it is remarkable that there is a significant improvement in terms of visual comfort by reducing the means of the CEI glare index by at least 3.5 degrees. The means of CGI are barely perceptible in the south orientation, however, with 40% WWR. As result, the use of an optimally designed PV module strategy in the cardinal orientation could provide a significant reduction in glare.

3.7. Energy Saving of the BIPV Window Modules Compared to the Base Model

The largest potential percentage savings that can be attained by accepting nine various PV modules in place of the more commonly employed clear glazing (see the base model) in cardinal alignments can be seen in Figure 16. These graphs showcase inconsistent savings in an approximate range of 1.29% to 60%, and, in some cases, the result was negative (no-savings) compared to the base model. A significant percentage of savings were achieved in the southern orientation by using module D, whose energy savings were estimated to be 60%, due to it having the highest conversion efficiency (n = 8) among the modules. Conversely, module D had a negative percentage in the northern orientation.
This result indicates that the conversion efficiency is not significant, due to the absence of solar radiance. The maximum savings percentage was only achieved by double-glazing the PV modules (A1, A2, A3, C). The remaining modules were all negative, and the results demonstrate that thermal performance was more important than conversion efficiency. Furthermore, the eastern and western orientations had approximately similar results, where PV modules B1, B2, and B3 presented a negative percentage mainly due to their weak thermal performance. This occurred because the conversion efficiency does not compensate for the high energy consumed by the cooling load, except in the southern orientation, with a WWR of 100%, which could be accomplished by 19.33%, 9.13%, and 14.02% energy savings. Consequently, even the low conversion efficiency of all the PV modules in a southern alignment is deemed to be comparatively more energy efficient than existing base model window technology.
Figure 16 shows the lowest overall energy consumption of all PV modules and the base-model in the southern orientation compared to other orientations, demonstrating that the value of the overall energy consumption is less than 95 kWh/m2.yr for the base model, with 20% WWR. However, the PV module D reached 25 kWh/m2.yr, with 100% WWR, which is close to zero energy. The WWR of the PV modules achieved the highest percentage of energy savings with full PV glazing in most cases and orientations, except for PV modules B2 and B3 due to their U-values and SHGC being higher than those of the other PV modules.
In contrast, the overall energy savings of the optimum WWR of the PV modules were much lower than the maximum energy savings. Figure 17 shows that the energy savings ranged between 6% and 23%. Notably, these percentages fluctuate in cardinal orientations. For the western façade, the PV module (A3) with a WWR of 60% attained the highest percentage (23%) compared to the base-model, with a WWR of 20% considered to be the optimum WWR for the west, south, and north orientations. For the eastern orientation, the base-model could not meet the requirement of visual comfort. Therefore, the eastern façade base model cannot achieve the necessary target. Instead, two PV modules (A3, with a WWR of 50%, and B3, with a WWR of 50%) can replace the base model and act as a solution for the eastern façade. The northern orientation includes several alternate solutions. The common characteristics of these other PV modules include a peak transparency of 30%, with a large WWR ranging between 60% and 100%. The energy savings for the PV modules with double glazing (A3) ranged between 16.22% and 18.92%, while the energy savings of the single-glazed PV module (B3) were lower than those of the PV module (A3) by at last two-fold. Inversely, the southern orientation energy savings meet the required targets by using small WWR values of 20% and 30% due to the risk of glare and thermal discomfort in a façade with a large opening.
Ultimately, the positive effects of the overall energy savings in the cardinal orientations within the studied semi-arid climate are consistent with past research results in different climates, although the percentages varied in every context due to the variety of configurations for the PV modules. For instance, the energy savings in Spain, a Mediterranean climate, comprise up to 59% of energy used. Meanwhile, in Japan, 55% of all energy is saved using a solar cell transmittance of 40% in comparison to a single-glazed façade (Wong et al., 2008). In Singapore and Brazil, with their tropical climates, energy is saved by 16.7% to 41.3% [42]. A recent study identified that the most energy saved by applying a CdTe-based PV module within an Indian climate was 60.4% [42].

4. Design Recommendations

The results from this research allow us to suggest the following design recommendations for the usage of BIPV windows technology in office buildings in the semi-arid region in Algeria:
  • In general, the adoption of BIPV window modules has a positive impact on the overall energy saving in an office building. however, care must be taken to select the adequate properties of PV modules in cardinal orientations;
    -
    North orientation: This orientation is not recommended for use in BIPV window applications. In this case, it is necessary to use a double-glazed window to overcome the thermal discomfort issue;
    -
    South orientation: This orientation is highly recommended, particularly for PV modules with high conversion efficiency;
    -
    East and west orientation: The application of a BIPV window is acceptable in these orientations, since both orientations produce almost the same results (higher than 70% of yearly energy output;
  • The application of daylight control strategies with effective solar transparency and WWR is highly recommended;
  • A lateral typology for a typical office building should be used to achieve optimal distribution and an adequate daylight uniformity of > 0.6;
  • Based on the results of the base-model and BIPV window modules, the east–west axis was shown to consume higher overall energy than the south–north axis. Therefore, apart from directing the office buildings toward the south–north axis, vertical or horizontal louvers are also suggested for use with the east and west facades of the building;
  • As shown from this research, the optimum design of 20% WWR for the base model was found to produce the greatest energy savings and provided sufficient daylight for office buildings in cardinal orientations, unless the north facade adopted 30% of the WWR to provide sufficient visual comfort;
  • Generally, it is recommended to use double-glazed PV modules rather than single-glazed PV modules in cardinal orientations;
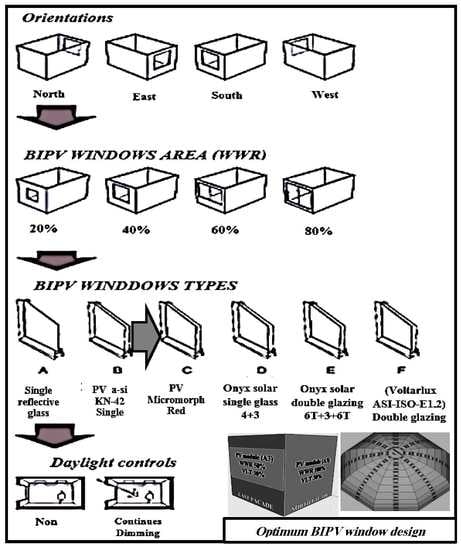
  • In this research, the optimum design of various BIPV windows is different for each orientation level as presented in Figure 18. The recommended orientations are as given as follows:
    (a)
    For the East façade: PV modules (B3) with a WWR of 50%;
    (b)
    For the South façade: PV modules (B2) with a WWR of 40%;
    (c)
    For the West façade: PV modules (B3) with a WWR of 60%;
    (d)
    For the North façade: PV modules (B3) with a WWR of 100%;
  • It is recommended to use BIPV window modules with 10% VLT for locations that do not require visual comfort, such as archival rooms or resting areas;
  • As depicted in the 3D model in Figure 19 below, architects can use the output percentages obtained from the various tilt angles and orientations of the BIPV window in the early stages of design.

5. Conclusions

Apart from demonstrating the importance of appropriate BIPV window designs in the realization of Zero Energy Building, this study has also shown BIPV to be an energy efficient lighting design strategy that enhances the visual comfort of offices with windows. Policymakers and architects can also exploit the results of this research to retrofit conventional building designs with BIPV windows as well as in the implementation of new building designs in the semi-arid regions. However, further studies may address the inter-correlation of environmental factors and design studies to obtain more precise measurements on the BIPV windows’ overall energy performance, as well as evaluate the return of investments (ROI) for BIPV on new buildings and its impact on Algeria‘s economy. In the end, this study contributes to better sustainable design research and practice and suggests the effective usage of BIPV windows in a cardinal orientation. Window size and various optical and thermal BIPV window configuration strategies should be included in the guidelines, with special reference to the Algerian climate, to maximize the energy savings by up to 23%. Meanwhile, this method provides visual comfort and helps prevent damage to the environment by significantly reducing CO2 emissions and pollution.

Author Contributions

A.M. conceived the study, performed all measurements and simulations, interpreted the results, and wrote the manuscript. M.Z.K. supervised and helped each stage of the project in terms of data collection, analysis, and interpretation. G.A.A. Albaqawy interpreted, revised and finalized the manuscript. All authors have read and agreed to the published version of the manuscript.

Funding

This research received no external funding.

Acknowledgments

I would like to thanks Mesloub said and Mohd zin kandar for their extraordinary support to complete this project. Also the authors would thank the editor, the managing editor, the academic editor, and three anonymous reviewers for their helpful comments which greatly improved earlier versions of the manuscript.

Conflicts of Interest

The authors declare no conflict of interest.

Appendix A

Figure A1. Lighting energy consumption when using different VLT values for the PV modules in cardinal orientations: east, west and north, respectively.
Sustainability 12 01654 g0a1aSustainability 12 01654 g0a1b
Figure A2. Annual cooling energy consumption of the BIPV modules against the base model.
Sustainability 12 01654 g0a2aSustainability 12 01654 g0a2b
Figure A3. Annual heating energy consumption of the BIPV modules against the base model.
Sustainability 12 01654 g0a3aSustainability 12 01654 g0a3b
Figure A4. Overall energy performance and visual comfort of the PV modules to achieve the optimum design in the northern façade.
Sustainability 12 01654 g0a4
Figure A5. Overall energy performance and visual comfort of the PV modules to achieve the optimum design in the eastern façade.
Sustainability 12 01654 g0a5
Figure A6. Overall energy performance and visual comfort of the PV modules to achieve the optimum design in the western façade.
Sustainability 12 01654 g0a6aSustainability 12 01654 g0a6b
Figure A7. The PV modules used in the simulations.
Sustainability 12 01654 g0a7

References

  1. Peng, C.; Huang, Y.; Wu, Z. Building-integrated photovoltaics (BIPV) in architectural design in China. Energy Build. 2011, 43, 3592–3598. [Google Scholar] [CrossRef]
  2. Stambouli, A.B.; Khiat, Z.; Flazi, S.; Kitamura, Y. A review on the renewable energy development in Algeria: Current perspective, energy scenario and sustainability issues. Renew. Sustain. Energy Rev. 2012, 16, 4445–4460. [Google Scholar] [CrossRef]
  3. Hui, S.C. From Renewable Energy to Sustainability: The Challenge for Hong Kong; Hong Kong Institution of Engineers: Hong Kong, China, 1997; pp. 351–358. [Google Scholar]
  4. Ferhat, S.; Boutrahi, M. The residential built heritage of Algiers and its energy behaviour: Case study of the building number 3 flats of the Aero-habitat district. Wit Trans. Ecol. Environ. 2014, 186, 39–53. [Google Scholar]
  5. Belakehal, A.; Bennadji, A.; Aoul, K. Office Buildings Daylighting Design in Hot Arid Regions: Forms, Codes and Occupants’ Point of View. In Proceedings of the International Engineering Conference on Hot Arid Regions (IECHAR 2010), Al-Ahsa, Saudi Arabia, 1 March 2010. [Google Scholar]
  6. Amirat, M.; El Hassar, S. Economies d’energie dans le secteur de l’habitat consommation electrique des menages: Cas d’un foyer algérien typique en periode d’hiver. Rev. Des. Énergies Renouvelables 2005, 8, 27–37. [Google Scholar]
  7. Himri, Y.; Malik, A.S.; Stambouli, A.B.; Himri, S.; Draoui, B. Review and use of the Algerian renewable energy for sustainable development. Renew. Sustain. Energy Rev. 2009, 13, 1584–1591. [Google Scholar] [CrossRef]
  8. Li, D.H.; Lam, T.N.; Chan, W.W.; Mak, A.H. Energy and cost analysis of semi-transparent photovoltaic in office buildings. Appl. Energy 2009, 86, 722–729. [Google Scholar] [CrossRef]
  9. Yoon, J.-H.; Song, J.; Lee, S.-J. Practical application of building integrated photovoltaic (BIPV) system using transparent amorphous silicon thin-film PV module. Sol. Energy 2011, 85, 723–733. [Google Scholar] [CrossRef]
  10. Lu, L.; Law, K.M. Overall energy performance of semi-transparent single-glazed photovoltaic (PV) window for a typical office in Hong Kong. Renew. Energy 2013, 49, 250–254. [Google Scholar] [CrossRef]
  11. Zhang, W.; Lu, L.; Peng, J.; Song, A. Comparison of the overall energy performance of semi-transparent photovoltaic windows and common energy-efficient windows in Hong Kong. Energy Build. 2016, 128, 511–518. [Google Scholar] [CrossRef]
  12. Siong, C.T.; Janssen, P. Semi-Transparent Building Integrated Photovoltaic Facades–Maximise Energy Savings Using Evolutionary Multi-Objective Optimisation. In Proceedings of the 18th International Conference on Computer-Aided Architectural Design Research in Asia (CAADRIA 2013), Singapore, 15–18 May 2013; pp. 127–136. [Google Scholar]
  13. Kapsis, K.; Dermardiros, V.; Athienitis, A. Daylight performance of perimeter office façades utilizing semi-transparent photovoltaic windows: A simulation study. Energy Procedia 2015, 78, 334–339. [Google Scholar]
  14. Jakubiec, J.; Reinhart, C. DIVA-FOR-RHINO 2.0: Environmental parametric modeling in Rhinoceros/Grasshopper using RADIANCE, Daysim and EnergyPlus. In Proceedings of the Conference of Building Simulation, Sedney, Australia, 14–16 November 2011. [Google Scholar]
  15. Reinhart, C. Tutorial on the Use of Daysim Simulations for Sustainable Design; Harvard Design School: Ottawa, ON, Canada, 2011. [Google Scholar]
  16. López, C.S.P.; Sangiorgi, M. Comparison assessment of BIPV façade semi-transparent modules: Further insights on human comfort conditions. Energy Procedia 2014, 48, 1419–1428. [Google Scholar] [CrossRef]
  17. Miyazaki, T.; Akisawa, A.; Kashiwagi, T. Energy savings of office buildings by the use of semi-transparent solar cells for windows. Renew. Energy 2005, 30, 281–304. [Google Scholar] [CrossRef]
  18. Wong, P.W.; Shimoda, Y.; Nonaka, M.; Inoue, M.; Mizuno, M. Semi-transparent PV: Thermal performance, power generation, daylight modeling and energy saving potential in a residential application. Renew. Energy 2008, 33, 1024–1036. [Google Scholar] [CrossRef]
  19. Mondol, J.D.; Yohanis, Y.G.; Norton, B. The impact of array inclination and orientation on the performance of a grid-connected photovoltaic system. Renew. Energy 2007, 32, 118–140. [Google Scholar] [CrossRef]
  20. Haysom, J.E.; Hinzer, K.; Wright, D. Impact of electricity tariffs on optimal orientation of photovoltaic modules. Prog. Photovolt. Res. Appl. 2016, 24, 253–260. [Google Scholar] [CrossRef]
  21. Chen, W.; Shen, H.; Liu, Y. Performance evaluation of PV arrays at different tilt angles and orientations in BIPV. Taiyangneng Xuebao. Acta Energ. Sol. Sin. 2009, 30, 206–210. [Google Scholar]
  22. Yang, J.-H.; Mao, J.-J.; Chen, Z.-H. Calculation of solar radiation on variously oriented tilted surface and optimum tilt angle. J. Shanghai Jiaotong Univ. Chin. Ed. 2002, 36, 1032–1036. [Google Scholar]
  23. Ng, P.K.; Mithraratne, N.; Kua, H.W. Energy analysis of semi-transparent BIPV in Singapore buildings. Energy Build. 2013, 66, 274–281. [Google Scholar] [CrossRef]
  24. Wang, M.; Peng, J.; Li, N.; Yang, H.; Wang, C.; Li, X.; Lu, T. Comparison of energy performance between PV double skin facades and PV insulating glass units. Appl. Energy 2017, 194, 148–160. [Google Scholar] [CrossRef]
  25. An, H.J.; Yoon, J.H.; An, Y.S.; Heo, E. Heating and cooling performance of office buildings with a-Si BIPV windows considering operating conditions in temperate climates: The case of Korea. Sustainability 2018, 10, 4856. [Google Scholar] [CrossRef] [Green Version]
  26. Martinopoulos, G.; Serasidou, A.; Antoniadou, P.; Papadopoulos, A.M. Building integrated shading and building applied photovoltaic system assessment in the energy performance and thermal comfort of office buildings. Sustainability 2018, 10, 4670. [Google Scholar] [CrossRef] [Green Version]
  27. Skandalos, N.; Tywoniak, J. Influence of PV facade configuration on the energy demand and visual comfort in office buildings. J. Phys. Conf. Ser. 2019, 1343, 012094. [Google Scholar] [CrossRef]
  28. Ruiz, G.R.; Bandera, C.F. Validation of calibrated energy models: Common errors. Energies 2017, 10, 1587. [Google Scholar] [CrossRef] [Green Version]
  29. Djamel, Z.; Noureddine, Z. The impact of window configuration on the overall building energy consumption under specific climate conditions. Energy Procedia 2017, 115, 162–172. [Google Scholar] [CrossRef]
  30. Meteonorm. Handbook Part I and II. 2010. Available online: http://meteonorm.com/de/download (accessed on 18 November 2019).
  31. Osman, M.M.; Alibaba, A.P.D.H.Z. Comparative Studies on Integration of Photovoltaic in Hot and Cold Climate. Scientific Research Journal 2015, 3, 48–60. [Google Scholar]
  32. Peng, J.; Lu, L.; Yang, H.; Ma, T. Validation of the Sandia model with indoor and outdoor measurements for semi-transparent amorphous silicon PV modules. Renew. Energy 2015, 80, 316–323. [Google Scholar] [CrossRef]
  33. Griffith, B.T.; Ellis, P.G. Photovoltaic and Solar Thermal Modeling with the Energy Plus Calculation Engine; National Renewable Energy Lab.: Golden, CO, USA, 2004. [Google Scholar]
  34. Infield, D.; Eicker, U.; Fux, V.; Mei, L.; Schumacher, J. A simplified approach to thermal performance calculation for building integrated mechanically ventilated PV facades. Build. Environ. 2006, 41, 893–901. [Google Scholar] [CrossRef]
  35. Fung, T.Y.; Yang, H. Study on thermal performance of semi-transparent building-integrated photovoltaic glazings. Energy Build. 2008, 40, 341–350. [Google Scholar] [CrossRef]
  36. Lee, E.S.; DiBartolomeo, D.; Selkowitz, S. Daylighting control performance of a thin-film ceramic electrochromic window: Field study results. Energy Build. 2006, 38, 30–44. [Google Scholar] [CrossRef]
  37. Reinhart, C.F.; Mardaljevic, J.; Rogers, Z. Dynamic daylight performance metrics for sustainable building design. Leukos 2006, 3, 7–31. [Google Scholar] [CrossRef] [Green Version]
  38. Wah, W.P.; Shimoda, Y.; Nonaka, M.; Inoue, M.; Mizuno, M. Field study and modeling of semi-transparent PV in power, thermal and optical aspects. J. Asian Archit. Build. Eng. 2005, 4, 549–556. [Google Scholar] [CrossRef] [Green Version]
  39. Olivieri, L.; Caamaño-Martin, E.; Olivieri, F.; Neila, J. Integral energy performance characterization of semi-transparent photovoltaic elements for building integration under real operation conditions. Energy Build. 2014, 68, 280–291. [Google Scholar] [CrossRef] [Green Version]
  40. Salem, T.; Kinab, E. Analysis of Building-integrated Photovoltaic Systems: A Case Study of Commercial Buildings under Mediterranean Climate. Procedia Eng. 2015, 118, 538–545. [Google Scholar] [CrossRef] [Green Version]
  41. Didoné, E.L.; Wagner, A. Semi-transparent PV windows: A study for office buildings in Brazil. Energy Build. 2013, 67, 136–142. [Google Scholar] [CrossRef]
  42. Barman, S.; Chowdhury, A.; Mathur, S.; Mathur, J. Assessment of the efficiency of window integrated CdTe based semi-transparent photovoltaic module. Sustain. Cities Soc. 2018, 37, 250–262. [Google Scholar] [CrossRef]
Figure 1. (A) The tested BIPV window placed in the office building chosen for experiment; (B) the instruments used during the experiment; (C) the arrangement of the instruments for measurements.
Sustainability 12 01654 g001
Figure 2. (a) Base-model office building used for the daylighting validation sketch-up version 2015 (Geometric A); (b) the proposed model for evaluation of the energy output of BIPV windows at different tilt angles and cardinal/intermediate orientations (Geometric B).
Sustainability 12 01654 g002
Figure 3. Proposed 3D model for the optimization simulation stage (Geometric C).
Sustainability 12 01654 g003
Figure 4. Schematic diagram of the simulation method.
Sustainability 12 01654 g004
Figure 5. A flowchart for determining the optimum BIPV window design.
Sustainability 12 01654 g005
Figure 6. (A) Yearly global horizontal and diffuse radiance in different orientations (E, N, W, and S); (B) the sun path of the city of Tebessa by IES-VE 2017.3. Result and Discussion.
Sustainability 12 01654 g006
Figure 7. Comparison of the measured and simulated data (WPI) at the reference points (A1,B1); heat gain, heat loss, and indoor air temperature.
Sustainability 12 01654 g007aSustainability 12 01654 g007b
Figure 8. Comparison of the measured and simulated daily energy output of the BIPV window in the summer and spring season.
Sustainability 12 01654 g008aSustainability 12 01654 g008b
Figure 9. Monthly Distribution of the energy output PV module with conversion efficiency n = 4.
Sustainability 12 01654 g009
Figure 10. Percentage for the BIPV windows’ energy output performance based on the tilt angle and orientations under the semi-arid region in Algeria.
Sustainability 12 01654 g010
Figure 11. The effect of the cell temperature against the energy output with different tilt angles.
Sustainability 12 01654 g011
Figure 12. Lighting energy consumption using different VLT values for the PV modules on the south façade.
Sustainability 12 01654 g012
Figure 13. Annual cooling energy consumption of the BIPV modules compared to the base model on the South façade.
Sustainability 12 01654 g013
Figure 14. The optimum window design for the base-model in a cardinal orientation, west, east, north, and south.
Sustainability 12 01654 g014
Figure 15. The optimum BIPV window design in the southern orientation.
Sustainability 12 01654 g015aSustainability 12 01654 g015bSustainability 12 01654 g015cSustainability 12 01654 g015d
Figure 16. The maximum percentage of energy savings for BIPV modules compared with the base model in cardinal orientations: south, north, east, and west.
Sustainability 12 01654 g016
Figure 17. The optimum WWR of the PV modules and base-model in a cardinal orientation and its energy savings against the optimum base model.
Sustainability 12 01654 g017
Figure 18. Optimum design for BIPV windows (Window Wall Ratios (WWR), Visible Light Transmittance (VLT), and conversion efficiency) in each cardinal orientation for office building in vertical facades.
Sustainability 12 01654 g018
Figure 19. A 3D model guideline for the energy output percentages obtained from various tilt angles and orientations for architects and designers.
Sustainability 12 01654 g019
Table 1. Electrical and thermo–optical characteristics of the Building Integrated Photovoltaic (BIPV) windows used in this experiment.
Amorphous silicon (ASG090)
Dimension (Length, Width, Thickness)1400 x 1100 x 6.8 mm
Electrical Properties (STC)
Efficiency of Module (ȵ)4.50%
Max power (Pmax)90 Watt
Max power Voltage (Vpm)78 V
Max power Current (Ipm)1.15 A
Open circuit voltage100 V
Short circuit current
Temperature Coefficient (β)
Temperature Coefficient (α)
Temperature Coefficient (γ)
1.43 A
−0.0033/°C
−0.0009/°C
−0.002/°C
Optical properties
Transmittance (VLT)20%
Thermal Properties
U-value5.11 at Summer Daytime
5.65 at Winter Night-time
Solar Heat Gain Coefficient (SHGC)0.34
Table 2. The optical and thermal properties of the thin-film photovoltaics used in the experimental simulations, S.G: single glazing, D.G: Double glazing.
TechnologyConfiguration ModuleVLT (%)U-value (W/m2K)SHGCEfficiency (%)
(Thin-film)
a-silicon
and
Micro-morph
Module (A1) S.G105.700.294
Module (A2) S.G205.700.343.4
Module (A3) S.G305.700.412.8
Module (B1) D.G102.700.114
Module (B2) D.G202.700.143.4
Module (B3) D.G302.700.192.8
Module (C) D.G6.911.6740.1544.75
Module (D) S.G9.175.0760.2898.02
Module (E) S.G5.194.7950.4135.90
Table 3. Simulation parameters and operation conditions of the thermostat set point.
Occupancy DensityOne Person
Heating set-point21 °C (08:00–17:00) and the rest of the day Off
Cooling set-point24 °C (08:00–17:00) and the rest of the day Off
Table 4. Thermal properties of the external boundary of a typical office building in Algeria.
Thickness (mm)Conductivity (W/mK)Density (kg/m3)Specific Heat (J/kg K)
Roof
Roof membrane10.1611211460
reinforced concrete slab401.42400300
Hollow block1601.22400946
Cement mortar51.519001080
Coating of plaster100.519001080
Interior wall
Plaster coating100.519001080
Cement mortar201.1519001080
brick1000.441100940
Cement mortar201.1519001080
Coating of plaster100.519001080
Exterior wall
Coating of plaster100.519001080
Brick1500.441100940
Wall air space100.68001000
Brick1000.441100940
Coating of plaster100.519001080
Ceiling/Floor
Herission3011100828
Floating slab1001.752400946
Cement mortar51.519001080
Surface finish201.22000800
Table 5. Summary of Performance Indicator Criteria for Daylight Simulations (ISO).
AnalysisCriteriaPerformance IndicatorWork Plane Height
Quantitate
+
Qualitative
Useful daylight illuminance (UDI)300 lux < Dark area (needs artificial light) 0.85 m
300 lux–750 lux: comfortable at least 50% of the time
> 750 lux: too bright with thermal discomfort
WPIWPI Recommended 300–750 lux
Mean CGI19 for sedentary status situations are acceptable
22 for transient situations are acceptable
Table 6. The International Commission on Illumination CIE glare index of the optimum PV modules in the cardinal orientation compared to the base-model during summer solstice, winter, and spring equinox.
OrientationEastSouthWest
Date & TimeWWR + VLTBase model WWR 20%PV module A3 WWR 50%Base model WWR20%PV module A2 WWR 40%Base model WWR20%PV module A3
WWR 60%
Summer solstice
21 June
9.00am27.7923.4923.6918.6924.1319.64
15.00 pm23.9519.9823.8718.4526.1821.88
Spring equinox
21 March
9.00 am28.2324.2024.0218.9423.8919.46
15.00 pm23.8320.6625.0519.8226.1421.94
Winter Solstice 21 December9.00 am18.8515.0218.8513.4818.8514.84
15.00 pm20.3316.7420.3314.8820.3316.31
Table 7. Improvement in the Mean CEI Glare Index evaluation for optimum PV module designs.
Date
Time
EastSouthWest
Summer solstice 21 June9.00 am Sustainability 12 01654 i001 Sustainability 12 01654 i002 Sustainability 12 01654 i003
15.00 pm Sustainability 12 01654 i004 Sustainability 12 01654 i005 Sustainability 12 01654 i006
Spring equinox 21 March9.00 am Sustainability 12 01654 i007 Sustainability 12 01654 i008 Sustainability 12 01654 i009
15.00 pm Sustainability 12 01654 i010 Sustainability 12 01654 i011 Sustainability 12 01654 i012
Winter solstice 22 December9.00am Sustainability 12 01654 i013 Sustainability 12 01654 i014 Sustainability 12 01654 i015
15.00pm Sustainability 12 01654 i016 Sustainability 12 01654 i017 Sustainability 12 01654 i018

