Article

Reduction Strategies for Greenhouse Gas Emissions from High-Speed Railway Station Buildings in a Cold Climate Zone of China

1
School of Architecture, Tianjin University, No. 92 Weijin Street, Nankai District, Tianjin 300072, China
2
Research Centre of Zero Emission Neighbourhoods in Smart Cities (FME-ZEN), Department of Architecture and Technology, Norwegian University of Science and Technology, 7491 Trondheim, Norway
3
Belfast School of Architecture and the Built Environment, Faculty of Computing, Engineering and the Built Environment, Ulster University, Belfast BT15 1ED, UK
*
Author to whom correspondence should be addressed.
Sustainability 2020, 12(5), 1704; https://doi.org/10.3390/su12051704
Submission received: 21 January 2020 / Revised: 12 February 2020 / Accepted: 18 February 2020 / Published: 25 February 2020

Abstract

:
Implementing China’s emission reduction regulations requires a design approach that integrates specific architectural and functional properties of railway stations with low greenhouse gas (GHG) emission. This article analyzes life cycle GHG emissions related to materials production, replacement and operational energy use to identify design drivers and reduction strategies implemented in high-speed railway station (HSRS) buildings. A typical middle-sized HSRS building in a cold climate zone in China is studied. A detailed methodology was proposed for the development and assessment of emission reduction strategies through life cycle assessment (LCA), combined with a building information model (BIM). The results reveal that operational emissions contribute the most to total GHG emissions, constituting approximately 81% while embodied material emissions constitute 19%, with 94 kgCO2eq/m2·a and 22 kgCO2eq/m2·a respectively. Optimizing space can reduce operational GHG emissions and service life extension of insulation materials contributes to a 15% reduction in embodied GHG emissions. In all three scenarios, the reduction potentials of space, envelope, and material type optimization were 28.2%, 13.1%, and 3.5% and that measures for reduced life cycle emissions should focus on space in the early stage of building design. This study addresses the research gap by investigating the life cycle GHG emissions from HSRS buildings and reduction strategies to help influence the design decisions of similar projects and large space public buildings which are critical for emission reduction on a larger scale.

1. Introduction

Globally, the construction and operation of buildings account for 36% of the total final energy use and nearly 40% of greenhouse gas (GHG) emissions represented by carbon dioxide (CO2) [1]. China’s carbon emissions will peak by 2030 and, thus, need to be reduced dramatically as pledged in the Intended Nationally Determined Contribution (INDC), signed as part of the Paris Climate Agreement [2]. As the largest carbon emitter in the world, China is facing severe challenges in saving energy and reducing GHG emissions of built environments, which are gaining in importance as it moves to bring the building sector under control. In the 13th Five-Year Plan (2016–2020) implemented by the State Council, aiming to save energy and cut emissions, public buildings are emphasized [3], given that they have the largest share in the total consumption of operational energy (excluding district heating) among the different building categories. The most important reason is that the proportion of large-scale or large space public buildings in the building sector—for instance, transportation buildings—has been rising rapidly [4]. Large space buildings refer to those that have great floor height, large enclosed space volumes, and diverse ventilation systems [5]. Energy consumption of transportation buildings per square metre is two to three times that of conventional public buildings such as offices and schools, indicating their greater impact on energy and environment [6] (see Figure 1). As a typical large space public building, a high-speed railway station (HSRS) building is attracting increasing attention. The operating mileage of high-speed railway in China currently ranks first in the world under the ‘eight vertical and eight horizontals’ railway network plan [7]. These often run on newly created lines and therefore require improved modern stations on new sites. HSRS, known as the gateway to the city, will gradually become the most common type of railway stations, and an increasing amount of constructions will likely promote an upward trend in energy and resource demand in the immediate future. Due to increasingly stringent energy requirements and improved energy efficiency, the embodied GHG emissions from building materials are gaining significance [8,9,10,11]. As a major consumer of societal energy and national resources, it is necessary to conduct evaluative research on HSRS buildings in the scope of embodied GHG emissions.
Several studies have focused on the energy consumption and carbon emissions from multiple building typologies internationally, including residential, office, school, and hotel buildings in China [8,9], Norway [10,11], Spain [12] and the United Kingdom [13]. More attention should be paid to the environmental performance of HSRS buildings, which also needs to be drastically improved. A shift toward low-emission buildings of railway stations is laying down solid tracks for the sustainable building sector. The concepts of ‘zero emission station’, ‘zero energy station’, ‘green station’, and ‘eco station’ have emerged in order to address the global warming challenges from railway stations: for instance, the European Commission supports sustainable station constructions with the ‘Sus Station’ project and has achieved a new sustainable, low-carbon generation [14]. The green railway stations rating program of the Indian Green Building Council aims to reduce the adverse environmental impacts due to station operation and maintenance [15]. Despite all of this, earlier studies on railway station buildings mainly focused on energy efficiency [16,17,18,19,20,21,22], indoor thermal comfort [23,24], and ventilation and air quality evaluation [25,26]. Some research discussed the environmental impacts of the railway transport sector, in which railway stations are usually considered as a part of the whole infrastructure. In rail system studies, Håkan et al. [27] presented the energy use and GHG emissions results from example railway stations in construction, maintenance and operation by a life cycle approach. Zhang et al. [28] calculated high-speed transport energy consumption based on the construction investment integrating elements of life cycle analysis. However, work on the direct perspective of the emission data, as well as design measures in detail, is rather limited. Further study is needed to consider life cycle GHG emissions from HSRS buildings, which is rarely studied as the main research object.
Life cycle assessment (LCA) is a well established approach used for the environmental assessment of buildings and provides the necessary information for reducing the environmental impacts systematically and comprehensively [29]. It would be only giving a limited perspective of the environmental impact of a given building to judge the GHG emissions only during its operating phases. LCA makes it possible to evaluate the total GHG emissions and help to determine the ratio between embodied and operational emissions. Furthermore, LCA also aids designers in selecting optimal design solutions, by evaluating different emission reduction measures [30].
The complete life cycle of a building measures the cradle-to-grave impacts from four main stages [31]: the product stage (A1–A3), construction process stage (A4–A5), use stage (B1–B7), and end-of-life stage (C1–C4). The optional stage of benefits and loads (D) is defined to document potential emission compensation of processing or reusing materials after end-of-life. In accordance with international LCA standards [32,33], the LCA methodology is used to quantify the life cycle GHG emissions following four main steps: goal and scope, life cycle inventory (LCI), environmental impacts assessment, and results interpretation. Different studies have carried out the life cycle GHG emission calculations with varying objectives, system boundaries, data sources, and levels of detail, following the LCA methodology [11,34,35]. Some studies have briefly evaluated the life cycle CO2 emissions of an HSRS building for energy efficient and carbon reduction analysis [21,22]. However, these previous studies have not analyzed the purpose of evaluating life cycle GHG emissions to extract important design drivers and further understand how to reduce GHG emissions for HSRS buildings. In general, research on life cycle GHG emissions from HSRS buildings is representative, and provides a scientific basis for other large space public buildings.
The need to study the profile of environmental performance of HSRS buildings has led the authors to explore adaptive carbon reduction strategies on low GHG emission design. A typical medium-sized HSRS building in Tianjin, China was selected for the present study as a subject on which to conduct a detailed analysis. This work begins with introducing HSRS in China and outlining significant carbon mitigation measures in general buildings collected from literature, which provide background information about the following analysis. Section 3 presents the methodology used for evaluating and discussing the case study, taking into consideration the life cycle GHG emissions generated from materials and operational energy use. Section 4 describes the case building. The embodied, operational, and total GHG emissions are calculated and results are presented in Section 5 to extract design contributors and deduce reduction-oriented aspects. These findings are further discussed and a stepwise analysis from single to multiple strategies is proposed. The updated results of GHG emissions related to the case with different strategies regarding building space, envelope, and materials are recalculated, and the reduction proportion between origin and updated results of GHG emissions are investigated to extract reduction potentials by comparison. Final remarks are drawn in the conclusions.

2. Background and Related Studies

2.1. HSRS in China

2.1.1. Driving Policies and Regulations

For sustainable development and low carbon transformation, all levels of government (local, province, and even transportation agencies) have adopted effective policies to strengthen response, and taken actions to combat climate change, as illustrated later. A special plan for building energy conservation in China promulgated energy saving renovations at airports, piers, and railway stations according to China’s Energy Policy 2012 [36]. The 13th Five-Year Plan (2016–2020) continues to upgrade public buildings to high performance green buildings. Large railway stations are required to optimize design to realize gains in energy efficiency. The China Railway Corporation (CRC) pushed forward energy conservation in railway stations [7] and was required to stimulate a green and low carbon transportation plan in accordance with the 13th Five-Year Plan of Railway Development [37]. Newly built railway stations must meet the requirements of the design standard for energy efficiency of public buildings (GB 50189-2015) [38], which indicate that energy consumption of new buildings should be lower than 75% of that of comparable buildings in the 1980s. The standards for drainage systems, electrical systems, and renewable energy have also been raised [29]. Despite stricter design requirements and improved energy saving standards, there are few systematic design principles, strategies, and applications for reducing the life cycle GHG emissions of HSRS buildings. Under most circumstances, they only rely upon conventional building solutions and experiences of generic buildings and do not consider specific characteristics.

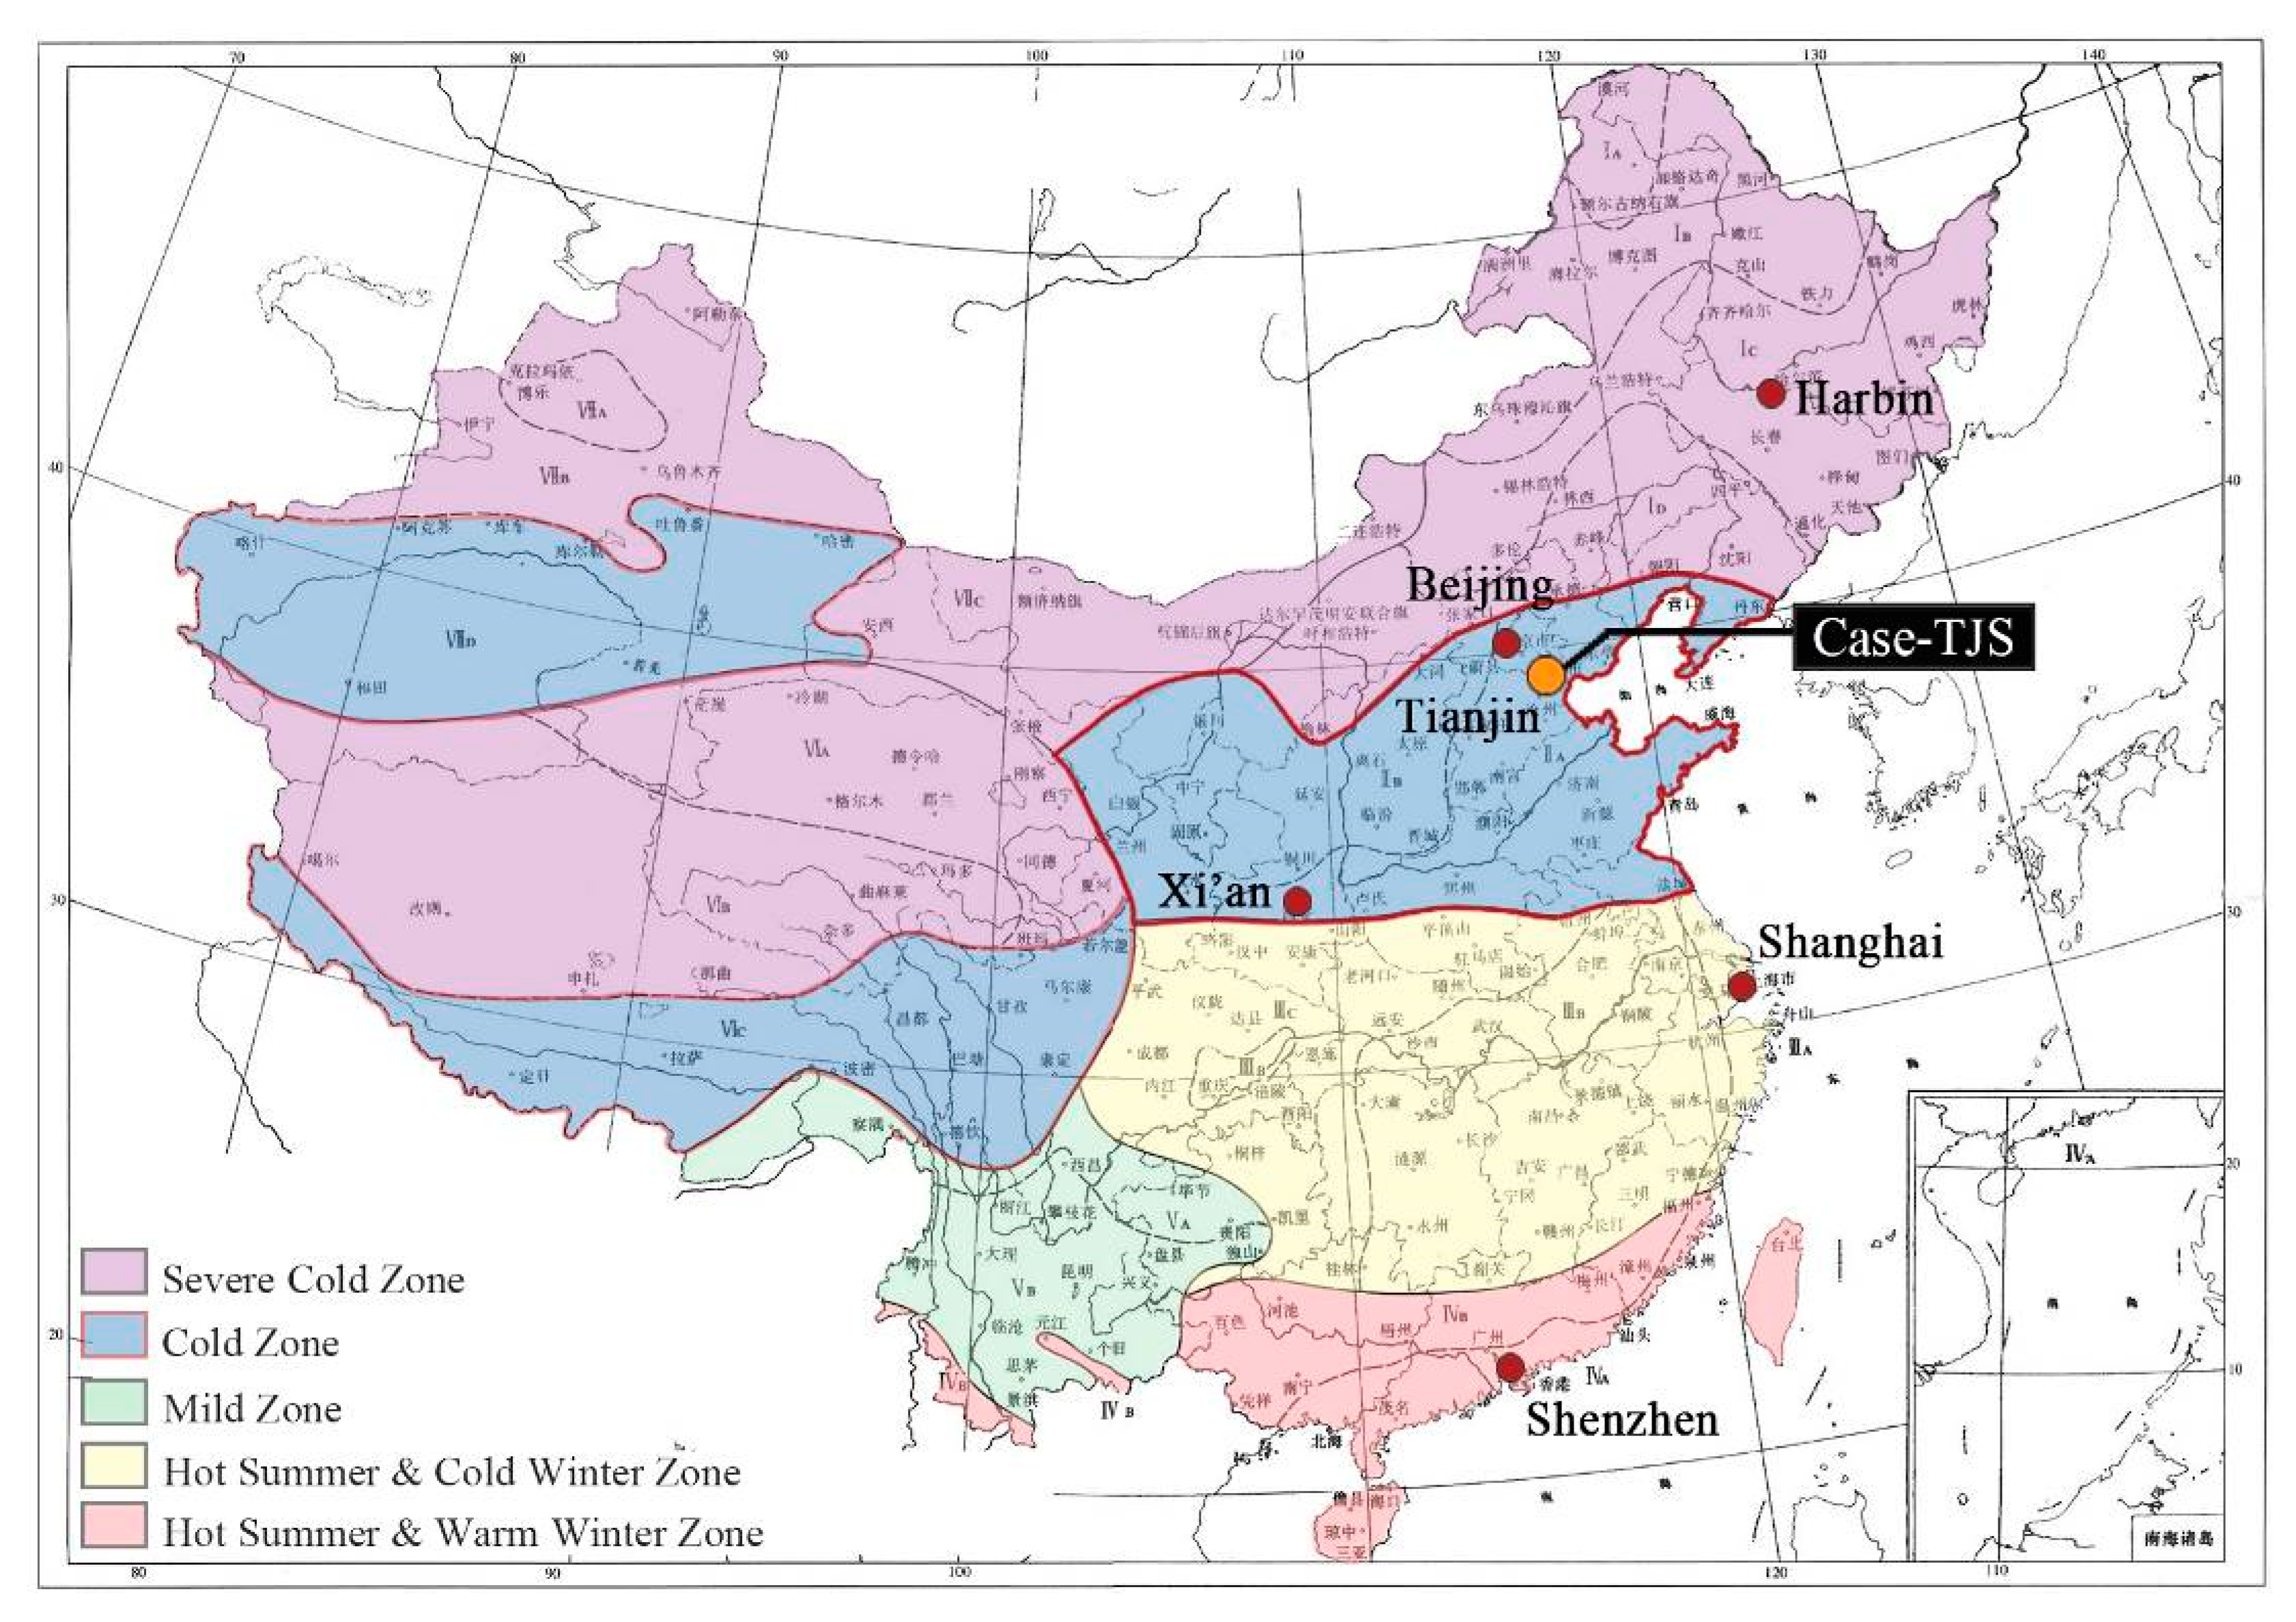
2.1.2. Characteristics of HSRS Buildings and Climate Zones in China

Railway stations are classified into super large, large, medium, and small sizes by construction scale, based on the maximum assembling passenger number or dispatched passenger number during rush hour [39]. Medium-sized railway stations are significantly important for study because they have the largest share of the railway station stock in China. A railway station is a complex example of civil engineering, as it includes buildings, platforms, and other infrastructures. In this study, a railway station building refers to the main building in the station, a multi-functional complex that provides facilities such as a waiting room, ticket office, shopping, restaurants, variety stores, and other amenities for passengers. Compared with general public buildings such as governmental offices, domestic HSRS buildings have certain characteristics that are similar to the renewed modern railway stations. Typically, massive, reinforced concrete structures are used with large glass areas and structural steel (see Figure 2). The waiting room/hall is designed as a large enclosed space volume with high floor height making the building a city landmark. Many new stations follow design principles similar to airports, with constant daily operation [20]. For the convenience of management and use, the station building is usually designed along the railway line, so its main orientation is not consistent with the best orientation in most cases.
The local climate conditions to which the building is exposed play a significant role in selecting effective climate responsive strategies during the design process. As defined by the National Uniform Standard for Design of Civil Buildings (GB 50352-2019), China is divided into five main climate zones: severe cold, cold, hot summer and cold winter, hot summer and warm winter, and mild. In northern China, operating energy has a relatively comprehensive configuration in which heating accounts for a larger proportion compared to that in southern regions because of climate condition differences. Severe cold and cold zones in the north region present saving potentials for operational energy emissions on cooling as well as heating. One of the largest cities in the cold zone, Tianjin, has a typical temperate monsoon climate with distinct seasons, which varies greatly in summer (hot and rainy) and winter (cold and dry). The thermal design of the building envelope in Tianjin requires the extensive use of strategies for insulation, not only for the cold winter weather but also for summer heat protection. In this research, a medium-sized building from Tianjin South Railway Station was selected as the case to be studied (henceforth Case-TJS). The cold zone and site of the case building are depicted in Figure 3.

2.1.3. Field Investigation and Questionnaire

To explore the possible influence of design factors on energy consumption, the research team conducted a field investigation of 10 HSRS buildings along the Beijing–Shanghai high-speed railway. The buildings vary in their capacity, GFA, width, depth, and height. A brief comparison is provided in Table 1. It was found that station buildings face the same architectural and technical design problems and have great energy saving potential in terms of form scale, space utilization, function layout, building details, and operating frequency:
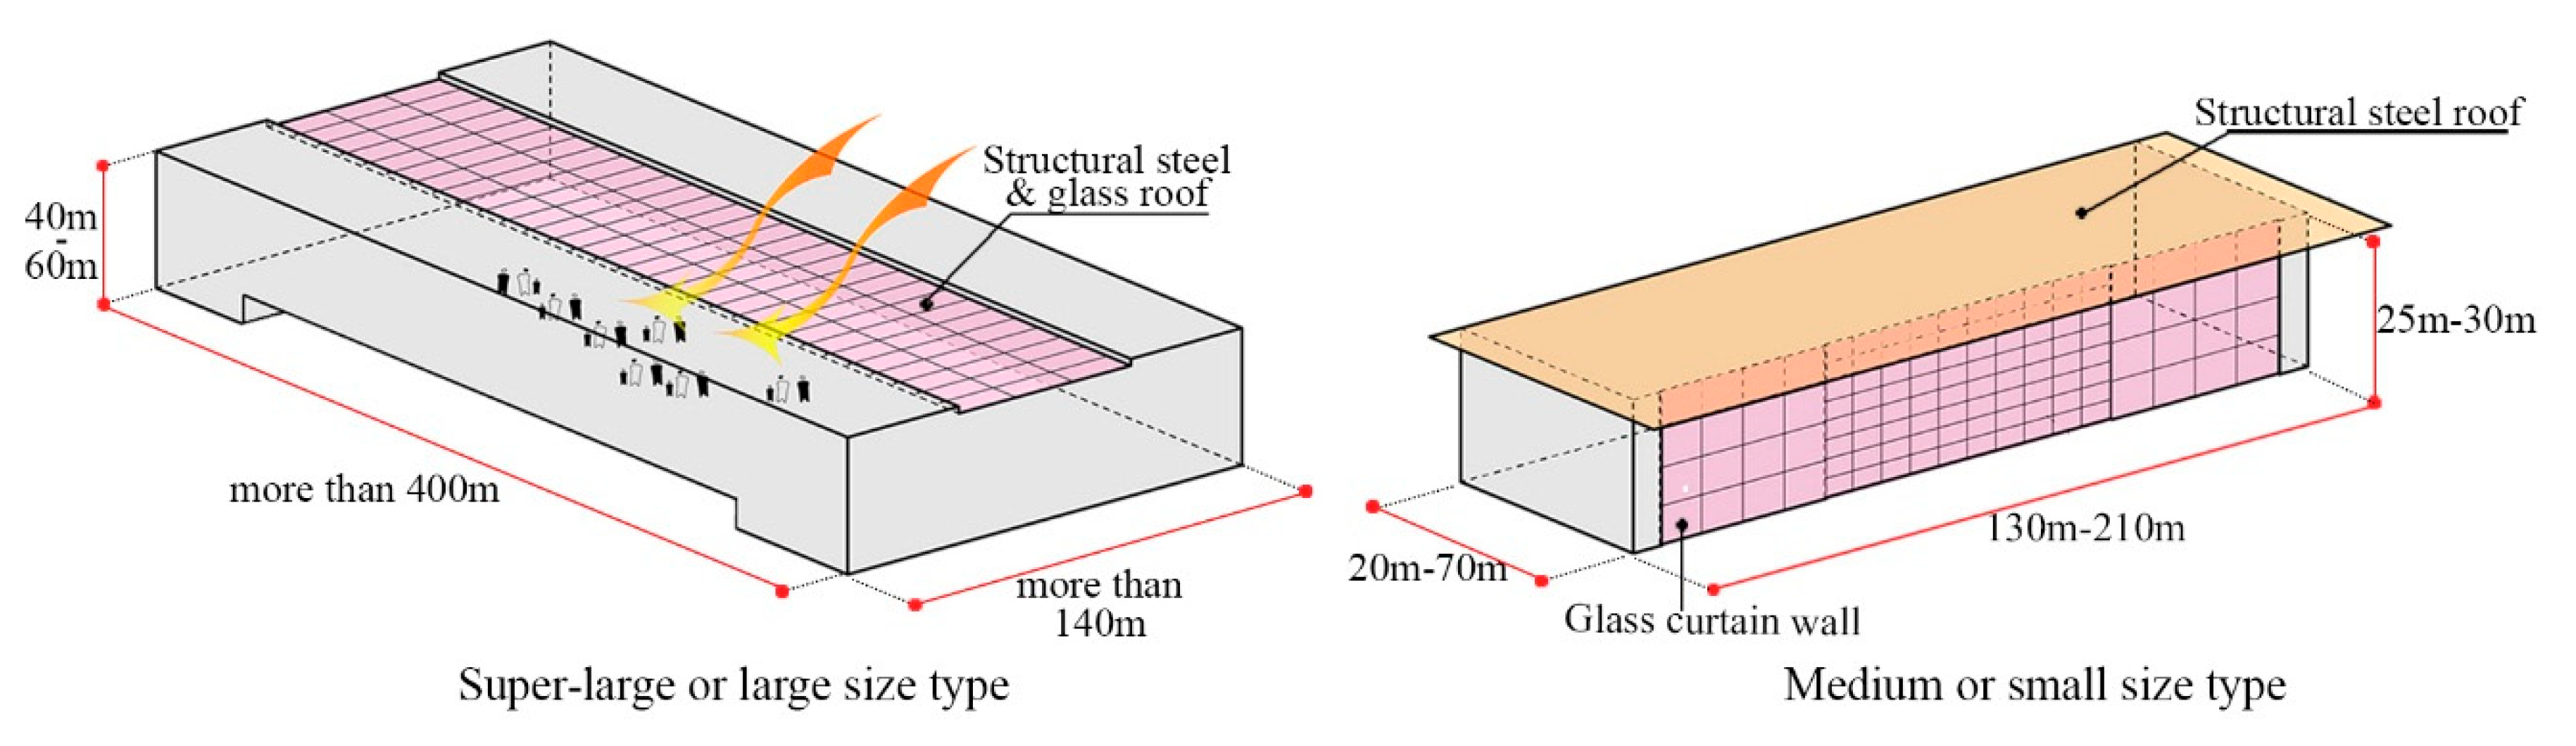
  • For medium-sized HSRS buildings, the width is usually from 145 m to 206 m, as well as depth being from 20 to 44 m. The average roof height is approximately 26 m, which is larger in buildings of a super large or large size. There are overcrowded passengers in station (10) but few in station (2), and the capacity design is shown to be not consistent with the scale.
  • The height above the enclosed waiting room cannot be used efficiently, since they consume energy for operation, which reflects low utilization of vertical space.
  • No thermal partitions are set up in waiting rooms. The HVAC system works for a centralized large room and can’t be controlled in a modular way according to the pedestrian volume.
  • The glass curtain wall makes the building transparent; however, the shading devices seem not to be enough in summer seasons.
A questionnaire survey was also conducted among 485 passengers on travel behaviour, in which 72% stated that they prefer to arrive at the waiting room less than half an hour before a train’s departure instead of waiting for a long time. In fact, high-speed trains depart every five to ten minutes in most stations, implying that ticket gates have to be opened frequently to check tickets. Passengers do not have to stay in the enclosed waiting room for a long time. The waiting room area, defined originally by regulations governing conventional railway stations, encourages unnecessary energy consumption in HSRS.

2.2. GHG Emission Reduction Strategies for Buildings

Research concentrating on railway station buildings, especially the high speed type, is relatively limited; some of the existing literature takes into account reduction measures for energy consumption that are directly correlated to operational emissions, such as: the relationship between energy consumption and passenger flow density [16]; energy efficiency measures on performance parameters of a building envelope, area ratio of skylight and sun shading mode [17]; energy saving approaches that place greater emphasis on the reduction of air infiltration [18]; triadic relation among lighting comfort level and lighting energy consumption [19]; intelligent control strategies as feasible energy saving solutions [20]; and energy efficient analysis on construction scale, space design, function layout, and operation mode [21,22]. Energy potential in conventional stations or HSRS has been analyzed in different domestic regions. These studies mainly focus on reduction measures in terms of building envelope, while few are concerned with the influence of building form in terms of space design.
In recent years, there has been growing interest in not only the evaluation of embodied emissions, but also the effect of innovative and alternative solutions to reduce total embodied environmental impacts. However, there has been rarely research on railway station buildings focusing on embodied emissions, which can be understood by analyzing other building categories. For instance, Luo et al. [8] analyzed and calculated the CO2 emissions of 78 office buildings in the construction materialization stage, obtaining results of 327kgCO2/m2 on average (building lifetime is considered to be 50 years). A prediction formula using steel reinforcement, concrete, and wall materials as independent variables was found to predict CO2 emissions. Existing research displayed high carbon mitigation potentials when taking into consideration the substitution of building materials/components during the early stage design of buildings [41]. Zhang et al. [9] demonstrated that residential and office buildings with a reinforced concrete block masonry structure could reduce carbon emissions by 6–18% compared with either a reinforced or brick concrete structure. Substantial reductions of embodied energy (or carbon) for the use of traditional and locally available building materials were shown, compared to using conventional materials/components in some studies [42,43]. Other studies [44,45] revealed that the use of recycled and reused materials can significantly reduce the embodied energy and carbon emissions in buildings. A study by Maddalena et al. [46] indicated that implementation of materials/components with new and innovative technologies helps reduce the embodied carbon of buildings, such as in the form of “green” types of cements and high performance concrete.

3. Methodology

3.1. Life Cycle GHG Emissions Calculation

3.1.1. Goal and Scope

The goal of this analysis is to evaluate, quantify, and present an overview of life cycle GHG emissions of the HSRS building as a basis for investigating emission reduction strategies. Figure 4 shows the life cycle phases and system boundary for the case study. The system boundary is founded on the modular life cycle system boundaries as in EN15978: 2011 [31] and defined in accordance with the scope of OM: O (operational energy use), which refers to life cycle module B6, the direct carbon emissions resulting from fossil fuels and electricity during the operation process; M (materials) corresponds to life cycle modules A1–A3 and B4, for the production and replacement of building materials, the current scope of embodied GHG emission calculation. Embodied GHG emissions are limited from raw material supply to manufacturing of the main products and materials needed, which include material inputs to the gate. The replacement of new materials over the building’s lifetime has also been included. A building reference study period is set to 50 years in terms of the design lifetime (50–100 years) of HSRS based on the standard [47]. The estimated service lifespans of different building materials and components are mainly based on average values from product suppliers and research literature [48,49].
The functional unit is expressed as per 1 m2 of unit gross floor area (GFA) over the building lifetime, to provide a reference for relevant inputs and outputs, so as to ensure the comparability of calculation results. The global warming potential (GWP) is weighted by carbon dioxide equivalents (CO2eq) with the Intergovernmental Panel on Climate Change’s 100-year horizon method. Thus, life cycle GHG emissions (noted as LCCO2eq below) (kg CO2eq/m2·a), GHG emissions per unit construction area and one year of building’s service life, can be taken as the functional unit of LCCO2eq of an HSRS building. All the calculations follow the principles of an environmental assessment through life cycle analysis. The calculation model is as follows.
LCCO2eq = LCCO2eq(A1-A3) + LCCO2eq(B4) + LCCO2eq(B6)
Here, LCCO2eq(x) refers to the GHG emissions generated from specific (x) life cycle module (A1–A3, B4 or B6). LCCO2eq represents the total GHG emissions of a function unit in the life cycle. In the complete life cycle of an HSRS building, A1–A3, B4, and B6 are together responsible for more than 90% of total emissions in the case studies [21]. The early design stage has the largest impact on the life cycle stages, while controlling transportation/construction, and the end-of-life stage is difficult [50]. Additionally, energy performance can be improved by architects and engineers by integrating adaptive strategies in the early design stage [51]. Thus, the construction process stage (A4–A5) and end-of-life stage (C1–C4) have been excluded in this study.

3.1.2. Data Sources

Building materials referred to in this study are mainly categorized into four parts: wall materials, concrete, steel, and mortar. When the case study was carried out, there was an unknown environmental product declaration (EPD) providing transparent and consistent information about specific CO2eq emission data from the construction material supplier or manufacturers in China. Generic CO2eq emission data of construction materials from the Chinese national standard for building carbon emission calculation [52] are used, as shown in Table 2. The CO2eq emission data of construction materials in terms of insulation, window, and concrete block are taken from a database of related research [48,49] when the standard is lacking. Electricity is the only form of energy delivered to the case building systems. The annual electric GHG emission factor plays an important role in operational emission calculation. Previous research has updated the CO2eq factors for Chinese electricity grids in seven regions to determine the organization’s and product’s carbon footprint with necessary modifications [53]. The present work considers a specific factor of 1.15 kgCO2eq/kWh [53] to calculate the emissions from the electricity, and it is assumed to remain constant during the building’s lifetime. The GHG emissions related to energy use can be highly sensitive to the electricity emission factor. The current electricity consumed is from the north region power grid, national public network. The primary energy resources involved come from coal, hydroelectric and wind. Coal-fired electricity generation constitutes approximately 99% of power generation, leading to a high value of CO2eq factor.

3.1.3. Material Inventories and Levels of Detail

Load-bearing structures and building envelope partitions are the main sections in the entire building formation stage [8]. Hence, in this study materials inventory is simplified and excludes inventory of building services, equipment, and internal finishes. The life cycle material inventories for the case study are structured according to the building elements classified in the LCA tool, such as groundwork and foundations, load bearing structure, outer walls, inner walls, floor structure, and outer roof. In addition, the construction elements of railway stations outside surroundings such as railway platforms, platform canopies and loading platforms have not been included in the models due to the focus on developing solutions at the individual building level. The data include the most up-to-date building details; material properties and related information were collected from building constructions in order to build a model to obtain the material quantities data. A quota calculation method [54] was chosen to measure the quantities of unclear materials for calculation simplification, such as foundations and steel bars in the concrete structure. A 5% and 10% surplus for different materials were added in order to account for on-site processes, broken elements, and purchased quantities.

3.2. Implementation of Sensitivity Analysis in Building Models

Sensitivity analysis (SA) is the observational study of identifying the most influential input parameters for the output behaviour in the model. Besides increasing the understanding of the relationships between design parameters and objectives of key performance indicators (KPIs), SA can be a valuable tool for supporting a design–optimization process, by narrowing the search ranges and limiting the number of factors to only the most significant ones. Therefore, it has been broadly used in the domain of building performance analysis and explores the highly sensitive parameters influencing energy performance for design support in various building types or climate zones [55,56]. Two major methods for SA are termed ‘local’ and ‘global’ as summarized in [57]. The global sensitivity analysis (GSA), as a more reliable method, includes regression (e.g., SRC), screening methods (e.g., Morris), and variance based (e.g., FAST, Sobol indices) and meta-model approaches. When restricted to the quantification of environmental impact, it behaves linearly, with standardized regression coefficients (SRC), etc., that can be chosen [57]. Another technique to avoid extensive combinations of extreme values is stochastic modelling with the aid of a Monte Carlo simulation or Latin hypercube sampling (LHS). In the simulations, a predefined, limited number of combinations of random parameters are used to calculate the outcomes [58].
To simplify the complexity of evaluation, in this study a SA of multiple design variables of building envelope in software to operational GHG emissions was performed to evaluate the highly sensitive parameters. The results are used for preliminary judgment, to predict optimal design strategies, and to conduct further analysis. Design strategies in terms of space and material could not be defined as design variables in aided tools; therefore, the analysis was conducted separately and manually. The SA method implemented in this study is SRC, with the sampling method of LHS. SRC value, as a sensitivity index, is used to describe the relative influence of variability parameters on the output results of a model. A high value of SRC indicates that the parameter has a strong influence on the results. The output objective of ‘operational CO2eq emissions’ is defined and calculated by referring to annual total energy related emissions.

3.3. BIM-LCA Approach
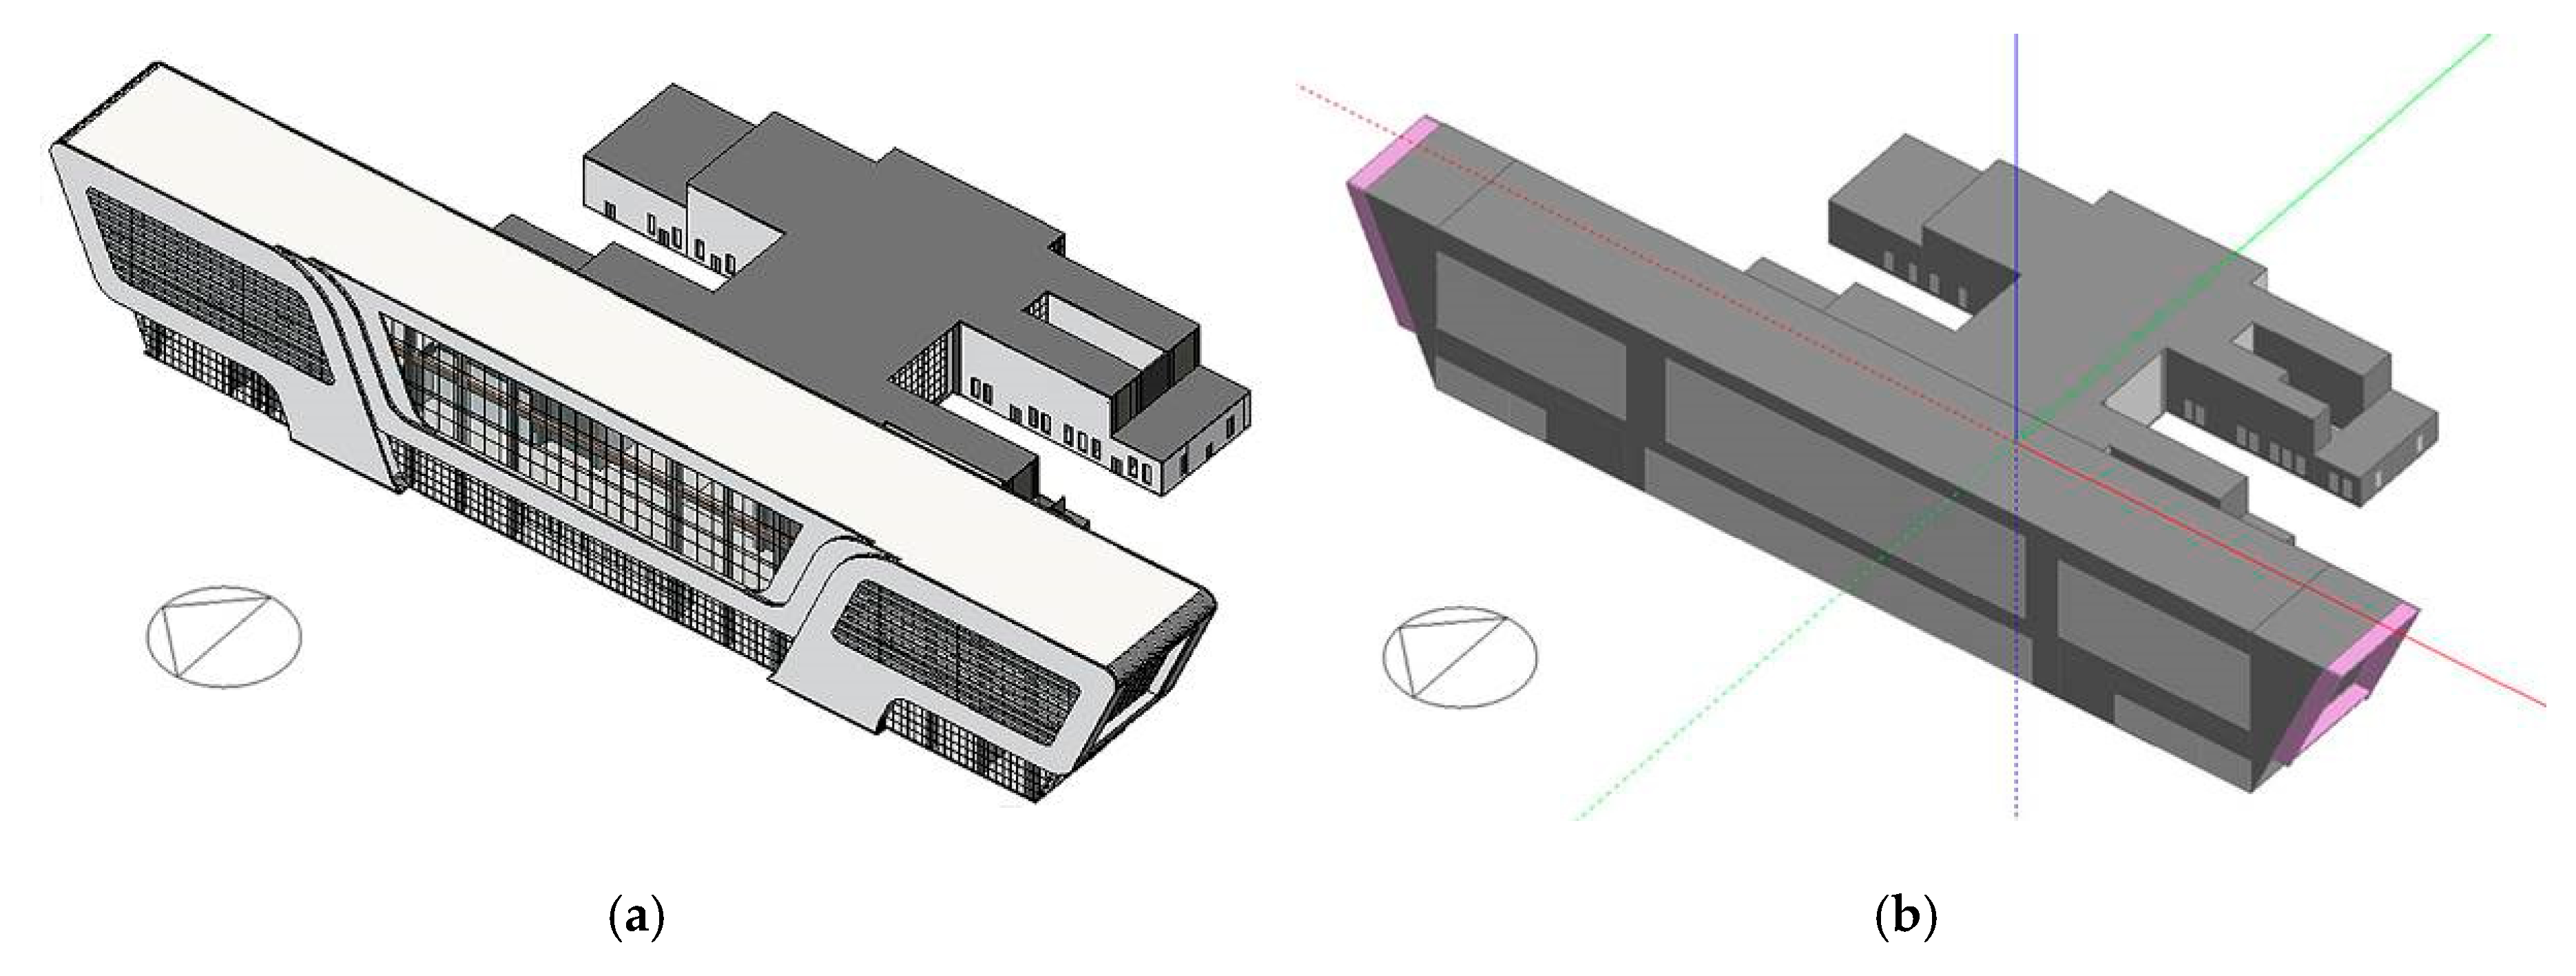
For an efficient and systematic connection of building models, energy simulation, and life cycle GHG calculation, this study integrated all work based on a ‘building information model (BIM)’ with support tools. The case model, built in Autodesk Revit, contains the building model’s geometric, space, and some thermal information; therefore, it is referred to as the ‘building information model’. For building energy simulation and further design optimization, the ‘building information model’ in Autodesk Revit was then converted to the ‘building energy model’ directly, using simulation software DesignBuilder with EnergyPlus engine. Some complicated and special components should be simplified for making it efficient to run a simulation, but close to the real situations. For instance, beams and columns of structures are deleted and some curves of window corners are changed to straight lines. The energy used for operation of the building was calculated through specific input data for energy simulation. An Excel based LCA tool was used in this study, which was developed by the Research Centre for Zero Emission Buildings and verified in life cycle GHG emission calculations for numerous case studies and pilot buildings [10,11,59]. Proper categories and boundaries are set in order to acquire relevant outputs. Quantities of different materials and components have been exported from the Revit/BIM model, and then delivered to the LCA tool for detailed GHG calculations. The materials and components contained in the BIM output correspond to the categories in the LCA tool. In DesignBuilder, GSA of operational energy emissions was also conducted to filter out the highly sensitive parameters, which are the key design strategies of the building envelope to be considered.

4. Case-TJS

4.1. Case Description

Almost all medium-sized HSRS buildings in the cold zone follow the characteristics mentioned in Section 2.1.2. Additionally, they have a similar structure and envelope pattern and thus the variables are limited. The materials used for the building structure were reinforced concrete, and the envelope is mostly hollow concrete block with a curtain wall system. Case-TJS is used as a representative sample in this study. The results of the analysis are applicable to other medium-sized HSRS buildings in China.
Case-TJS is a 2-story building comprising a ground floor (0F) and a first floor (1F, platform), covering a GFA of 8669 m2. It is located in the Xiqing District, southwest of Tianjin, China. The Xiqing district is at 39°N latitude with a mean daily outside relative humidity of 62–73%. The mean daily outside air temperature is 29.3 °C in summer and –9.4 °C in winter. The case building is composed of two parts, the west wing building (rail side) and east wing building below the railway lines or platform (rail below). Typically, the west wing building is representative in space, structure, envelope, and materials. The internal height is 30 m, the same as the large waiting room. The width and depth are 145 m and 20 m, respectively. Case-TJS is oriented east west, as are other stations in the Beijing–Shanghai railway network. The maximum assembling passenger number is about 1000 people.
The structural components refer to the column and beams; the foundation and the floor slab are composed of reinforced concrete, others being steel truss structures in the west wing roof. The external walls contain a small concrete hollow block, 100 mm Rockwool (west wing) or 60 mm polystyrene (east wing) insulation with an ETERPAN fibre cement board. A double low-E glazing glass curtain wall was used as a waiting hall envelope. The outer roof of the west wing consists of 100 mm of aluminium foil glass wool insulation with colour steel lamellas for the sunscreen. The east wing roof is mainly covered with a reinforced concrete slab and 80 mm extruded polystyrene (XPS) insulation. No skylights and solar thermal collectors are currently installed on the roof. The floor is decking with 30 mm of XPS insulation, fine stone concrete, and granite.

4.2. Parameter Setting for Simulation

Figure 5a shows the building information model built in Autodesk Revit. Figure 5b shows the building energy model in the simulation software DesignBuilder. The meteorological data used for the simulation correspond to the local climate, according to the Chinese Standard Weather Data. Heated rooms, such as the waiting hall and office, are the primary areas with floor heating and XPS insulation. The indoor design parameters of occupancy, the HVAC system, lighting, and domestic hot water (DHW) are in accordance with the real condition and code for design of a railway passenger station [39], and are shown in Table 3. The waiting hall/room is a typical feature in station buildings; the parameter in these areas is particularly important. The occupancy density of the waiting hall is determined as 0.12 persons/m2 considering the high mobility and regularity of passengers. To achieve satisfactory levels of thermal comfort in summer, most railway stations in cold regions have a central air conditioning system. Electric power is needed for energy supply solutions. The building has a balanced mechanical ventilation system equipped with a heat recovery unit. The variable air volume ventilation operates a mixed flow in the waiting and ticket room: the fresh air is supplied into the building from the top and is extracted down into devices below. Standard hygienic flow rates are imposed, with minimum fresh air 2.778 l/s per person. The building is equipped with electric water to the water/ground source heat pump (GSHP) to cover the thermal needs (i.e. space heating and cooling). A floor heating system is used in the waiting room. The value of the whole system seasonal coefficient of performance (SCOP) in heating and the energy efficiency ratio (SEER) in cooling for specific pump power is set to 4.0 and 4.8 respectively. The heat pump produces hot water with a temperature of 45 °C in winter, and cold water combined with air-to-water chillers in summer (supply temperature of 12 °C). The energy consumption of fans, pumps and other auxiliary equipment is calculated. The consumption rate of 0.4 l/m2·day is supplied for DHW with a draw-off temperature set at 65 °C. These reflect the practices in modern medium-sized HSRS buildings. The operation schedule is from 05:00 to 23:00, in keeping with the existing train time of day scheduling in Case-TJS. The indoor illuminance of the waiting room is controlled to be 200 lux and the power density is 8 W/m2.

5. Results and Discussion

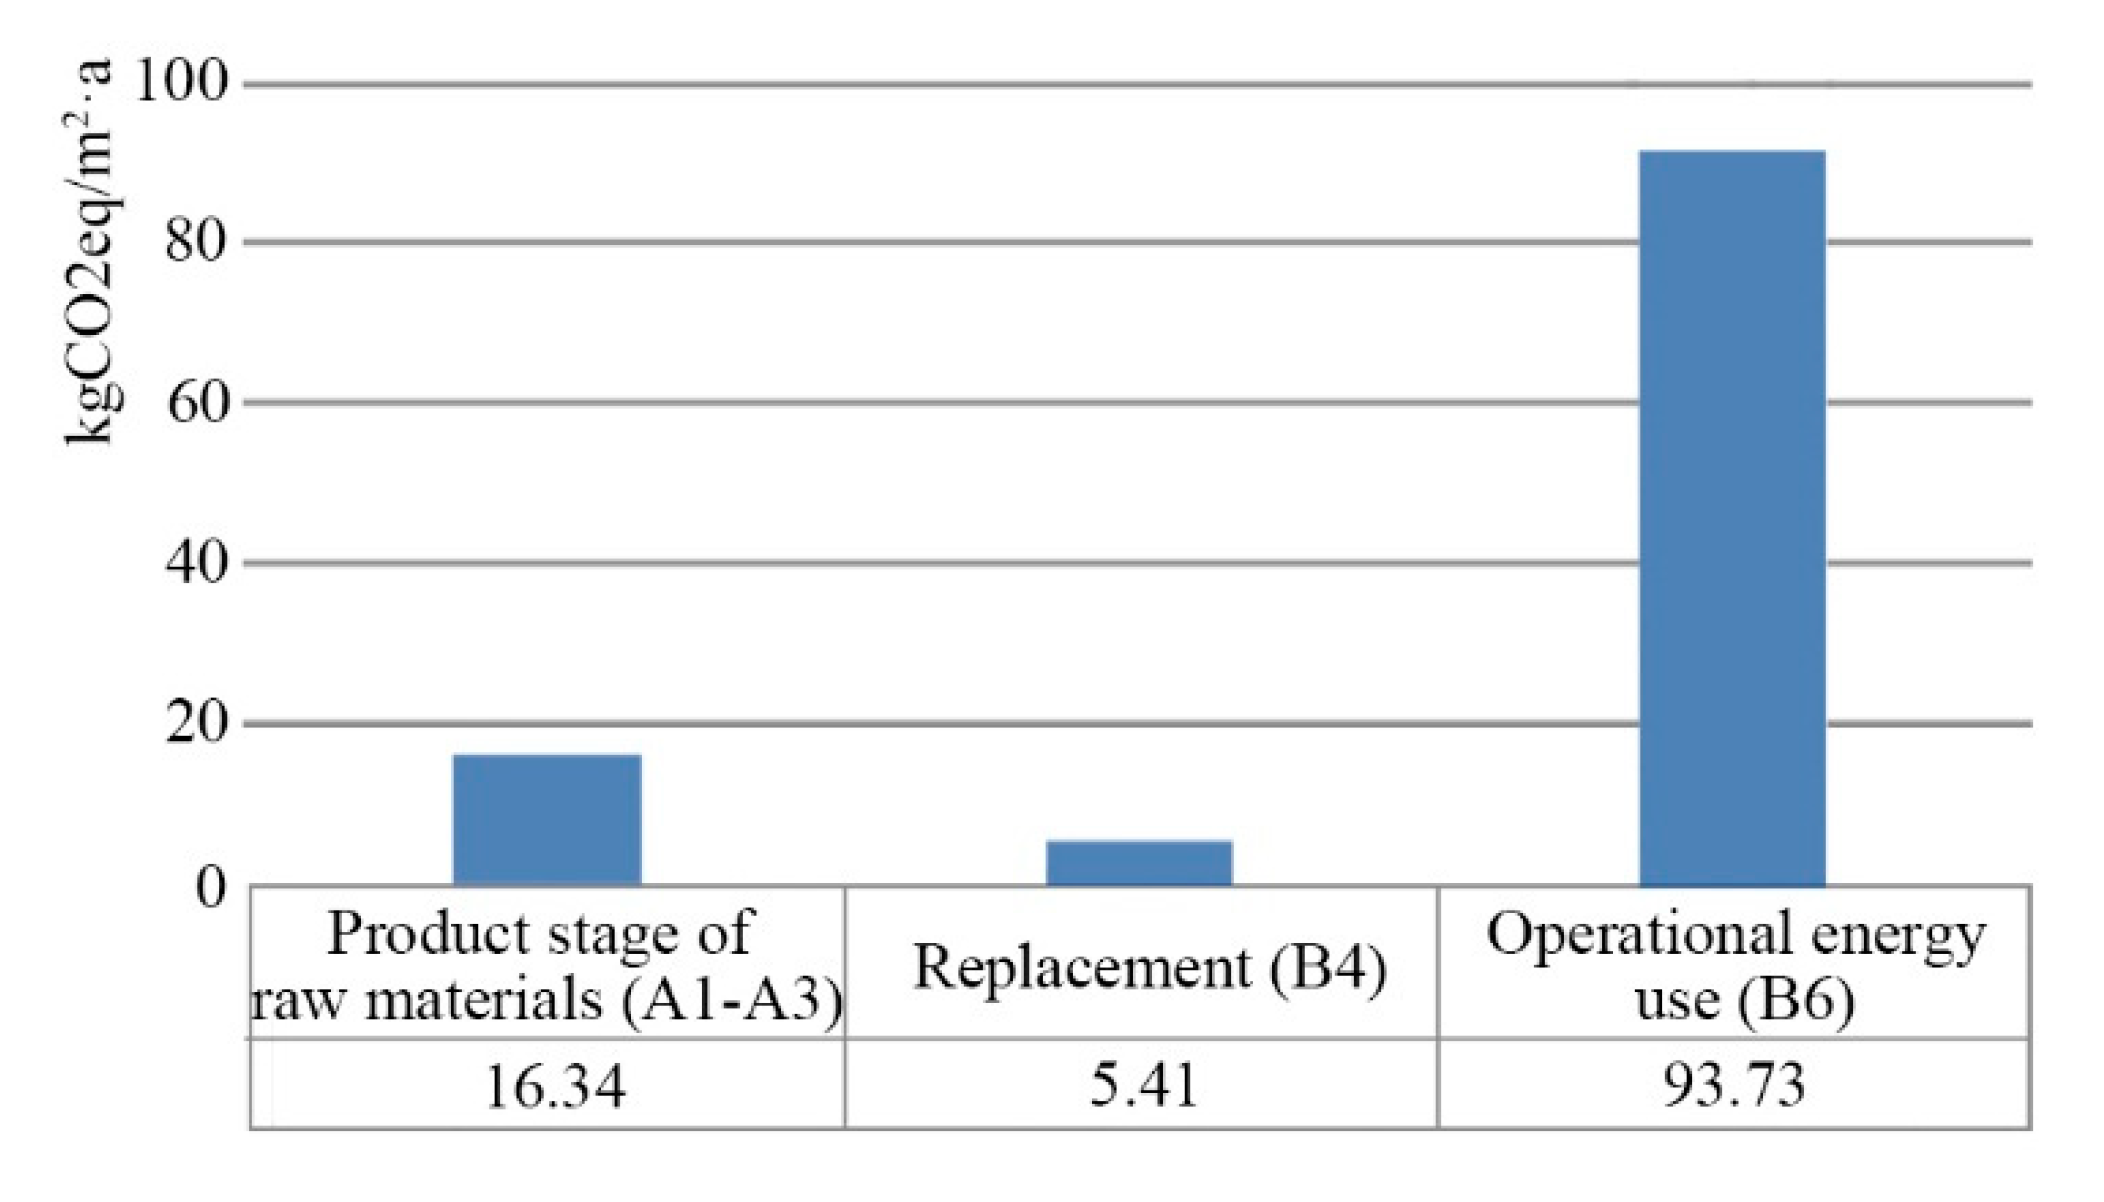
5.1. LCCO2eq by Life Cycle Module

According to energy simulation results shown in Figure 6, the total annual electricity consumption for the building is 706,523 kWh/year, including heating, cooling, lighting, fans and pumps, and DHW. The operation energy use per unit area of the case building is 81.5 kWh/m2·a, corresponding to operational energy emissions of 94 kgCO2eq/m2·a, as electric CO2eq factor is 1.15 kgCO2eq/kWh. Heating and cooling are the main energy consumers in Case-TJS, followed by lighting, which is consistent with the previous study about large-sized HSRS buildings [22].
Figure 7 shows the contribution of different life cycle modules in GHG emissions, assuming a 50-year life span. The total LCCO2eq is calculated to be 115 kgCO2eq/m2·a. The majority of emissions apparently occur during the operational energy use phase (O, or B6), constituting a percentage of 81%. Thus, operational energy emissions are much more dominant than embodied GHG emissions for the case study. This can mainly be due of the high emission factor used for the grid. As a previous analysis shows, low utilization of vertical height is perhaps also a reason for not only high energy consumption and associated emissions in domestic HSRS buildings, but also low occupant density of the waiting room. Construction material emissions from the production and replacement phases (A1–A3 and B4) contribute 14.1% and 4.7% respectively, with a high level of 22 kgCO2eq/m2·a in total, compared to other building typologies. The embodied GHG emissions of life cycle module A1–A3 is 3.0 times that of module B4. The calculation results also highlight the significance of embodied GHG emissions, accounting for approximately 19% of GHG emissions generated from the life cycle of HSRS buildings.

5.2. Embodied GHG Emissions of Building Materials

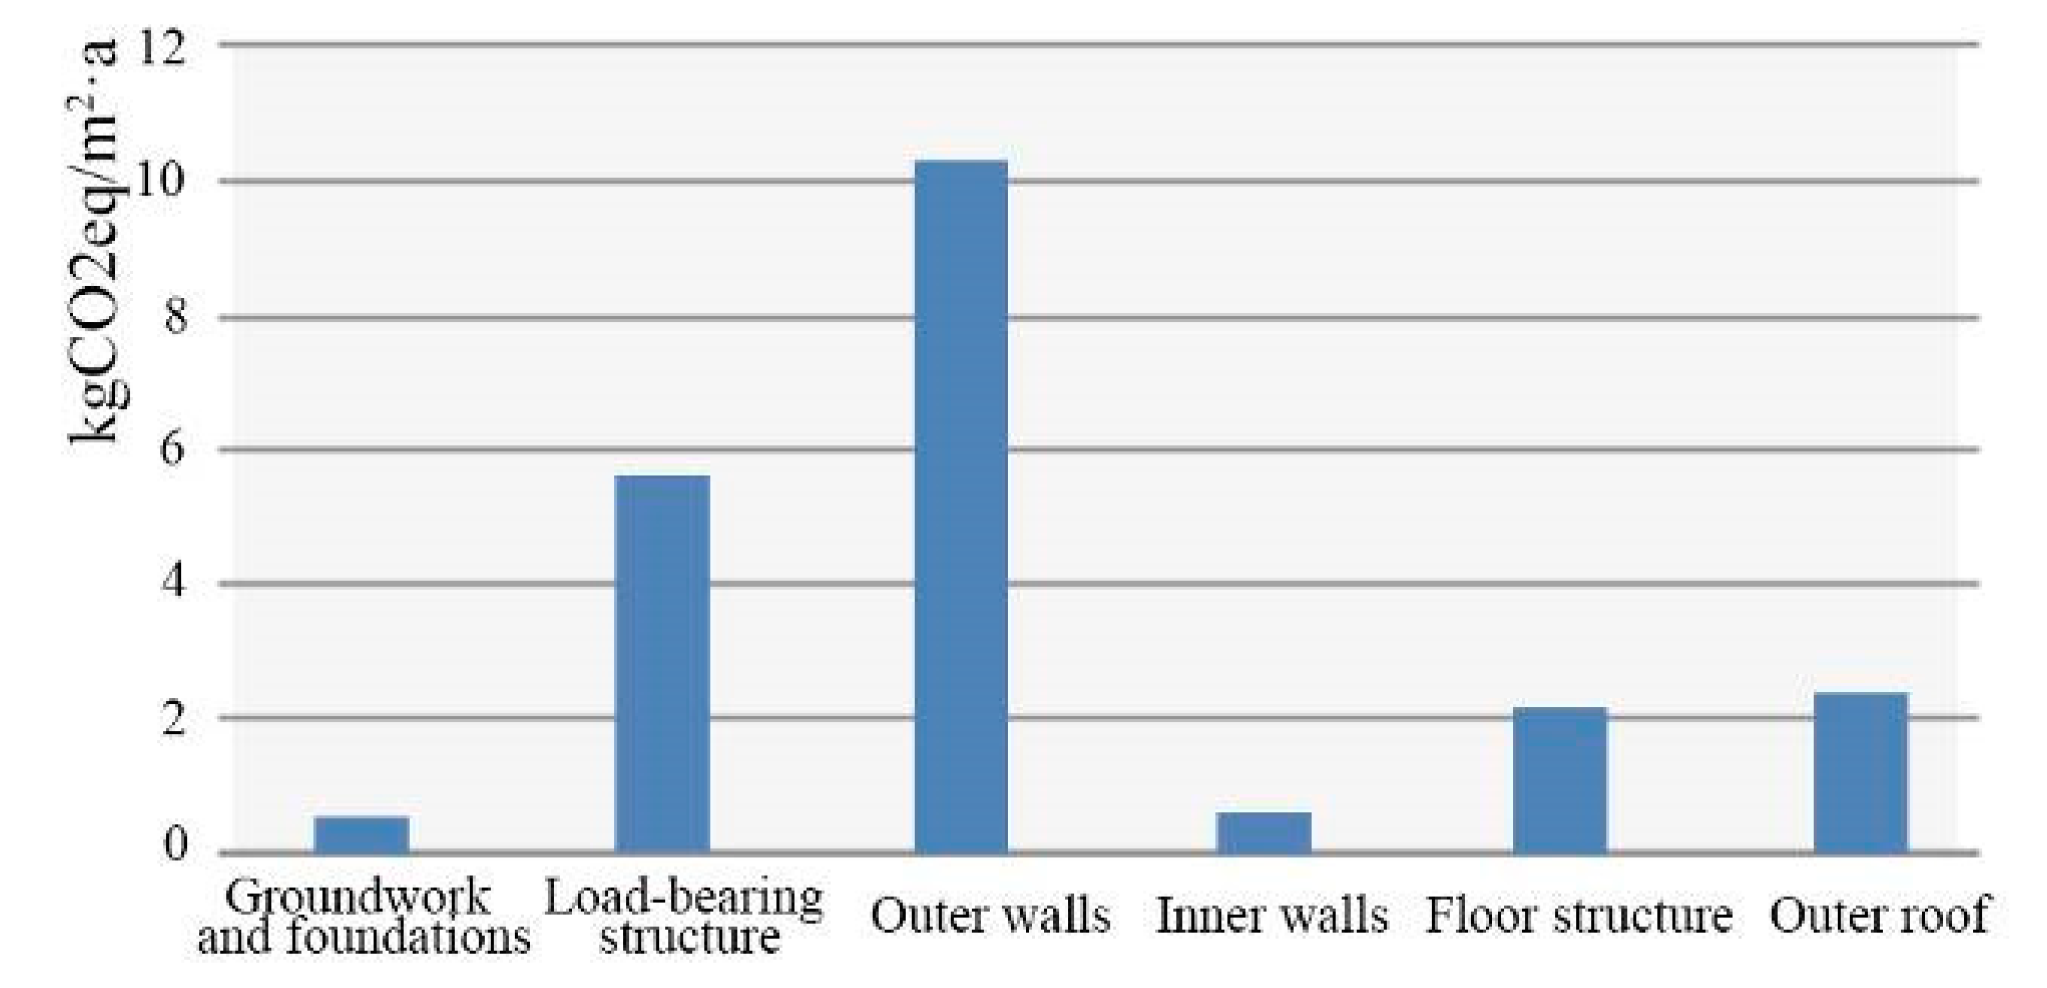
5.2.1. Embodied GHG Emissions by Building Elements

This study detailed the embodied GHG emissions of each section in life cycle modules A1–A3 and B4. The embodied GHG emissions of different building elements and the percentage they constitute are summarized in Table 4. The results show that outer walls are the largest contributor to high embodied GHG emissions across the building elements, contributing approximately 48% to total embodied GHG emissions; the load bearing structure contributes approximately 26%; the floor structure and outer roof contribute approximately 10% equally; while groundwork, foundations, and inner walls contribute the least. A breakdown of embodied GHG emissions by each building element is shown in Figure 8. Outer walls and load-bearing structures are main drivers for high embodied GHG emissions because they constitute the main construction elements of the building and use materials with high embodied GHG emissions such as reinforced concrete and steel.

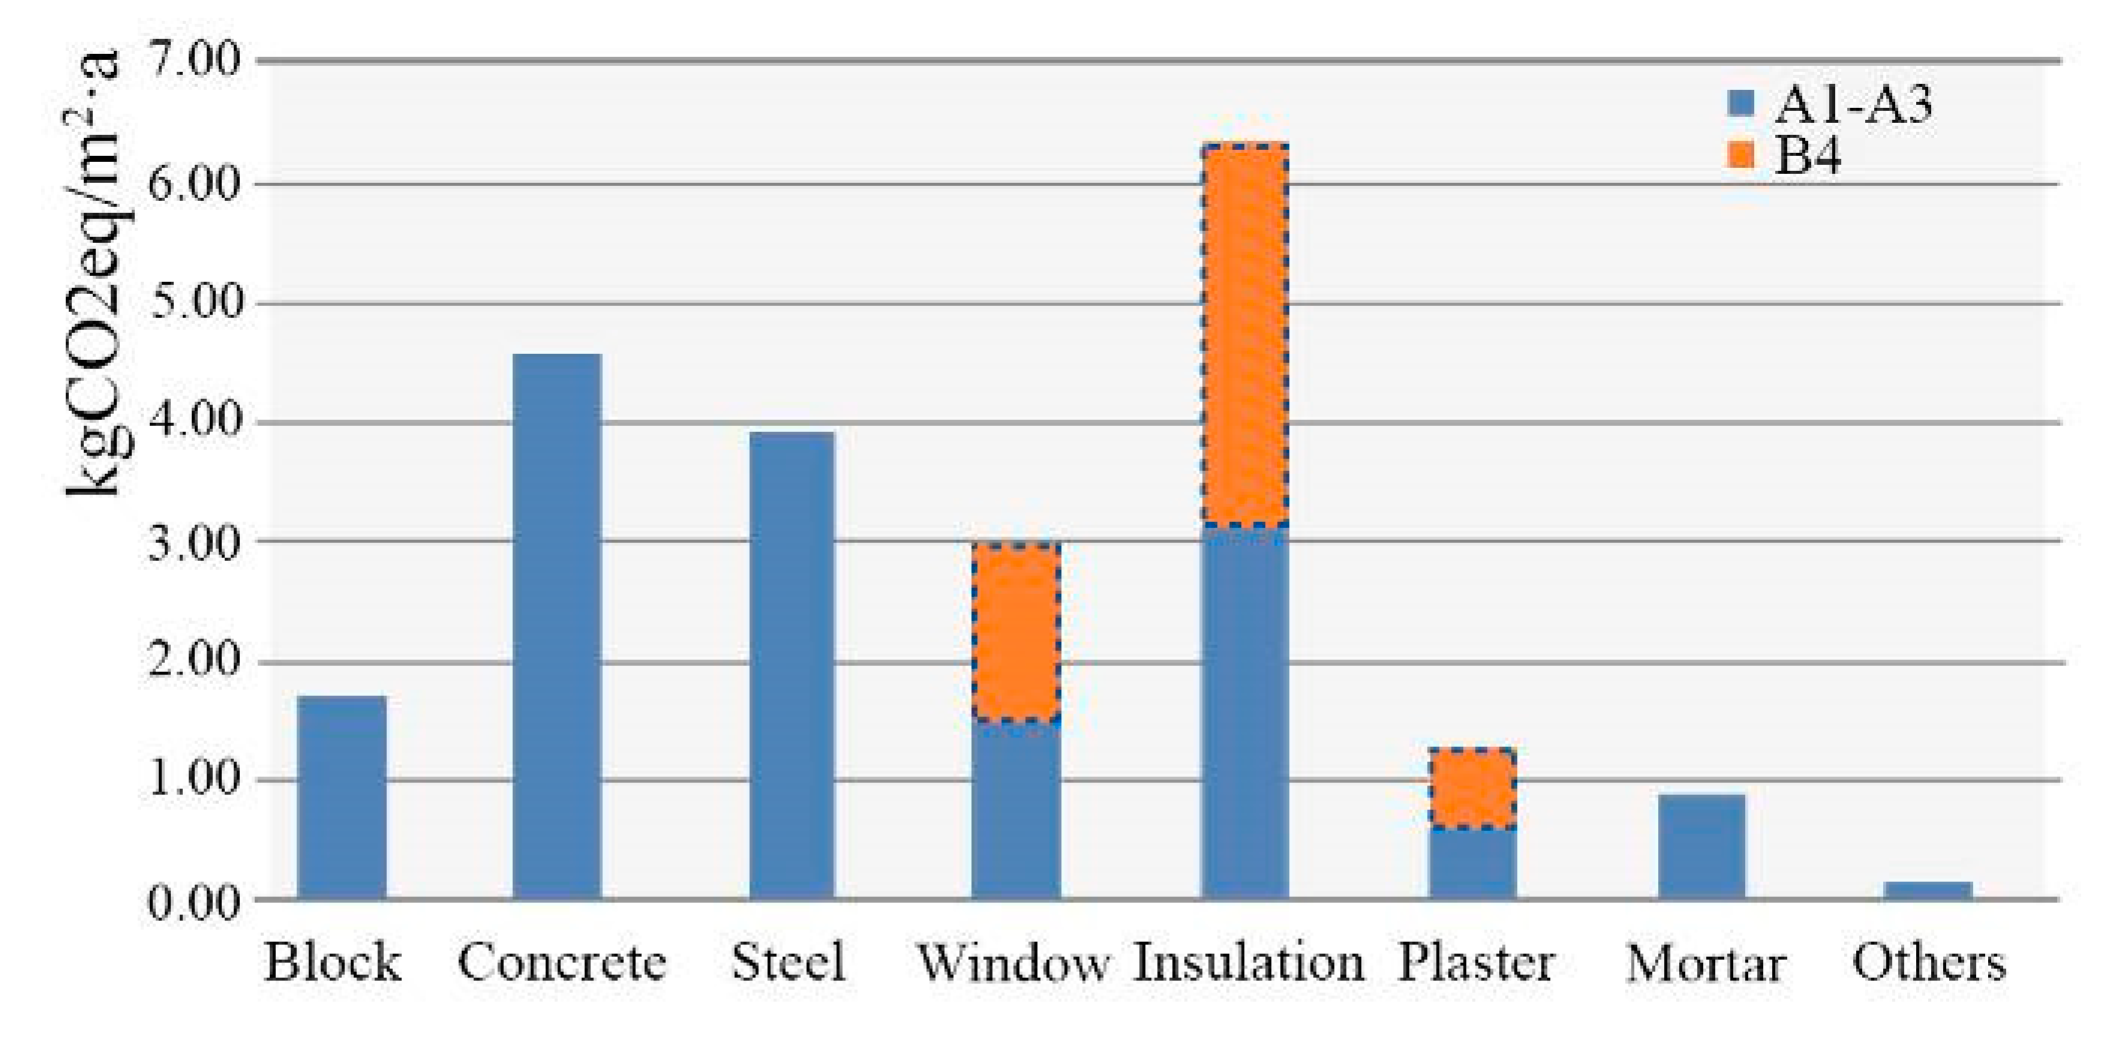
5.2.2. Embodied GHG Emissions by Construction Materials

Figure 9 shows the embodied GHG emissions by major construction materials. The blue histogram represents emission results from material production phases (A1–A3) of each material and the proportion they constitute out of all the materials, while the orange histogram represents emission results from the material replacement phase (B4). By analyzing the blue histogram, the highest GHG emissions are generated from three types of construction materials—concrete, steel, and insulation materials—contributing nearly 71% totally to GHG emissions of material production. Of these emissions, more than half (ca. 52% total) are generated from concrete and steel materials, which are the design drivers. For an HSRS building, a large waiting room space means a large span and greater height. The former requires higher structural strength and will lead to high use of steel material from steel roof and reinforced concrete structure, such as load bearing (architectural beam and column). The concrete consumption will increase to support the greater height as well.
However, when comparing the GHG emissions that belong to material replacement (see orange histogram in Figure 9), a big difference in trend can be found, as follows: the high GHG emissions of material replacement are mainly from three types of construction materials—insulation material, windows, and plaster—among which insulation material is the design driver. This distribution is caused by the lower service life of these materials: 25 years. Thus, during the buildings’ 50-year life span, insulation materials, windows, and plaster are required to be replaced once. If comparing the total embodied GHG emissions (A1–A3, B4), the insulation emission would be much greater than that of other materials.

5.3. Reduction Strategies of Life Cycle GHG Emissions

The case originally aimed at evaluating LCCO2eq to extract design drivers and influences. It is believed that high emissions are affected by three aspects of buildings: space, envelope, and materials. Due to stringent energy requirements of design standard and energy efficiency improvement [38], the reduction possibilities in operational energy emissions by means of an energy system are obvious. The building energy consumption of the case study, indeed, is lower compared to that of other conventional railway station buildings [20], mainly due to the usage of the high performance system heat pump. However, in this article, the main attention has been paid to the building performance at the design level (or, passive strategies) rather than service systems such as HVAC. A building envelope—especially outer wall, roof, and glass curtain wall—has an impact on the energy performance of buildings and the main building elements for GHG calculation. Therefore, for an HSRS building as specific typology, reduction possibilities and potentials of LCCO2eq should be identified on building space, building envelope, and material, as the scope of design strategies.

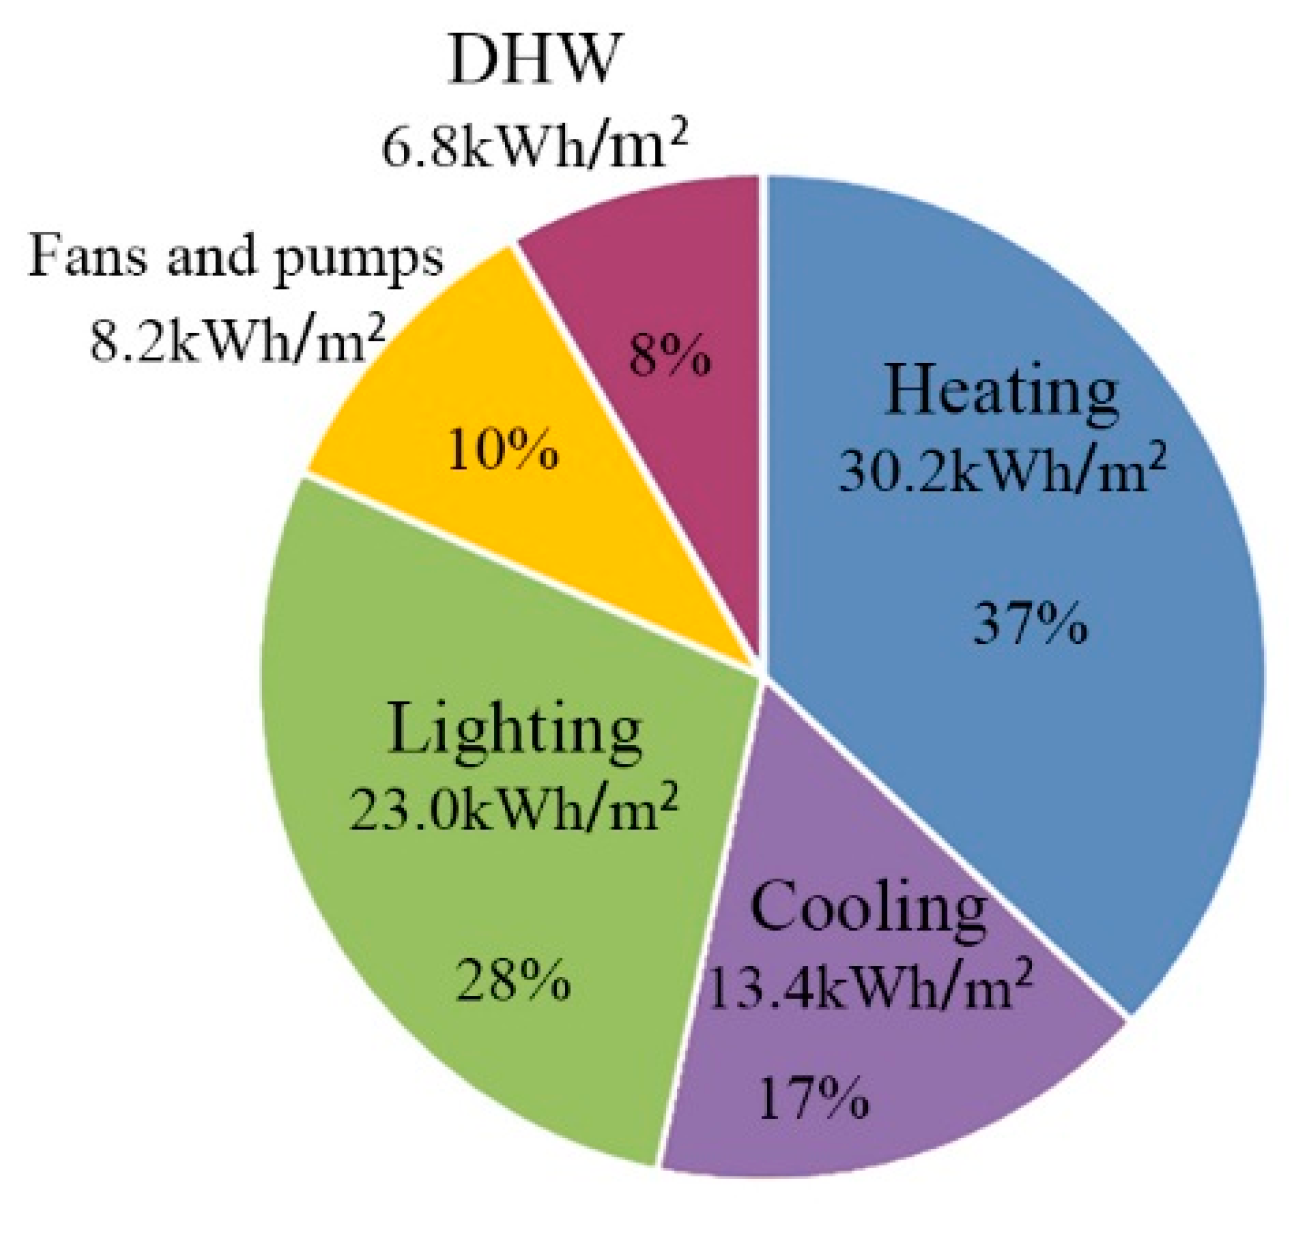
5.3.1. Reduction Strategies of Operational GHG Emissions

Optimizing Building Space

The space of Case-TJS was optimized in two ways: changing the height and area of the waiting room. The height of the west wing building was reduced from 30 m, 25 m, to 20 m, itemized as strategy H1, H2, and H3, respectively. The operational GHG emissions decrease by 15.7% and total LCCO2eq decreases by 15.0% from strategy H1 to H3. Embodied GHG emissions decrease by up to 12.3% and see a significant reduction. This is because, with the decline of the building height, the enclosed volume to use energy for heating and cooling is reduced. Meanwhile, fewer materials of outer walls and the load bearing structure are consumed. The area of the waiting room was reduced from 2346 m2, 1313 m2, to 657 m2 through functional adjustment, itemized as strategy A1, A2, and A3, respectively. It also resulted in more enclosed space being opened without heating and cooling for passengers going through the building to the platform in half an hour. Due to the fact that the area of the waiting room is determined by the maximum number of passengers (H), this change assumed that 0%H, 36%H, and 72%H can check in directly, while others remain in the enclosed waiting room. Although embodied GHG emissions remain unchanged, the operational GHG emissions decrease greatly, by up to 24.8%, leading to a decrease in the total GHG emissions by 20.1%.

Optimizing Building Envelope

The design variables are quantified using a computational tool, combining options into 256 samples (4 × 4 × 4 × 4). From the SA results shown in Table 5, it can be determined that the glazing type has the most correlative influence on operational GHG emissions, with the largest SRC value, followed by external walls and outer roof constructions. By linear regression analysis results together with SA, deterministic coefficient adjusted R2 of regression equation reaches 0.97, which indicates that there is a strong linear relationship between design variables and operational GHG emissions. After correlation and regression analysis, glazing type was selected as an optimal design variable of envelope to make changes for emission reduction. The double low-E glazing type of curtain walls (8 + 12Air + 8) and windows (6 + 9Air + 6) was changed in the case building to double low-E coated glazing (6 + 12Air + 6) and double low-E insulated glazing (6 + 12Argon + 6), with different specific parameters (U-value, Solar Heat Gain Coefficient—SHGC), itemized as strategy UG1, UG2, and UG3. As a result, the impacts decrease by 7.7% during the operational phase from strategy UG1 to UG3 because of the change with high performance and low emissivity materials. Embodied GHG emissions decrease by 6.8%. In addition, an optimal solution is taken from the samples simultaneously (see Table 5), which could be used in the comprehensive comparison of different optimization scenarios with multiple strategies.

5.3.2. Reduction Strategies of Embodied Emissions

Construction materials could be optimized with regard to embodied emissions, by alternative building design and material solutions. In life cycle GHG calculations, it is assumed that material alternatives only change emission data or the service life of materials, while technical properties such as load bearing capacity and thermal performance remain the same as before.

Substitution of Construction Materials

The above analysis reveals that concrete and steel are the main contributors for embodied GHG emissions from materials. No recycled or reused materials are used in reality, itemized as strategy S1 for comparison. In reduction strategies, low embodied carbon materials are chosen. As a reference, railway stations can be evaluated at a good level in material utilization if the percentage weight of recycled and reused materials is more than 20% of that of total construction materials [60]. To reach the 20% target, recycled aggregate concrete and recycled steel were substituted for 30% of reinforced concrete and structural steel in the case building, itemized as strategy S3. It represents the weight of recycled aggregate concrete and recycled steel, constituting 20% of the total amount of concrete and steel. In addition, 15% of reinforced concrete and structural steel were substituted by recycled aggregate concrete and recycled steel, itemized as strategy S2. Incorporating the recycled concrete and steel in calculations can help reduce embodied GHG emission impacts arising from materials, although there is little influence on total GHG emissions (a 0.7% reduction).

Service Life Extension of Insulation Material

Maximizing the use of materials can reduce the number of times replacements are required during building operation; therefore, it has a great effect on replacement. The service life of insulation increased from 25 years to 35 years and 50 years compared to the case building, itemized as strategy E1, E2, and E3. The result reveals that embodied GHG emissions greatly decrease up to 15%, while total GHG emissions reduce by 2.8% after extending the service life of materials from 25 years to 50 years. Single strategies optimized in the case building and GHG emissions are presented in Table 6 and the histogram given in Figure 10.

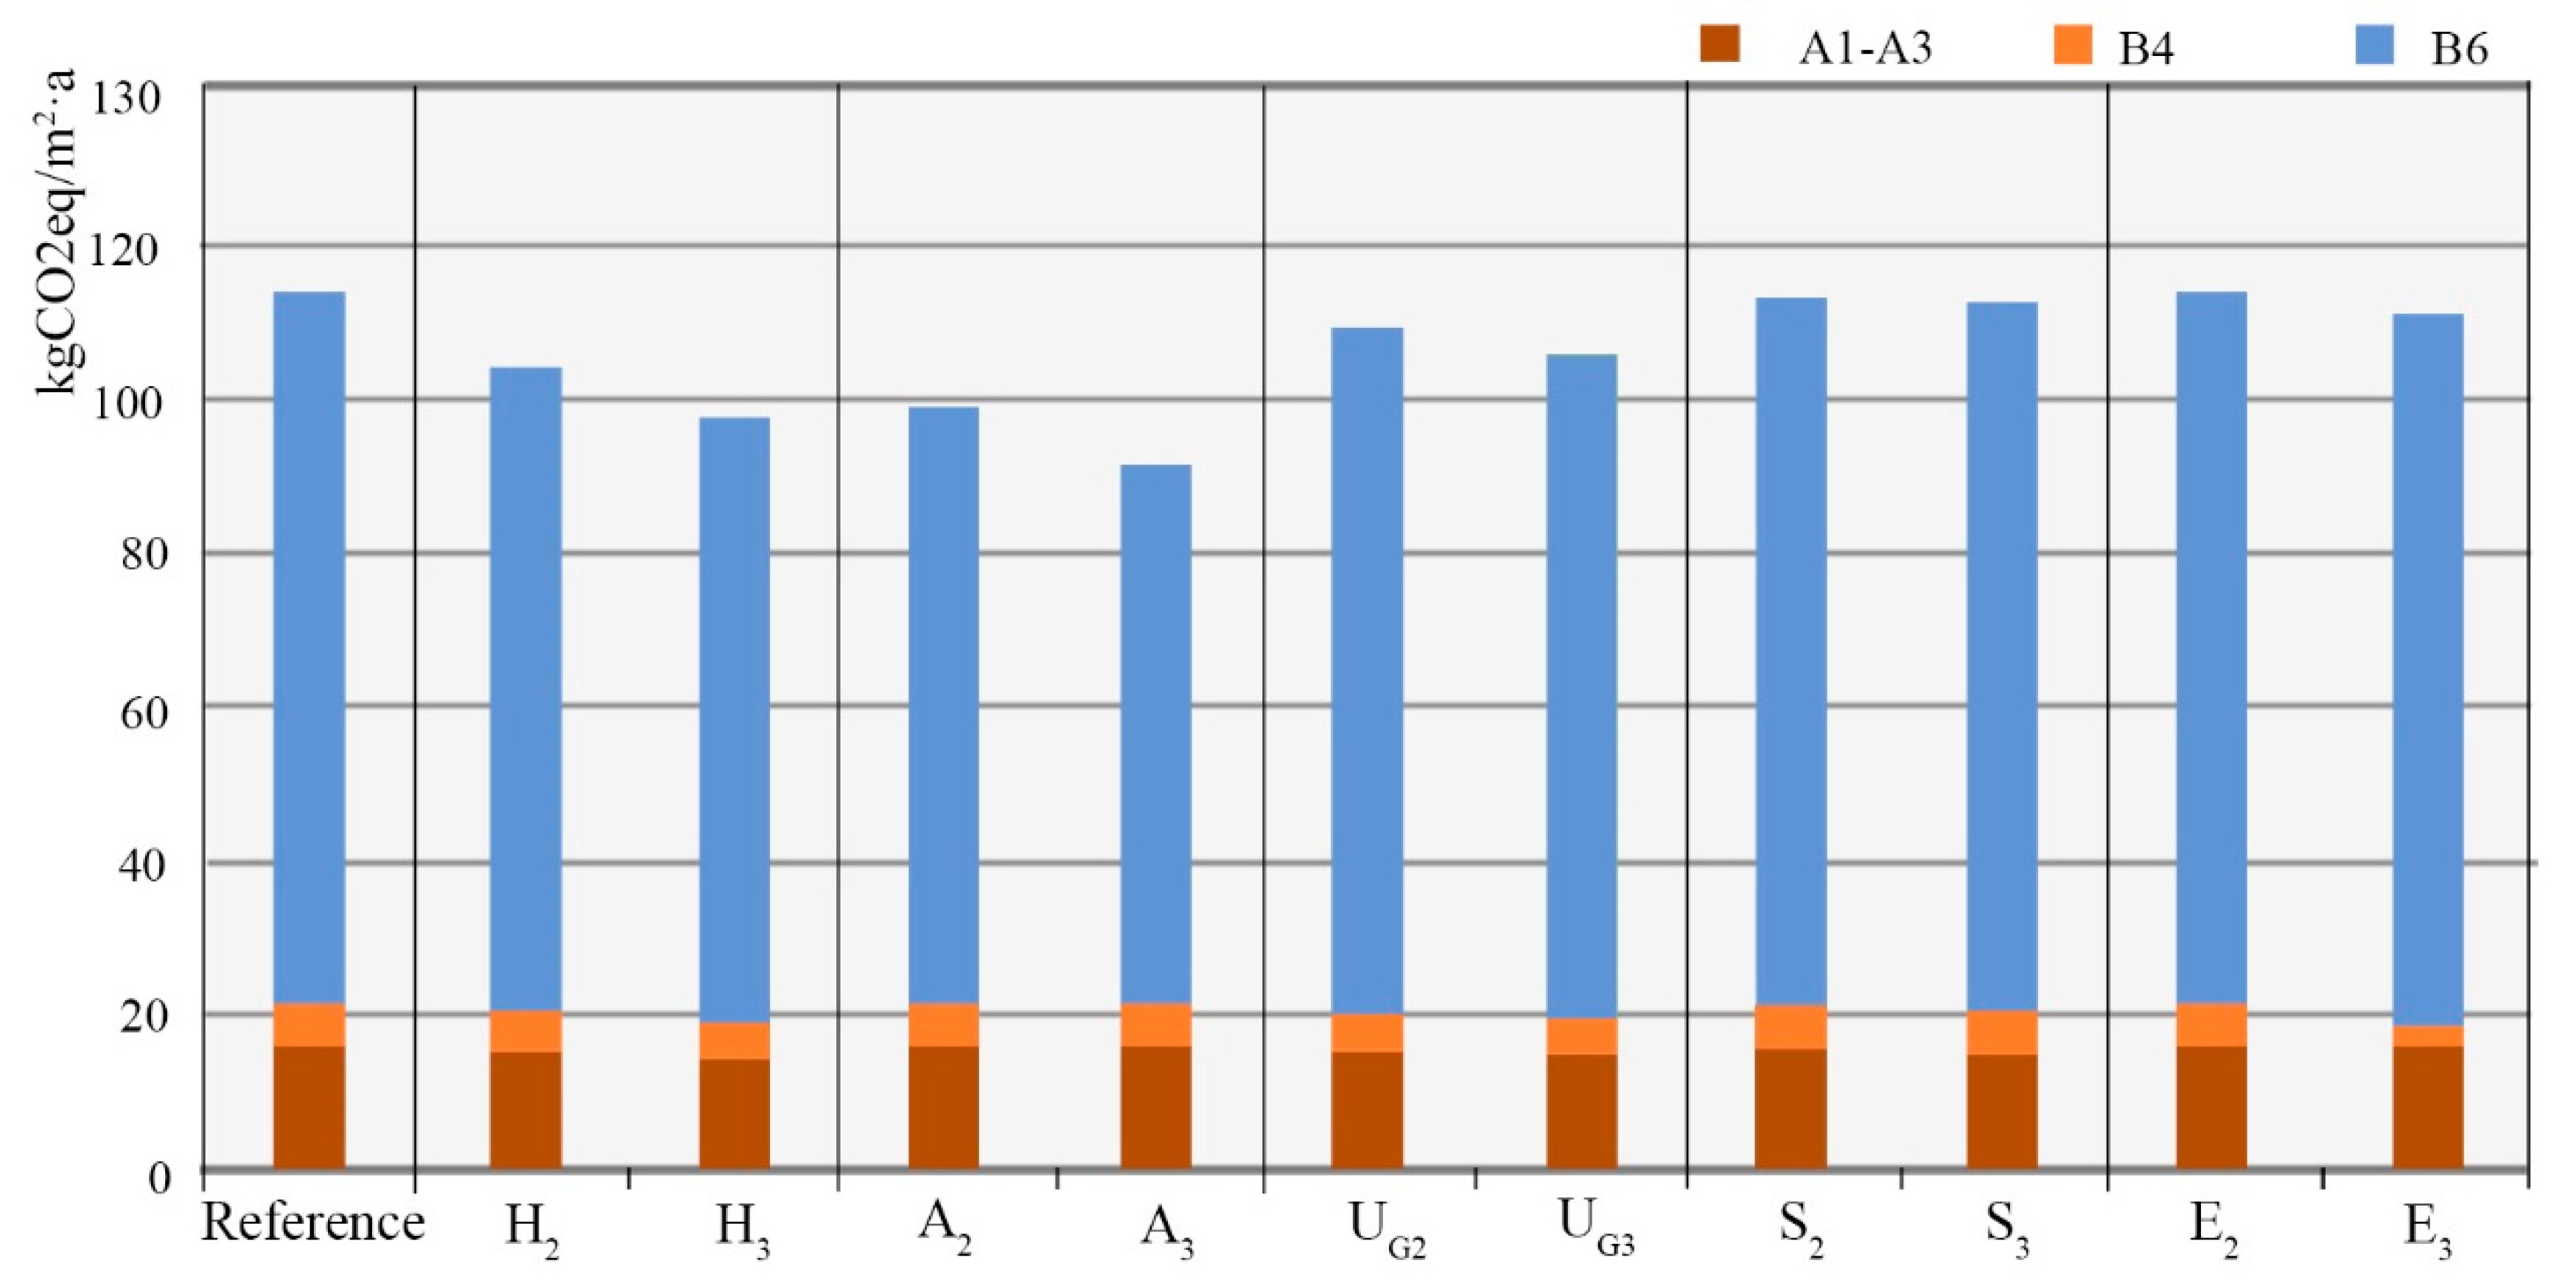
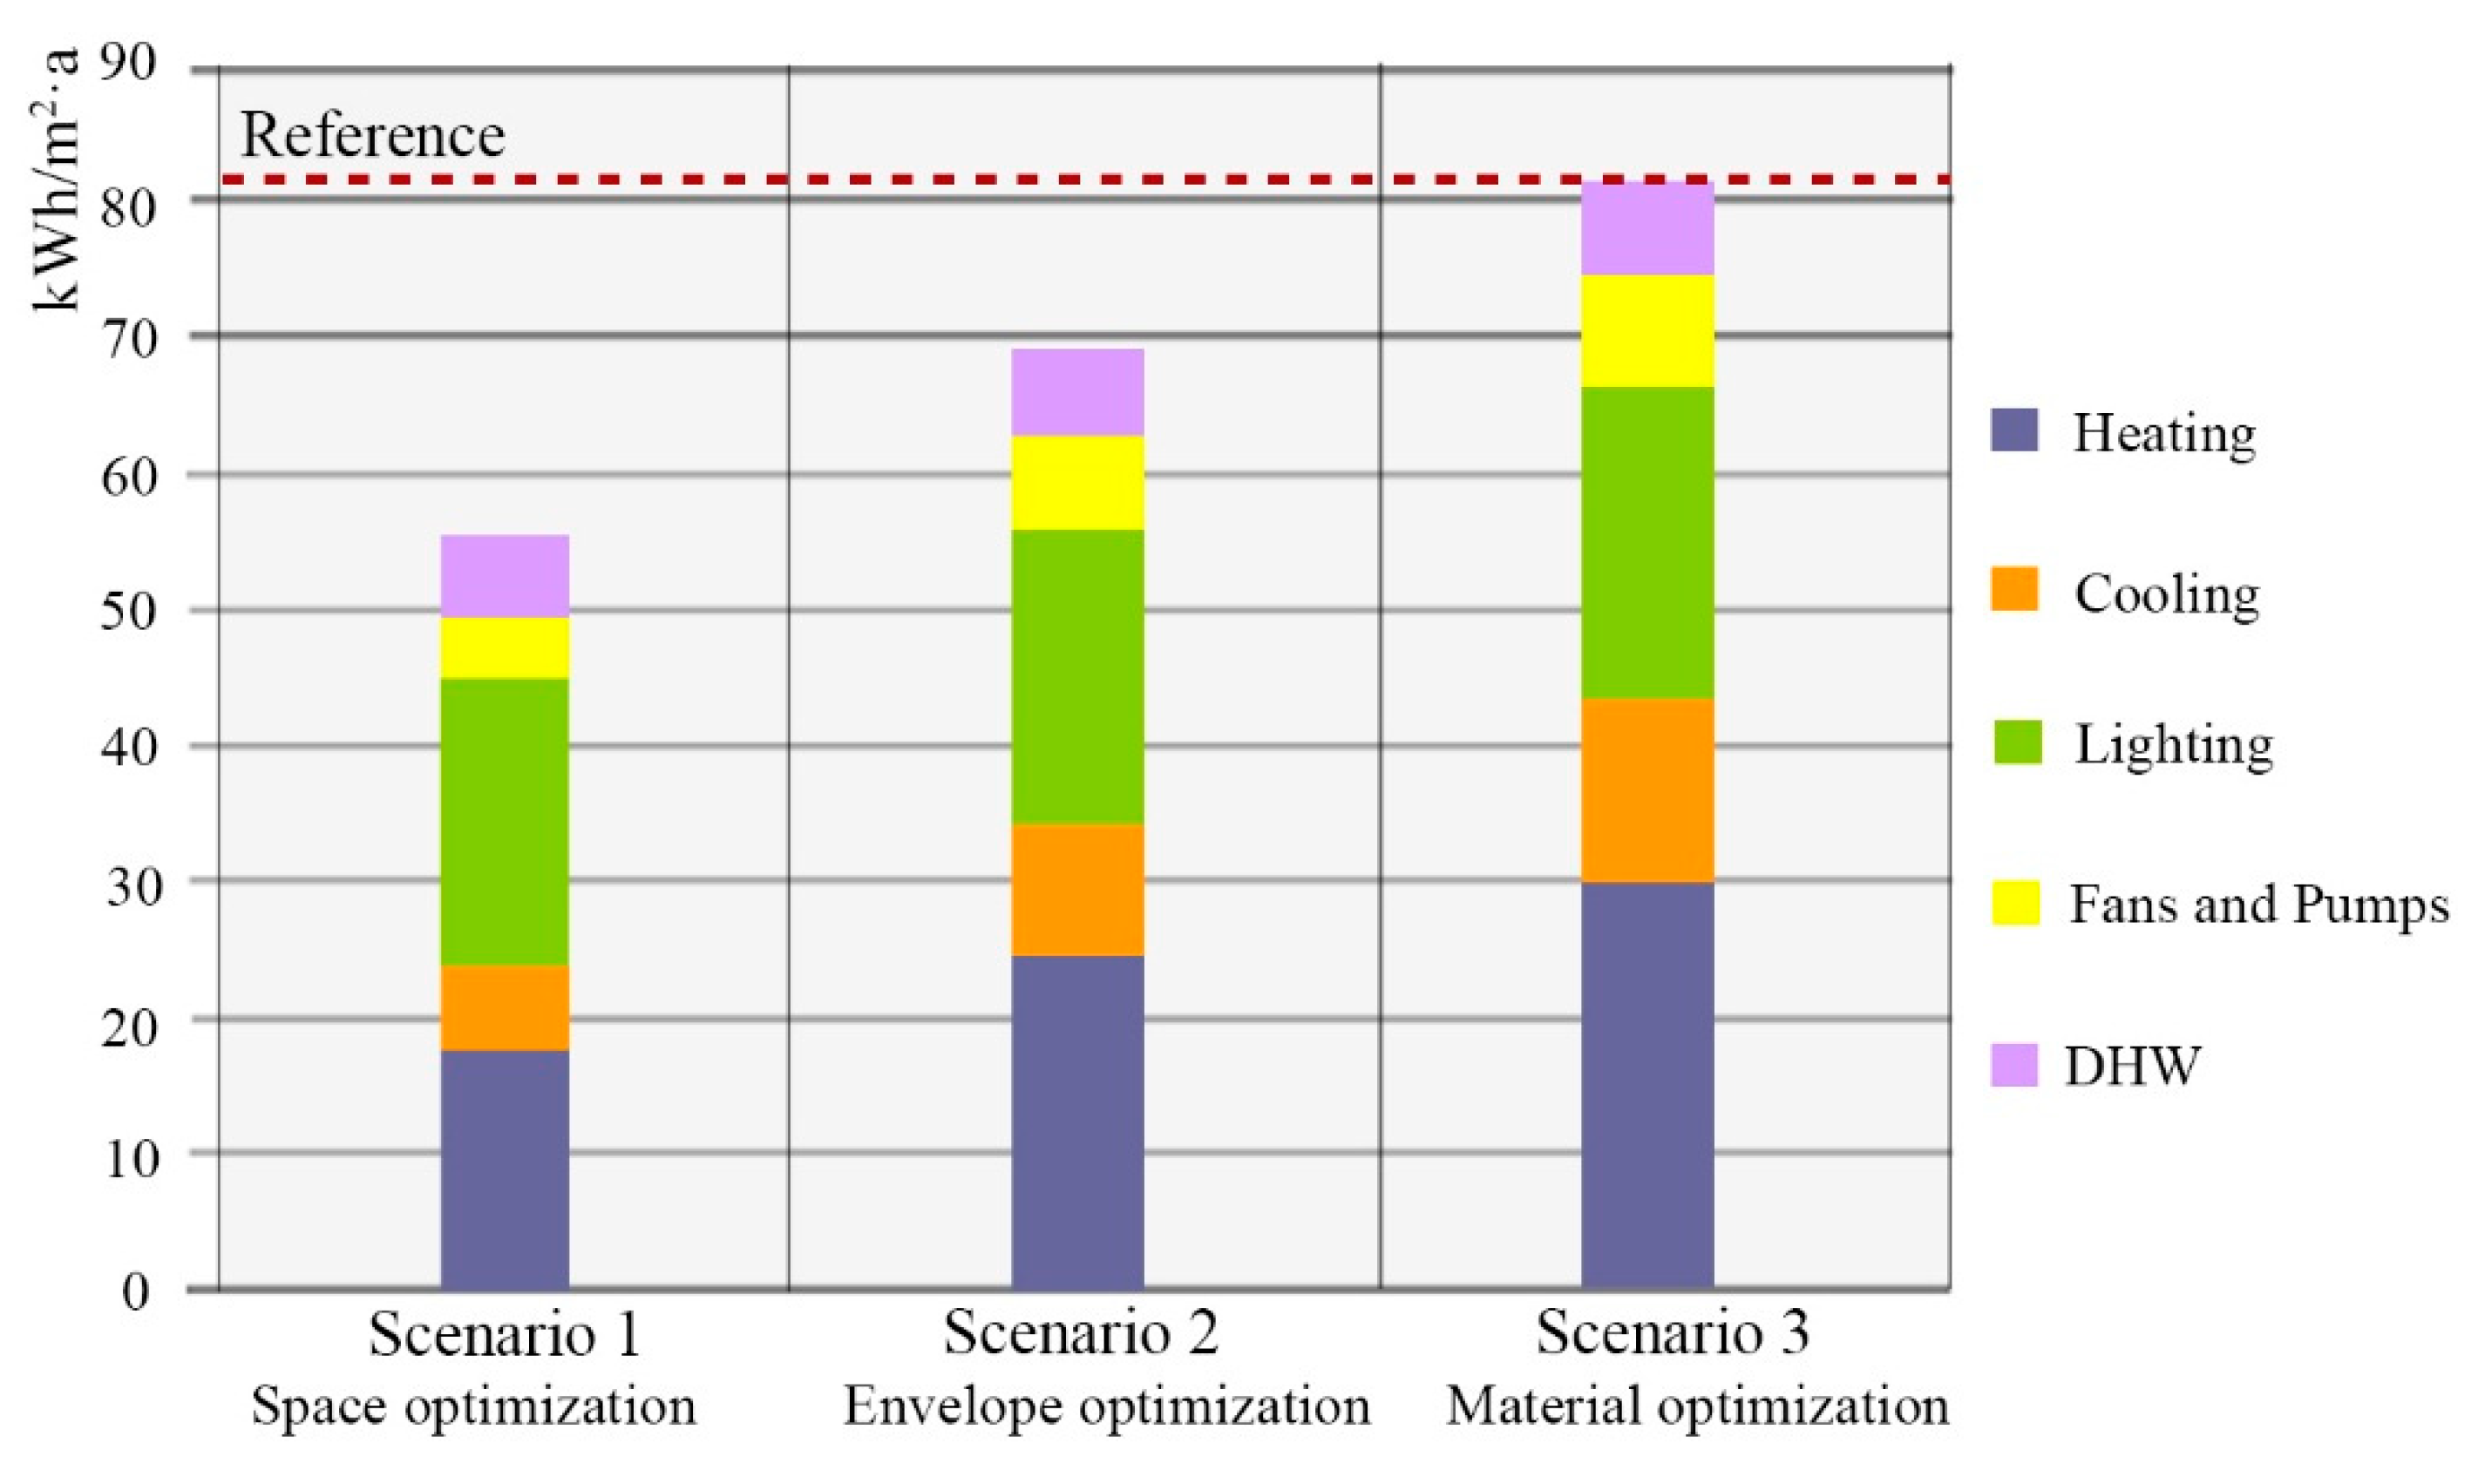
5.3.3. Reduction Potential Analysis of Life Cycle GHG Emissions

In order to evaluate the reduction potential comprehensively, three optimization scenarios with multiple strategies were proposed under new simulation and calculation: space, envelope, and material optimization. Space optimization corresponds with the optimal single strategy such as H3 and A3 that were integrated in the case. Envelope optimization corresponds to an optimal solution in Table 5 that was integrated in the case. Optimal single strategy S3 and E3 were integrated as material optimization. Figure 11 shows the annual operation energy use in all three scenarios. In scenario 1, the operational energy use of the case building was reduced to 50–60 kWh/m2·a, which is close to the median value in offices or schools shown in Figure 1. A comparison was made between the total GHG emission results of optimization scenarios, as summarized in Table 7. Taking the origin case as a reference, it can be seen that space optimization has the greatest reduction potential of total GHG emissions, with a reduction percentage of 28.2%. There are fewer changes relatively in total GHG emissions under material optimization, but it contributes to a 3.5% reduction. In this study, if these three optimizations are all integrated into the case with model adjustments and updated parameters, the total GHG emissions will decrease up to 33.8% after recalculation.
There are key reductions in operational GHG emissions when space form varies, indicating that optimizing building space has great potential for reducing energy associated GHG emissions, especially by reducing the area of enclosed waiting rooms. Improving the waiting behaviour of passengers is significant for emission reduction on the assumption that more passengers can check in directly. The result is consistent with the previous study [61], which indicates the key link between the operation phase and emissions reduction for similar large space public buildings such as museum buildings in China. Compared with a Swedish HSRS building [27], the result is reversed: construction and maintenance are more dominant in GHG emissions, while operation gives just a small contribution as a result of used green electric power. Therefore, it is meaningful to study HSRS buildings in different regions.
It should be noticed that the linear relationship between operational GHG emissions and area is not evident, as investigated in [16] the regarding correlation between energy consumption and station area. In energy simulations of this study, energy use from the waiting room accounts approximately for 60% of total energy consumption from all operating rooms. Although the energy use of the waiting room could greatly decrease, the energy consumed in other rooms including the booking hall, offices and commercials remains unchanged. Lighting and DHW constitute 36% in annual operational energy use, but they are not sensible when waiting room area changes are a necessary service for passengers in semi-open areas. This is why operational GHG emissions reduce only by 24% when the area of the waiting room reduces drastically from 2346 m2 to 657 m2 by 72%.
Another focus should be on using low emissivity and high performance materials/components, e.g., glazing type. In terms of embodied GHG emission reduction, extending the service life of insulation material contributes the most, followed by optimizing space. Using recycled concrete and steel has a relatively minimal impact. In practice, recycled materials are usually insufficient and the amount for substitution is limited. In order to minimize embodied GHG emissions, efforts should be made to choose robust insulation materials (i.e. longer service life) and to reduce the amount of materials. Recycled concrete and steel with low emissions could also be used to make contributions more or less.
In three scenarios, space optimization can greatly reduce operational as well as embodied GHG emissions, indicating the significance of space design in emission reduction during the architectural design process. The reduction potential of total GHG emissions from envelope optimization comes from the performance improvement in terms of thermal properties and low emissivity. However, this improvement is limited because newly built HSRS buildings have up to or over the required standard values on envelope [38], whereas stricter performance costs more. Generally, compared to the innovative incorporation of state-of-the-art materials and technology to drive down emissions relating to the operational phase, the process of space optimization in buildings is deemed time saving and is economically applicable.
As life cycle GHG emissions calculations are developed, the robustness of these results against uncertainties should be noticed. The choice of electricity grid factor has a large influence on operational GHG emissions. If assuming factor value of the current grid of 0.361 kgCO2eq/kWh in the EU [62], the operational GHG emissions could be close to the embodied GHG emissions. The future studies should test different scenarios with the decarbonization of the electricity grid over building lifespan. The life cycle analysis presented in this study also involves a number of simplifications and generalisations. The emission factors of construction materials use generic data from standard and research databases, although these factors may vary in a specific practice. The construction materials have been limited to civil engineering excluding building services. Results are therefore discussed for these specific contexts. Although simplified, this framework of analysis is nevertheless representative for most of the medium-sized HSRS buildings in the cold zone.
The proposed BIM-LCA method connects LCA with BIM and comprehensively applies different software for study systematically, however, there are some limitations. Although the simulation software DesignBuilder has improved abilities to analyze the Revit models, some incompatibility problems occur, especially when the model is established in a more complex way. Non-linear geometric primitives should be simplified. For the Case-TJS, most of the origin components in the Revit model have been imported into Designbuilder for smoother energy analysis, which plays a positive role in the BIM-LCA method.

6. Conclusions

Previous research usually does not pay sufficient attention to HSRS buildings from the direct perspective of life cycle GHG emissions and how to reduce GHG emissions. Therefore, this article set out to evaluate and present the life cycle GHG emissions (LCCO2eq) of an HSRS building in a cold zone, China to extract the design drivers in terms of operational and embodied GHG emissions. Design drivers and reduction strategies were examined in order to assess their potential as strategies for reduced GHG emissions from a functional and architectural point of view. This paper proposed a detailed methodology for the development and assessment of emission reduction strategies through LCA, combined with BIM technology. The Case-TJS, a medium-sized HSRS building, was selected as a representative example for a case study. This study comes to the following conclusions:
(1)
Emission reduction measures in an HSRS building should focus more on space design in the early stage of architectural design. Although the GHG emission mitigation strategy related to the substitution of materials presents the lowest potential for total GHG emissions reduction, significant embodied emission reduction can be achieved by choosing insulation materials with longer service life.
(2)
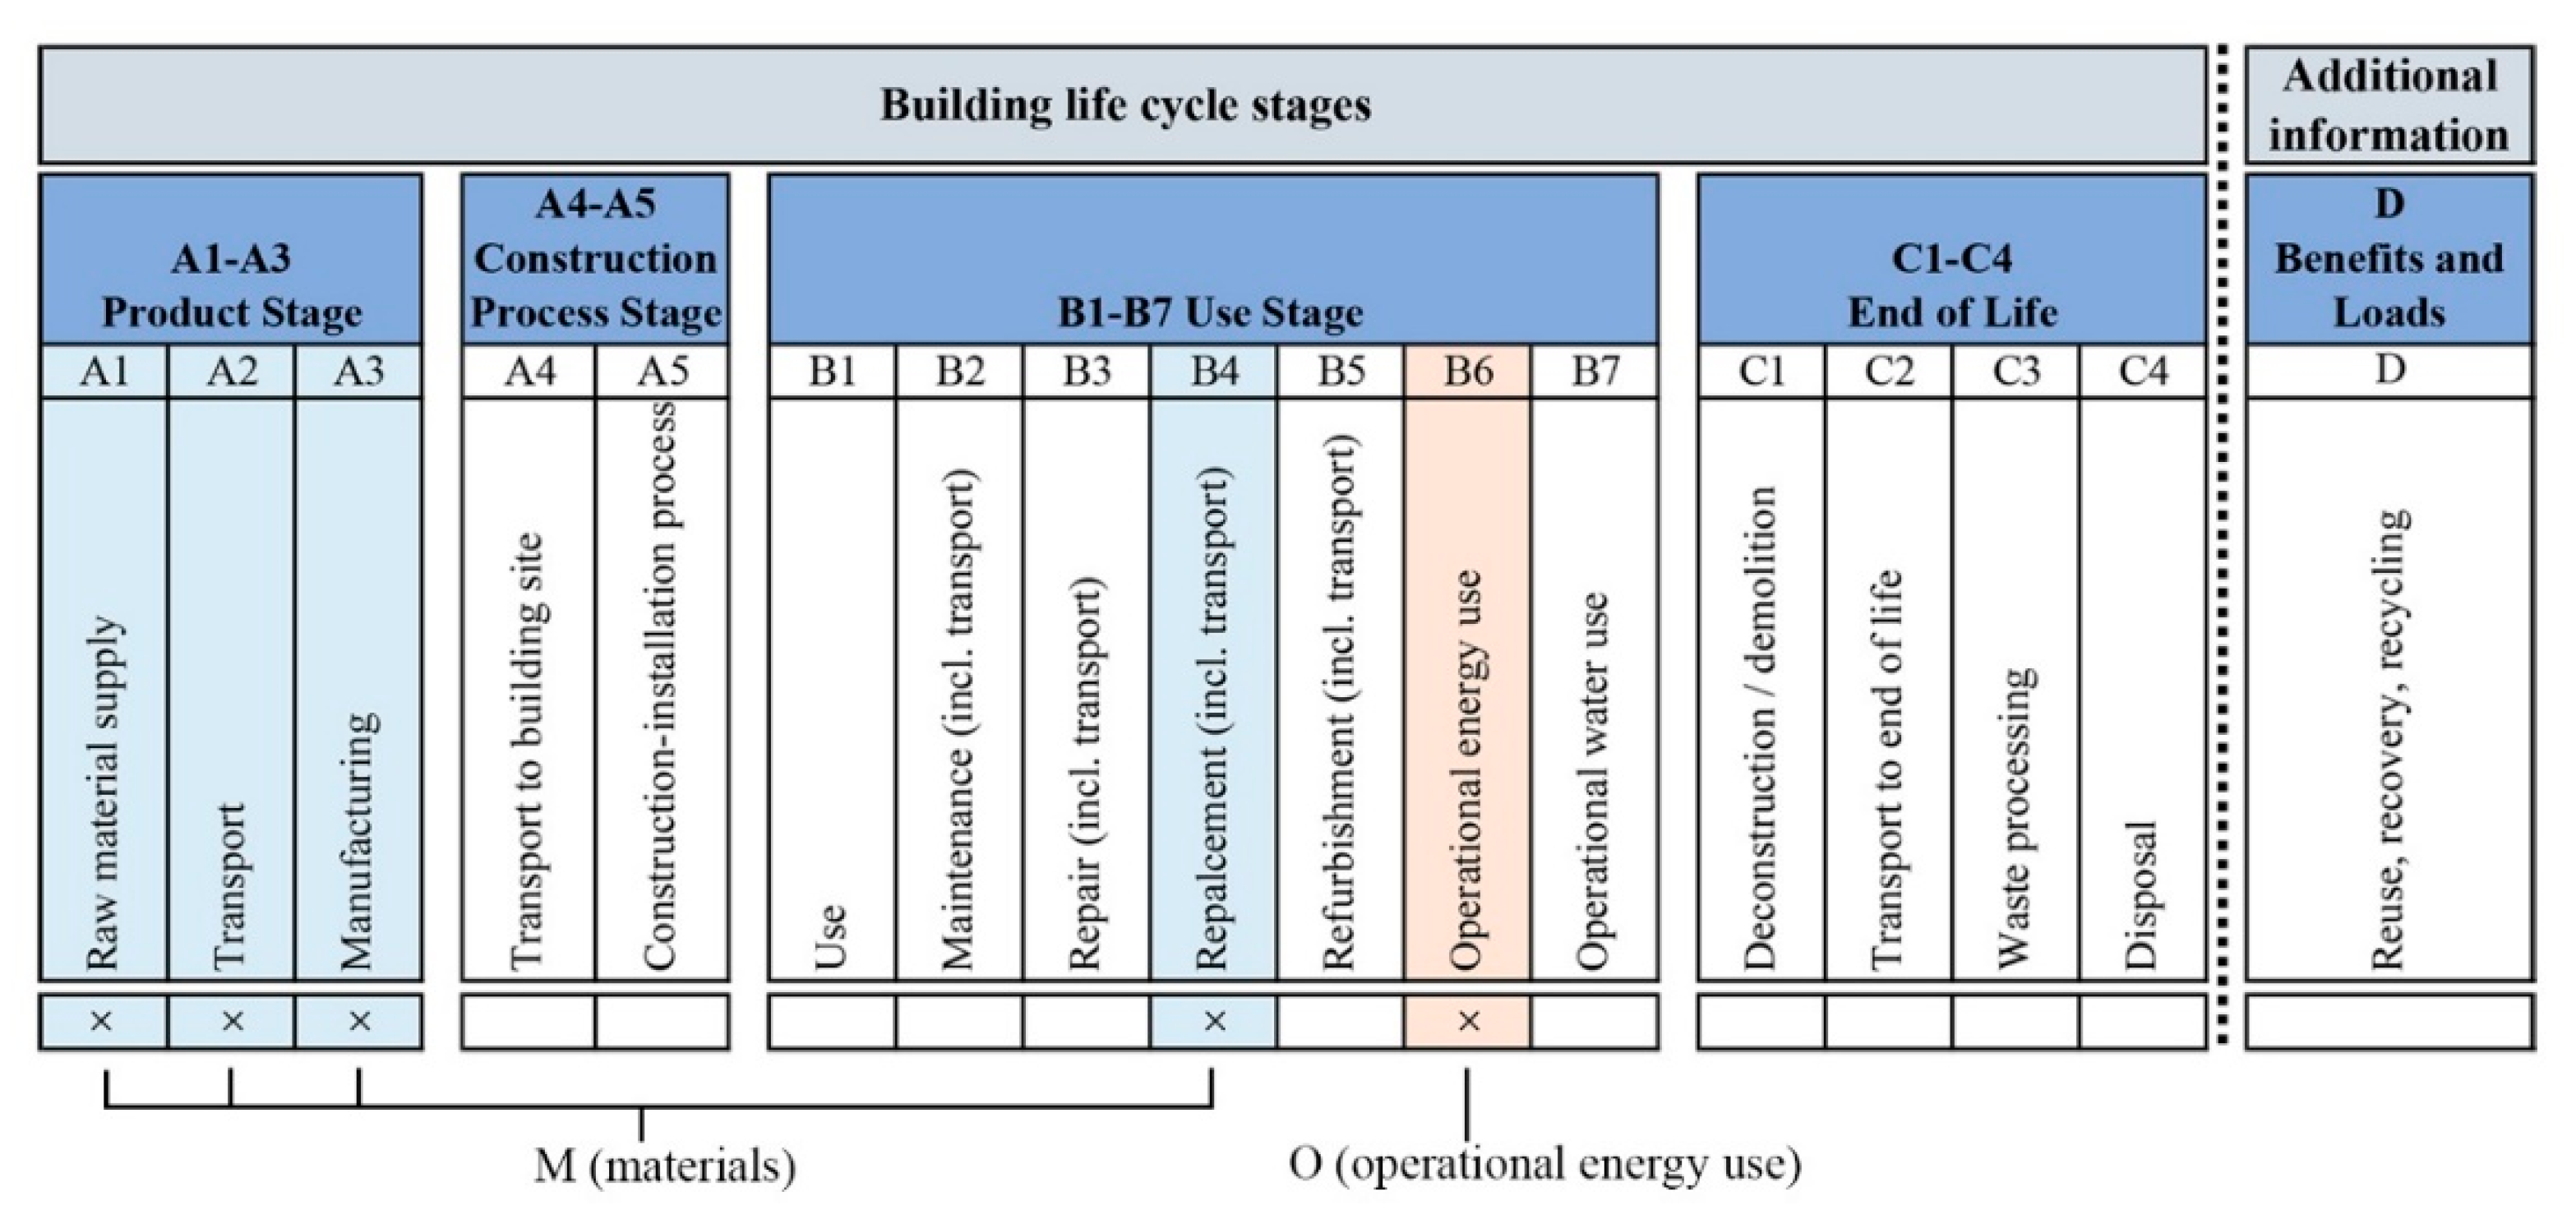
The LCCO2eq of an HSRS building for design analysis were assessed using 3 system boundaries: life cycle modules A1–A3 and B4 for the production and replacement of building materials, and life cycle module B6 for operational energy use. The BIM-LCA approach shows how modelling tools help analysis identify in GHG reduction strategies in complex buildings such as HSRS.
(3)
The main objective of the GHG reduction strategies in HSRS buildings is to minimize the total GHG emissions related to operational energy and, ultimately, the embodied emissions from materials.
(4)
The drivers for the highest embodied GHG emissions were from concrete, steel, and insulation materials used in the main load bearing structures and outer wall components.
In summary, this paper contributes to research by identifying strategies to reducing GHG emissions with a focus on the HSRS building typology which is a particular type of large space public building in China. It is anticipated that the research results that might significantly reduce GHG emissions in HSRS buildings would have a positive impact on the mitigation of current climate change effects. The results for GHG emissions and reduction strategies also provide guidance to help inform design and construction decisions of similar projects and large space public buildings.

Author Contributions

Conceptualization, N.W.; methodology, N.W.; validation, N.W. and D.S.; formal analysis, N.W.; investigation, N.W.; resources, C.L., A.H.W. and D.S.; writing—original draft preparation, N.W.; writing—review and editing, D.S., C.L. and A.G.; visualization, N.W.; supervision, A.H.W., C.L. and A.G.; project administration, C.L. and A.G.; and funding acquisition, C.L. All authors have read and agreed to the published version of the manuscript.

Funding

This research was funded by the National Key Research and Development Program of China (Grant No. 2016YFC0700200), National Natural Science Foundation of China (Grant No. 51808383), and the Programme of Introducing Talents of Discipline to Universities (project No. B13011).

Acknowledgments

The authors would like to thank the China Scholarship Council (CSC) for providing financial support to carry out the cooperation study. The authors gratefully acknowledge the support from the Research Council of Norway and several partners through the Research Centre on Zero Emission Neighbourhoods in Smart Cities (FME ZEN), hosted by the Norwegian University of Science and Technology (NTNU).

Conflicts of Interest

The authors declare no conflict of interest.

References

  1. International Energy Agency and the United Nations Environment Programme. Global Status Report 2018: Towards a Zero-Emission, Efficient and Resilient Buildings and Construction Sector; International Energy Agency and the United Nations Environment Programme: Katowice, Poland, 2018; Available online: https://www.unenvironment.org/resources/report/global-status-report-2018 (accessed on 15 September 2019).
  2. Department of Climate Change, National Development and Reform Commission of China. Enhanced Actions on Climate Change; China’s Intended Nationally Determined Contributions (INDC): Beijing, China, 2015. [Google Scholar]
  3. State Council of China. 13th Five-Year Plan of Energy Saving and Emission Reduction. Available online: http://www.gov.cn/zhengce/content/2017-01/05/content_5156789.htm (accessed on 20 September 2019).
  4. Building Energy Efficiency Centre, Tsinghua University. Annual Report on Development of China Building Energy Efficiency; China Architecture and Building Press: Beijing, China, 2019. [Google Scholar]
  5. Wang, H.; Zhou, P.; Guo, C.; Tang, X.; Xue, Y.; Huang, C. On the calculation of heat migration in thermally stratified environment of large space building with sidewall nozzle air-supply. Build. Environ. 2019, 147, 221–230. [Google Scholar] [CrossRef]
  6. Building Energy Efficiency Centre, Tsinghua University. Annual Report on Development of China Building Energy Efficiency; China Architecture and Building Press: Beijing, China, 2014. [Google Scholar]
  7. National Development and Reform Commission of China. The Mid-Long Term Planning for China’s Railway Network (2016–2025); National Development and Reform Commission of China: Beijing, China, 2016.
  8. Luo, Z.; Yang, L.; Liu, J. Embodied carbon emissions of office building: A case study of China’s 78 office buildings. Build. Environ. 2016, 95, 365–371. [Google Scholar] [CrossRef] [Green Version]
  9. Zhang, X.; Wang, F. Life-cycle assessment and control measures for carbon emissions of typical buildings in China. Build. Environ. 2015, 86, 89–97. [Google Scholar] [CrossRef]
  10. The Research Centre on Zero Emission Buildings (ZEB), Zero Emission Buildings, NTNU and SINTEF; Fagbokforlaget: Bergen, Norway, 2017.
  11. Wiik, M.K.; Fufa, S.M.; Kristjansdottir, T.; Andresen, I. Lessons learnt from embodied GHG emission calculations in zero emission buildings (ZEBs) from the Norwegian ZEB research centre. Energy Build. 2018, 165, 25–34. [Google Scholar] [CrossRef]
  12. Rodríguez Serrano, A.Á.; Porras Álvarez, S. Life Cycle Assessment in Building: A Case Study on the Energy and Emissions Impact Related to the Choice of Housing Typologies and Construction Process in Spain. Sustainability 2016, 8, 287. [Google Scholar] [CrossRef] [Green Version]
  13. Amirkhani, S.; Bahadori-Jahromi, A.; Mylona, A.; Godfrey, P.; Cook, D. Impact of Low-E Window Films on Energy Consumption and CO2 Emissions of an Existing UK Hotel Building. Sustainability 2019, 11, 4265. [Google Scholar] [CrossRef] [Green Version]
  14. French, J. SusStations Project. In Proceedings of the 7th International Conference on. Improving, Energy Efficiency in Commercial Buildings (IEECB), Frankfurt, Germany, 18–19 April 2012. [Google Scholar]
  15. Indian Green Building Council (IGBC), IGBC Green Railway Stations. Available online: https://igbc.in/igbc/redirectHtml.htm?redVal=showGreenRailwaynosign (accessed on 5 October 2019).
  16. Song, L.; Wang, Y.; Li, X. Energy performance and environmental quality of typical railway passenger stations in northern China. Indoor Built Environ. 2018, 27, 296–307. [Google Scholar] [CrossRef]
  17. Yang, X.E. Building energy efficiency design for waiting halls of railway stations in the hot summer and cold-winter region. J. Eng. Sci. Technol. Rev. 2017, 10, 1–7. [Google Scholar] [CrossRef]
  18. Yang, L.; Xia, J. Case study of space cooling and heating energy demand of a high-speed railway station in China. Procedia Eng. 2015, 121, 1887–1893. [Google Scholar] [CrossRef] [Green Version]
  19. Gang, L.; Yi, X.; Rui, D.; Chen, L. The research of triadic relation among building spaces, lighting comfort level and lighting energy consumption in high-speed railway station in China. Procedia Eng. 2015, 121, 854–865. [Google Scholar] [CrossRef] [Green Version]
  20. Asian Development Bank. Improving Energy Efficiency and Reducing Emissions through Intelligent Railway Station Buildings; Asian Development Bank: Mandaluyong, Philippines, 2015. [Google Scholar]
  21. Wang, N.; Wang, J.L.; Liu, C.H.; Liu, L. Energy-Saving Potential of Large Space Public Buildings Based on BIM: A Case Study of the Building in High-Speed Railway Station. In eWork and eBusiness in Architecture, Engineering and Construction; Karlshoj, J., Scherer, R., Eds.; CRC Press: Copenhagen, Denmark, 2019. [Google Scholar] [CrossRef]
  22. Wang, J.; Wang, N.; Liu, L.; Liu, C. Energy-efficient analysis of high-speed railway station design in the cold region: A case study on Tianjin West Railway Station. Eco-City Green Build 2018, 9, 44–51. (In Chinese) [Google Scholar]
  23. Li, Q.; Yoshino, H.; Mochida, A.; Meng, Q.; Lei, B.; Zhao, L.; Lun, Y. CFD study of the thermal environment in an air-conditioned train station building. Build. Environ. 2009, 44, 1452–1465. [Google Scholar] [CrossRef] [Green Version]
  24. Deb, C.; Ramachandraiah, A. Evaluation of thermal comfort in a rail terminal location in India. Build. Environ. 2010, 45, 2571–2580. [Google Scholar] [CrossRef]
  25. Chow, W.K.; Fung, W.Y.; Wong, L.T. Preliminary studies on a new method for assessing ventilation in large spaces. Build. Environ. 2002, 37, 145–152. [Google Scholar] [CrossRef]
  26. Chong, U.; Swanson, J.J.; Boies, A.M. Air quality evaluation of London Paddington train station. Environ. Res. Lett. 2015, 10, 1–11. [Google Scholar] [CrossRef]
  27. Stripple, H.; Uppenberg, S. Life-Cycle Assessment of Railways and Rail Transport—Appplication in Environmental Product Declarations (EPDs) for the Bothnia Line; Swedish Environmental Research Institute: Göteborg, Sweden, 2010; Available online: https://www.ivl.se/download/18.343dc99d14e8bb0f58b75d4/1445517456715/B1943.pdf (accessed on 3 February 2020).
  28. Zhang, R.; Liu, P.; Zhou, C.C.; Amorelli, A.; Li, Z. Configuration of inter-city high-speed passenger transport infrastructure with minimal construction and operational energy consumption: A superstructure based modelling and optimization framework. Comput. Chem. Eng. 2016, 93, 87–100. [Google Scholar] [CrossRef]
  29. Ma, J.J.; Du, G.; Zhang, Z.K.; Wang, P.X.; Xie, B.C. Life cycle analysis of energy consumption and CO2 emissions from a typical large office building in Tianjin, China. Build. Environ. 2017, 117, 36–48. [Google Scholar] [CrossRef]
  30. Skaar, C.; Labonnote, N.; Gradeci, K. From Zero Emission Buildings (ZEB) to Zero Emission Neighbourhoods (ZEN): A Mapping Review of Algorithm-Based LCA. Sustainability 2018, 10, 2405. [Google Scholar] [CrossRef] [Green Version]
  31. EN 15978. Sustainability of Construction Works-Assessment of Environmental Performance of Buildings-Calculation Method; European Committee for Standardization: Brussels, Belgium, 2011. [Google Scholar]
  32. ISO 14040. Environmental Management—Life Cycle Assessment—Principles and Framework; International Organization for Standardization: Geneva, Switzerland, 2006. [Google Scholar]
  33. ISO 14044. Environmental Management—Life Cycle Assessment—Requirements and Guidelines; International Organization for Standardization: Geneva, Switzerland, 2006. [Google Scholar]
  34. Selamawit, F.; Schlanbudch, R.; Sørnes, K.; Inman, M.; Andresen, I. A Norwegian ZEB Definition Guideline; The Reserch Centre on Zero Emission Buildings (ZEB), ZEB Project Report (29) SINTEF; Academic Press: Oslo, Norway, 2016. [Google Scholar]
  35. Dokka, T.H.; Sartori, I.; Thyholt, M.; Lien, K.; Lindberg, K.B. A Norwegian Zero Emission Building Definition; Passihus Norden: Gothenburg, Sweden, 2013. [Google Scholar]
  36. Information Office of the State Council, China’s Energy Policy 2012 (White Paper); Information Office of the State Council: Beijing, China, 2012.
  37. National Development and Reform Commission of China. 13th Five-Year Plan of Railway Development; National Development and Reform Commission of China: Beijing, China, 2017.
  38. Ministry of Housing and Urban-Rural Development of China, GB 50189-2015: Design Standard for Energy Efficiency of Public Buildings; China Architecture and Building Press: Beijing, China, 2015.
  39. National Railway Administration. TB10100-2018 Code for Design of Railway Passenger Station; National Railway Administration: Beijing, China, 2018.
  40. Wang, J.; Liu, C. Investigation and analysis of energy-efficient potential to the space and form of high-speed railway station building. Build. Energy Effic. 2019, 2, 41–49. (In Chinese) [Google Scholar]
  41. Malmqvist, T.; Nehasilova, M.; Moncaster, A.; Birgisdottir, H.; Nygaard, F. Design and construction strategies for reducing embodied impacts from buildings—Case study analysis. Energy Build. 2018, 166, 35–47. [Google Scholar] [CrossRef] [Green Version]
  42. Yu, D.; Tan, H.; Ruan, Y. A future bamboo-structure residential building prototype in China: Life cycle assessment of energy use and carbon emission. Energy Build. 2011, 43, 2638–2646. [Google Scholar] [CrossRef]
  43. Venkatarama Reddy, B.V.; Leuzinger, G.; Sreeram, V.S. Low embodied energy cement stabilised rammed earth building. Energy Build. 2014, 68, 541–546. [Google Scholar] [CrossRef]
  44. Kumanayake, R.; Luo, H.; Paulusz, N. Assessment of material related embodied carbon of an office building in Sri Lanka. Energy Build. 2018, 166, 250–257. [Google Scholar] [CrossRef]
  45. Seo, S.; Zelezna, J.; Birgisdottir, H. Passer, A. Evaluation of Embodied Energy and CO2eq for Building Construction (Annex 57); Institute for Building Environment and Energy Conservation: Tokyo, Japan, 2016; Available online: http://www.iea-ebc.org/Data/publications/EBC_Annex_57_ST2_Literature_Review.pdf (accessed on 5 October 2019).
  46. Maddalena, R.; Roberts, J.J.; Hamilton, A. Can Portland cement be replaced by low-carbon alternative materials? A study on the thermal properties and carbon emissions of innovative cements. J. Clean. Prod. 2018, 186, 933–942. [Google Scholar] [CrossRef]
  47. Ministry of Housing and Urban-Rural Development of China. GB 50352-2019. Uniform Standard for Design of Civil Buildings; Ministry of Housing and Urban-Rural Development of China: Beijing, China, 2019.
  48. Zhang, X. Research on the Quantitative Analysis of Building Carbon Emissions and Assessment Methods for Low-carbon Buildings and Structures; Harbin Institute of Technology: Harbin, China, 2018. (In Chinese) [Google Scholar]
  49. Luo, Z. Study on Calculation Method of Building Life Cycle CO2 Emission and Emission Reduction Strategies; Xi’an University of Architecture and Technology: Xi’an, China, 2016. (In Chinese) [Google Scholar]
  50. Roh, S.; Tae, S. Building Simplified Life Cycle CO2 Emissions Assessment Tool (B-SCAT) to Support Low-Carbon Building Design in South Korea. Sustainability 2016, 8, 567. [Google Scholar] [CrossRef] [Green Version]
  51. Raji, B.; Tenpierik, M.J.; Van den Dobbelsteen, A. Early-Stage Design Considerations for the Energy-Efficiency of High-Rise Office Buildings. Sustainability 2017, 9, 623. [Google Scholar] [CrossRef] [Green Version]
  52. Ministry of Housing and Urban-Rural Development of the People’s Republic of China. GB/T 51366-2019 Standard for Building Carbon Emission Calculation; Ministry of Housing and Urban-Rural Development of the People’s Republic of China: Beijing, China, 2019.
  53. Hou, P.; Wang, H.T.; Zhang, H.; Fan, C.D.; Huang, N. GreenHouse gas emission factors of Chinese power grids for organization and product carbon footprint, Zhongguo Huanjing Kexue. China Environ. Sci. 2012, 32, 961–967. (In Chinese) [Google Scholar]
  54. Standard Quota Institute. TY01-31-2015 Consumption Quota of Housing Construction and Decoration Engineering; China Planning Press: Beijing, China, 2015. (In Chinese) [Google Scholar]
  55. Zhao, M.; Künzel, H.M.; Antretter, F. Parameters influencing the energy performance of residential buildings in different Chinese climate zones. Energy Build. 2015, 96, 64–75. [Google Scholar] [CrossRef]
  56. Mechri, H.E.; Capozzoli, A.; Corrado, V. USE of the ANOVA approach for sensitive building energy design. Appl. Energy 2010, 87, 3073–3083. [Google Scholar] [CrossRef]
  57. Groen, E.A.; Bokkers, E.A.M.; Heijungs, R.; de Boer, I.J.M. Methods for global sensitivity analysis in life cycle assessment. Int. J. Life Cycle Assess. 2017, 22, 1125–1137. [Google Scholar] [CrossRef] [Green Version]
  58. Budavari, Z.; Szalay, Z.; Brown, N.; Malmqvist, T.; Peuportier, B.; Zabalza, I.; Krigsvoll, G.; Wetzel, C.; Cai, X.; Staller, H.; et al. LoRE-LCA-Deliverable 5.2 Methods and Guidelines for Sensitivity Analysis, Including Results for Analysis on Case Studies; SINTEF: Trondheim, Norway, 2011; Available online: https://www.sintef.no/globalassets/project/lore-lca/deliverables/lore-lca-wp5-d5.2-emi_final.pdf (accessed on 20 October 2019).
  59. ZEB Tool Manual. Technical Guide. Version 1, The Research Centre for Zero Emission Buildings; Internal Memo: Trondheim, Norway, 2017. [Google Scholar]
  60. National Railway Administration. TB/T 10429-2014: Evaluation Standard for Green Railway Stations; National Railway Administration: Beijing, China, 2014.
  61. Cheng, B.; Li, J.; Tam, V.W.Y.; Yang, M.; Chen, D. A BIM-LCA Approach for Estimating the Greenhouse Gas Emissions of Large-Scale Public Buildings: A Case Study. Sustainability 2020, 12, 685. [Google Scholar] [CrossRef] [Green Version]
  62. Graabak, I.; Bakken, B.H.; Feilberg, N. Zero emission building and conversion factors between electricity consumption and emissions of greenhouse gases in a long term perspective. Environ. Clin. Technol. 2014, 13, 12–19. [Google Scholar] [CrossRef] [Green Version]
Figure 1. Energy use comparison among five types of public buildings [6].
Sustainability 12 01704 g001
Figure 2. Schematic diagram of HSRS building in shape and scale [40].
Sustainability 12 01704 g002
Figure 3. Climatic regionalization map for architecture in China and site of the case study building. (Red spot: representative cities in China, orange spot: Tianjin.).
Sustainability 12 01704 g003
Figure 4. Life cycle phases of a building and system boundary for the case study [31].
Sustainability 12 01704 g004
Figure 5. (a) Bird’s eye view of building information model (BIM) in Revit; (b) Building energy model in DesignBuilder.
Sustainability 12 01704 g005
Figure 6. Distribution of annual operational energy use (kWh/m2·a).
Sustainability 12 01704 g006
Figure 7. GHG emissions per life cycle module (kgCO2eq/m2·a).
Sustainability 12 01704 g007
Figure 8. Comparison of embodied GHG emissions by building elements.
Sustainability 12 01704 g008
Figure 9. Level of material inventory detail and comparison of embodied GHG emissions.
Sustainability 12 01704 g009
Figure 10. GHG emissions of case building with different single strategies.
Sustainability 12 01704 g010
Figure 11. Annual operation energy use in all three scenarios (kWh/m2·a).
Sustainability 12 01704 g011
Table 1. Physical and spatial characteristics of investigated HSRS buildings in the cold zone.
Code *HSRSCapacity
(Person)
GFA
(m2)
Space (m)
WidthDepthHeight
(1)Beijing South railway station10,500252,00035019540
(2)Tianjin West railway station5000104,00040014557
(3)Jinan West railway station4000100,00019210744
(4)Langfang railway station100098891703620
(5)Tianjin South railway station100086691452030
(6)Cangzhou West railway station120010,2131683422
(7)Dezhou East railway station200019,8102063430
(8)Qufu East railway station150099962063528
(9)Zaozhuang railway station100099651853721
(10)Xuzhou East railway station250014,9841644428
* denotes that stations (1)–(3) are super large and large sizes, stations (4)–(10) are medium-sized.
Table 2. CO2eq emission data of partial construction materials in the standard [52].
Material TypeC30 Reinforced ConcreteSteel CementSandStone
UnitkgCO2eq/m3kgCO2eq/tkgCO2eq/tkgCO2eq/tkgCO2eq/t
CO2eq Emission Data29523407352.515.08
Table 3. Design parameters for the occupancy, HVAC system, lighting, and DHW.
Design ParametersValues
Occupancy Density (Persons/m2)0.12 (Waiting Room)


HVAC system
HeatingHeating design temperature18 °C (waiting room)
SCOP4.0 (GSHP, electricity)
Operating schedule15th November–15th March; 5:00–23:00 on
CoolingCooling design temperature28 °C (waiting room)
SEER4.8 (GSHP, electricity)
Operating schedule15th May–15th September; 5:00–23:00 on
Mechanical ventilation–air exchange2–3/h
Minimum fresh air (l/s·person)2.778

Lighting efficiency
Illuminance (lux)200 (waiting room)
Power density (w/m2)8 (waiting room)/6 (others)
Operating schedule5:00–23:00 every day, whole year
DHW Consumption rate (l/m2·day)0.4
Table 4. GHG emissions per building element and the proportion that they constitute.
Life Cycle Module A1–A3Life Cycle Module B4Life Cycle Module A1–A3, B4
CO2eq Emissions (kgCO2eq/m2·a)Percentage (%)CO2eq Emissions (kgCO2eq/m2·a)Percentage (%)CO2eq Emissions (kgCO2eq/m2·a)Percentage (%)
Groundwork, foundations0.583.56000.582.67
Load bearing structure5.6534.61005.6525.98
Outer walls6.1937.924.1777.1310.3747.68
Inner walls0.603.69000.602.76
Floor structure1.6810.290.478.772.169.93
Outer roof1.629.920.7614.102.3810.94
Total 16.341005.4110021.75100
Table 5. Design variables matrix for SA, SRC values, and optimal solution.
Design VariablesRange/ValuesNumber of Design OptionsSRC ValueCase BuildingOptimal Solution
1External wall construction
(insulation thickness)
0.5 cm (U = 0.56 W/m2·K)4 options0.42
1.0 cm (U = 0.42 W/m2·K) *
2.0 cm (U = 0.27 W/m2·K)
3.0 cm (U = 0.20 W/m2·K)
2Outer roof construction
(insulation thickness)
0.5 cm (U = 0.64 W/m2·K)4 options0.39
1.0 cm (U = 0.33 W/m2·K)
2.0 cm (U = 0.17 W/m2·K)
3.0 cm (U = 0.12 W/m2·K)
3Glazing type
(U-value)
Double low-E insulated glazing
(U = 1.4 W/m2·K, SHGC = 0.30)
4 options0.87
Double low-E coated glazing
(U = 1.7 W/m2·K, SHGC = 0.50)
Double low-E glazing
(U = 2.2 W/m2·K, SHGC = 0.63)
Double clear float glazing
(U = 2.8 W/m2·K, SHGC = 0.70)
4Local shading
(projection louver)
04 options0.19
0.5 m
1.0 m
1.5 m
* dot denotes the corresponding value in “Range/values” column that was used in case building or selected in optimal solution.
Table 6. Single strategies optimized in the case building and GHG emissions (kgCO2eq/m2·a).
Single StrategiesEmbodied GHG EmissionsOperational
GHG Emissions
Total Life Cycle GHG Emissions
Module A1–A3Module B4Total Modules
Case building (H1/ A1/ UG1/ S1/ E1) 16.345.4121.7593.73115.48
H2 = 25 m15.585.0620.6483.54104.18
H3 = 20 m14.634.4519.0878.9898.06
Reduction (%) *−10.5%−17.7%−12.3%−15.7%−15.0%
A2 = 1313 m216.345.4121.7576.3998.14
A3 = 657 m216.345.4121.7570.4692.21
Reduction (%) *---−24.8%−20.1%
UG2 = 1.7 W/m2·K15.794.8620.6590.15110.80
UG3 = 1.4 W/m2·K15.604.6720.2786.51106.78
Reduction (%) *−4.5%−13.6%−6.8%−7.7%−7.5%
S2 = 15% recycled concrete + steel15.935.4121.3493.73115.07
S3 = 30% recycled concrete + steel15.525.4120.9393.73114.66
Reduction (%) *−5.0%-−3.7%-−0.7%
E2 = 35, service life 16.345.4121.7593.73115.48
E3 = 50, service life16.342.1518.4993.73112.22
Reduction (%) *-−60.2%−15.0%-−2.8%
* denotes the GHG emissions reduction (%) of building optimized by single strategies (H3, A3, UG3, S3, E3) compared to the reference (H1, A1, UG1, S1, E1) in each column.
Table 7. Summary of the life cycle GHG emission results of different optimization scenarios (kgCO2eq/m2·a).
Space Optimization
(H3, A3 in Table 1)
Envelope Optimization
(Optimal Solution in Table 1)
Material Optimization
(S3, E3 in Table 1)
A1–A314.6315.6015.52
B44.454.672.15
B663.8080.0193.73
Embodied GHG emissions19.0820.2717.67
Total GHG emissions 82.88100.28111.4
Reduction (%) *–28.2%–13.1%–3.5%
* denotes the reduction value (%) of total GHG emissions in optimization scenarios compared to the reference value (115 kgCO2eq/m2·a).

