Using a Citizen Science Approach with German Horse Owners to Study the Locomotion Behaviour of Horses on Pasture


1
Department of Crop Sciences, University of Göttingen, 37075 Göttingen, Germany
2
Centre of Biodiversity and Sustainable Land Use, University of Göttingen, 37077 Göttingen, Germany
*
Author to whom correspondence should be addressed.
Sustainability 2020, 12(5), 1835; https://doi.org/10.3390/su12051835
Submission received: 7 January 2020
/
Revised: 20 February 2020
/
Accepted: 25 February 2020
/
Published: 29 February 2020
(This article belongs to the Special Issue Sustainable Grazing Systems)
Abstract
:Engaging farmers as citizen scientists may be a cost-efficient way to answering applied research questions aimed at more sustainable land use. We used a citizen science approach with German horse farmers with a dual goal. Firstly, we tested the practicability of this approach for answering ‘real-life’ questions in variable agricultural land-use systems. Secondly, we were interested in the knowledge it can provide about locomotion of horses on pasture and the management factors influencing this behaviour. Out of 165 volunteers, we selected 40 participants to record locomotion of two horses on pasture and provide information on their horse husbandry and pasture management. We obtained complete records for three recording days per horse from 28 participants, resulting in a dataset on more individual horses than any other Global Positioning System study published in the last 30 years. Time spent walking was greatest for horses kept in box-stall stables, and walking distance decreased with increasing grazing time. This suggests that restrictions in pasture access may increase stress on grass swards through running and trampling, severely challenging sustainable pasture management. Our study, involving simple technology, clear instructions and rigorous quality assessment, demonstrates the potential of citizen science actively involving land managers in agricultural research.
1. Introduction
The engagement of amateur naturalists, e.g., in the field of ornithology, has contributed greatly to our ecological knowledge since the late 19th century [1,2]. Termed ‘citizen science‘, scientists cooperate with citizens to answer real-world questions [3]. The rapid development of new communication technologies, instruments and applications in the last few decades has enabled entirely new ways to engage the public in the research process [4,5,6]. As a result, a growing number of studies successfully enlist the public around the globe to provide data to be used across a wide range of scientific disciplines [7,8]. Cost- and labour-efficient citizen science projects can provide datasets impossible to sample with traditional research methodology [2,8,9]. In addition, they increase understanding of ecological challenges [1,2] and can potentially improve stakeholder decisions [6,10,11].
To date, agricultural research has not taken full advantage of citizen science [4]. Engaging farmers in research projects provides a prospect to learn from and to empower those who manage our agricultural landscapes. In contrast to amateur naturalists, for whom participation in citizen science is usually a leisure-time activity, farmers’ engagement in research activities is often linked to the benefit they obtain for their own enterprise [12]. Farmers already successfully collaborate with scientists in farm-based participatory action research (PAR), such as farm networks or on-farm trials. Such approaches are fundamental to develop and test sustainable land-use practices and determine constraints in an actual farming operation [4]. However, they are very time-consuming for farmers and researchers [4], require long-term commitment and are difficult to implement on a broader scale [13]. Citizen science methods are less restricted in this respect [13].
In managed grasslands, successful citizen science projects already engage farmers in monitoring of vegetation [14], insects [15], ecosystem services [16] and yield [10], but not livestock behaviour. In the past, tracking technology has been quite expensive, so that telemetry studies are usually conducted on few individuals. The development of low-cost Global Positioning System (GPS) technology increasingly used by the public might change this scenario. The most prominent citizen science study making use of GPS technology is the Cat Tracker study with pet cats in Australia [17]. However, even though sustainable grazing management begins with a profound knowledge of the grazing behaviour, no studies investigating livestock behaviour with a citizen science approach have been carried out yet.
The locomotion behaviour of horses on pasture is a particularly suitable subject for a farmer-based citizen science study for several reasons:
Firstly, horses are playing an increasingly important role as grazer species in European managed grasslands [18,19], but many basic questions about grassland management with horses have not been addressed by systematic research. Grazing and the possibility of free locomotion on pasture is a main criterion of animal welfare in horse husbandry [20]. The potential of horse grazing in maintaining relatively species-rich grasslands in agricultural landscapes has recently been stressed [18,19]. In an observational study of managed grasslands, paddocks grazed by horses were more species-rich and contained more indicator species for a ‘high nature value’ than paddocks grazed by cattle (Schmitz and Isselstein, submitted to this special issue). However, conflicts due to inappropriate grazing management by some horse farmers [21,22] are increasing, particularly in peri-urban regions. Experimental studies on agricultural grassland management with domestic horses are sparse [23,24,25,26]. Most of the knowledge on the equine locomotion behaviour, in particular, is derived from behaviour of feral horses in largely natural surroundings [27,28,29]. Anecdotal knowledge and observations of farmers question the applicability of those findings on domestic horses on pasture [21,22]. In comparison to other livestock, horses are well known for their specific and highly developed need for locomotion [30]. In those husbandry systems that restrict locomotion opportunities [31] to the time spent on pasture, intense running and trampling may stress swards and pose severe challenges to sustainable grassland management. Diverse grasslands, containing species that are more sensitive to intense trampling, may be at particular risk.
Secondly, grassland management with horses in Germany is characterised by a great variability of site-specific conditions and the applied management, such as stocking rates, grazing system or grassland maintenance measures [19]. This variability cannot be addressed with traditional experimental studies but presents great opportunities for a citizen science approach.
Thirdly, horse farmers may have a particularly high intrinsic motivation to participate in citizen science studies. Not only are the horses partners in leisure time and sports [20], but the majority of German horse farmers are interested in improving their knowledge on sustainable grassland management [19].
Here, we present a study conducted with horse farmers in Germany with a dual goal. Firstly, we wanted to assess the practicability and constraints of citizen science as a research methodology to answer applied research questions of agricultural science, particularly horse husbandry. Secondly, we were interested in the locomotion behaviour of horses on the pasture itself. We designed the study to learn how the locomotion of horses on pasture is affected by the grazing system, time on pasture, husbandry system and horse type.
Combining our experience in this citizen science project and results based on the data recorded by practitioners in this project, we aim to draw conclusions on the applicability of such a method to provide significant knowledge for future sustainable management decisions and extension.
2. Materials and Methods
2.1. Study Design
To gather useful data to address our research questions, we conducted a citizen science project with horse farms in Germany following the model for developing citizen science projects proposed by Bonney et al. [1]. The study was designed to assess the effects of grazing system, average daily time on pasture, horse type and husbandry system on locomotion of domestic horses on pasture. Two grazing systems (continuous and rotational stocking), two classes of average daily time on pasture (2–8 h, > 8 h) and two horse types (cold-blooded and warm-blooded type, following Langlois (1994) [32]) were to be distinguished. Husbandry systems were classified into box-stall stables, free-ranging stables (i.e., active stables, paddock trails) and pasture only. The aim was to select 40 horse farmers to achieve a balanced dataset concerning these four design variables. GPS telemetry of two horses per farm was to be recorded for five days on the same pasture.
2.2. Selection of Participants
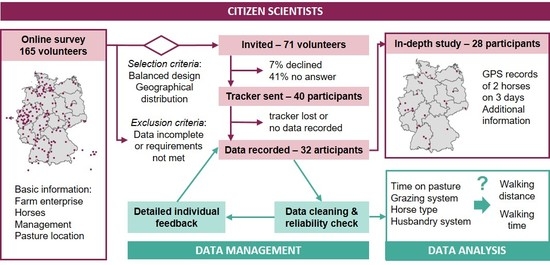
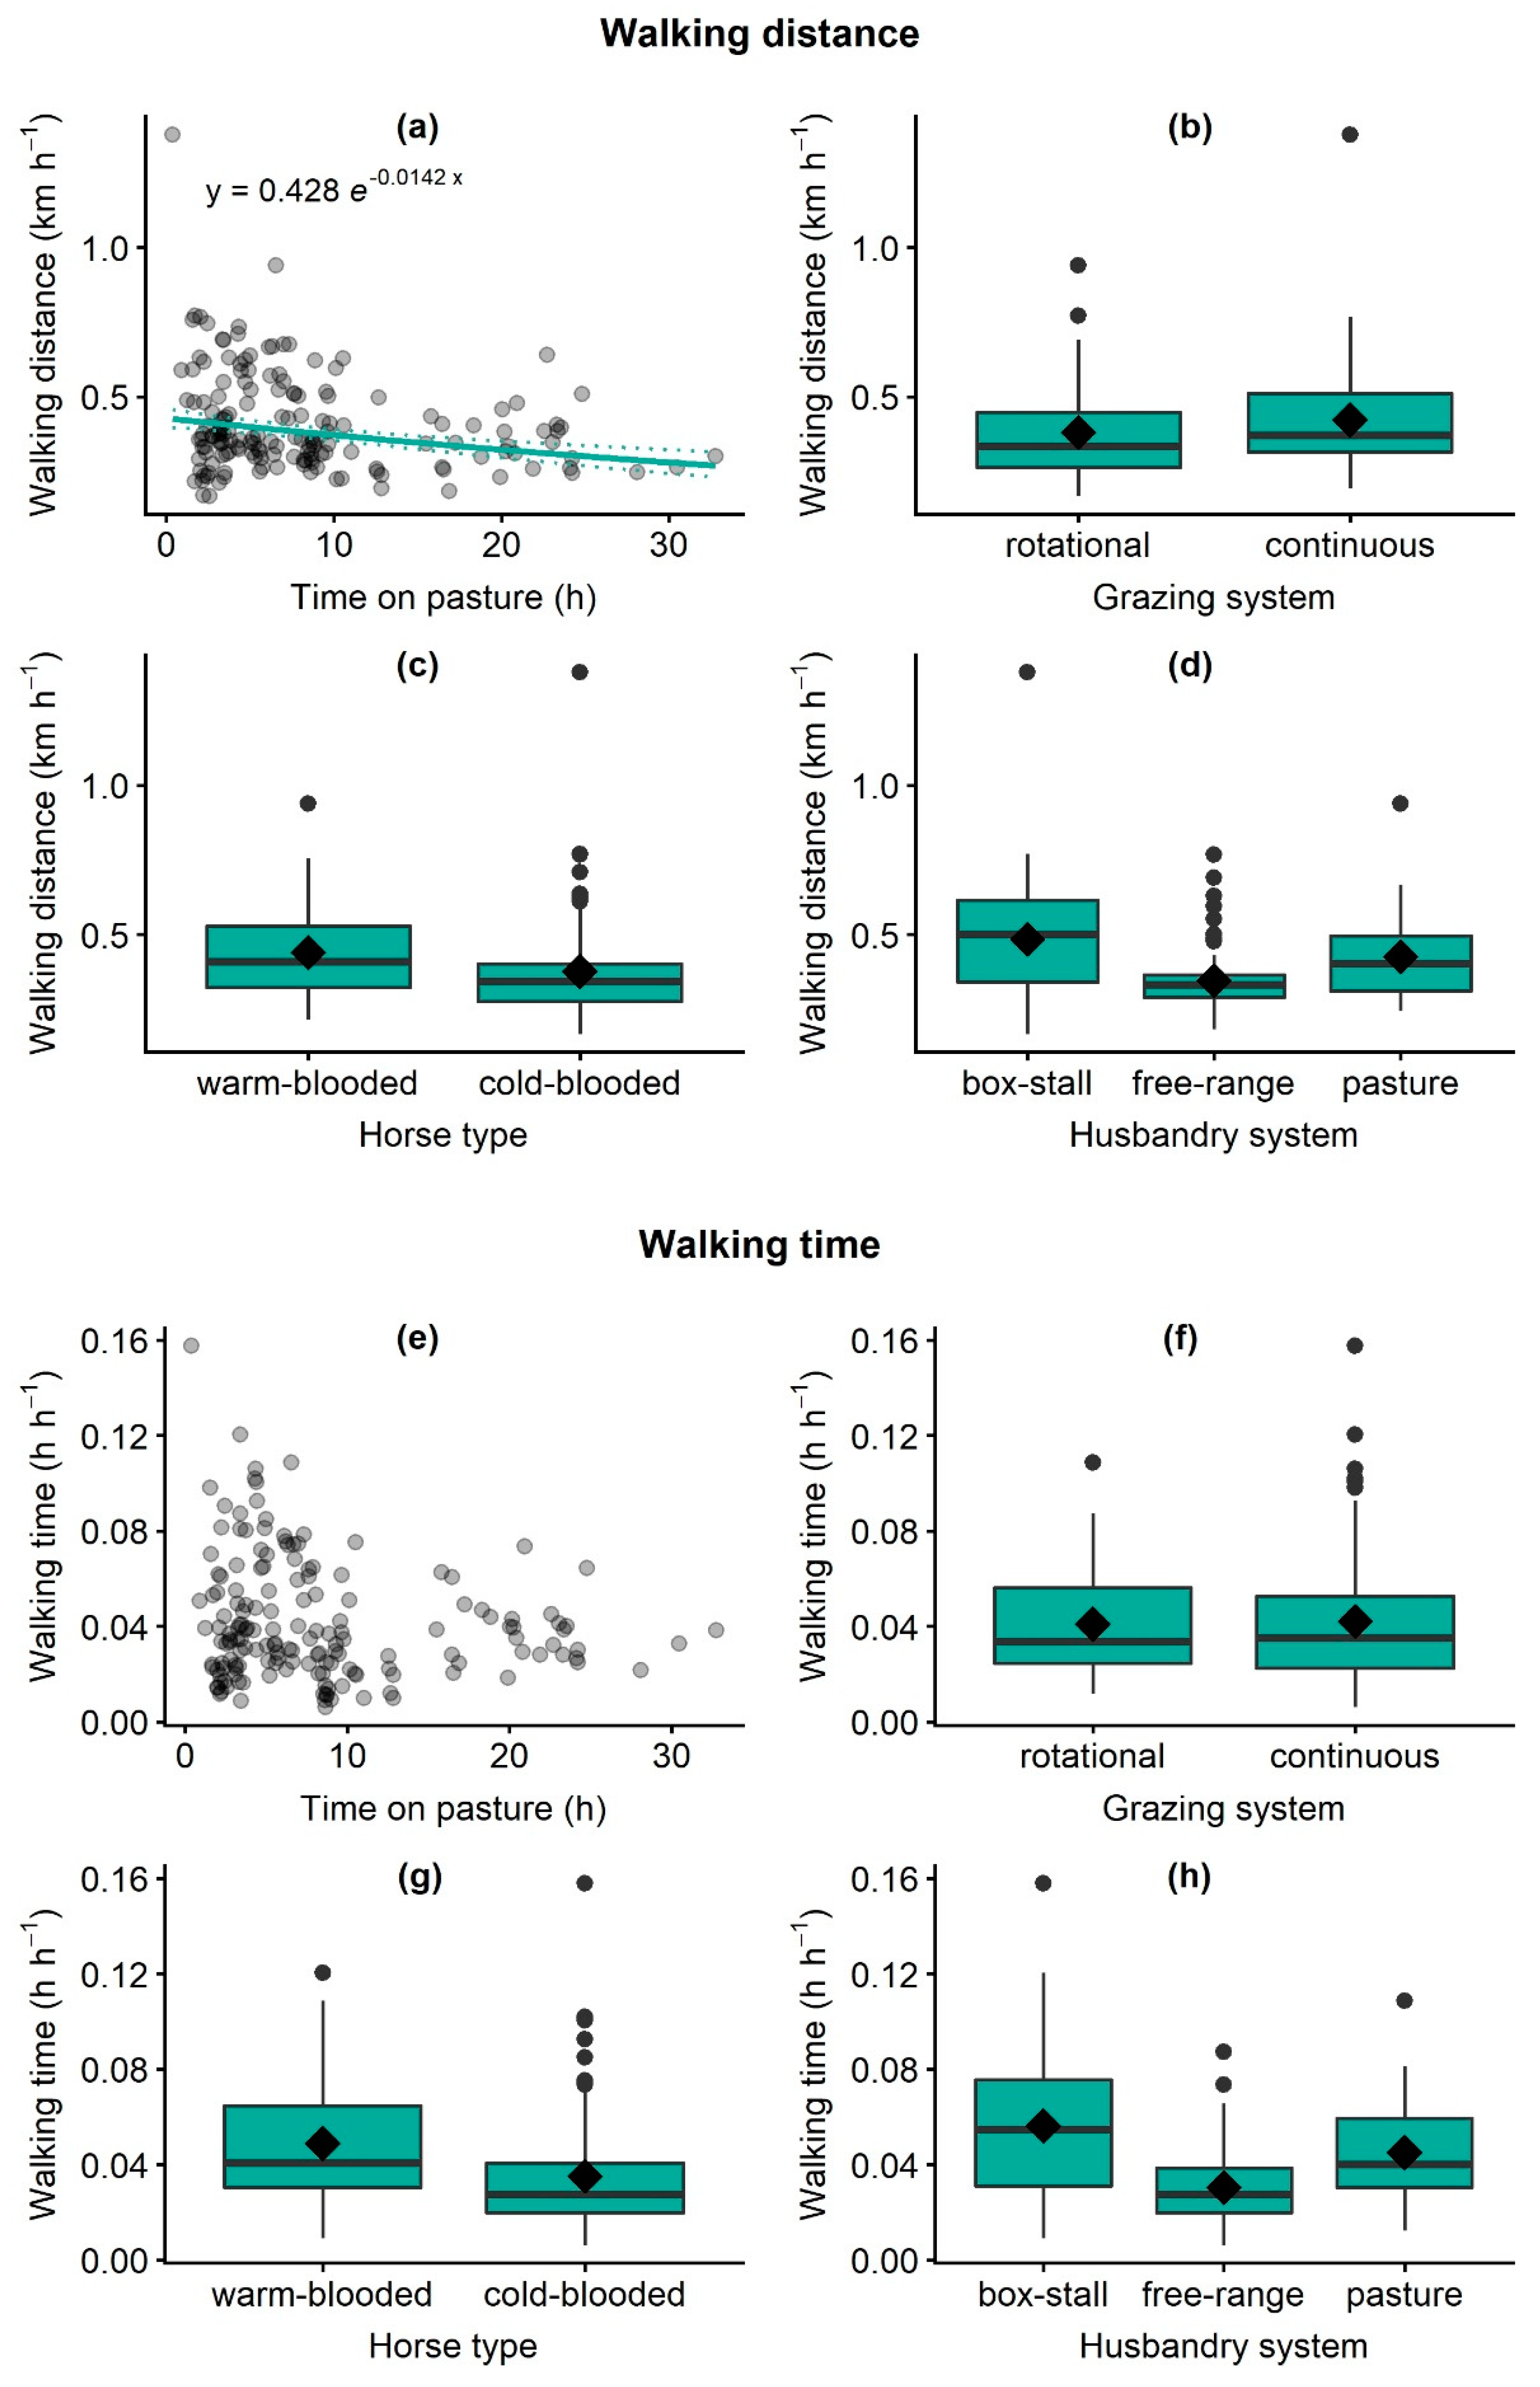
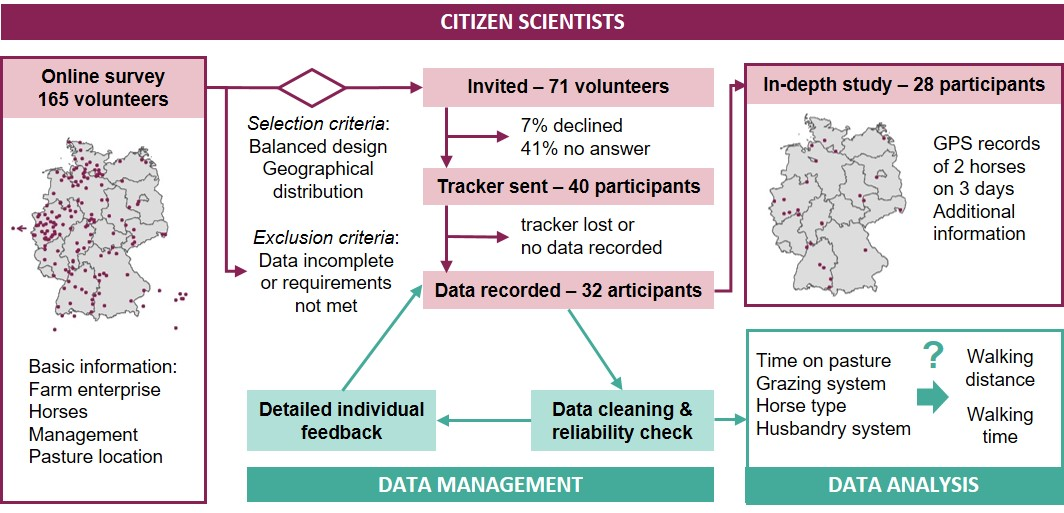
Horse farmers engaged as citizen scientists in our study were selected in a three-step approach (Figure 1). We recruited farmers through an open invitation to participate. The invitation was launched in July 2017 through an online social networking service. The authors (AS and AKS) posted the invitation in various network groups focused on horse husbandry, nutrition and welfare or pasture management. Further, extension networks, chambers of agriculture and a horse rider’s magazine agreed to spread the information through their own communication channels. In each case, basic information about the study design was offered and feedback on the locomotion of each horse was promised (Supplementary Material S1). Potential participants could sign up for our study by filling in an online survey (Supplementary Material S2). Participants had to fulfil a set of requirements. Horses enlisted had to be in regular training and healthy, 6–20 years old and accustomed to regular grazing. Pasture size was to be at least 0.2 hectare (ha) for rotational and 0.5 ha for continuous grazing systems. Data on farm enterprise (hobby vs. commercial), horse type, husbandry system and grassland management-related variables (grazing system, average grazing time, grazing intensity) were assessed. Grazing systems were defined through a help text in the survey: ‘under rotational grazing paddocks are grazed repeatedly during the year, with stocking periods that are shorter than the intervening resting periods’ (See Supplementary Material S2 ‘online survey for participation’). Continuous grazing, on the contrary, consists of one long stocking period per vegetation period. Farmers provided geographical coordinates of the pasture with a survey-implemented map tool. A total of 165 horse farmers enlisted in this first step. We checked survey responses and removed respondents who did not fulfil our participation criteria. Additionally, we used Google Earth Pro 7.3.2.5776 (Google LLC, Mountain View, CA, USA) to exclude pastures with very steep inclination or dense tree cover that would have biased the recordings.
From the remaining participants, we selected a subset of 40 farmers who constituted a balanced dataset regarding grazing system and average time on pasture, retaining the other farms as a back-up. We then invited these farmers to actively record data and asked for their mailing address to send the tracking package. Since not all confirmed their participation, we successively invited farmers from the back-up list to participate. The final subset of participants was almost balanced with regard to grazing system and average time on pasture (Table 1).
2.3. GPS Units
The GPS unit utilized in this study was a Columbus V-900 GPS logger (Columbus Europe, Berlin, Germany) with European Geostationary Navigation Overlay Service (EGNOS)/ Wide Area Augmentation System (WAAS) DGPS correction and a 95% circular error probability (CEP) of 2.5 m. The logger measures 43 mm × 74 mm × 9 mm, has a weight of 55 g and a producer-specified battery life of 22–24 h in track-log mode. It records timestamp, location, altitude and an internal speed measure in 1-sec intervals and stores them on an internal memory card. A microphone permits timestamped voice recording of comments. We tested the GPS loggers with horses to identify possible constraints and optimize instructions to farmers. The tests showed that shelter and dense tree cover caused measurement errors, which was the reason to exclude participants where these features occurred.
2.4. Data Recording
Each of the 40 participants was mailed two GPS units and equipment. We provided waterproof cases to attach the units to the halter or neck ring and included detailed instructions how to attach the GPS logger and record data (Supplementary Material S3 and S4). Farmers were asked to record grazing during five days between August 15 and September 5 2017 without modifying daily routines and herd structures during data recording. Mares had to be excluded during estrus to avoid a potential further source of variability in locomotion behaviour. To provide the best satellite reception, the GPS loggers were to be attached to the neck of the horses. Voice recordings on the GPS unit allowed to check that farmers used each GPS logger on the same horse during all recordings. Farmers also provided data on weather (temperature, rainfall, sunshine, wind), insect occurrence and training activity for each GPS-recording day (Supplementary Material S4). In a final online survey (Supplementary Material S5), participants submitted these data together with more detailed information on grazing system, husbandry system, size and structure of the herd, management factors, and information about the investigated horses such as age, sex, breed and training. Additionally, they were asked to evaluate the approach of recording GPS data and the provided instruction. Further, they were asked to upload pictures of horses and pastures for verification.
After completing GPS recording, farmers mailed the equipment back using a pre-paid return shipping label. We carried out a first, farm-specific analysis of the recorded data and sent farmers a detailed feedback on their horses’ locomotion (Supplementary Material S6) as a reward for their efforts in collecting the data. We then further reviewed data quality and selected datasets for statistical analysis for the in-depth study, as described below.
2.5. Data Preparation
We received a total of 264 GPS records, each consisting of the daily GPS data of one individual horse. We reviewed and cleaned these data following a rigorous protocol. We assessed survey data and checked for plausibility. In cases of uncertainty, farmers were contacted to ensure data quality. We excluded GPS records provided without management information (n = 3) and a case of doubt (n = 1) from the analysis. All farms with less than three complete records or with records covering less than two hours were excluded as well (n = 5), as were farms that tracked horses on different paddocks or changed paddock during tracking (n = 2). While farmers were asked to provide five records per horse, this number was not reached by all the remaining participants. We therefore included three complete records per horse in our analysis. Where farmers provided more records, we chose the three records of best quality. One record had to be removed later because implausible animal locations indicated a malfunction of the GPS unit. The data cleaning process led to a data set of 167 GPS records that was less balanced than the initially selected data set.
To reduce artefacts from measurement uncertainty, we calculated mean locations and timestamps over 5-sec intervals for all further analyses. We removed the first 5 min of each GPS record to exclude the period during which incompletely established satellite connection may have led to greater measurement errors, and also the final minute, during which the logger was taken out of its pocket to be switched off. We used orthophotos provided in Google Earth Pro to digitize the area of each pasture. We then removed all GPS locations outside the pasture area and any intervals between GPS locations that exceeded 60 sec, thereby excluding periods during which horses were temporarily taken off pasture or entered an adjacent stable.
We calculated time on pasture for each GPS record as the sum of all remaining time intervals, and total walking distance as the sum of all distances of successive locations. To measure total walking time, we used non-zero values of the internal speed measure. In contrast to distances calculated from telemetry locations, this speed measure is zero for small displacements such as caused by GPS measurement error. Walking distance and walking time were then divided by time on pasture. In contrast to the initial survey, in which we classified volunteers into two groups based on the average daily time on pasture (Table 1), we used the measured value of time on pasture as a numerical variable in the statistical analysis. Please see Supplement Material S8 for description of data sets. Analysed data are provided in supplementary files S9 (online survey data) and S10 (data of in-depth study).
2.6. Statistical Analysis of Grazing Behaviour
We analysed the relationship between our design explanatory variables–time on pasture (continuous variable), grazing system (rotational or continuous stocking), horse type (warm-blooded or cold-blooded) and husbandry system (box-stall, free-range, pasture)–and the response variables of walking distance and walking time in the statistics environment R 3.5.1 [33]. In all cases, we used linear mixed effects models implemented in the ‘nlme’ package [34], with farm and animal as nested random effects. We visually checked all models for homoscedasticity and normality of residuals. To fulfil these conditions, we log-transformed walking distance and walking time before analysis. The generalized variance inflation factor calculated with the ‘car’ [35] package as a measure of multicollinearity was 1.35 or less for all models. We first explored whether any of the other relevant recorded variables should be included in our models as potential confounding factors. For this, we fitted full models containing the fixed effects pasture size, pasture shape, stocking density, horse sex, horse age, days of training per week and air temperature during time on pasture. We calculated pasture size as the area of the digitized pastures and pasture shape as the ratio between their width and length. We identified the minimum adequate model as the model containing only those fixed effects that led to the smallest value of the second-order Akaike Information Criterion. All fixed effects remaining in this model were included as co-variables in the second analysis step. In this step, we fitted separate models for each of our four design explanatory variables. In each of these models, we included one design explanatory variable, fitted after the co-variables identified in the first step. We used sequential Wald tests to test the significance of all fixed effects.
3. Results
3.1. Experiences with Citizen Science
Within three weeks after the online survey was published, 165 horse owners and farmers expressed their interest in participating in the in-depth study (Table 2). We invited 40 farmers who matched the requirements to participate in the in-depth study. Of those invited, 52% responded immediately, 7% withdrew and 41% did not answer at all. By successively inviting more farmers from the back-up list, we were able to build a subset of 40 participants to record data. This final selection of participants was almost balanced regarding our design variables of grazing system and time on pasture (Table 1).
Out of the 40 participants equipped with a tracking set, we obtained 28 complete datasets with three records per horse for the in-depth study. We lost 30% of possible datasets: loggers were lost in the mail (n = 2, verified) or during tracking on pasture (n = 2). One farmer did not return the tracker set (n = 1). Some farmers did not record any (n = 3) or insufficient (n = 3) data. The latter records were too short (less than two hours) or paddocks were changed during recording. In one case, paddocks were flooded and the farmer could not record data within the given timespan. We had to exclude one case of doubt (n = 1). A total of nine GPS loggers (11%) were lost during this study.
Horse farmers entered data on management, the tracked horses and weather conditions via online survey. Three farms did not provide data at all and were therefore removed from analysis. In 27% of cases, farmers had to be contacted again in order to eliminate uncertainties and one farm was excluded from analysis due to uncertainty of records. Imprecise data were mainly related to a wrong use or misunderstanding of terminology (e.g., grazing system) or to flawed estimation, such as the size of the grazed paddocks. A re-assessment of the paddock sizes employing GIS data showed that 60% of participants overestimated their paddock sizes.
Farmers gave a positive feedback on the methodology of the study: 70% of the participants evaluated the provided instruction as ‘very good’ or ‘good’, 78% evaluated the applicability of the GPS logger as ‘very good’ or ‘good’. Thirty percent of the participants needed to repeat measures at least one time because horses removed loggers on pasture (Supplementary Material S11).
3.2. Locomotion Behaviour of Horses on Pasture
Time on pasture affected walking distance, but not walking time (Table 3). Per hour of grazing time, walking distance decreased by 1.4% (Figure 2a). The husbandry system had a significant effect on walking time and tended to affect walking distance (p = 0.0979, Table 3). Both were greatest for horses kept in box-stall stables and smallest for those in free-range stabling. Grazing system and horse type were neither related to walking distance nor walking time.
The analysis of potential confounding factors identified a model containing pasture size as the minimum adequate model for predicting walking distance, and a model containing horse sex for predicting walking time. Accordingly, we included these two as co-variables in the respective models (Table 3). Walking distance tended to increase with pasture size in all models (Table 3), and walking time of mares was significantly greater than that of geldings (Supplementary Material, Figure S7). Pasture shape, stocking density, horse age, days of training per week and air temperature during time on pasture did not improve either of the two models.
4. Discussion
4.1. Locomotion Behaviour of Horses on Pasture
So far, knowledge on horses’ locomotion in grasslands is mainly based on observations or has, more recently, been derived from GPS studies on feral horses in extensive landscapes such as large rangelands [27,29,36], where the search for forage and water, the escape from danger and social interactions are its main drivers [30,37]. Domestic horses’ locomotion and grazing behaviour, by contrast, are restricted in time and space by the applied management practices. Despite their relevance for sustainable pasture management, GPS studies on horses in an agricultural context are rare and have so far only been conducted on a limited number of individuals [31,38]. Using the citizen science approach, we are able to provide information on the locomotion behaviour of a variety of different horses (n = 56) and link that to information provided on grassland management.
Across the remarkable variability among individual horses, restriction in time and space, namely time on pasture and pasture size, were the main factors affecting walking distance (km h−1), while neither grazing system nor horse type had an effect (Table 3, Figure 2). In addition, walking time (h h−1), used as a measure of activity, was significantly affected by the husbandry system after accounting for the horses’ sex, with greatest value for horses kept in box-stalls and smallest for horses from free-range stables (Table 3, Figure 2).
The time horses spend on pasture is often restricted due to limited grazing area of a horse farm [19]. Under these conditions, horses will move immediately and on average faster than horses with less restricted or unrestricted time on pasture. In particular, horses housed in box-stalls with little space to move freely (9–12 m² on average [30]) have to use the time on pasture to fulfil their physical and behavioural needs for movement. In contrast, free-range stables provide shelter in combination with paved grounds where horses can freely move and interact, stimulating their activity [39,40,41]. In most cases, pasture is provided additionally for a restricted time, which is presumably used for grazing rather than running, explaining the smallest values for walking time (Figure 2h). Horses exclusively kept on pastures satisfy all their needs for movement on the pasture but are able to spread this activity more evenly over time.
The applied grazing system, i.e., continuous or rotational grazing, can regulate grazing effects on pasture vegetation [23,42] but we cannot confirm an effect on the locomotion of horses. Pasture size seems to be more important than grazing system, with larger pastures providing more space to satisfy the need for locomotion and permitting higher speed while running (Supplementary Material S7). We expected the warm-blooded horse types [32] to move more and faster than cold-blooded horses, as it has been shown in free-range stables in a study with a small sample of 13 horses [31]. In our study, no effect of horse type was confirmed. While horse age, days of training per week and air temperature during grazing did not affect locomotion, we only incorporated these variables as potential confounding factors. Future studies could be designed to target them directly.
As intense running and trampling, particularly of shod horses, mechanically stresses and harms swards, management options to control horse locomotion are of great interest for sustainable grassland management. Based on our results, permitting more daily time on pasture is one approach to reach this goal. Where grazing area is limited, other opportunities for free locomotion should be provided to enable horses to fulfil their needs off pasture. Based on our results we can highlight the potential of free-range stables as a husbandry system to enable horse farmers to graze more sustainably.
Beyond the results of our study, we can emphasize the application of GPS technology to better understand horses’ impact on grassland vegetation. This understanding is imperative in making informed decisions for sustainable grassland management. However, there are many questions left unsolved to be targeted by future studies. Such studies might track horses for longer time periods throughout the grazing season and might include training time as well as time spent on pasture. Grassland vegetation itself was not measured in this study. Given the locomotion data we can assess the potential impact on swards and soils. Future studies might link grassland vegetation characteristics with GPS data.
4.2. Citizen Science as a Research Methodology in Horse Husbandry
The present study is the first citizen science project focusing on horse farmers, equipping them with GPS technology to record the locomotion of horses in a ’real-world’ scenario. With their help, we gathered a unique and meaningful dataset that includes information on the locomotion of more individual horses than any other study published in the last 30 years.
Citizen science is a research method on the rise [7]. Boosted by the evolution of communication technologies, many research fields already take advantage of citizen science methodology and tools. In agricultural research, however, the prospect of citizen science methodology to answer applied research questions has been highlighted just recently [4,6,13,43]. The engagement of farmers in the research process provides a cost-efficient way to collect data at a broader scale. Recent studies highlight the potential of citizen science methodology to improve farmers knowledge in developing countries [12,44] and to promote agricultural sustainability in areas that lack extension programmes [6,12]. Beyond that, citizen science can be particularly useful to address groups of farmers who have not been in the focus of experimental research, such as horse farmers. In our study, horse farmers appeared as citizen scientists ’par excellence‘. It was possible to cover a rather broad range of horse farm and grassland conditions throughout Germany.
Despite these encouraging findings there are also constraints which have to be taken into consideration. Firstly, data quality is a critical issue in citizen science studies and has often been viewed with scepticism in recent years [8,13,45,46,47]. In addition to challenges common to any experimental approach, such as damage or loss of recording units, implementation by the farmers plays an important role. Simple technology and clear instruction protocols help farmers to record data but cannot entirely prevent insufficient or missing records. Misunderstandings of terminology or erroneous estimations might limit data quality. A rigorous quality assessment is therefore needed [8] and cases may have to be excluded for the sake of data quality. Accordingly, a very large initial sample size is crucial to finally producing a usable dataset. It permits to impose a clear study design by choosing volunteers representing desired levels of the explanatory variables under interest and to retain the number of replicates necessary given the variability of ’real-life scenarios’, even after accounting for losses along the process.
Secondly, it is necessary to account for labour-intense working steps when setting up a citizen science project. In our case, GPS units had to be mailed, received and data had to be prepared manually. Further, some participants needed support and unclear data needed to be revised. However, compared to costs and labour associated with the establishment of an experiment, the citizen science approach remains unconditionally attractive.
Thirdly, citizen science applications in agriculture may be hampered by privacy issues [43]. During the step-by-step subsetting approach, only 50% of the volunteers we chose for participation replied immediately. One reason might be the sensitivity to privacy issues. In particular, the combination of GPS tracking and sensitive management data needs to be handled carefully.
5. Outlook
Our case study highlights the potential of citizen science to address applied research questions in horse husbandry. We demonstrated that farmers as citizen scientists, armed with simple and low-cost technologies and a clear protocol, can augment data collection for research, resulting in robust ’real-life‘ datasets. Such datasets provide the basis for a better understanding of more complex management and environment interactions. In addition, horse owners are more likely to adopt improved grassland management and grazing practices when they are involved in the research process. Given the manifold challenges and research questions in sustainable grassland utilisation with horses, such an approach may thus help to overcome the limitations of traditional experimental research.
Supplementary Materials
The following are available online at https://www.mdpi.com/2071-1050/12/5/1835/s1: S1 Invitation to participate; S2 Online survey to apply for participation; S3 Instructions for GPS recording; S4 Instructions for recording auxiliary data; S5 Final online survey, S6 Example of feedback to participants; S7 Statistical analysis of locomotion behaviour–effect of co-variables; S8 Description of data sets; S9_Schmitz_etal_data_online_survey.csv; S10_Schmitz_etal_data_indepth_study.csv; S11_Schmitz_etal_data_participant_feedback.csv.
Author Contributions
Conceptualization, A.S. and J.I.; formal analysis, A.S., B.T. and A.-K.S.; investigation, A.S. and A.-K.S.; methodology, A.S. and J.I.; visualization, B.T.; writing–original draft, A.S. and B.T.; writing–review & editing, A.-K.S. and J.I. All authors have read and agreed to the published version of the manuscript.
Funding
Bettina Tonn’s work was funded through the European Union Horizon 2020 Research and Innovation programme; Grant Agreement 774124, SUPER-G (Developing SUstainable PERmanent Grassland systems and policies). The research received no further external funding.
Acknowledgments
We gratefully thank all the horse farmers who participated in our study for their work, time and interest. We thank all the multiplicators of our study who helped us reach so many highly motivated farmers: the chambers of agriculture, the Vereinigung der Freizeitreiter und -fahrer in Deutschland e.V (VfD) and the magazine Cavallo.
Conflicts of Interest
The authors declare no conflict of interest.
References
- Bonney, R.; Cooper, C.B.; Dickinson, J.; Kelling, S.; Phillips, T.; Rosenberg, K.V.; Shirk, J. Citizen Science: A developing tool for expanding science knowledge and scientific literacy. BioScience 2009, 59, 977–984. [Google Scholar] [CrossRef]
- Silvertown, J. A new dawn for citizen science. Trends Ecol. Evol. 2009, 24, 467–471. [Google Scholar] [CrossRef] [PubMed]
- Citizen Science-Partner with Scientists to Answer Real-World Questions|National Marine Sanctuaries. Available online: https://sanctuaries.noaa.gov/involved/citizen-science.html (accessed on 29 December 2019).
- Dehnen-Schmutz, K.; Foster, G.L.; Owen, L.; Persello, S. Exploring the role of smartphone technology for citizen science in agriculture. Agron. Sustain. Dev. 2016, 36, 25. [Google Scholar] [CrossRef] [Green Version]
- Newman, G.; Wiggins, A.; Crall, A.; Graham, E.; Newman, S.; Crowston, K. The future of citizen science: Emerging technologies and shifting paradigms. Front. Ecol. Environ. 2012, 10, 298–304. [Google Scholar] [CrossRef] [Green Version]
- Ryan, S.F.; Adamson, N.L.; Aktipis, A.; Andersen, L.K.; Austin, R.; Barnes, L.; Beasley, M.R.; Bedell, K.D.; Briggs, S.; Chapman, B.; et al. The role of citizen science in addressing grand challenges in food and agriculture research. Proc. R. Soc. B Biol. Sci. 2018, 285, 20181977. [Google Scholar] [CrossRef] [PubMed]
- Theobald, E.J.; Ettinger, A.K.; Burgess, H.K.; DeBey, L.B.; Schmidt, N.R.; Froehlich, H.E.; Wagner, C.; HilleRisLambers, J.; Tewksbury, J.; Harsch, M.A.; et al. Global change and local solutions: Tapping the unrealized potential of citizen science for biodiversity research. Biol. Conserv. 2015, 181, 236–244. [Google Scholar] [CrossRef] [Green Version]
- Kosmala, M.; Wiggins, A.; Swanson, A.; Simmons, B. Assessing data quality in citizen science. Front. Ecol. Environ. 2016, 14, 551–560. [Google Scholar] [CrossRef] [Green Version]
- Simoniello, C.; Jencks, J.; Lauro, F.M.; Loftis, J.D.; Weslawski, J.M.; Deja, K.; Forrest, D.R.; Gossett, S.; Jeffries, T.C.; Jensen, R.M.; et al. Citizen-Science for the Future: Advisory Case Studies From Around the Globe. Front. Mar. Sci. 2019, 6, 225. [Google Scholar] [CrossRef] [Green Version]
- Hanrahan, L.; Geoghegan, A.; O’Donovan, M.; Griffith, V.; Ruelle, E.; Wallace, M.; Shalloo, L. PastureBase Ireland: A grassland decision support system and national database. Comput. Electron. Agric. 2017, 136, 193–201. [Google Scholar] [CrossRef]
- Toomey, A.H.; Domroese, M.C. Can citizen science lead to positive conservation attitudes and behaviors? Hum. Ecol. Rev. 2013, 20, 50–62. [Google Scholar]
- Beza, E.; Steinke, J.; van Etten, J.; Reidsma, P.; Fadda, C.; Mittra, S.; Mathur, P.; Kooistra, L. What are the prospects for citizen science in agriculture? Evidence from three continents on motivation and mobile telephone use of resource-poor farmers. PLoS ONE 2017, 12, e0175700. [Google Scholar] [CrossRef] [PubMed] [Green Version]
- Steinke, J.; van Etten, J.; Zelan, P.M. The accuracy of farmer-generated data in an agricultural citizen science methodology. Agron. Sustain. Dev. 2017, 37, 32:1–32:12. [Google Scholar]
- Zacharias, M.; Ressi, W. Biodiversity monitoring by farmers to sustain ecosystem services of high nature value grasslands in Austria. Rural Areas Dev. 2018, 15, 219–229. [Google Scholar]
- Rüdisser, J.; Tasser, E.; Walde, J.; Huemer, P.; Lechner, K.; Ortner, A.; Tappeiner, U. Simplified and still meaningful: Assessing butterfly habitat quality in grasslands with data collected by pupils. J. Insect Conserv. 2017, 21, 677–688. [Google Scholar] [CrossRef] [Green Version]
- Kaartinen, R.; Hardwick, B.; Roslin, T. Using citizen scientists to measure an ecosystem service nationwide. Ecology 2013, 94, 2645–2652. [Google Scholar] [CrossRef]
- Roetman, P.; Tindle, H.; Litchfield, C. Management of pet cats: The impact of the Cat Tracker citizen science project in South Australia. Animals 2018, 8, 190. [Google Scholar] [CrossRef] [Green Version]
- Jouven, M.; Vial, C.; Fleurance, G. Horses and rangelands: Perspectives in Europe based on a French case study. Grass Forage Sci. 2016, 71, 178–194. [Google Scholar] [CrossRef]
- Schmitz, A.; Isselstein, J. Wieviel Grünland wird in Deutschland für Pferde genutzt? Berichte Über Landwirtsch. Z. Für Agrarpolit. Landwirtsch. 2018, 96. [Google Scholar] [CrossRef]
- Hölker, S. Typologie der deutschen Pferdehaltung-Eine empirische Studie mittels Two-Step-Clusteranalyse. Berichte Über Landwirtsch. Z. Für Agrarpolit. Landwirtsch. 2016, 94. [Google Scholar] [CrossRef]
- Bomans, K.; Dewaelheyns, V.; Gulinck, H. Pasture for horses: An underestimated land use class in an urbanized and multifunctional area. Int. J. Sustain. Dev. Plan. 2011, 6, 195–211. [Google Scholar] [CrossRef] [Green Version]
- Zasada, I.; Berges, R.; Hilgendorf, J.; Piorr, A. Horsekeeping and the peri-urban development in the Berlin Metropolitan Region. J. Land Use Sci. 2013, 8, 199–214. [Google Scholar] [CrossRef]
- Bott, R.C.; Greene, E.A.; Koch, K.; Martinson, K.L.; Siciliano, P.D.; Williams, C.; Trottier, N.L.; Burk, A.; Swinker, A. Production and environmental implications of equine grazing. J. Equine Vet. Sci. 2013, 33, 1031–1043. [Google Scholar] [CrossRef]
- Singer, J.W.; Bobsin, N.; Kluchinski, D.; Bamka, W.J. Equine stocking density effect on soil chemical properties, botanical composition, and species density. Commun. Soil Sci. Plant Anal. 2001, 32, 2549–2559. [Google Scholar] [CrossRef]
- Martinson, K.L.; Siciliano, P.D.; Sheaffer, C.C.; McIntosh, B.J.; Swinker, A.M.; Williams, C.A. A review of equine grazing research methodologies. J. Equine Vet. Sci. 2017, 51, 92–104. [Google Scholar] [CrossRef]
- van Klink, R.; Nolte, S.; Mandema, F.S.; Lagendijk, D.D.G.; WallisDeVries, M.F.; Bakker, J.P.; Esselink, P.; Smit, C. Effects of grazing management on biodiversity across trophic levels–The importance of livestock species and stocking density in salt marshes. Agric. Ecosyst. Environ. 2016, 235, 329–339. [Google Scholar] [CrossRef] [Green Version]
- Hampson, B.A.; Morton, J.M.; Mills, P.C.; Trotter, M.G.; Lamb, D.W.; Pollitt, C.C. Monitoring distances travelled by horses using GPS tracking collars. Aust. Vet. J. 2010, 88, 176–181. [Google Scholar] [CrossRef]
- Hampson, B.A.; de Laat, M.A.; Mills, P.C.; Pollitt, C.C. Distances travelled by feral horses in ‘outback’ Australia: Distance travelled by feral horses. Equine Vet. J. 2010, 42, 582–586. [Google Scholar] [CrossRef] [Green Version]
- Hennig, J.D.; Beck, J.L.; Scasta, D.J. Spatial ecology observations from feral horses equipped with global positioning system transmitters. Hum. Wildl. Interact. 2018, 12, 75–84. [Google Scholar]
- Zeitler-Feicht, M.H. Handbuch Pferdeverhalten, 2nd ed.; Eugen Ulmer: Stuttgart, Germany, 2008. [Google Scholar]
- Claudi, K.; Hoy, S. Measurements of distances moved by horses in an active stable by GPS. Tierärztl. Umsch. 2013, 68, 486–490. [Google Scholar]
- Langlois, B. Inter-breed variation in the horse with regard to cold adaptation: A review. Livest. Prod. Sci. 1994, 40, 1–7. [Google Scholar] [CrossRef]
- R Core Team. R: A Language and Environment for Statistical Computing; R Foundation for Statistical Computing: Vienna, Austria, 2018. [Google Scholar]
- Pinheiro, J.; Bates, D.; DebRoy, S.; Sarkar, D. Nlme: Linear and Nonlinear Mixed Effects Models; R Package Version 3.1–137. R Core Team. Available online: https://CRAN.R-project.org/package=nlme (accessed on 5 July 2018).
- Fox, J.; Weisberg, S. An R Companion to Applied Regression, 2nd ed.; Sage: Thousand Oaks, CA, USA, 2011. [Google Scholar]
- Pikuła, R.; Zaborski, D.; Grzesiak, W.; Smugała, M. Locomotor activity analysis based on habitat, season and time of the day in Polish Konik horses from reserve breeding using the Global Positioning System (GPS). Indian J. Anim. Res. 2019, B1072. [Google Scholar] [CrossRef]
- Rehm, G. Auswirkungen Verschiedener Haltungsverfahren auf die Bewegungsaktivität und die Soziale Aktivität bei Hauspferden; Aktuelle Aspekte der Ethologie in der Pferdehaltung; FN Verlag: Warendorf, Germany, 1981; pp. 81–101. [Google Scholar]
- Sato, F.; Tanabe, T.; Murase, H.; Tominari, M.; Kawai, M. Application of a wearable GPS unit for examining interindividual distances in a herd of Thoroughbred dams and their foals. J. Equine Sci. 2017, 28, 13–17. [Google Scholar] [CrossRef] [PubMed] [Green Version]
- Rose-Meierhöfer, S.; Standke, K.; Hoffmann, G. Auswirkungen verschiedener Gruppengrößen auf Bewegungs- aktivität, Body Condition Score, Liege-und Sozialverhalten bei Jungpferden. Züchtungskunde 2010, 82, 282–291. [Google Scholar]
- Hoffmann, G.; Bentke, A.; Rose-Meierhöfer, S.; Berg, W.; Mazetti, P.; Hardarson, G.H. Influence of an active stable system on the behavior and body condition of Icelandic horses. Animal 2012, 6, 1684–1693. [Google Scholar] [CrossRef] [Green Version]
- Jackson, J. Paddock Paradise: A Guide to Natural Horse Boarding; Star Ridge Publishing: Harrison, AR, USA, 2016. [Google Scholar]
- Rook, A.J.; Dumont, B.; Isselstein, J.; Osoro, K.; WallisDeVries, M.F.; Parente, G.; Mills, J. Matching type of livestock to desired biodiversity outcomes in pastures—A review. Biol. Conserv. 2004, 119, 137–150. [Google Scholar] [CrossRef]
- Minet, J.; Curnel, Y.; Gobin, A.; Goffart, J.-P.; Mélard, F.; Tychon, B.; Wellens, J.; Defourny, P. Crowdsourcing for agricultural applications: A review of uses and opportunities for a farmsourcing approach. Comput. Electron. Agric. 2017, 142, 126–138. [Google Scholar] [CrossRef] [Green Version]
- Van Etten, J.; Beza, E.; Calderer, L.; Van Duijvendijk, K.; Fadda, C.; Fantahun, B.; Kidane, Y.G.; Van De Gevel, J.; Gupta, A.; Mengistu, D.K.; et al. First experiences with a novel farmer citizen science approach: Crowdsourcing participatory variety selection through on-farm triadic comparisons of technologies (TRICOT). Exp. Agric. 2019, 55, 275–296. [Google Scholar] [CrossRef] [Green Version]
- Dickinson, J.L.; Zuckerberg, B.; Bonter, D.N. Citizen Science as an Ecological Research Tool: Challenges and Benefits. Annu. Rev. Ecol. Evol. Syst. 2010, 41, 149–172. [Google Scholar] [CrossRef] [Green Version]
- Pearce-Higgins, J.W.; Baillie, S.R.; Boughey, K.; Bourn, N.A.D.; Foppen, R.P.B.; Gillings, S.; Gregory, R.D.; Hunt, T.; Jiguet, F.; Lehikoinen, A.; et al. Overcoming the challenges of public data archiving for citizen science biodiversity recording and monitoring schemes. J. Appl. Ecol. 2018, 55, 2544–2551. [Google Scholar] [CrossRef] [Green Version]
- Rossiter, D.G.; Liu, J.; Carlisle, S.; Zhu, A.-X. Can citizen science assist digital soil mapping? Geoderma 2015, 259, 71–80. [Google Scholar] [CrossRef]
Figure 1.
Flowchart of the applied citizen science methodology.
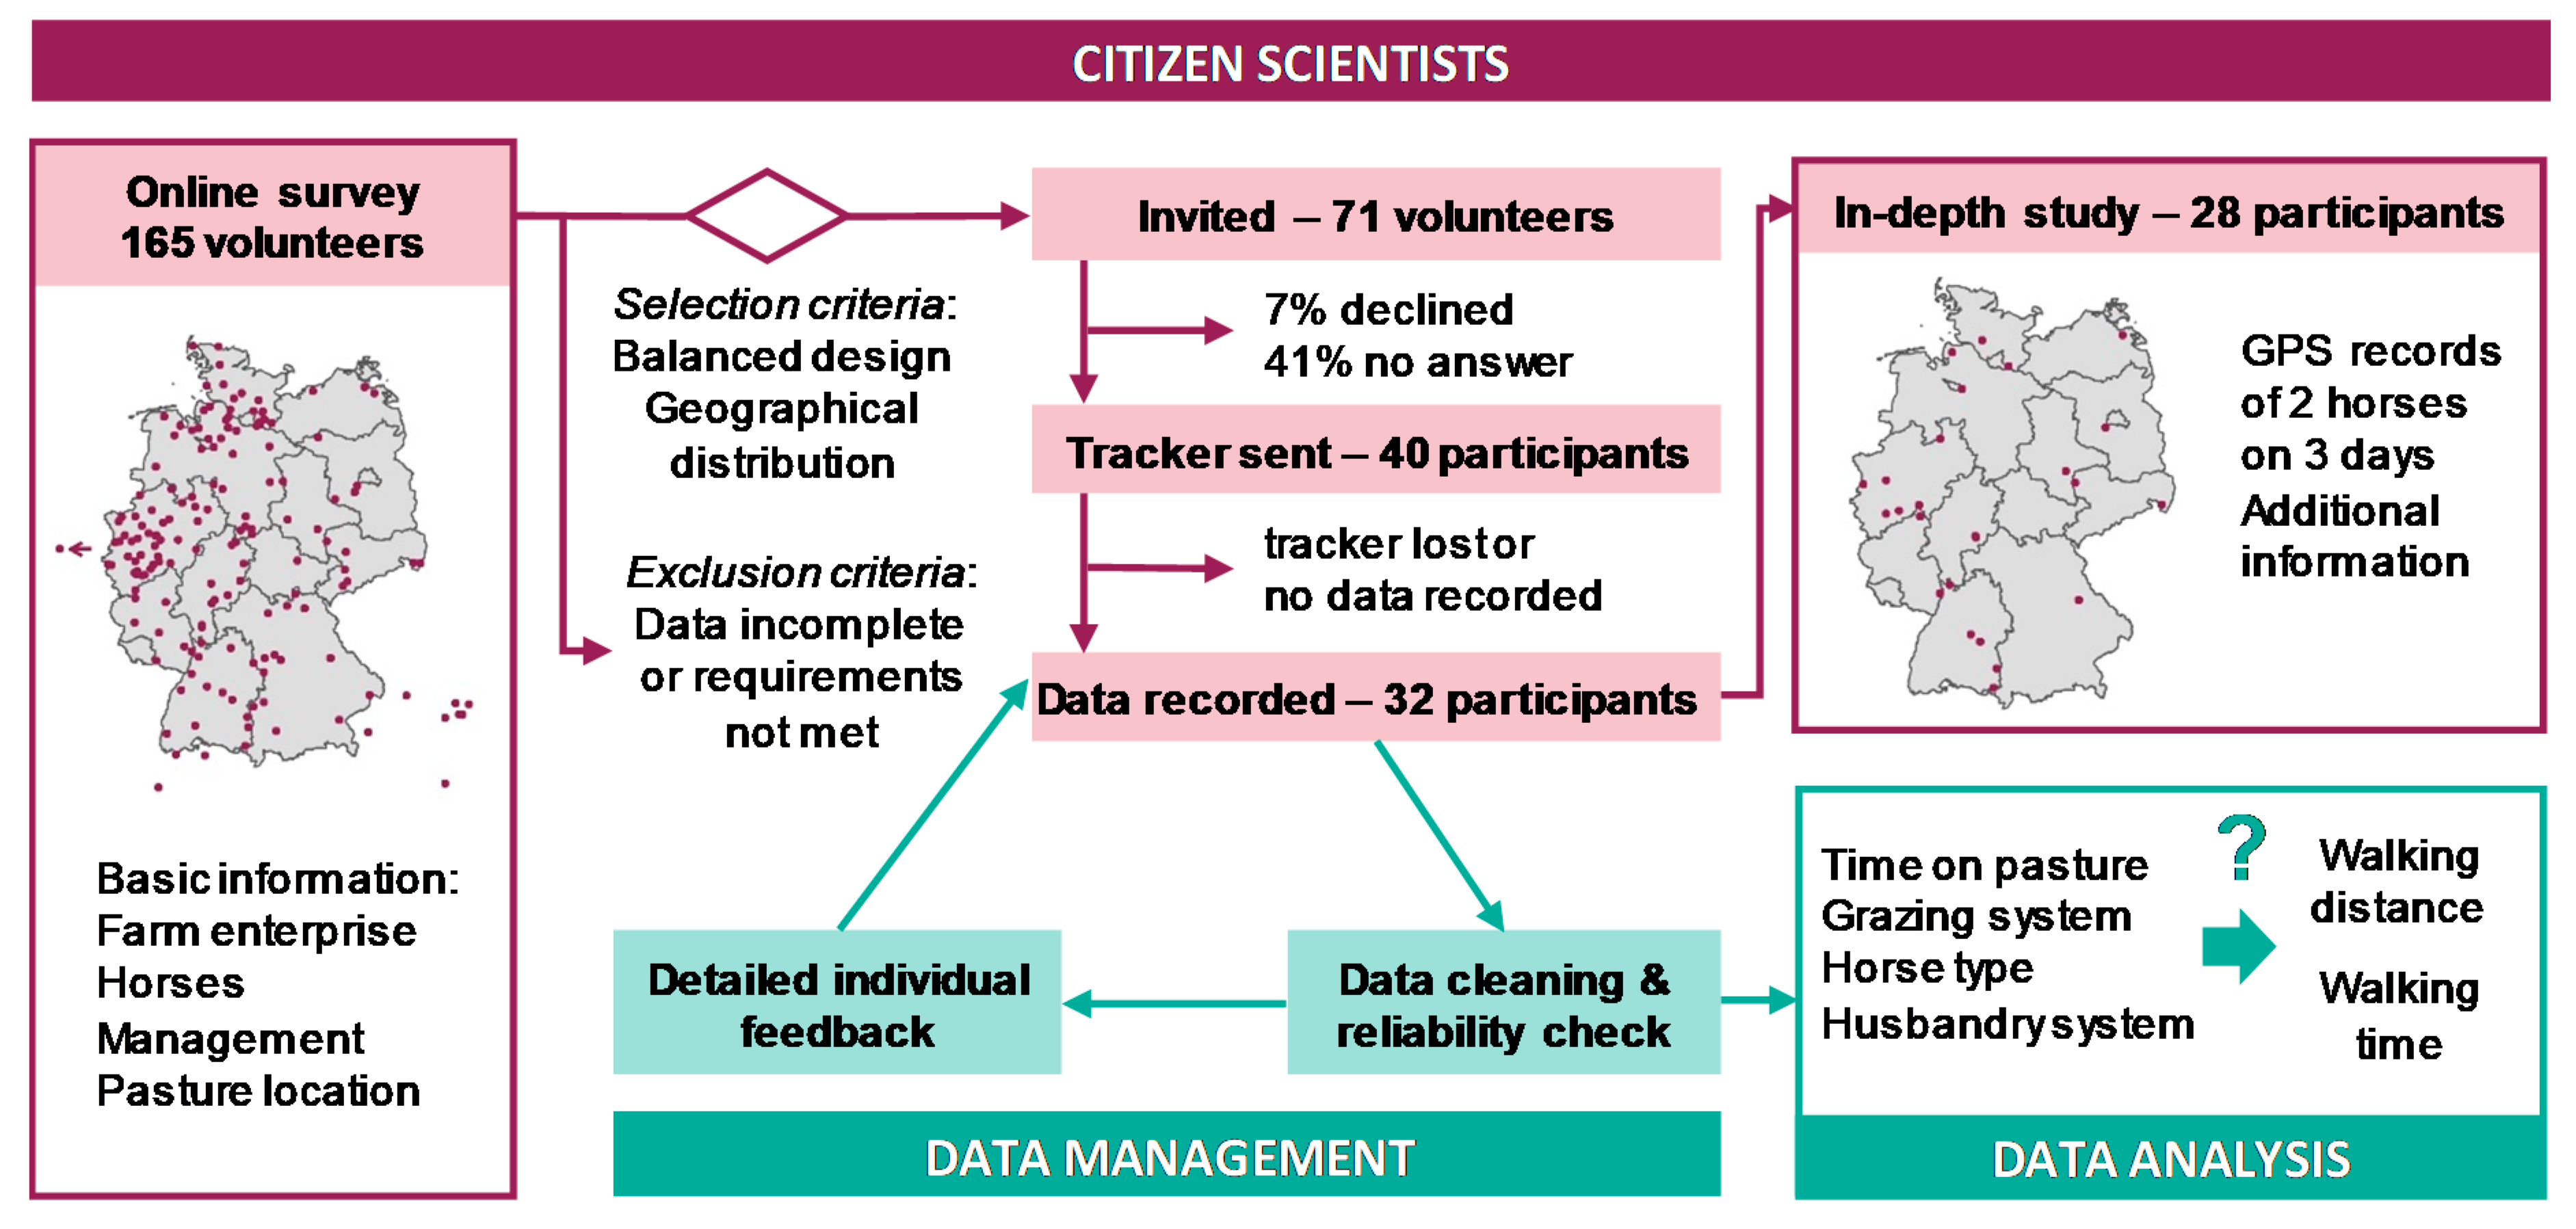
Figure 2.
Effect of time on pasture, grazing system, horse type and horse husbandry system on walking distance (a–f) and walking time (e–h) of horses on pasture. (a): scatterplot of raw data and model prediction with 95% confidence interval; (b–d,f–h): boxplots and means (diamond) of raw data. Sample size: 167 GPS records from 56 horses on 28 farms.

Table 1.
Participants equipped with GPS tracking package with regard to the design variables.
| Average Daily Time on Pasture | |||
|---|---|---|---|
| Grazing system | total | <8 h | >8 h |
| continuous | 19 | 9 | 10 |
| rotational | 21 | 11 | 10 |
Table 2.
Characteristics of enlisted volunteers of the online survey and the participants of the in-depth study. (a) number of farms or horses in each category; (b) mean, standard deviation (sd), minimum (min) and maximum values (max).
Table 2.
Characteristics of enlisted volunteers of the online survey and the participants of the in-depth study. (a) number of farms or horses in each category; (b) mean, standard deviation (sd), minimum (min) and maximum values (max).
| (a) Variable | Category | Online survey | In-depth study | ||||||
| Farms | Total | 165 | 28 | ||||||
| Enterprise | Hobby | 121 | 14 | ||||||
| Commercial | 44 | 14 | |||||||
| Grazing system | Continuous | 84 | 18 | ||||||
| Rotational | 81 | 10 | |||||||
| Average time on pasture | < 8 h | 51 | 15 | ||||||
| > 8 h | 114 | 13 | |||||||
| Herd structure | Mixed | 100 | 15 | ||||||
| Mares only | 28 | 6 | |||||||
| Geldings only | 37 | 7 | |||||||
| Horses | Total | 330 | 56 | ||||||
| Horse type | Cold-blooded | 129 | 29 | ||||||
| Warm-blooded | 201 | 27 | |||||||
| Husbandry system | Box-stall stable | 113 | 17 | ||||||
| Free-range stable | 105 | 29 | |||||||
| Pasture | 112 | 10 | |||||||
| (b) Variable | Online survey | In-depth study | |||||||
| mean | sd | min | max | mean | sd | min | max | ||
| Pasture size (ha) * | 2.2 | 7.9 | 0.2 | 100 | 1.2 | 1.1 | 0.2 | 4.8 | |
| Herd size (n) | 7 | 6.9 | 2 | 51 | 8.3 | 7.4 | 2 | 30 | |
| Stocking density (LU ha−1) † | – | – | – | – | 11.9 | 17.7 | 2.5 | 97.5 | |
| Horse age (a) | 12.1 | 4.1 | 6 | 22 | 12.3 | 4.1 | 6 | 22 | |
* based on reported values for the online survey and on digitized orthophotos for the in-depth study † LU: livestock unit, corresponding to 500 kg live weight; the online survey only recorded number, but not weight of all animals in the herd.
Table 3.
Sequential Wald tests of design explanatory variables fitted after a co-variable in linear mixed-effects models predicting walking distance and walking time by horses on pasture. Rm2: marginal coefficient of determination. Sample size: 167 GPS records from 56 horses on 28 farms.
Table 3.
Sequential Wald tests of design explanatory variables fitted after a co-variable in linear mixed-effects models predicting walking distance and walking time by horses on pasture. Rm2: marginal coefficient of determination. Sample size: 167 GPS records from 56 horses on 28 farms.
| Response Variable | Explanatory Variable | Co-Variable | Rm² | ||||
|---|---|---|---|---|---|---|---|
| Name | p Value | F Value | Name | p Value | F Value | ||
| Walking distance (km h−1) | Time on pasture | 0.0212 | 5.47 | Pasture size | 0.0499 | 4.23 | 0.143 |
| Grazing system | 0.4806 | 0.51 | 0.0698 | 3.59 | 0.086 | ||
| Horse type | 0.9309 | 0.01 | 0.0669 | 3.66 | 0.077 | ||
| Husbandry system | 0.0979 | 2.55 | 0.0543 | 4.10 | 0.148 | ||
| Walking time (h h−1) | Time on pasture | 0.4639 | 0.54 | Horse sex | 0.0082 | 8.15 | 0.067 |
| Grazing system | 0.9197 | 0.01 | 0.0086 | 8.03 | 0.053 | ||
| Horse type | 0.2402 | 1.44 | 0.0072 | 8.51 | 0.075 | ||
| Husbandry system | 0.0445 | 3.53 | 0.0054 | 9.27 | 0.181 | ||
© 2020 by the authors. Licensee MDPI, Basel, Switzerland. This article is an open access article distributed under the terms and conditions of the Creative Commons Attribution (CC BY) license (http://creativecommons.org/licenses/by/4.0/).
Share and Cite
MDPI and ACS Style
Schmitz, A.; Tonn, B.; Schöppner, A.-K.; Isselstein, J. Using a Citizen Science Approach with German Horse Owners to Study the Locomotion Behaviour of Horses on Pasture. Sustainability 2020, 12, 1835. https://doi.org/10.3390/su12051835
AMA Style
Schmitz A, Tonn B, Schöppner A-K, Isselstein J. Using a Citizen Science Approach with German Horse Owners to Study the Locomotion Behaviour of Horses on Pasture. Sustainability. 2020; 12(5):1835. https://doi.org/10.3390/su12051835
Chicago/Turabian StyleSchmitz, Anja, Bettina Tonn, Ann-Kathrin Schöppner, and Johannes Isselstein. 2020. "Using a Citizen Science Approach with German Horse Owners to Study the Locomotion Behaviour of Horses on Pasture" Sustainability 12, no. 5: 1835. https://doi.org/10.3390/su12051835
Note that from the first issue of 2016, this journal uses article numbers instead of page numbers. See further details here.