Quality Decision-Making Behavior of Bodies Participating in the Agri-Foods E-Supply Chain

College of Business, Yangzhou University, Yangzhou 225127, China
*
Authors to whom correspondence should be addressed.
Sustainability 2020, 12(5), 1874; https://doi.org/10.3390/su12051874
Submission received: 1 January 2020
/
Revised: 16 February 2020
/
Accepted: 20 February 2020
/
Published: 2 March 2020
(This article belongs to the Special Issue Agri-Food Markets towards Sustainable Patterns: Trends, Drivers and Challenges)
Abstract
:The quality of agri-foods in e-supply chains confronts more threats than that in the traditional agri-food supply chain. However, most of the existing studies focusing on the quality problems of fresh agri-products are mainly cases studies and statistical analyses, and they do not take into account the farmers’ willingness to comply with safe agri-food supply procedures. To solve the supply quality problems of fresh agri-foods and help participators make a better choice, the decision-making behavior on the supply quality of agri-foods in the e-supply chain was deeply studied in this paper using game theory. Some factors related to the decision behavior of the supply chain were analyzed, including the supervision intension of the government, the rights protection consciousness of consumers, and the intensity of punishment for poor-quality agri-foods. These factors have an important influence on the farmers’ willingness to provide high-quality products and e-business’ probability of inspection. Compared with three different decision models of agri-food e-supply chains, the results show that the decentralized decision model is better than the centralized model from the view of quality protection. The behavior of members of the supply chain is as follows: the farmers’ willingness to supply high-quality agri-foods increases with the increase in the consumers’ consciousness of their rights and the government’s supervision intensity. The “experience deviation” phenomenon also occurs when a new e-business makes a decision about its quality inspection behavior in this e-supply chain where the quality information is traceable. As such, e-business enterprises should reduce their quality inspection behavior based on the increase in the government’s supervision intensity. This happens to be opposite to the traditional experience where quality information is not traceable. This study not only extends the research framework of the novel electronic supply chain, but also provides a certain reference for the subsequent research and e-business practices of fresh produce in developing countries.
1. Introduction
According to the McKinsey Global Institute’s latest research, by the year 2025, the internet economy in China will be 22% of Chinese overall gross domestic product (GDP) growth [1]. In China, the next economic miracle will be the internet economy. However, there was almost no progress in the kind of non-standard products over the previous decade in electronic channels such as fresh agricultural foods. In traditional offline circulation, the supply chain is usually long and consists of many stakeholders, and it is hard for consumers to obtain full information for agri-food products [2]. Therefore, the retail price turns out to be multiple times higher than the original wholesale price. The typical phenomenon of “smile in the middle, and cry in both heads” in China is particularly prominent in the fresh market [3]. It is because of such a big price difference in buying and selling that logistics for fresh produce is an industry that online traders all want to work in. In spite of many difficulties, e-commerce for agricultural products has high expectations, which is known as one type of the short food supply chain [4]. Adopting e-commerce in agriculture could help consumers access more transparent information that generates consumer trust and purchasing intention [2]. After several years of development, an effective logistics network for fresh goods in China began to take shape. A number of relatively representative enterprises emerged, such as “Food Housekeeper”, “Tmall Fresh”, “The 1st Store Fresh”, etc. As leaders of the internet industry, the integration of JD (JingDong) corner stores and the changes being made by SF (Shun Feng) stores are both good attempts at creating an online-to-offline supply chain for fresh produce. In the future, fresh electronic businesses will keep flourishing under the drive of society alongside the development of computer technology in the countryside [2]. However, at the same time, as fresh food e-commerce begins to prosper, concerns about the quality of fresh produce in the e-supply chain are also increasing, i.e., how to guarantee the quality of agri-foods in fresh produce e-business. As we know, the situation in the e-supply chain is much more complex because of the virtual trading environment where the buyer and seller do not have to meet face to face [5,6]. Therefore, there are more threats to food quality in the fresh e-supply chain than in the traditional agri-food supply chain. In addition, compared with offline relations, it seems harder for e-vendors to build up trust with their consumers [7]. Contrary to the speed of agricultural e-commerce development, China’s current laws and regulations lack clear restrictions on commodity quality supervision in e-supply chains [8]. Then, the opportunistic behavior of farmers in traditional agri-supply chains is more likely to appear in the electronic supply chain [9]. For this reason, we cannot help thinking what the quality decision behavior of each body participating in the fresh e-supply chain is. How do we make appropriate regulatory measures based on their behavior to ensure the quality of fresh produce?
The remainder of the paper is organized as follows: Section 2 gives a literature review related to the quality behavior of participants in the agri-food supply chain. Section 3 describes the materials and methods. We give a detailed description of the problem faced and symbols used; three different game models are constructed in this section. Section 4 gives the results with theoretical derivation and an example analysis. Finally, we conclude this paper with a discussion in Section 5, while the conclusion of this study comes in Section 6.
2. Relevant Literature Review
Judging from the existing literature, research into agri-food supply chain management became a hotspot over recent years. Researchers found that consumers usually place higher expectations on food sustainability with a specific emphasis on facets related to food quality and safety [10]. To this end, many studies were carried out on the quality attenuation [11], the incentives and coordination in quality control of agricultural products [12,13], the impact of effort level and fairness preference on the quality of agricultural products in the supply chain [14], and other aspects. Moreover, some scholars also studied specific agri-food supply chains, including oranges, vegetable, cheese, fish, and dairy [15,16,17,18,19]. Given the special structure of agri-food supply chain, some other studies examined the optimal decisions of participants, such as “farmer and supermarket” [20], “farmer and company” [21], and “farm and consumers” [22]. In terms of research methods, Siddh et al. [23] found that most of the current research focusing on the quality problems of fresh agricultural products was in the form of case studies and statistical analyses. For example, He et al. [24] studied the effect of government regulation on safety production of agri-foods using the empirical method based on an investigation of 510 vegetable growers. Chen et al. [25] discussed a quality security control model of the agricultural food supply chain based on a prediction model, which used probability statistics theory and a Monte Carlo simulation to detect the agricultural foods. Rajesh [26] said that supply chains were becoming lengthier and more complex due to globalization and vertical integrations; thus, he conducted research on the selection of risk mitigation strategy in electronic supply chains using gray theory and digraph matrix approaches. Through a survey of 499 students ranging in age from 18 to 25, by using the structural equation modeling analysis, a study on college students’ food safety attitudes shows that knowledge seems to be an important factor in shaping students’ attitudes regarding general and bacterial safety of agri-foods. However, ethnicity plays a role in how people view the politics of food safety and safety of organic foods [27].
Several factors, including quality and safety certification, green supplier evaluation and selection, marketing channel management, and government regulation, can influence the quality behavior of participants in the agri-food supply chain [28,29,30,31]. In a two-echelon decision-making model consisting of a loss-averse farmer and a loss-neutral company, Fu et al. [32] found that a high guaranteed price decided by the company can reduce the losses of farmers caused by price uncertainty; however, such pricing may breed laziness among the farmers in sustainable agricultural practice and reduce their activeness in supplying agri-foods. As an important indicator of the quality of fresh produce, freshness preservation also influences the quality of agri-foods and revenue of participants [33]. When consumers have increased sensitivity in high-level green agri-foods, members of the supply chain are willing to participate in coordination [34]. These studies mostly aim at maximizing the benefit of the members of the agri-food supply chain and obtaining optimal pricing, investment, and revenue coordination mechanisms [35,36,37]. By contrast, we focus on the quality decision behavior of stakeholders in the agri-food supply chain.
In particular, the development of modern information technology and computer science enhanced the traceability of information in the e-supply chain, especially in some high-value-added products, such as the hairy crab of Yangcheng Lake in China [38]. Therefore, some scholars proposed the establishment of a traceability information system to ensure the supply quality of fresh agricultural products. For instance, Bosona et al. [39] developed a coordinated distribution system. The system not only enhances the logistics efficiency and increases the potential market for local food producers but also improves the traceability of food origin for consumers. To manage the circulation of wheat products and implement the traceability of wheat products effectively, Cui [40] put forward a wheat circulation model to guarantee the wheat supply quality in China. Although scholars are very concerned about the quality of agricultural products in the supply chain and believe that the impact of regulatory measures is significant, poor supervision intensity is placed on the decision-making behavior of supply chain participants. These studies pointed out some notable problems in the supply chain of fresh agricultural products but failed to consider the willingness of farmers to supply safe agri-foods. Hence, the quality control measures in the supply chain of agricultural products can only start from the circulation process or following some after-event remediation based on these studies.
At present, limited studies discussed the quality decision-making behavior in the e-supply chain. Investigating the regulation of the supply behavior of high-quality agricultural produce by participants in the e-supply chain is necessary. To fill this gap, this article considers an electronic agri-food supply chain with farmers, an e-commerce enterprise (EC), and consumers. As a source of fresh produce in the supply chain, the improvement of the willingness of farmers to supply qualified products is taken into account. Then, the quality control behavior of participants in the fresh-produce e-supply chain is investigated from the information traceability perspective, which begins with the willingness of farmers to supply qualified products and provide quality testing of fresh produce of e-business enterprise. To the best of our knowledge, this manuscript is the first to consider the supervision intention of the government, the consciousness of consumers to rights protection, and the punishment intensity for shoddy agri-foods in e-supply chain management. Furthermore, this study formulates the guidelines for stakeholders in the quality assurance of agri-foods in the electronic agricultural practice. We expect to provide some beneficial reference and management implications for improving the quality of agricultural food through this study.
3. Materials and Methods
3.1. Problem and Symbol Description
The fresh e-supply chain described in this manuscript consists of fresh agri-food suppliers, EC, and consumers, such as the “Yiguo” website in China, “Freshdirect” in America, and other types of fresh supply chain participants. In the fresh e-supply chain, the fresh EC firstly purchases the products from farmers and then sends them to clients through logistics enterprises (such as SF express) after consumers submit their online orders. In the entire chain structure, the main behavior strategy of each body is shown in Table 1.
In the production dimension, the main task of farmers is to produce the needs of EC and ensure the delivery of fresh agri-foods. The farmer faces the following choices in providing products for the e-business partner [41]: (1) provide high-quality fresh produce, and (2) provide shoddy, inferior, or substandard products to seek additional interest. Limited by the reality of having a large market of agricultural products and small-scale production organization in China, government regulation is difficult with high regulatory cost. As a result, the government and consumers can barely test or specify the products of each producer.
In the sales dimension, the fresh-produce EC is the direct seller of agri-products. EC is crucial in connecting the producers and consumers, and it has the following choices about quality decision behavior in the order receipt process: (1) chill or directly sell the agri-foods without quality monitoring to save testing cost, and (2) control the supply quality of fresh agricultural products through strict inspection standards. In this dimension, the government can and is obligated to supervise the behavior of agricultural ECs. However, given that the regulation takes a considerable amount of human and material resources, the government has difficulty in inspecting each product of each batch of the agricultural EC. Therefore, the government can only conduct random testing of the supply quality. When the spot check shows that the product is unqualified, some corresponding punishment is given to the fresh EC to control the quality and influence the decision-making behavior of the enterprise.
The circulation dimension is subject to many factors, such as the scale and technology levels. In addition, the majority of the fresh-produce electronic-business enterprises in China choose to use the third-party logistics mode at present. The behavior of logistics service providers affecting the quality of the agro foods consists of (1) performing high-level effort and deliver products to consumers while guaranteeing both quality and quantity, and (2) conducting a general-level effort and delivering products to consumers regardless of any other factors. In this dimension, the responsibilities of the logistics service principal and agent should be defined clearly. The agent should deliver fresh agri-foods in a timely manner after receiving the product, and the matters of corresponding compensation should be negotiated ahead of time in case of product losses caused by force majeure to ensure the smooth and timeliness of logistics.
In the consumption dimension, ordinary citizens are the primary consumers of fresh agricultural products with rural residents accounting for a portion of the total. Traditionally, when consumers buy bad products (mainly judged by their appearance or taste), the general solution is the censure of retailers directly selling the product. Otherwise, consumers end up with nothing definite. In the electronic commerce environment, consumers who buy fresh produce online have no direct contact with the sellers. Hence, such products tend to have quality problems. Although vendor and logistics information is accessible, the return of goods or refund is difficult as a result of the virtual trading environment and the perishable feature of fresh products. The claim for compensation is typically difficult. Then, the consumers have the following choices: (1) to avoid unnecessary trouble and end up with nothing, or (2) take legal action to defend their rights. In this dimension, the interests of consumers are vulnerable to violations. If not properly handled, such infringements are bound to affect the confidence of consumers in the entire fresh produce e-commerce.
Table 1 shows that the government has considerable influence over the electronic supply chain of fresh produce but has minimal impact on the level of effort exerted by logistics service providers in the circulation dimension. Therefore, the decision behavior of these providers should be adjusted by the market in the circulation link. The agricultural EC and logistics service provider can communicate through consultations, as well as set certain incentives and encourage the logistics service providers of fresh products to obtain the target level of effort that the EC desires. Therefore, in this agricultural e-supply chain, we ignore third-party logistics service providers and only consider the safety factor of agri-food quality. The symbols in this article are listed in Table 2.
3.2. Model Setting
Several assumptions are made on the three-level supply chain of electronic fresh produce in China.
Assumption 1. In this fresh e-supply chain, the EC sets up a business relationship with upstream farmers. A batch of payment is given in advance before the date of delivery, and the remaining payment is supposedly paid after the completion of sale. EC sells the products to consumers through an e-commerce platform.
Assumption 2. Given the perishable feature of fresh products, we assume that, once the agri-foods move on to the next link, they can no longer be returned to the farmers. In this e-supply chain, each product can be traced back to a specific producer. Hence, information tracking is possible regardless of the link causing the quality problem. All participants are assumed to be risk neutral and aim to achieve their own utility maximization.
Assumption 3. For convenience, we assume that farmers are able to determine the adulteration behavior when they provide low-level products, as long as the EC detects them. A penalty is then given to farmers to compensate for the shortage cost (the unit shortage cost of products out of stock is ). The farmers are asked to replace the low-level products with high-level products in the next production cycle. The fine of per unit product s (s < rp) is deducted from the final payment.
Assumption 4. Given that the loss in transit is very large due to the perishable characteristics of fresh agricultural products, refund processing is unacceptable. However, when consumers safeguard their legal rights, a compensation per unit product n is given by the EC with the help of relevant laws and regulations.
(1) Decentralized decision model without government intervention
According to the context above, the agricultural electronic supply chain starts with the farmers and ends with the consumers. The model without government intervention under the chain structure is shown in Figure 1.
According to Bayes’s theorem and Figure 1, the following expected return of a farmer, is equal to the sum of the returns of each probabilistic behavior:
The expected return of fresh EC can be expressed as
By adding and, the total revenue of the e-supply chain of agricultural products can be expressed as follows:
In this supply chain, the farmers determine whether or not the qualified products are mixed with the adulterated products according to the supervision of EC. The probability under utility maximization can be obtained with the following backward induction solution:
where is the probability that farmers provide qualified products, and is the probability that the EC inspects the quality of upstream products supplied with the maximized expected return. By substituting and into the profit function, the utility , , and of farmers, the agricultural EC, and the supply chain can be obtained as follows:
where . The calculation is simplified by .
(2) Decentralized decision model with government supervision
To ensure the quality of fresh products and avoid the lazy behavior of agricultural EC, which may be a potential threat to the quality of agri-foods, we consider another situation wherein the related government department conducts a sampling inspection of fresh produce sold by the EC. If unqualified products are found during the inspection, then the department orders the removal of such products from the shelves. The government department also imposes a fine on the EC in the same batch as punishment. For convenience, we suppose that EC can determine these low-level quality agri-foods as long as government detection is performed. In reality, fresh e-commerce is often poorly supervised in China. For instance, some small ECs in “Taobao” remain unsupervised. The model with government supervision under the chain structure is shown in Figure 2.
According to Bayes’s theorem and Figure 2, the following expected return of a farmer, is equal to the sum of the returns of each probabilistic behavior:
The expected return of EC can be expressed as
The income function of the government is defined as
The total revenue function in the supply chain is calculated using
Government supervision is nonprofit. Although the supervision cost is also a factor affecting the decision, the intervention strategy of the government cannot simply rely on the cost. Hence, profit maximization is only one of the goals in the decision of government supervision. The profit function of the government is not a constraint in this study because the problem involves a Stackelberg game. Moreover, we use the backward induction solution to solve the problem. Finally, the probability of farmers providing low-level products and the probability of fresh EC detecting the quality of fresh produce are expressed as follows:
By substituting and into the profit function, we obtain the utility of farmers , EC , and fresh e-supply chain as follows:
where .
(3) Centralized decision method
We compare the situations with and without government intervention to discuss the quality decision behavior. Both cases are under the assumption that the agri-food enterprise is unaware of the exact information type of the farmer. EC only accepts high-level agri-foods and knows the probability of the farmer in providing qualified products 1 − . In this study, we consider another situation to maximize the total utility of the supply chain. To avoid the lying behavior of the agri-food producer (farmer), the agri-food enterprise applies certain constraints to achieve a satisfactory inspection probability. As a result, the regulation costs of the government can be saved. Hence, the government can transfer its regulatory function to the market serving functions. For example, if the farmers and EC supply quality agri-foods, then the government can allot additional funding and resources on the protection of consumer rights instead of the inspection of the quality of goods. The centralized decision method can be divided into three steps as follows:
- Step 1: The EC finds proper agri-food providers who are willing to build a relationship. The EC announces the buying price and inspection rules.
- Step 2: The farmer chooses to provide qualified agri-foods as required or mixes them with low-level products. The quality information of the agri-foods is also known.
- Step 3: The EC decides whether or not to inspect the agri-foods and to continue with the common selling procedures.
The three-stage game is then transformed into a nonlinear programming problem as follows:
Equation (17) shows that the farmer cannot gain by selling shoddy goods at the best-quality price. Equation (18) indicates that EC can benefit from the agri-food supply chain. As a result, Equation (17) is also an incentive-compatible constraint, and Equation (18) is the participation constraint of EC. According to the assumption above, the constraint in Equation (18) is disabled. To solve this programming problem, we construct the following Lagrange function:
where is the Lagrange multiplier. By using the Kuhn–Tucker theorem, we have
By substituting and into the expression of the utility of the agri-food supply chain, we obtain the following equation:
4. Results
4.1. Theoretical Derivation
After a detailed analysis of the probability of farmers’ supply of high-level agricultural products in the two models above, we compare the inspection probability of EC and the benefits of the bodies participating in the e-supply chain. The results are presented as follows:
As a result, we can obtain Proposition 1.
Proposition 1.
Under the condition that the quality information of fresh agricultural products is traceable in the e-supply chain, the detection probability of EC in product quality reduces instead of increases when the government intervenes in the e-supply chain of agri-foods and performs quality inspection. The maximum expected revenue of farmers remains unchanged, but the probability of their qualified product supply is improved.
In the analysis of the plus or minus of , if , then . Thus, we obtain Corollary 1.
Corollary 1.
Under normal circumstances, when the net sales profit of an agricultural EC (sales income minus the purchase price and cost of sales) is greater than the D-value between the revenues from the punishment on farmers and expenditures of the shortage cost, the government regulation on the quality of agricultural products can improve the level of the average utility of fresh EC. Conversely, it can reduce the utility of EC in the fresh-produce e-supply chain.
When other parameters remain the same, we can obtain the following formulas by analyzing the relationship among , , , , and :
Hence, we have Proposition 2.
Proposition 2.
Regardless of whether the government intervenes in the e-supply chain of fresh products, the inspection probability of the EC increases with the decrease in the consciousness of consumer rights protection. The supply probability of the high-level products of farmers is related to the unit fine that farmers pay for providing low-level agri-foods and the unit compensation that consumers obtain from the EC through rights protection. When , the consciousness of consumer rights protection increases with the increase in the supply probability of farmers’ high-level agri-foods. When , the situation is the opposite. Hence, the consciousness of consumer rights protection is negatively correlated with the willingness of farmers to supply high-level fresh produce. When , the willingness of farmers to supply qualified agricultural products has an indirect relationship with the legal rights of consumers in defending awareness. Moreover, the total utility of EC decreases after government intervention.
When other parameters remain the same, the relationship among , , and is defined as
Thus, we can obtain Proposition 3.
Proposition 3.
In the supply chain of fresh agricultural e-commerce, the probability that farmers supply high-level agricultural products increases with the increase in the regulation strength of the government. The inspection probability of EC in the agricultural products reduces with the increase in the detection probability of the government.
When other parameters remain the same, we can obtain the following formulas by analyzing the relationship among , , , , and :
Hence, we can obtain Proposition 4.
Proposition 4.
In the supply chain of agricultural e-commerce, the farmers’ supply probability of high-level agricultural products increases with an increase in per unit penalty for offering low-level agricultural foods. The inspection probability of EC in the agricultural products reduces with the increase in penalty. Therefore, if the cost of the farmers supplying inferior agri-foods is very large, then the farmers are likely to provide qualified products. If the motivation of farmers for providing high-level agricultural products is very strong, then the is EC unlikely to detect the agricultural foods supplied by the farmers. Thus, the inspection cost is saved.
In the expression of the probabilities of and , the behavior of farmers in providing shoddy agri-foods and the behavior of inspection of EC are both related to the defense of consumer rights awareness. By differentiating and , then
Thus, we can obtain Proposition 5.
Proposition 5.
Unlike the decentralized model wherein the correlation between theprobability and consumer rights awareness is related to the value of and , the probabilities of and are both negatively correlated with in this centralized model. Thus, the increase in the consumer rights awareness reduces the speculative behavior of farmers and the inspection frequency of EC.
Given that the form of Equation (22) is too complex to compare with the utility of the supply chain in the decentralized model, a detailed analysis is not performed in the closed form in this study. We instead analyze an example and observe the results through simulation.
4.2. Example Analysis and Simulation
We obtain the change in the farmers’ supply probability of qualified products with the complaint probability of consumers and the change in the detection probability of EC with the complaint probability of consumers. We also determine the change in the farmers’ supply probability of qualified products with the inspection probability of the government and the unit punishment on farmers due to the supply of unqualified products and the change in the detection probability of EC with the inspection probability of the government and the unit punishment on farmers. The probability of farmers supplying high-level products reflects the subjective intention of farmers to supply qualified fresh produce. The inspection probability of EC exhibits its quality supervision strength. The complaint probability demonstrates awareness of consumer rights protection. The random detection probability of the government illustrates the intensity of government regulation. Moreover, the unit penalty shows the speculative cost of farmers. Given the complexity of the expression of the utility function, directly performing a comparative analysis with an analytical process is difficult. Hence, a numerical simulation is carried out in this study.
According to the Chinese Sohu rolling news in 2011, Wang Peijiang (head of the JiangJiang Fruits in Urumqi) used a bag of apples with a diameter of 75 to 80 mm as an example. The wholesale price of Aksu apples purchased in the previous year was 6 yuan/kg. The cost of apples per kilogram was approximately 9 yuan after packaging, transport, grading, selection, and from inbound to outbound delivery. The retail price in the market was approximately 15 yuan/kg. At the same time, the cycle of bearing fruits of an apple tree is nearly five years. The most productive period of a tree is in the seventh year. Under normal circumstances, an acre of apple trees can bear three, one, and one tons of first-, second-, and third-grade fruits, respectively. The average cost per acre in yielding apples is approximately 3000 yuan. However, if unexpected weather conditions occur, then both the quality and the quantity of apples are affected. To increase income, the orchard man may sell the second-grade fruits at the top price. The wholesale price of the three types of apples in the report were 6, 5, and 3 yuan/kg, respectively. Therefore, we suppose that the market prices are and , and the selling cost is in the supply chain of fresh agri-foods. By ignoring the other factors, an estimation of the production cost of a regular household is . After mixing the low-level apples (such as adding secondary fruits with the first-class fruits), the production cost is reduced to . Assuming that the shortage cost of EC is (only the profit loss is considered), the inspection cost per unit product is .
(1) The change trends in the farmers’ supply probability of qualified agri-foods and EC’s inspection probability with the coefficient of the legal rights awareness of consumers without government intervention should be checked. In Figure 3, supposing that and , the probability of consumer rights awareness increases from 0 to 1 and is equally spaced at 0.1. Figure 3 shows that the probability of farmers supplying qualified products increases with the increase in consumer rights awareness. However, the probability of the inspection of EC on the quality of fresh produce provided by the farmers changes inversely. In the decentralized decision model, the probability of consumer rights protection is larger than 1. This finding indicates that the farmers definitely provide quality products. Moreover, the probability of EC detecting the product quality provided by farmers is also very small. When , the EC no longer needs to detect the quality of products. In the electronic supply chain of fresh produce with traceable information and given the parameters in the example above, the EC no longer inputs the costs for quality testing, and the quality of agri-foods is fully monitored by consumers. From this point of view, the decentralized decision model is better than its centralized counterpart even in the absence of government intervention.
(2) The changes in the utility of farmers and EC with the coefficient of the legal rights defense of consumers without government intervention should be checked. Two situations are discussed. Firstly, the compensation per unit product is n = 2 (the price difference between the second- and third-grade fruits) if the consumers find defective goods and defend their rights. Furthermore, the punishment per unit product for farmers is s = 1. For example, all the apples are processed as second-grade fruit. Secondly, when n = 1 (only treated as the secondary fruit) and s = 2 (processing the apples as fruits between the second- and third-grade fruits), the probability of consumer rights protection increases from 0 to 1 and is equally spaced at 0.1. Without loss of generality, we assume that the supply of agricultural products is 1 unit. Then, the maximum expected utility of farmers is 5. The changes in the expected utility of EC with the probability of consumer rights protection are shown in Figure 4. When , the consumers obtain additional benefits as a result of defending their rights. Furthermore, the expected utility of fresh EC increases with the increasing probability of consumer rights protection. When , the situation is the opposite. This phenomenon is mainly because the EC saved on the testing cost from the increase in consumer rights awareness.
(3) The effect of the probability of consumers defending their rights and the regulation strength of the government on the farmers’ supply probability of qualified products should be checked. The inspection probability of EC to fresh produce under government regulation should also be examined. Suppose the unit punishment of the government on the detection of unqualified products is m = 2. When the other parameters remain constant, the inspection probability of the government and the probability of consumer rights protection increase from 0 to 1 and are equally spaced at 0.01. The results are shown in Figure 5. When the probability of consumer rights protection remains the same, the probability of farmers supplying qualified products increases with the increasing probability of government detection. The inspection probability of fresh EC decreases with the increasing probability of government detection. When the probability of consumer rights protection and the detection probability of the government is within a certain range, the probability of farmers supplying qualified products is greater than 1, and the quality detection probability of EC is less than 0. This finding indicates that the farmers definitely provide qualified products. Moreover, the EC no longer needs to test the quality of products. The consideration of product quality and safety is a result that the entire fresh food industry expects to see.
(4) The change in the utilities of farmers and EC with the probability of consumers defending their rights and the government inspection probability under government regulation should be checked. We analyze the situation when and and the other parameters remain the same. The probabilities of government inspection and consumer rights protection increase from 0 to 1 and are equally spaced at 0.01. The expected utility of farmers is always 5. The utility of fresh EC is shown in Figure 6. The expected utility of EC increases with the increasing awareness of consumer rights protection and the strength of the quality testing of the government. The marginal rate of government detection is greater than that of the awareness of consumer rights protection.
Figure 7 shows the change in the utility of EC with the probability of consumers defending their rights or the government inspection probability under government regulation. We analyze the situation when n > s while the other parameters remain the same. Given that one of the two probabilities is 0.5, the other probability increases from 0 to 1 and is equally spaced at 0.01. The blue curve of the figure on the right is the blue line in the enlarged figure on the left.
(5) The effect of consumer rights consciousness and the governmental inspection probability on the total utility of the e-supply chain with and without government intervention is considered. Suppose the testing cost of the government is less than that of the enterprise and . The results are shown in Figure 8. The blue line in the figure represents the total utility of the supply chain without government intervention. The red lines represent the total utility levels (consumer utility is ignored) when government intervention is 0.1, 0.5, and 0.9. The diagram clearly shows that insufficient or excessive government intervention is detrimental to the improvement of e-supply chain utility. Therefore, government intervention in the e-supply chain of fresh produce should obtain sufficient degrees and effectively lead the development of the e-supply chain within a reasonable range.
5. Discussion
Through the analysis above, we firstly find a very interesting phenomenon wherein the government increases its regulation strength on the product quality of fresh EC. Decisions made by the EC involving their own profit maximization reduce the quality inspection probability on the products provided by farmers. In daily life, the increased government intervention in the market enhances the strictness of upstream control in the product quality of ECs to avoid or reduce punishment. Therefore, this article defines the phenomenon of decision-making behavior contrary to the ultimate goal as “experience deviation”. An in-depth analysis can easily find the deep cause of the problem. In the traditional mode of fresh agri-food supply, tracking the product quality information in corporations is difficult because of the diverse supply sources and lengthy logistics processes. When product quality problems occur, ECs have to shoulder the cost regardless of who is at fault. Establishing accountability and conducting upstream quality control of products can test the quality at the time of delivery in the supply chain of fresh agri-foods. However, under the condition of information traceability, the enterprise responsible for the quality problems can easily be found in any link of the fresh e-supply chain. The farmers are punished when they offer unqualified products in any part of the supply chain. As a result, farmers reduce the probability of supplying unqualified products due to the strengthening of downstream regulation. Furthermore, in agricultural ECs, the probability of farmers providing qualified products is increased with increasing government regulatory intervention. Thus, the quality testing function of ECs is partially replaced. From the perspective of utility maximization, the EC naturally reduces the quality inspection behavior while farmers maintain their product supply.
Secondly, the inspection probability of EC increases with decreasing awareness of consumer rights protection. Hence, the strong awareness of consumer rights protection reduces the probability of farmers in providing unqualified products. When the unit compensation that consumers obtain from the EC through rights protection is less than the unit fine that farmers pay for providing low-level agri-foods, the consciousness of consumer rights protection is negatively correlated with the willingness of farmers to supply high-level fresh produce. Thus, all the bodies participating in the e-supply chain suffer from the loss of profits due to the provision of inferior products. If the awareness of consumer rights protection can be improved, then the cost of management activities involving product quality in the e-supply chain is reduced, and the profit of society can generally increase at the same time. Notably, relevant laws and regulations are also needed to follow up and improve in a timely manner, as well as encourage the behavior of consumer rights protection.
Thirdly, the supply probability of the high-level agricultural products of farmers increases with the increase in per unit penalty for offering low-level agricultural foods. Moreover, the inspection probability of the EC of agricultural products decreases with increasing penalty. As a result, EC should increase the penalties for farmers that provide unqualified products. The high penalties for farmers providing unqualified products reduce the probability of supplying unqualified products.
6. Conclusions
Three basic decision models involving the decision-making behavior on the supply quality of agri-foods in the e-supply chain, namely, the decentralized decision model without government intervention, the decentralized decision model with government intervention, and the centralized decision model, were constructed using game theory. The results show that the decentralized model is better than the two other models from the perspective of quality protection in the e-supply chain with traceable information. According to the behavior of the bodies participating in the e-supply chain, some countermeasures are proposed to guarantee the supply quality of agricultural produce. Focusing on the decision behavior of the supply quality of agri-foods has practical significance in providing guidance for the bodies participating in the agricultural e-supply chain. Given that only some of the participants in the agricultural e-supply chain are risk neutral, future investigation can be conducted to consider the changes in the decision-making behavior of each body in the context of risk preference or aversion. Moreover, this study was based on game theory with only one kind of agri-food and homogeneous farmers and consumers. To validate the findings further, studies can be conducted using three types of agri-foods with heterogeneous farmers and consumers in the e-supply chain.
Author Contributions
X.J. and Y.G. conceptualized and designed the theoretical derivation; X.J. and D.P. performed the experiments and simulation. All authors have read and agreed to the published version of the manuscript.
Funding
This research was funded by the National Natural Science Foundation of China (71773104), the China Postdoctoral Science Foundation Project (2019M661960), and the Educational Science Foundation of the 13th Five-Year Plan of Jiangsu Province (C-b/2018/03/04).
Conflicts of Interest
The authors declare no conflicts of interest.
References
- Song, X. Five Strategic Thoughts on Digital Transformation of Traditional Enterprises. Total Corros. Control 2015, 29, 18–19. [Google Scholar]
- Ji, C.; Chen, Q.; Zhuo, N. Enhancing consumer trust in short food supply chains. J. Agribus. Dev. Emerg. Econ. 2019. [Google Scholar] [CrossRef]
- Fang, X. Why does agricultural product logistics “Smile in the middle, and cry in both heads”. Guide Chin. Poult. 2003, 18, 28. [Google Scholar]
- Renting, H.; Marsden, T.K.; Banks, J. Understanding alternative food networks: Exploring the role of short food supply chains in rural development. Environ. Plan. A 2003, 35, 393–411. [Google Scholar] [CrossRef] [Green Version]
- Shamsuzzoha, A.; Helo, P. Virtual supply chain–event handling and risks management in collaborative networks. Int. J. Adv. Logist. 2017, 6, 1–13. [Google Scholar] [CrossRef]
- Finnie, G.; Sun, Z. Negotiation, Trust, and Experience Management in E-Supply Chains. In Strategic Information Systems: Concepts, Methodologies, Tools, and Applications; Gordon Hunter, M., Ed.; IGI Global: Hershey, PA, USA, 2010; Volume 4, pp. 236–257. [Google Scholar]
- Lu, B.; Zeng, Q.; Fan, W. Examining macro-sources of institution-based trust in social commerce marketplaces: An empirical study. Electron. Commer. Res. Appl. 2016, 20, 116–131. [Google Scholar] [CrossRef]
- Zhu, X.L. E-commerce Product Quality Supervision Status and Improvement Measures. E Bus. J. 2020, 23, 29–30. [Google Scholar]
- Chen, J.B.; Zhang, J.; Xia, P.; Zhang, Y.; Sun, Q. Study on Farmer’s Psychological Contract, Organizational Commitment and Opportunistic Behavior under the “Farmer-supermarket Direct-purchase” model. Issues Agric. Econ. 2018, 38, 128–139. [Google Scholar]
- Van Der Vorst, J.G.; Tromp, S.O.; Zee DJ, V.D. Simulation Modelling for Food Supply Chain Redesign; Integrated Decision Making on Product Quality, Sustainability and Logistics. Int. J. Prod. Res. 2009, 47, 6611–6631. [Google Scholar] [CrossRef]
- Wang, J.; Chen, X. Fresh produce retailer’s optimal options contracts procurement decisions research with circulation wastage. Syst. Eng. Theory Pract. 2012, 32, 1408–1414. [Google Scholar]
- Cao, Y.; Li, Y.; Wan, G. Study on the Fresh Degree Incentive Mechanism of Fresh Agricultural Product Supply Chain Based on Consumer Utility. Chin. J. Manag. Sci. 2018, 26, 160–175. [Google Scholar]
- Dan, B.; Fu, H.Y.; Xu, G.Y. Agri-food supply chain coordination considering the impact of weather and effort level on output and quality. Syst. Eng. Theory Pract. 2013, 33, 2229–2239. [Google Scholar]
- Pu, X.-J.; Zhuge, R.-J. Bilateral efforts of supply chains considering supplier’s overconfidence and fairness. Comput. Integr. Manuf. Syst. 2014, 20, 1462–1471. [Google Scholar]
- Scuderi, A.; Sturiale, L. The Relationship between Product and Consumer Preference for Agri-Food Product: “Red orange of Sicily” Case. IERI Procedia 2014, 8, 52–59. [Google Scholar]
- Parajuli, R.; Thoma, G.; Matlock, M.D. Environmental sustainability of fruit and vegetable production supply chains in the face of climate change: A review. Sci. Total Environ. 2019, 650, 2863–2879. [Google Scholar] [CrossRef]
- Joan, C.; Denis, R.-D.; Jérôme, V. Why can collective action fail in Local Agri-food Systems? A social network analysis of cheese producers in Aculco, Mexico. Food Policy 2014, 46, 165–177. [Google Scholar]
- Mardle, S.; Metz, S. Impacts of current EU regulation on the UK whitefish value chain. Mar. Policy 2017, 84, 52–59. [Google Scholar] [CrossRef]
- Ding, H.; Fu, Y.; Zheng, L.; Yan, Z. Determinants of the competitive advantage of dairy supply chains: Evidence from the Chinese dairy industry. Int. J. Prod. Econ. 2019, 209, 360–373. [Google Scholar] [CrossRef]
- Pu, X.; Jin, D. The Operational Effciency Measurement of Agro-food Supply Chains: The Single “Farmer-Supemarket Direct Purchase” vs. Dual Channel. Chin. J. Manag. Sci. 2017, 25, 98–105. [Google Scholar]
- Lin, Q.; Ye, F. Coordination for “company + farmer” contract-farming supply chain under Nash negotiation model. Syst. Eng. Theory Pract. 2014, 34, 1769–1778. [Google Scholar]
- Hu, Q.; Xu, Q.; Xu, B. Introducing of online channel and management strategy for green agri-food supply chain based on pick-your-own operations. Int. J. Environ. Res. Public Health 2019, 16, 1990. [Google Scholar] [CrossRef] [PubMed] [Green Version]
- Siddh, M.M.; Soni, G.; Jain, R.; Sharma, M.K.; Yadav, V. Agri-fresh food supply chain quality (AFSCQ): A literature review. Ind. Manag. Data Syst. 2017, 117, 2015–2044. [Google Scholar] [CrossRef] [Green Version]
- He, L.; Zhao, J. Empirical analysis of the impact of government regulation on safe agri-foods production—A case study of vegetable farmers. J. Agro Tech. Econ. 2010, 7, 91–97. [Google Scholar]
- Chen, X.; Feng, J. Research on Agricultural Food Supply Chain Prediction and Control Based on Microbial Forecast. Can. Soc. Sci. 2010, 3, 42–50. [Google Scholar]
- Ravi, V. Selection of risk mitigation strategy in electronic supply chains using grey theory and digraph-matrix approaches. Int. J. Prod. Res. 2015, 53, 238–257. [Google Scholar]
- Booth, R.; Hernandez, M.; Baker, E.L.; Grajales, T.; Pribis, P. Food safety attitudes in college students: A structural equation modeling analysis of a conceptual model. Nutrients 2013, 5, 328–339. [Google Scholar] [CrossRef] [Green Version]
- Zhou, J.; Xing, J.; Yu, Y. Producer’s Behavior Research of Multiple Quality and Safety Certification in Agri-food Sectors. J. Zhejiang Univ. (Humanit. Soc. Sci.) 2015, 45, 55–67. [Google Scholar]
- Banaeian, N.; Mobli, H.; Fahimnia, B.; Nielsen, I.E.; Omid, M. Green Supplier Selection Using Fuzzy Group Decision Making Methods: A Case Study from the Agri-Food Industry. Comput. Oper. Res. 2018, 89, 337–347. [Google Scholar] [CrossRef]
- Wongprawmas, R.; Canavari, M. Consumers’ willingness-to-pay for food safety labels in an emerging market: The case of fresh produce in Thailand. Food Policy 2017, 69, 25–34. [Google Scholar] [CrossRef]
- Awan, U.; Andrzej, K.; Janne, H. Understanding influential factors on implementing social sustainability practices in Manufacturing Firms: An interpretive structural modelling (ISM) analysis. Procedia Manuf. 2018, 17, 1039–1048. [Google Scholar] [CrossRef]
- Fu, H.; Teo, K.L.; Li, Y.; Wang, L. Weather risk–reward contract for sustainable agri-food supply chain with loss-averse farmer. Sustainability 2018, 10, 4540. [Google Scholar] [CrossRef] [Green Version]
- Zheng, Q.; Ieromonachou, P.; Fan, T.; Zhou, L. Supply chain contracting coordination for fresh products with fresh-keeping effort. Ind. Manag. Data Syst. 2017, 117, 538–559. [Google Scholar] [CrossRef]
- Cui, L.; Guo, S.; Zhang, H. Coordinating a Green Agri-Food Supply Chain with Revenue-Sharing Contracts Considering Retailers’ Green Marketing Efforts. Sustainability 2020, 12, 1289. [Google Scholar] [CrossRef] [Green Version]
- Tang, C.S.; Sodhi, M.S.; Formentini, M. An analysis of partially-guaranteed-price contracts between farmersand agri-food companies. Eur. J. Oper. Res. 2016, 254, 1063–1073. [Google Scholar] [CrossRef] [Green Version]
- Lin, L.; Yang, S.-P.; Dan, B. Three-level Supply Chain Coordination of Fresh Agricul tural Products with Time Constraints. Chin. J. Manag. Sci. 2011, 19, 55–63. [Google Scholar]
- Lin, L.; Yang, S.-P.; Dan, B. Three-level supply chain coordination of fresh and live agricultural products by revenue-sharing contracts. J. Syst. Eng. 2010, 25, 484–490. [Google Scholar]
- Huang, H.-B.; Wu, G.-H. Brief introduction of aquatic product quality safety and supervision system of Jiangsu province. J. Food Saf. Qual. 2014, 5, 94–98. [Google Scholar]
- Bosona, T.G.; Gebresenbet, G. Cluster building and logistics network integration of local food supply chain. Biosyst. Eng. 2011, 108, 293–302. [Google Scholar] [CrossRef] [Green Version]
- Cui, J.; Wang, J.; Wang, Q.; Li, D. Study on Traceability Coding of Wheat Quality and Distributed Object Name Service. Sens. Lett. 2011, 9, 1088–1093. [Google Scholar] [CrossRef]
- Xu, J. Effective Supply Insurance of Chinese Fresh Agri-Products. Ph.D. Thesis, Jiangsu University, Zhenjiang, China, 2016. [Google Scholar]
Figure 1.
Flow diagram of fresh agri-foods in e-commerce without government intervention.
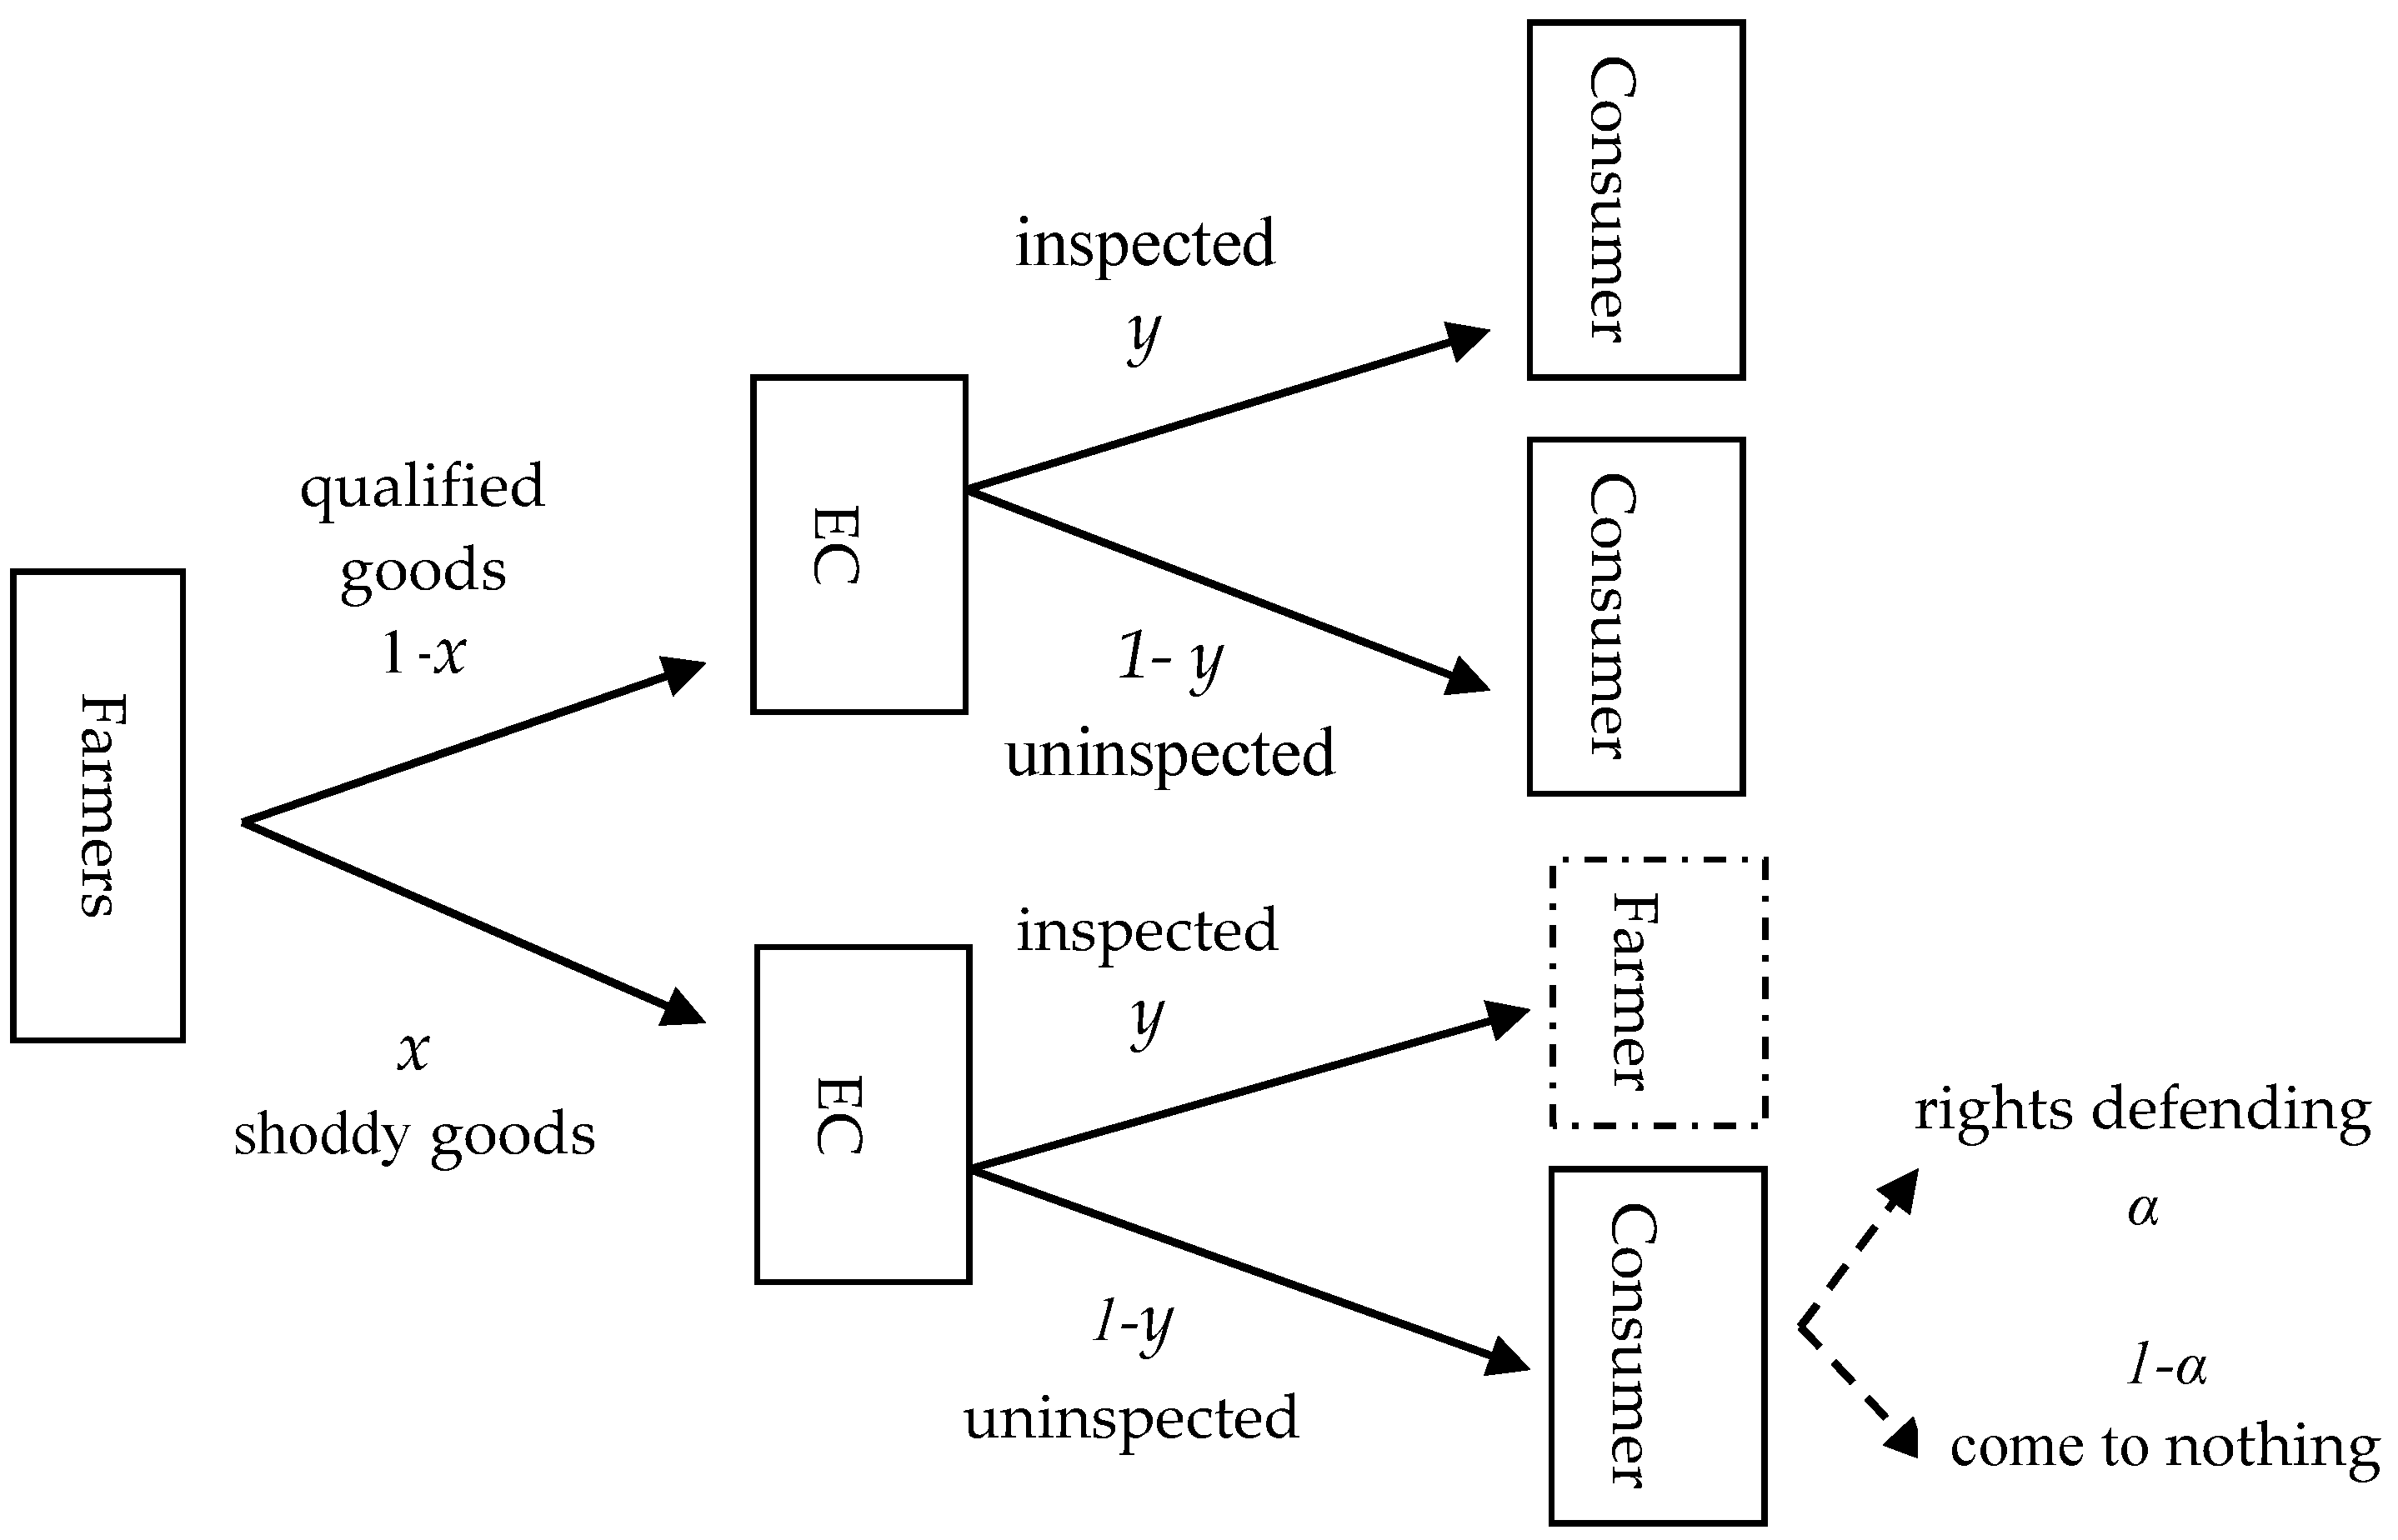
Figure 2.
Flow diagram of fresh agri-foods in e-commerce with government supervision.

Figure 3.
Change trends in (a) x*, (b) y*, and (c) xc*, and yc* with the probability of consumer rights awareness α.
Figure 3.
Change trends in (a) x*, (b) y*, and (c) xc*, and yc* with the probability of consumer rights awareness α.

Figure 4.
Change in the expected utility of EC with the probability of consumers defending their rights α under the decentralized decision model.
Figure 4.
Change in the expected utility of EC with the probability of consumers defending their rights α under the decentralized decision model.
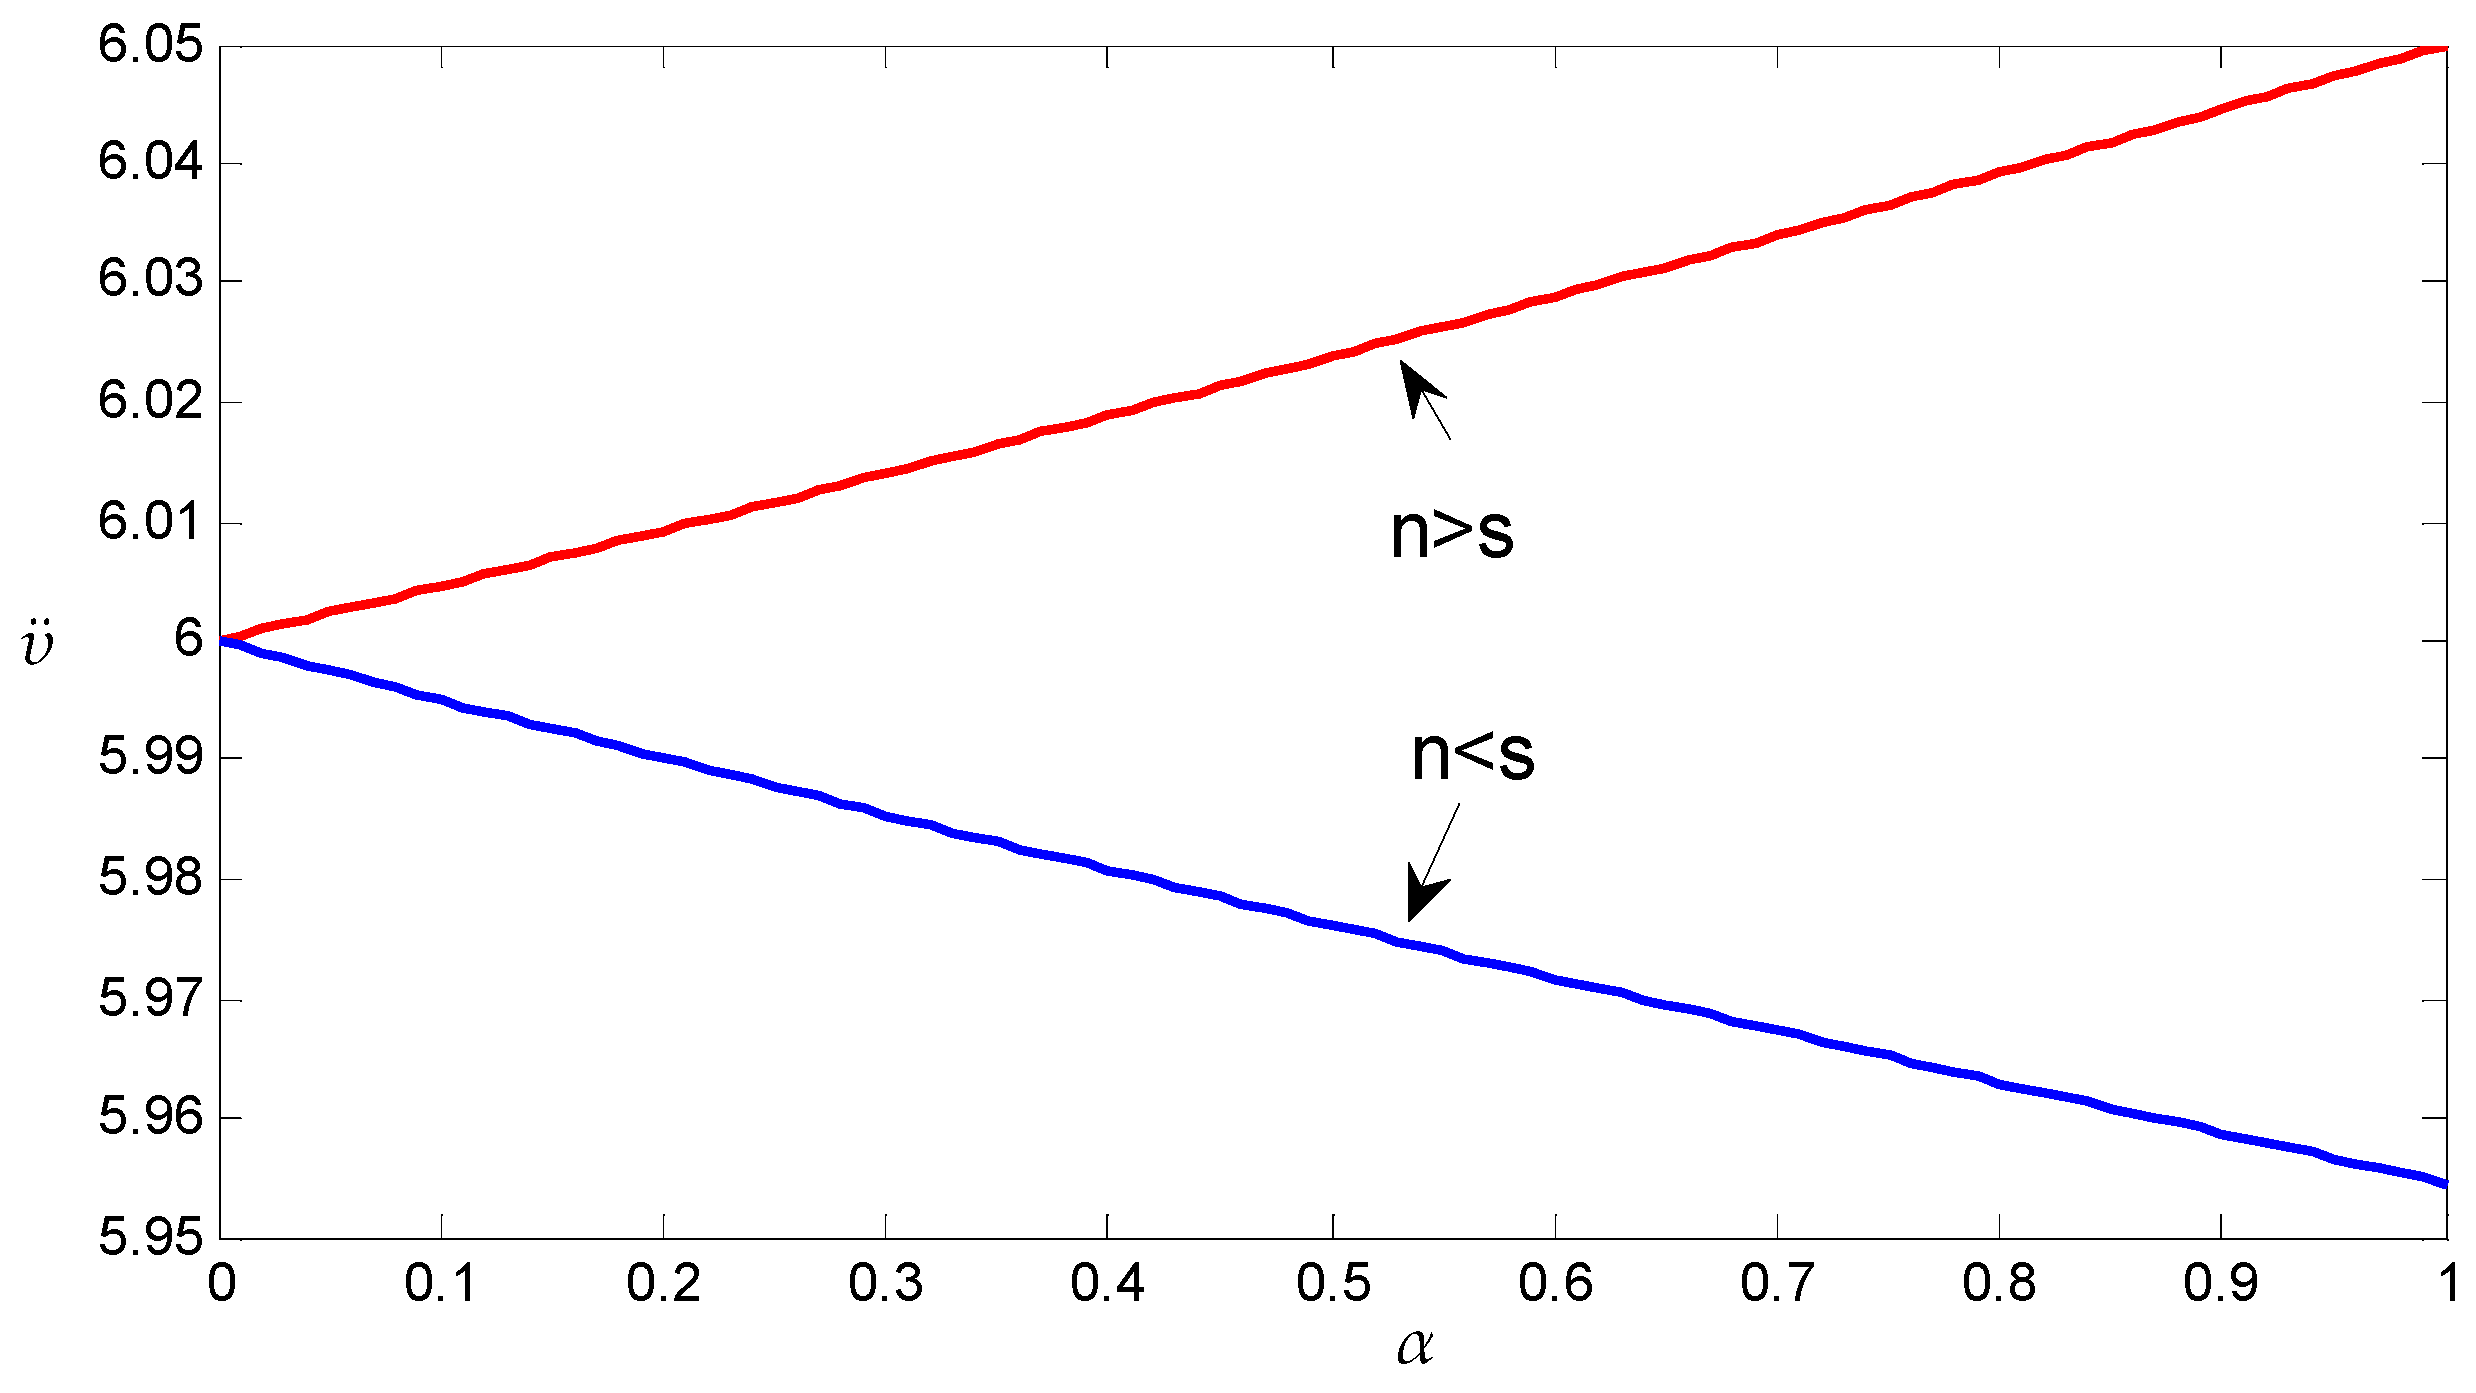
Figure 5.
Change in the probability of farmers supplying qualified products (a) x** and (b) the detection probability of EC y** with α and k.
Figure 5.
Change in the probability of farmers supplying qualified products (a) x** and (b) the detection probability of EC y** with α and k.
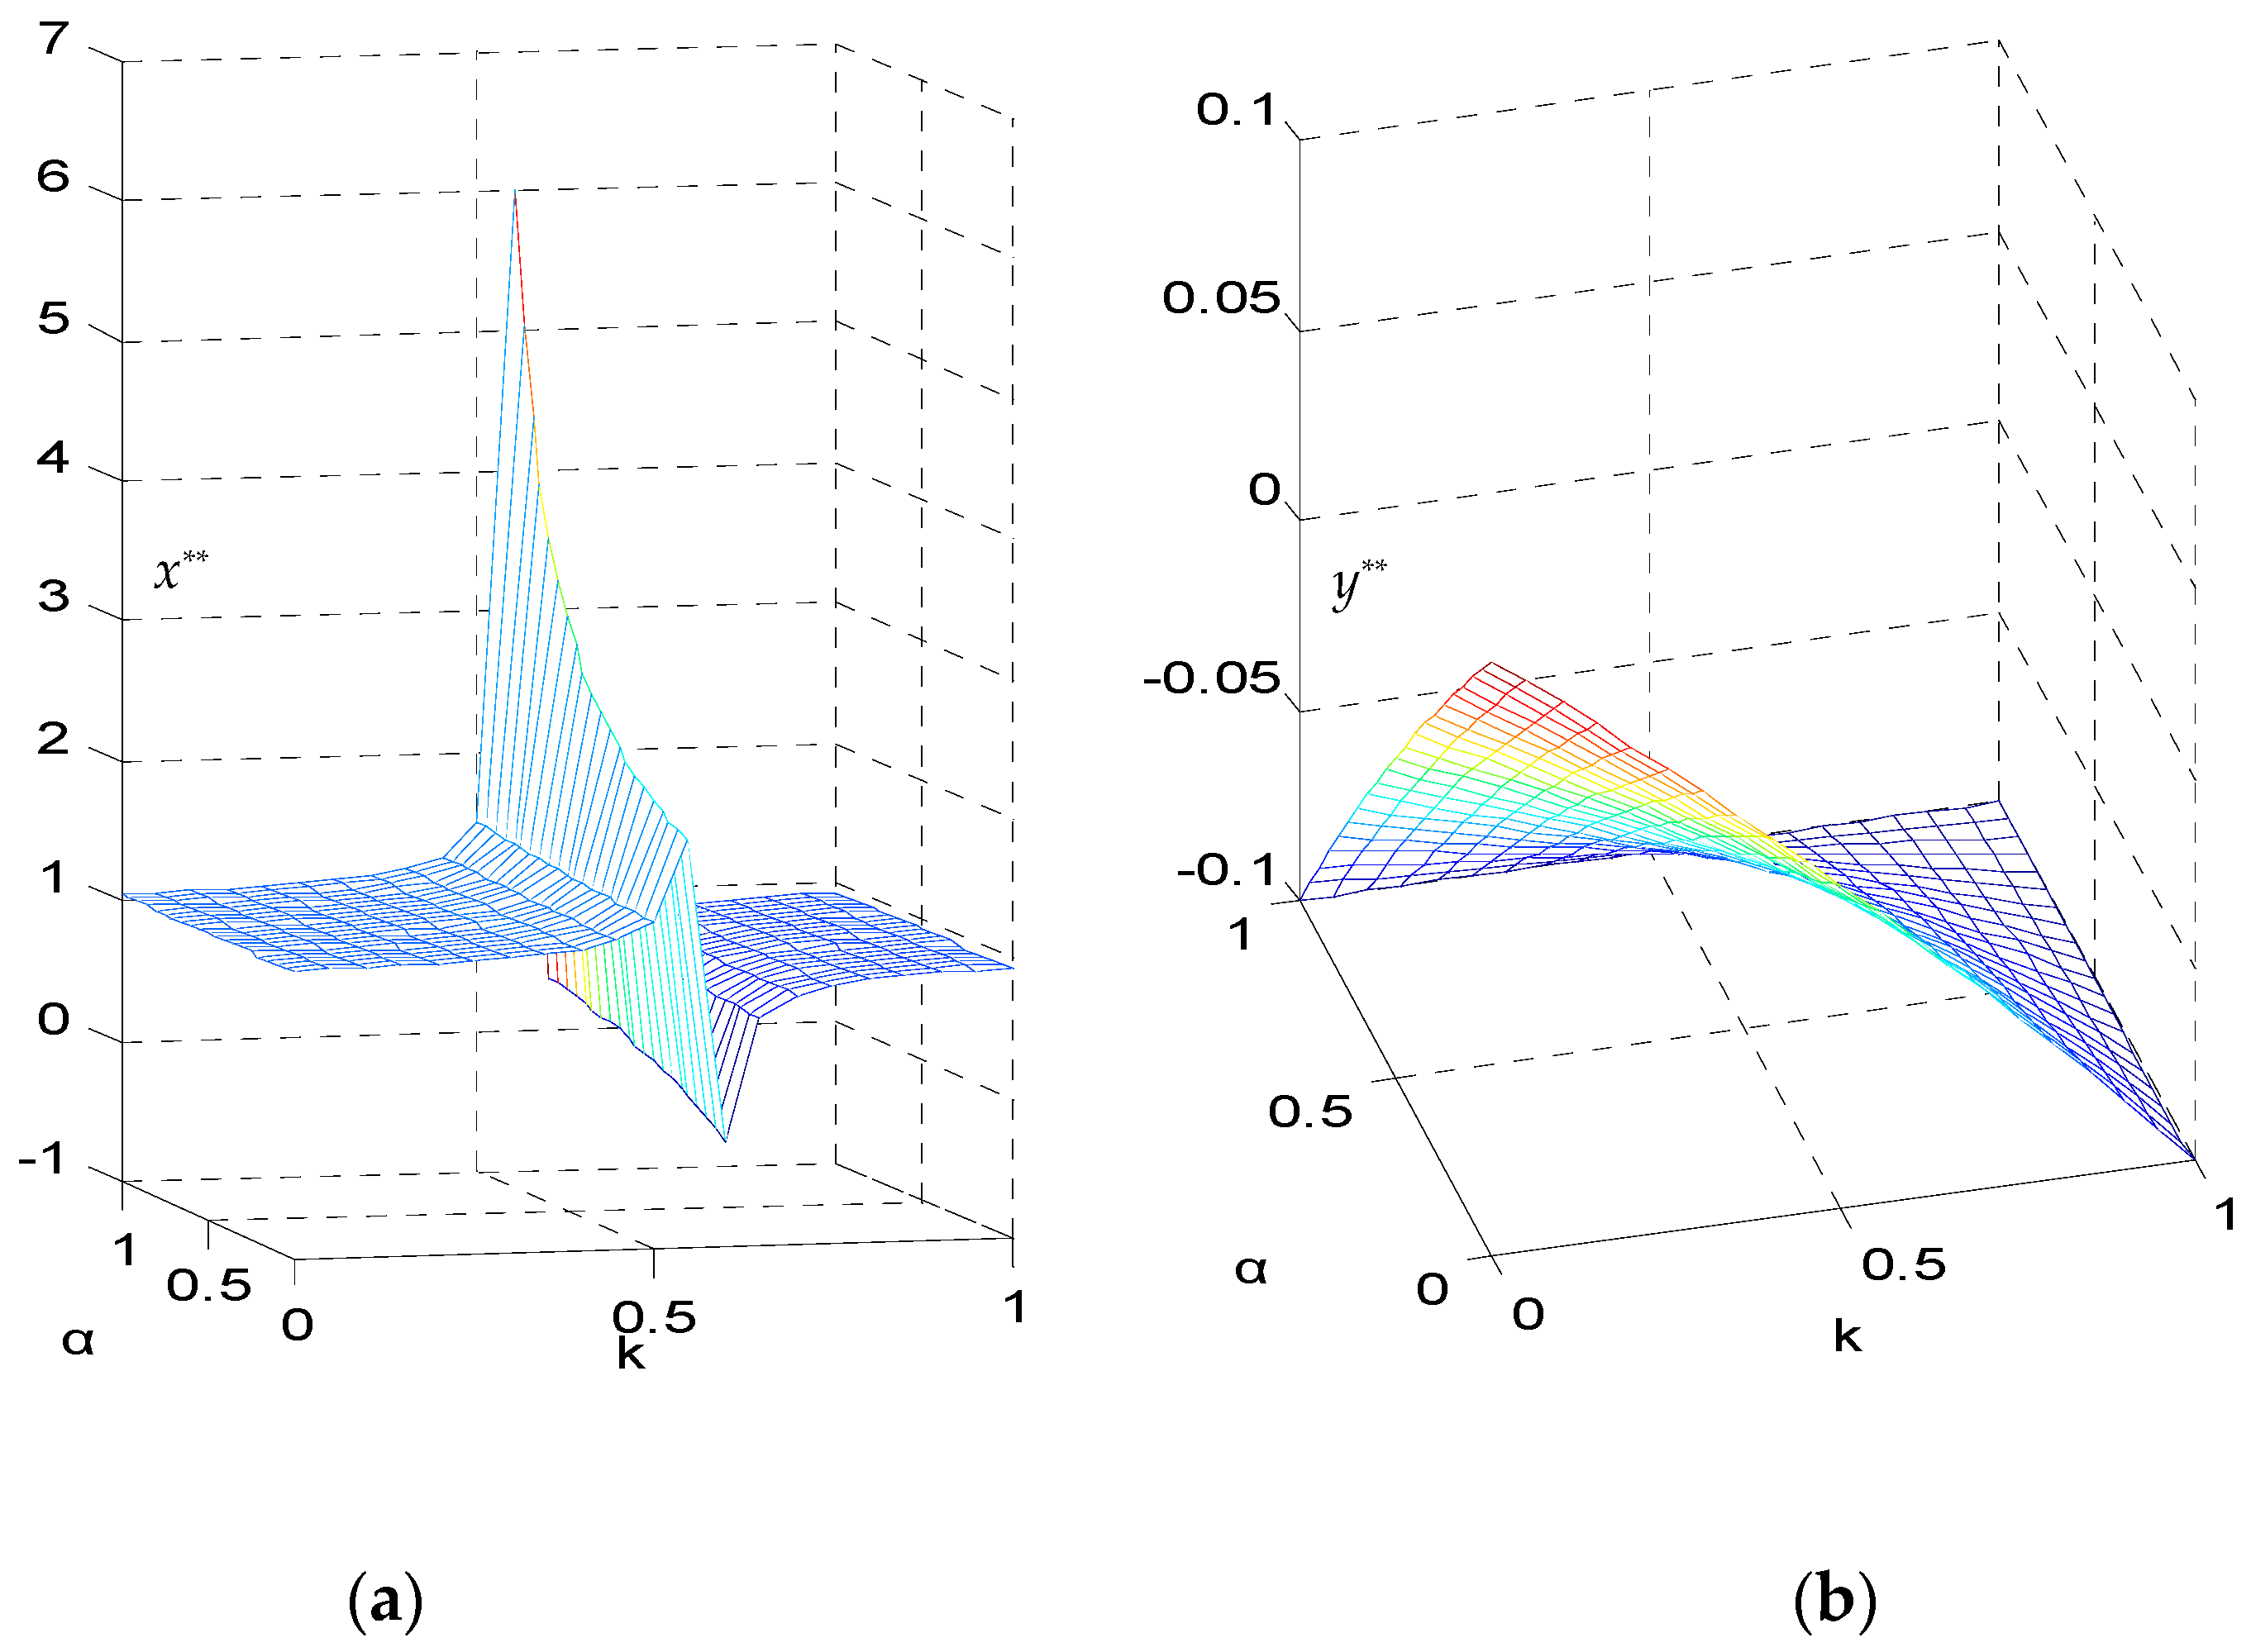
Figure 6.
Change in the expected utility of EC U1 with α and k under the decentralized decision model when (a) n > s and (b) n < s.
Figure 6.
Change in the expected utility of EC U1 with α and k under the decentralized decision model when (a) n > s and (b) n < s.

Figure 7.
Change in the expected utility of EC U1 with k (α) given that α = 0.5 (k = 0.5). (a) Change in U1 with k when α = 0.5 (red line) (b): Change in U1 with α when k = 0.5 (blue line). Note that this image is an enlarged version of the blue line in (a).
Figure 7.
Change in the expected utility of EC U1 with k (α) given that α = 0.5 (k = 0.5). (a) Change in U1 with k when α = 0.5 (red line) (b): Change in U1 with α when k = 0.5 (blue line). Note that this image is an enlarged version of the blue line in (a).

Figure 8.
Change in total utility of the e-supply chain with consumer rights consciousness α.


Table 1.
Decision behavior and government regulation in fresh agri-food e-supply chain. EC—e-commerce enterprise.
Table 1.
Decision behavior and government regulation in fresh agri-food e-supply chain. EC—e-commerce enterprise.
| Dimension | Participators | Decision Behavior |
|---|---|---|
| Production | Farmers | To provide quality and qualified fresh products |
| To provide inferior or substandard fresh products | ||
| Sales | EC | Quality detected |
| Quality inspected | ||
| Distribution | Logistics providers | High effort level |
| Low effort level | ||
| Consumption | Consumers | End up with nothing |
| Defend the rights |
Table 2.
Symbols in this article.
| Symbol | Implication |
|---|---|
| rp | Revenue of farmers in providing a unit product |
| Production cost of farmers in providing a unit product | |
| 1-x | Probability of adulteration in the qualified products |
| Unit production cost mixed with inferior products () | |
| y | Inspection probability of EC on agri-foods after receiving the products from farmers |
| Testing cost of each unit product for the EC | |
| Unit sales cost of the EC | |
| rs | Unit sales revenue of the EC |
| Unit shortage cost of out-of-stock products of the EC | |
| s | Fine per unit product deducted from the final payment by the EC (s < rp) |
| α | Probability of consumers in defending their legal rights |
| n | Compensation of per unit product given by EC to consumers |
| Q | Quantity of fresh agri-foods purchased by EC from farmers |
| Inspection cost of the government | |
| m | Fine per unit product imposed by the government on EC |
| k | Probability of government in inspecting the fresh produce |
© 2020 by the authors. Licensee MDPI, Basel, Switzerland. This article is an open access article distributed under the terms and conditions of the Creative Commons Attribution (CC BY) license (http://creativecommons.org/licenses/by/4.0/).
Share and Cite
MDPI and ACS Style
Jing, X.; Guanxin, Y.; Panqian, D. Quality Decision-Making Behavior of Bodies Participating in the Agri-Foods E-Supply Chain. Sustainability 2020, 12, 1874. https://doi.org/10.3390/su12051874
AMA Style
Jing X, Guanxin Y, Panqian D. Quality Decision-Making Behavior of Bodies Participating in the Agri-Foods E-Supply Chain. Sustainability. 2020; 12(5):1874. https://doi.org/10.3390/su12051874
Chicago/Turabian StyleJing, Xu, Yao Guanxin, and Dai Panqian. 2020. "Quality Decision-Making Behavior of Bodies Participating in the Agri-Foods E-Supply Chain" Sustainability 12, no. 5: 1874. https://doi.org/10.3390/su12051874
Note that from the first issue of 2016, this journal uses article numbers instead of page numbers. See further details here.