An Automobile Environment Detection System Based on Deep Neural Network and its Implementation Using IoT-Enabled In-Vehicle Air Quality Sensors

Seoul Business School, Seoul School of Integrated Sciences and Technologies (aSSIST), Seoul 03767, Korea
*
Author to whom correspondence should be addressed.
Sustainability 2020, 12(6), 2475; https://doi.org/10.3390/su12062475
Submission received: 30 December 2019
/
Revised: 5 March 2020
/
Accepted: 13 March 2020
/
Published: 21 March 2020
(This article belongs to the Special Issue Sustainable and Intelligent Transportation Systems)
Abstract
:This paper elucidates the development of a deep learning–based driver assistant that can prevent driving accidents arising from drowsiness. As a precursor to this assistant, the relationship between the sensation of sleep depravity among drivers during long journeys and CO2 concentrations in vehicles is established. Multimodal signals are collected by the assistant using five sensors that measure the levels of CO, CO2, and particulate matter (PM), as well as the temperature and humidity. These signals are then transmitted to a server via the Internet of Things, and a deep neural network utilizes this information to analyze the air quality in the vehicle. The deep network employs long short-term memory (LSTM), skip-generative adversarial network (GAN), and variational auto-encoder (VAE) models to build an air quality anomaly detection model. The deep learning models gather data via LSTM, while the semi-supervised deep learning models collect data via GANs and VAEs. The purpose of this assistant is to provide vehicle air quality information, such as PM alerts and sleep-deprived driving alerts, to drivers in real time and thereby prevent accidents.
1. Introduction
Sleep deprivation (drowsiness) and impaired cognition can cause traffic accidents [1], and the number of traffic accidents due to driver drowsiness and fatigue is increasing annually. According to the Korea Expressway Corporation, 180 out of the 942 highway traffic accident casualties that occurred from 2012 to 2017 were due to drowsy driving. Driver drowsiness is especially dangerous at high speeds, as losing consciousness even for 3 s at 100 km/h will cause the driver to skip approximately 100 m. Damage from public transport accidents is even more severe.
Driver drowsiness can be caused by conditions such as driver fatigue, lack of sleep, chronic fatigue, and an increased CO2 concentration in the vehicle. Fatigue and headaches during driving are caused not only because of health conditions but also owing to the air quality inside the vehicle, especially when driving for long periods. A major cause of driver drowsiness is lack of ventilation. Therefore, proper ventilation and fresh air recirculation should prevent drowsiness [2].
Previous studies have been focused on the development of sensors and algorithm-based technologies to recognize and process driver and environmental conditions. Although camera-based recognition determines driver drowsiness, its performance depends on the circumstances and its adoption is limited owing to high costs. Most driver state detection (DSD) technologies adopt methods based on cameras or other sensors, but these devices are difficult to install and may constrain the behavior of drivers. Most in-vehicle DSD systems are also less reliable than rule-based artificial intelligence (AI) systems [3]. Furthermore, as the detection accuracy depends on the in-vehicle environment, which varies continuously, the outputs of DSD systems are prone to uncertainty. Moreover, DSD equipment has limited applicability because the protocols vary depending on the manufacturer. Given their high cost, only the most expensive vehicles are equipped with advanced driver assist systems (ADASs); thus, such systems may be unaffordable for many consumers [4].
However, there are few published works focused on driver drowsiness/sleep deprivation and its relationship with air pollutants inside vehicles [5,6,7,8]. Consequently, in the context of the Internet of Things (IoT) and intelligent transportation systems, there has not been extensive research on intelligent sensors that can identify the air pollutants inside vehicles and perform DSD [9].
Moreover, no safety devices have been proposed that can perform active functions such as waking up drivers from drowsiness, which may be because systems that warn drivers of drowsiness and wake them up do not elicit effects similar to those of passengers (e.g., chatting with the driver) [10].
The rest of this paper is structured as follows. Section 2 describes the previous work in the field of ADASs and drowsy driving. Section 3 presents sensor data analysis using deep learning. Section 4 describes the prototype of the sensor and the experimental results. Section 5 presents the conclusions derived from this research and its limitations.
2. Background and Related Work
2.1. Trends in ADAS Research
The progress in autonomous driving technology is drawing considerable attention toward research on ADASs owing to their potential with regard to precision driver safety [7]. To prevent accidents, some governments and automakers of countries that promote autonomous driving are expediting the development and adoption of ADASs by mandating their integration. Functions for safe driving (e.g., forward collision warnings), which integrate driver monitoring systems (DMSs) [8] and ADASs, are essential for autonomous cars of Level 3 and above [9,10]. In autonomous driving, safety is not possible without these technologies.
Autonomous vehicles integrate intelligent sensors and information and communication technology with mechanical and traffic technologies to help drivers navigate safely using self-aware systems and judgment control. Furthermore, they utilize recognition technology for location and obstacle detection, judgment technology that determines the next course of action based on the detection, and control technology that quickly and precisely executes the appropriate action [2]. This approach is being developed further for the next generation of autonomous vehicles and will use in-vehicle sensor hardware integrated with deep learning. In addition, it is important to integrate the aforementioned functions seamlessly into a robust, unified system [11]. Moreover, DMSs have become crucial as it has become necessary to comply with standards such as those enforced by the New Car Assessment Programme (NCAP). Because of the integration of DMSs into automobiles as the primary safety features in the context of the European NCAP, the market for DMS is expected to grow rapidly owing to the widespread adoption of in-vehicle systems.
A DMS analyzes the facial expressions and biometric information of the driver to identify and monitor his or her condition. Infrared camera modules are installed on the steering wheel to track the eyes and face direction of the driver, enabling the system to warn the driver through the medium of sound upon detecting drowsiness or squinting. Pressure sensors and vibration actuators are embedded in the seatbelt and seat to monitor the breathing, heart rate, and pulse of the driver. These devices identify drowsiness and provide tactile warnings.
2.2. Predicting Driver Drowsiness
There are several techniques for predicting driver drowsiness. In psychophysiological approaches [12], electronic devices are attached to the skin of the driver to determine his or her condition from biological signals via various methods, including electroencephalography, electrocardiography, electrooculography, and electromyography. As drowsiness impairs muscle coordination, and consequently the ability to drive, a second approach involves analyzing vehicle operation information to infer the psychophysiological state of the driver. This approach involves analyzing steering wheel movement, driving speed, and degree of lane departure [12]. A third approach for DSD is based on visual information obtained by performing image processing on driver behavior [13]. Portions of the face of the driver are tracked and analyzed to detect signs of drowsiness, such as yawning in the mouth region and eye activity [14]. In relatively recent studies, vehicular operation and visual driver information have been utilized to perform DSD. The visual characteristics (from facial parts such as the eyes, and mouth), vehicle operation (to infer the physical characteristics of the driver), and vehicle measurements are analyzed to determine driver drowsiness or distraction level [2,15,16,17].
Representative DSD technologies include facial recognition, heartbeat detection, and lane departure detection. In facial recognition, in-vehicle near-infrared cameras are used to monitor the eye activity of the driver to detect driver fatigue, drowsiness, and poor physical conditions [10,18,19]. In this method, facial feature points such as muscles, expressions, and facial direction are extracted, converted into images, and subjected to pattern recognition. However, this approach requires further improvement. Technology that can identify and analyze the biosignals of the driver (e.g., pulse, heart rate, brain blood flow, brain waves, body temperature, sweat, and degree of body load) is emerging [12]. For instance, a slow heart rate may indicate drowsy driving, and the DSD system can alert the driver when the heart rate falls below a threshold.
Detection devices are being integrated with various equipment for supplementary tasks such as driver drowsiness and lane departure detection, primarily by automobile and component manufacturers. The development of a driver monitoring technology that captures, recognizes, and judges driver behavior efficiently through parameters such as steering wheel operation is also advancing [20,21,22,23,24]. When driving a vehicle, a driver performs basic operations such as adjusting the steering wheel, pushing the accelerator pedal, and checking the mirror. Under a reduced focus, the ability of the driver to perform these basic operations is compromised. In lane departure detection, active measures are utilized—for example, the generation of a strong vibration in the steering wheel when the vehicle departs from the lane or begins departure without the driver activating the turn signal. If the automobile travels on a lane for a certain period and crosses the left yellow line or if the steering wheel angle is outside the normal range, the system considers the driver to be drowsy and generates a warning. A built-in drowsiness prevention system activates the lane departure warning system along with the brakes as well as a complementary warning when the automobile is too close to the vehicle in front. This technology also includes a function to shorten the brake system deployment time automatically to avoid collisions. Under mild drowsiness, the system only provides voice assistance. However, if an extreme situation such as deep drowsiness or fainting is identified, the system not only provides voice assistance but also vibrates the seat to wake up the driver to prevent an accident. Likewise, when the vehicle departs from the lane, the pedal vibrates to warn the driver. In similar dangerous situations, the Pre-Safe seat belt tightens two or three times. Hence, the vehicle systems can actively intervene to reduce the risk of an accident [20].
2.3. Effect of CO2
Several studies have indicated that air quality is better inside vehicles than that outside. However, the California Air Resources Board reported that the amounts of hydrocarbons and CO2 within the vehicle are at least two to 10 times those outside the vehicle [21]. Furthermore, some areas, such as China and Hong Kong, are highly affected by particulate matter (PM). In the case of severe dust, it has been reported that in-vehicle air conditioning systems are not ventilated via external ventilation [8,16]. In particular, if the in-vehicle filter is not replaced at an appropriate time, the air quality is worse inside the vehicle than that outside it, because of the concentration of CO2 inside the vehicle. In this regard, the situation in Korea is similar to that in China and Hong Kong. Accordingly, in Korea, indoor air quality is regulated through the Indoor Air Quality Control Act. The contaminants to be managed are as follows: particulate matter (PM10 and PM2.5), carbon dioxide (CO2), formaldehyde, total airborne bacteria, carbon monoxide (CO), nitrogen dioxide (NO2), radon (Rn), volatile organic compounds (VOCs), asbestos, ozone, mold, benzene, toluene ethylbenzene, xylene, and styrene. The management standards are as follows. The concentrations of PM10, PM2.5, CO2, and CO should be less than 100 µg/m3, 50 µg/m3, 1,000 ppm, and 10 ppm, respectively, according to the standards. In accordance with Korean laws and standards, the criteria for toxic indoor pollutants and poor air quality were also specified in this study.
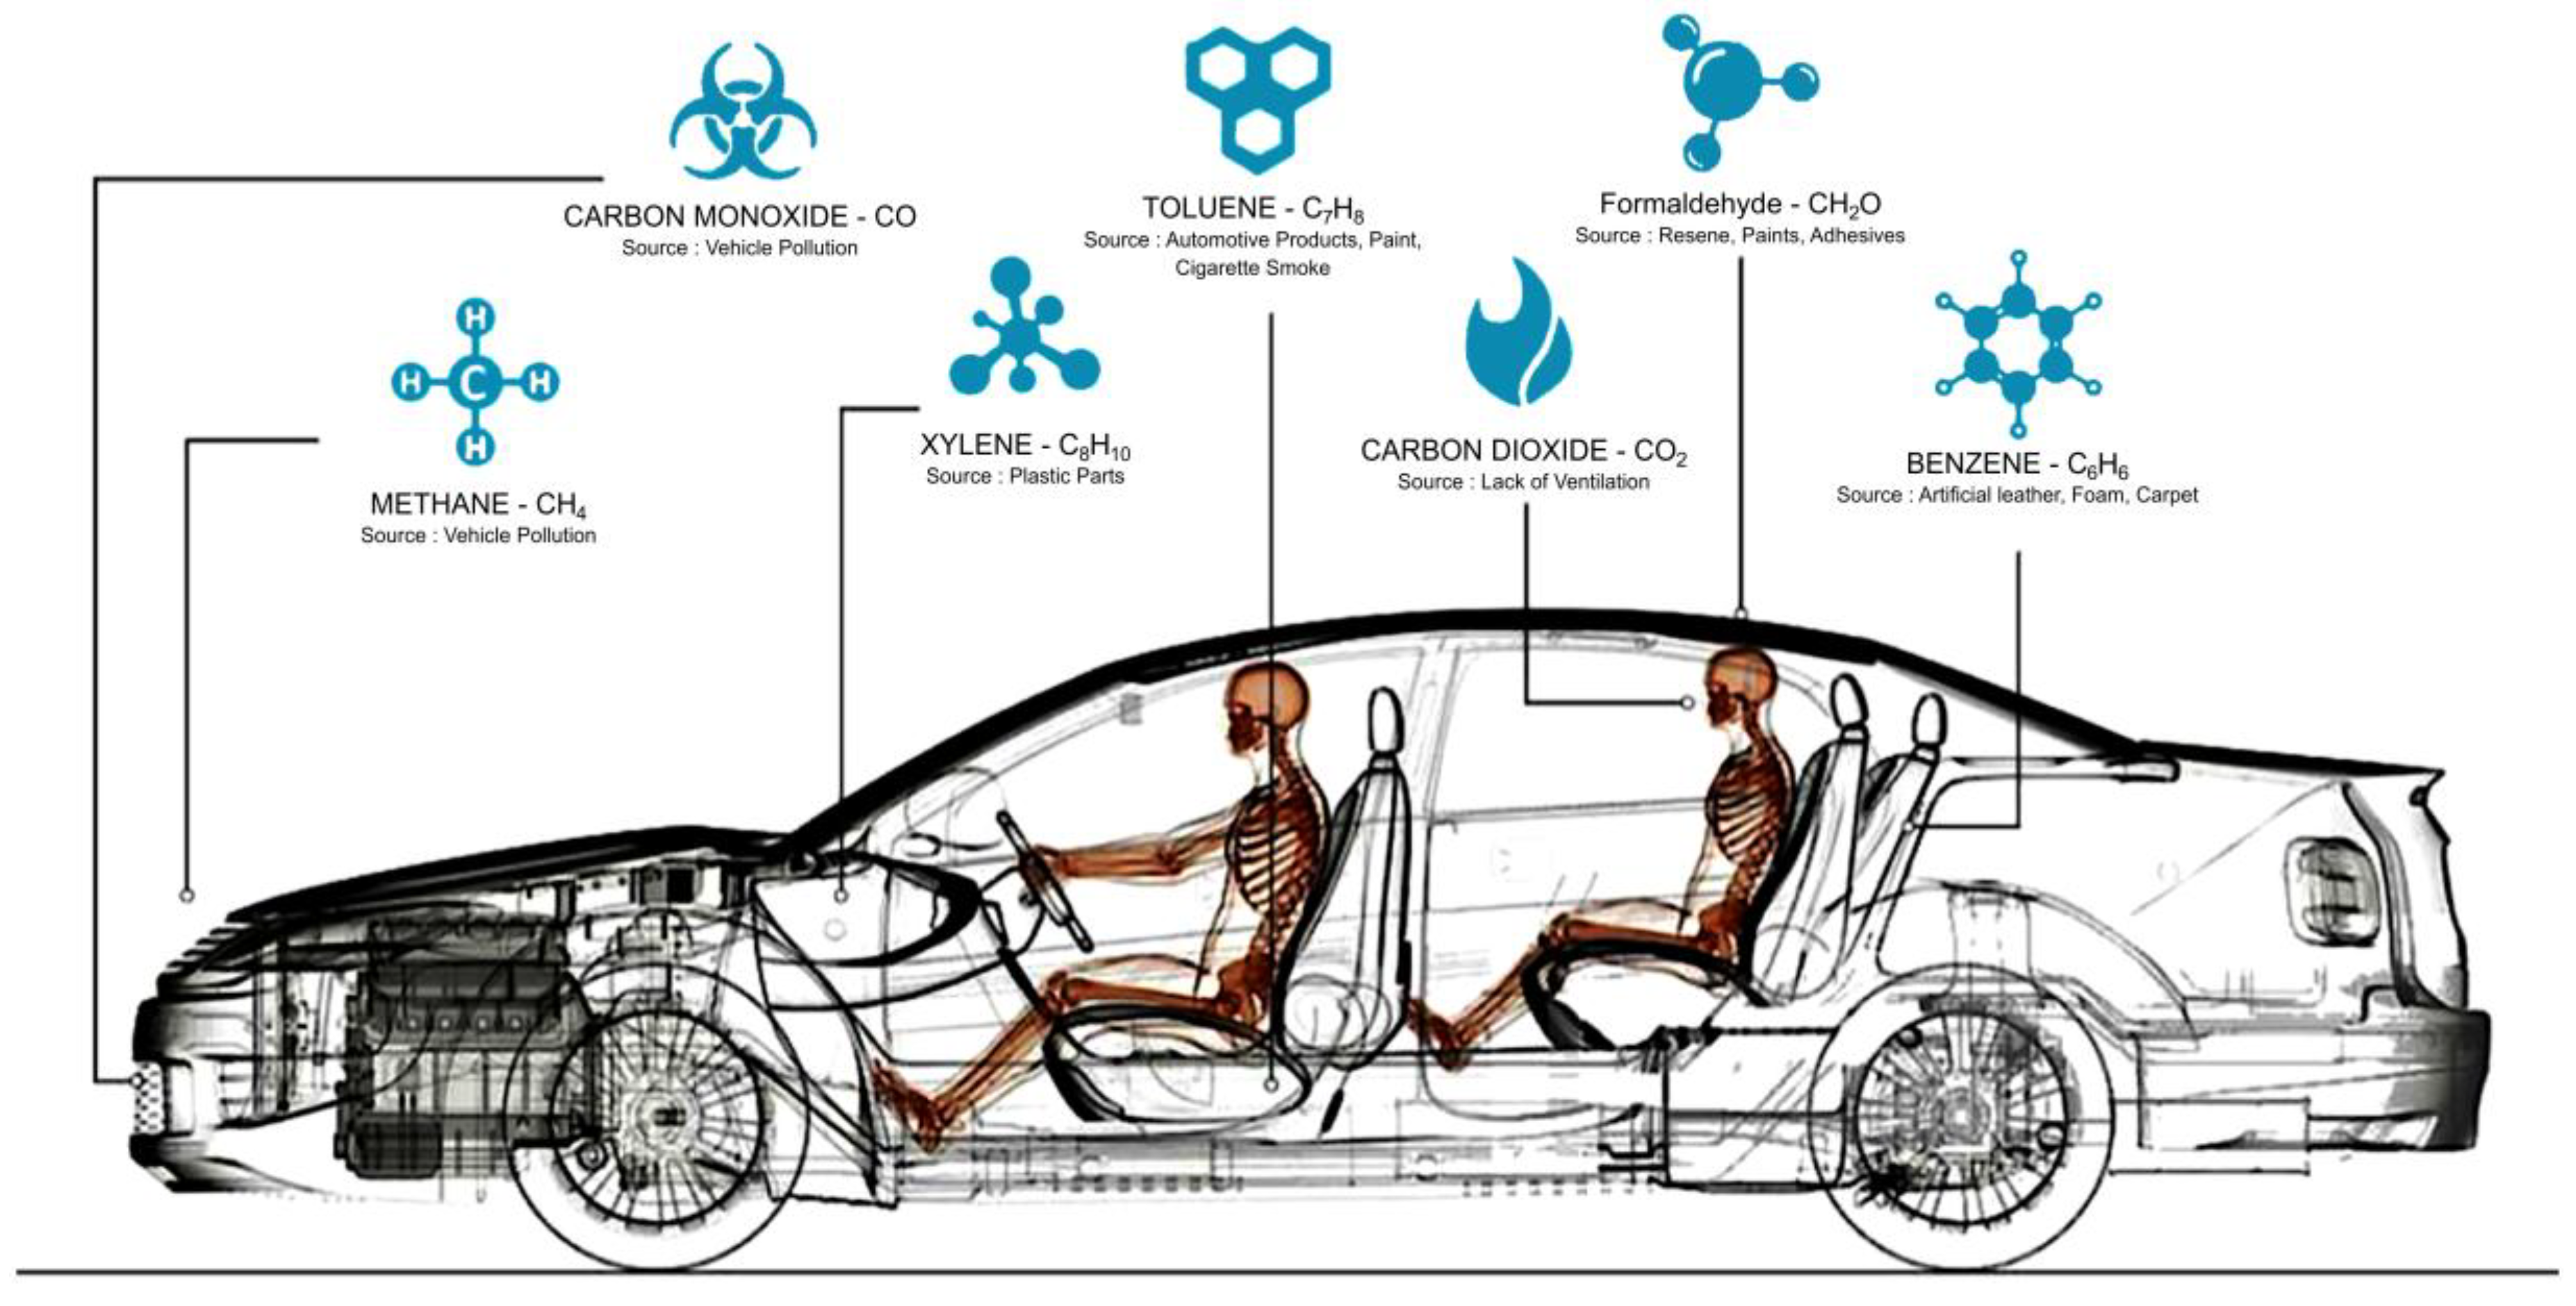
In addition, when the air filter is not replaced regularly or when the external concentration of PM is high during a certain period, which can be the case in Korea, the CO2 concentration in the vehicle increases rapidly when the internal circulation mode is utilized [8]. The factors affecting the air quality inside automobiles can be divided into internal pollutants, such as external air, exhaust fumes emitted from other vehicles, odors from factories and agricultural lands, and external pollutants, such as dust from tires and roads, CO2 from respiration, and VOCs produced by the interior components of the vehicle (Figure 1). In addition, new cars generally have extremely high formaldehyde contents. The concentrations of pollutants from vehicle exhausts are higher inside the vehicle than those outside.
It is difficult to lower the windows to ventilate the car while driving on urban streets. However, if the air conditioning system is used only in the internal circulation mode, CO2 from respiration will cause O2 depletion, causing fatigue and impaired muscle coordination and judgement, which is ultimately manifested as drowsiness. Medical journals and industrial safety studies have indicated that the level of CO2 affects sleepiness and fatigue, but more research is needed on the direct causal relationship between CO2 and sleepiness [25].
According to data published by the Korea Road Traffic Authority, when the occupancy of an express bus is 70%, the average CO2 concentration in the vehicle is 3422 ppm, with a maximum of 6765 ppm after 90 min of driving [25,26,27]. If the CO2 concentration exceeds 2000 ppm, the driver may experience a headache or drowsiness. A concentration exceeding 5000 ppm will drastically reduce the O2 level and cause brain injury. Concurring with these findings, in 2012, the American Association of Occupational Health published a study on drowsy driving that indicated that if the CO2 concentration in a confined space exceeds 2000 ppm, the occupants may experience headaches or drowsiness [12,13]. The potential health problems associated with high CO2 concentrations are listed in Table 1.
3. Deep Learning for Sensor Data Analysis
3.1. Air Quality Sensor (AQS)
If an automobile is driven for a long time, the amount of CO2 in its cabin will increase and O2 will be depleted owing to respiration. O2 depletion, in turn, causes fatigue and drowsy driving [20,27]. Hence, CO2 causes fatigue, reduces O2 levels, and impairs driver muscle coordination and judgement. Thus, to improve fatigue prevention techniques, an autonomous system to monitor air pollution in vehicles during journeys and to improve air quality is needed.
In recent years, various studies have been conducted to develop technologies for filtering harmful substances and odors, including general air pollutants, vehicle exhaust gases, and VOCs, from automobiles [1,25]. However, these filter systems have design limitations. High-end automobiles are equipped with air conditioners that monitor the CO2 level in the cabin, recirculate fresh air, and provide a warning when a certain CO2 level is exceeded. These air conditioners have been upgraded to regulate PM. When a high concentration of PM is detected in the vehicle, the air inside the vehicle is discharged, and fresh air is sucked in, filtered, and recirculated throughout the vehicle by the improved air conditioning system [28,29].
Such technologies are already under development. For example, compact integrated air quality sensors (AQSs) for monitoring indoor air pollution, PM2.5 concentration sensors, surface treatment technology for microbial habitat (mold) suppression, disinfectors in air conditioning system components (such as heat exchangers) and cluster ionizers for air purification, generator technology, cabin filter replacement notification devices, and integrated air conditioning systems, such as multi-function air cleaners, are being developed [12].
We developed an IoT-enabled vehicle AQS for measuring the concentrations of CO2, PM, and other pollutants. Furthermore, based on sensor measurements, we devised a DSD system for drowsy driving accident prevention [20].
For the AQS, we collected information from five types of sensors (CO, CO2, PM, temperature, and humidity sensors) with the performance specifications summarized in Table 2. The measured value depends on the operating temperature. We aimed to develop a system and service that can recognize and monitor various problems that may occur during vehicle operation, such as driver drowsiness due to CO2, hazardous in-vehicle PM levels, hazardous gas leakage, and fire hazards.
3.2. IoT Sensor Platform
In this research, we integrated an AQS with the IoT. The purpose of the IoT is to use connected technologies to develop a “smarter” environment, enabling lifestyle simplification by saving time, energy, and money. Through this technology, industries can reduce expenditures. The enormous investments and several studies conducted on the IoT have made it an increasing trend in recent years. The IoT involves a set of connected devices that can transfer data among themselves to optimize their performance. These actions occur automatically and without human awareness or input. The IoT sensor platform (Figure 2) includes four main components—1) sensors, 2) processing networks, 3) data analysis, and 4) system monitoring. Modern IoT-enabled sensor solutions analyze collected data, perform real-time analysis, and provide timely notifications of the sensor status based on measurements, to increase managerial and response efficiencies. Key technologies such as deep learning and distributed parallel processing are used to analyze patterns in the collected data and to detect anomalies in real time [5]. Pre-trained deep learning solutions can accurately monitor driver health and detect operational anomalies for all types of sensors. AI-based sensor solutions can reduce operational and managerial costs [16]. In fact, unnecessary support for system checks can be reduced using these solutions. Moreover, sensor data compensation technology can be used to improve the performance of low-cost sensors, reach a level of precision similar to those of expensive precision instruments, and reduce the initial investment, especially for large sensors.
3.3. Deep Learning–Based Sensors
The IoT and “smart cities” are generating substantial amounts of time-series sensor data for analysis. The importance of sensors has been further highlighted in smart mobility for autonomous vehicles, which have witnessed active research and development. Automotive original equipment manufacturers (OEMs), semiconductor firms, AI companies, and software startups have led to the rapid development of related technologies and platforms. Sensors are key components of automobiles, similar to their role in all products of highly interconnected technology-intensive industries. Research on AI, computer vision, and sensor networks is helping to reduce driver and pedestrian accidents in some countries, increasing the adoption of technology to enhance safety.
Extensive research is being conducted on deep learning to enable computers to determine optimal algorithms via artificial neural networks that resemble human neural networks using large volumes of data. Deep learning is a popular machine learning approach that has achieved significant progress in all traditional machine learning fields [23,30].
Deep learning techniques are becoming indispensable in autonomous driving, for tasks such as the recognition of people, cars, and lanes surrounding autonomous vehicles [24,31,32,33]. In fact, deep learning can handle the numerous variables in a driving environment that otherwise hinder the development of conventional algorithms. In the same vein, real-time, high-performance semantic segmentation based on deep learning for driving environment recognition has been developed successfully. For instance, SegNet is a system that visually monitors the status of the driver and identifies characteristics such as pupil status, eye blinking, and gaze via deep learning algorithms. Facial landmark information allows SegNet to analyze the head pose and gaze to identify the awareness level of the driver [30]. Moreover, deep learning has been used to process important in-vehicle sensor data. In contrast, the use of the sensors has recently increased in various fields, such as anomaly detection, whose principles can be applied to DSD [4,34,35]. In the following sections, we discuss three deep learning algorithms used in sensing systems for anomaly detection [36,37,38].
3.4. Deep Learning–Based Anomaly Detection
The identification of items or patterns in a dataset that do not conform to other items or an expected pattern is referred to as anomaly detection. These unexpected patterns may be called anomalies, outliers, novelties, exceptions, noise, surprises, or deviations [39]. Anomaly detection reveals unexpected patterns in the data. Further, it is widely used in various fields, including fraud detection, intrusion detection, safety critical systems, health monitoring, detecting illegal use of credit cards, detecting eco-system disturbances, and military surveillance [35,39]. Moreover, it can be used in preprocessing to remove outliers from datasets, which can significantly improve the performance of subsequent machine learning algorithms, especially in supervised learning tasks.
Studies on sensor networks constitute emerging research topics, and it is difficult to collect information without errors from wireless sensors. It is particularly important from a data analysis perspective because of its special features. Abnormal values in sensor network data indicate that the sensor has correctly identified an abnormal event or that there is a problem in the sensor [40,41]. Thus, sensor network anomaly detection involves both sensor malfunctions and intrusions [42]. The types of data collected by sensors vary widely and include binary, discrete, continuous, voice, and video data, which are continuously generated. Data may be noisy or missing, depending on the environment in which the sensor is installed. Sensor network anomaly detection has many challenges because it functions in real time.
Because sensors are installed in multiple locations, a distributed data mining approach is required for analysis. Noise and missing values must be distinguished from outliers. Anomaly detection has also been studied using in situ data with respect to time. The problem of abnormality detection in time-series data is as follows. Time-series data follow a continuous series of data points in a temporal order, and a specific point in time is highly affected by the preceding and following values. In general, the analysis is conducted by selecting an appropriate time window. This window is classified according to whether the objective of the analysis is to find an abnormal point in the time data or an abnormal pattern of change [37].
The label indicates whether or not the data entity is abnormal. The use of the training material to label inaccuracies (i.e., to perform classification) incurs a tremendous computational effort and cost. It is substantially difficult to classify all possible types of anomalies. If an abnormality has appeared rarely or if a new type of abnormality has emerged, it is difficult obtain a classified data entity. Therefore, it is necessary to deal with unlabeled data.
There are many challenges in the task of anomaly detection that distinguish it from a binary classification task. For example, because anomalous systems exhibit considerably more diverse behaviors than a normal system and are rare by nature, anomalous data are often severely underrepresented in training sets [39,43].
There are three broad categories of anomaly detection techniques, based on the extent to which labeled data are available: supervised, semi-supervised, and unsupervised.
In supervised anomaly detection, a binary (abnormal and normal) labeled dataset is given; then, a binary classifier is trained using this data. This approach should address the unbalanced dataset problem resulting from the existence of few data points with abnormal labels. Semi-supervised anomaly detection techniques require a training set that contains only normal data points. Anomalies are detected by building the normal behavior model of the system, then testing the likelihood of generation of the test data point by using the learned model. Unsupervised anomaly detection techniques deal with unlabeled datasets by making the implicit assumption that most data points are normal [39,44].
Supervised anomaly detection is used when label information is available for all entities in the learning material or a classification model is learned to determine anomalies; this is the most common approach. Generally, the data are in an imbalanced state in which the abnormality rate is negligible compared to the normal rate [45,46].
Semi-supervised anomaly detection is used when label information is only available for the learning subjects and the normality/abnormality status is not known for materials without label information. Generally, the model is trained using only normal data and is then applied to the test data [47].
Unsupervised anomaly detection is the most widely used anomaly detection method for unlabeled data. In this method, outlier detection is mainly based on the distance between the entities in the data. In general, it is assumed that the ratio of the normal data is overwhelmingly large. If this assumption is wrong, problems such as high false alarm rates occur [45,46,47,48].
When a labeled dataset can be generated by relating historical data and sensor data over time (i.e., when the data samples from sensors are labeled as normal or abnormal states), representative patterns in the measured values can be determined. In fact, labeled data and deep learning models enable computers to learn patterns from sensor measurements by supervised learning. Thus, supervised learning cannot be used in the initial stage (for example, when a sensor is first installed or when no historical data are available). In these cases, unsupervised learning is adopted to monitor the sensor state as it does not require labeled data. In unsupervised learning, anomalies such as sensor failures can be determined directly from measurements without relying on historical data. The deep learning model can be enhanced later with labeled data for more systematic processing of sensor measurements. In general, unsupervised anomaly detection algorithms provide similarity scores between measurements and normal data to indicate anomalies based on a threshold [49,50].
Unsupervised learning facilitates the detection of abnormal patterns from periodic data, as most sensors exhibit periodic measurement behaviors. Then, by using a generative model, it is possible to input a periodic pattern and to generate synthetic data for one cycle in the form of a probability distribution. The generative adversarial network (GAN) and variational auto-encoder (VAE) are common generative models for synthesizing sensor data from a given process [37,51].
3.4.1. Long Short-Term Memory (LSTM) Model
To prevent the loss of historic data and to leverage such data, long shot-term memory (LSTM) has been used extensively owing to its promising results [52,53]. Instead of simply accumulating historical information, LSTM introduces cell states and gate structures to select and deliver important information. The cell state contains the information obtained in the previous step. Rather than simply passing on this information to the next step, the forget and input gates determine the amount of information that will be discarded and the amount of new input data that will be reflected to update the cell state.
LSTM networks have been proven to be well suited for dealing with and predicting important events with long intervals and delays in a time series. LTSM networks can maintain long-term memory. In an LTSM network, a stacked LSTM hidden layer makes it possible to learn a high-level temporal feature without any fine tuning or preprocessing, which is otherwise required by other techniques [43].
Data collected from a sensor is learned via LSTM to train the model. This trained model is then used to estimate the sensor measurement values in real time. LSTM is a deep learning model suitable for modeling time-series data such as sensor measurements. To predict the value at time t, the structure uses data from instants (t − n), (t − n + 1), …, (t − 1), for some n, as input. LSTM can model the autocorrelation of the time-series data without requiring the assumption of stationarity and learn the temporal patterns of time-series data [48,54].
Xie et al. [39] trained a LSTM model with data collected by a sensor and used the trained model to estimate the sensor measurements in real time. In the case of a steady-state sensor, there is little difference in the residual errors between the values estimated by the LSTM model and the actual measured values. This residual error can be used to detect points of frequent anomalies. Experiments with actual IoT sensor data have indicated that abnormality detection using LSTM mainly detects the sudden change of a value efficiently [38].
3.4.2. Skip-GANs and VAEs
These are methods of detecting abnormal patterns from a periodic pattern. A majority of sensor data have periodic change patterns in which similar patterns recur at regular intervals. Using a generative model, it is possible to learn the process of generating data for one cycle in the form of a probability distribution by inputting a continuously changing pattern.
The skip-GAN and VAE are representative generative models and can learn new patterns from similar patterns by learning the patterns of input data [55]. Both models train common sensor data patterns to artificially generate sensor data with similar patterns. The data generated by the generative model is similar to the actual measured values in the case of a steady-state sensor but different in the case of an abnormal state [54,56].
The difference between the pattern of the changes in the measured values and that generated by the generative model is quantified by using an anomaly score, where the greater the likelihood of the anomaly, the higher is the anomaly score [55,56].
To demonstrate the significance of skip-GANs, we provide the example of Schlegl et al. [46,56]. They proposed an algorithm for detecting diseases from medical images using a GAN. This algorithm was largely composed of learning and reasoning stages. In the learning stage, the GAN model was trained with the image of a healthy subject. In the inference step, when a new image was input, the GAN model generated an artificial image highly similar to the input image. As the GAN was trained only with normal data, the artificial image generated was assumed to be a normal image of a subject without the disease, and the anomaly score was calculated by comparing the normal image and the input image.
In another report, Xu et al. [54] proposed an anomaly detection algorithm using a VAE to monitor indicators such as the number of users of web applications and to implement appropriate measures when abnormal events occurred. In unsupervised learning methods, it is very important that the model does not overfit the specific image and that the normal pattern is well learned. To prevent these values from contributing to the loss function, Xu et al. [54] added a random missing value to the input data and used a modified loss function.
For a sensor under normal operation, data synthesized by the generative model are approximately equal to the measured data. When an anomaly occurs, however, the sensor measurements exhibit varying patterns. Hence, the difference between the synthetic and measured patterns can be used as the anomaly score, where higher values indicate a greater likelihood of an anomaly, providing an intuitive means of inferring the system status [57].
4. Experimentation, Prototyping, and Analysis of Results
4.1. Input Data Configuration
The data collection period was selected from August 1, 2019 to September 30, 2019. Sensors were sequentially installed in 95 vehicles from SoCar, which is a car sharing platform in South Korea. The data were measured every 2 s when the customer boarded and operated the vehicle; these data were sent to the SK Planet Cloud Server. Through this process, 79 million data points were collected from the sensor. Each sensor data point collected from a vehicle of various sizes contains all the AQ parameters. During the data collection period, 95 sensors (Figure 3) were installed in the vehicles chosen for the analysis (i.e., 30 sensors in the Carnival model of large vehicles, 32 sensors in the Avante (medium), and 33 sensors in the Morning (small)).
The learning data set was selected by referring to the PM data distribution and the ultra-PM reference value was provided by Korea Environment Corporation (KEPC). We excluded some abnormal data during pre-processing, namely those with PM2.5 > 75 µg/m3 according to the enacting environmental authority (KEPC) and with temperatures greater than 50 °C. The data with the abovementioned conditions were excluded from the learning data set due to the effects of external air quality—that is, when PM2.5 < 75 µg/m3, there is no influence of the external air quality on all the AQ parameters measured inside the vehicle. Figure 4 shows an example of the signals received from the AQS installed in the vehicle. We employed basic sensors and monitored the data in real time. The deep learning model was used to detect sensor measurements with anomalous readings, to notify the user. A function for correcting errors in the data was also included, enabling reliable data acquisition at low cost.
When analyzing air quality data collected by the sensors in a vehicle during a test drive for the experiment, a typical case of abnormal detection is the smoking of a cigarette in the vehicle. Therefore, if abnormal changes in PM values were recognized, the data were intensively analyzed and applied to the model from approximately 90 s after the change in PM value.
The data were manually labeled using anomaly criteria and analyzed to address the data imbalance caused by random oversampling. Subsequently, the deep neural network was trained to identify normal or abnormal conditions from the sensor data. As the input data represent a time series, LSTM was set as the basic structure, and the input data were composited for improved computational speed and optimized to maximize the detection performance.
4.2. Results of Deep Learning Model
We applied the DSD system to actual IoT sensor data to develop a deep learning model that could accurately determine the sensor state by learning the changes in the patterns. The VAE structure provided a smaller network capacity under the same conditions. However, their detection performance was almost identical, demonstrating the successful conversion of the DSD into a lightweight structure.
The experimental results demonstrated the anomaly detection performance of the proposed algorithm, which was better than the performances of existing techniques. To verify the anomaly detection performance of each deep learning model, the predicted values obtained from the developed model were reconstructed in a manner similar to the actual value based on the PM2.5 of normal and abnormal data. In Figure 5, Figure 6 and Figure 7, the blue and red lines represent the predicted and actual values, respectively.
The LSTM was trained to overfit the normal data. The LSTM model used by the deep learning model had higher sensitivity to PM and was reconfigured to a low value to reconstruct the abnormal data. Thus, the model was designed to have high sensitivity to small changes in the PM data, which resulted in more detections than would be possible with the existing models (Figure 5).
The VAE model was reconfigured to follow the trend of PM value changes and was sensitive at high PM values. This model was reconfigured to follow the trend of PM value changes, and the detection was effective for higher PM concentrations (Figure 6).
The skip-GAN exhibited superior detection performance compared to the existing models at the point at which the PM value started to increase (Figure 7). The skip-GAN could detect abnormalities more effectively than the other models when the air quality exhibited high PM concentrations.
5. Conclusions
Currently, high-performance ADAS products are being developed and commercialized. This has led to a significant reduction in their prices, and the detection accuracy is constantly being improved. In line with this development, the proposed DSD system is a low-cost, basic product that can easily be installed in vehicles. To prevent fatigue-related accidents, the system informs the driver and passengers of the CO2 levels, monitors the CO and CO2 concentrations, and predicts the drowsiness state of the driver.
The DSD system measures and monitors in-vehicle air quality (through factors such as CO2 concentration) using relevant sensors. It uses the data acquired from these sensors to monitor the interior environment in real time to detect the state of the driver and to help prevent accidents. The development of an ADAS standard and products satisfying the safety needs of customers is necessary for the advancement of technologies preventing driver drowsiness. Furthermore, data regarding the psychophysiological changes of drivers that affect long-term driving can be used to draft policies for road accident prevention, after the commercialization of this technology. The various behavioral factors influencing driving identified by the proposed system can be used to devise specific services and human–computer interface principles to enhance future autonomous vehicles. These developments will help OEMs prioritize marketing decisions for selecting key services and ADAS functionality.
We developed a DSD system based on a deep neural network and IoT-enabled in-vehicle AQS to prevent or minimize the risk of accidents related to driver drowsiness or sleep deprivation. We also analyzed the development trends of technology for facilitating DSD in the context of ADASs. The application of driver drowsiness prevention devices in various fields was studied. It was found that their adoption is limited by issues such as high cost and low detection accuracy. We manufactured a low-cost sensor with basic specifications, integrated it with a deep learning model, and proved its greater effectiveness in detecting abnormalities in the interior environment of a vehicle, as compared to existing methods.
5.1. Managerial Implications
Korea is enacting and implementing “Environmental Air Quality Management Standards for Newly Made Vehicles,” which has the objective of minimizing the damage caused to drivers and passengers due to harmful compounds generated by the interior materials of new cars. Related organizations and automobile companies are undertaking significant measures to optimize the selection of materials used for the interior parts of automobiles and to analyze harmful compounds.
For example, AQSs improve the performance of existing air conditioning filters and involve the application of a new type of air purifier. They use new electronic sensors to detect harmful gases, especially NOx and CO, as well as PM, and provide an effective means of eliminating odors and reducing the influx of PM in vehicles through air cleaning functions when driving in polluted regions, such as urban areas or tunnels where traffic is abundant.
Eco-friendliness factors, such as the air quality inside vehicles, are recognized as important purchase conditions for consumers because of the increased amount of time spent by drivers and passengers inside vehicles and their interest in health.
5.2. Practical and Social Implications
To prevent driver drowsiness, the proposed system predicts physical conditions such as driver fatigue and inattention and provides appropriate voice alerts on the smartphone of the driver. If slight drowsiness is detected, simple actions such as activating the air conditioner are automatically performed. As the drowsiness of the driver increases, the system actively prompts the driver to perform functions for safe driving.
Depending on the level of drowsiness, the driver will perform the appropriate course of action, such as using a smartphone GPS to locate a place, lowering the windows of the vehicle for ventilation, using a nearby resting area, or calling a family member. When the driver responds appropriately and returns to a stable condition, the service will terminate. Thus, it helps prevent accidents and save lives.
The proposed service concept will be applied to the smartphone navigation T map in the future. T map is the primary navigation service brand used in Korea. Predicting the CO2 concentration and fatigue level at the appropriate time for drivers using T map enables the system to recommend that the driver take a break at a highway rest area through voice guidance or to rest at a drowsy driving shelter.
In addition to performing active safety functions, the proposed system utilizes services connected to management systems for in-vehicle air quality management and road rest areas corresponding to the driving route and time.
The prototype does not consider excess alerts. In the future, we plan to develop a location-based service by utilizing the abnormal and normal detection functions of the system. We will employ human–computer interaction technology to prevent abnormal alarms that may distract drivers. Moreover, when the fatigue of a driver reaches a certain threshold, the system turns on a warning indicator for mandatory rest and warns the driver about the possibility of an accident.
DSD systems are offered as premium options in some luxury cars; hence, they are not accessible to everyone. Our product can improve the performance of AQSs using deep learning, and it is also affordable. In the future, this system will be expanded to develop a comprehensive driver safety system that combines emergency warnings and actions, as well as drowsiness, head pose, and gaze tracking.
5.3. Limitations
Present studies on driver drowsiness prevention are conducted in controlled environments to produce the best results under ideal conditions. Consequently, they are not reliable for all practical situations. To compensate for this limitation, we tested the proposed DSD system using actual vehicles rather than simulators. However, various factors that affect in-vehicle air quality while driving were not considered in this study. The driving environment changes in real time and is affected by the weather, which requires special consideration. Moreover, driving datasets are still insufficient for verifying model fitness, especially in metropolitan areas. In future works, model accuracy should be further investigated, and the sensor data accumulated from various driving situations should be considered. In addition, the generalization of anomaly detection performance should be verified.
The anomaly detection model should be further upgraded for the five types of sensors by combining it with other data. It is necessary to gauge air quality using multiple models to account for the complexity of variables for describing the interior of a vehicle. Existing models should be advanced and optimized by considering the factors that affect air quality data, such as driving history. For this purpose, it is necessary to refine machine learning models for optimal anomaly detection according to the updated specifications of the sensors, through further investigation. Several practical situations can be identified and predicted by considering more diverse data, such as vehicle mileage and driving time, using AI-based analysis and by relating this information to the vehicle driving environment.
Author Contributions
Conceptualization, J.-J.C. and H.-J.K.; Data curation, J.-J.C. and H.-J.K.; Formal analysis, J.-J.C.; Investigation, H.-J.K.; Methodology, J.-J.C. and H.-J.K.; Resources, J.-J.C.; Software, J.-J.C and H.-J.K.; Supervision, H.-J.K.; Validation, J.-J.C. and H.-J.K.; Visualization, J.-J.C.; Writing—original draft, J.-J.C.; Writing—review and editing, H.-J.K. All authors have read and agreed to the published version of the manuscript.
Funding
This research received no external funding.
Acknowledgments
The authors gratefully acknowledge Socar for providing the test vehicle for this study. The authors would also like to thank SK Planet for the experimental data.
Conflicts of Interest
The authors declare no conflict of interest.
References
- Mathur, G.D. Effect of Cabin Volume on Build-Up of Cabin Carbon Dioxide Concentrations from Occupant Breathing in Automobiles (No. 2018-01-0074); SAE Technical Paper; SAE International: Warrendale, PA, USA, 2018. [Google Scholar]
- Sahayadhas, A.; Sundaraj, K.; Murugappan, M. Detecting driver drowsiness based on sensors: A review. Sensors 2012, 12, 16937–16953. [Google Scholar] [CrossRef] [PubMed] [Green Version]
- Joo, Y.H.; Kim, J.K.; Ra, I.H. Intelligent drowsiness drive warning system. J. Korean Inst. Intell. Syst. 2008, 18, 223–229. [Google Scholar] [CrossRef] [Green Version]
- He, K.; Zhang, X.; Ren, S.; Sun, J. Deep residual learning for image recognition. In Proceedings of the IEEE Conference on Computer Vision and Pattern Recognition, Las Vegas, NV, USA, 27–30 June 2016; pp. 770–778. [Google Scholar]
- Mathur, G.D. Experimental Investigation to Determine Influence of Build-up of Cabin Carbon Dioxide Concentrations for Occupants Fatigue (No. 2016-01-0254); SAE Technical Paper; SAE International: Warrendale, PA, USA, 2016. [Google Scholar]
- Rödjegård, H.; Franchy, M.; Ehde, S.; Zoubir, Y.; Al-Khaldy, S.; Olsson, P.; Bengtsson, C.; Nowak, T.; O’Brien, D. Drowsy Driver & Child Left Behind-Cabin Air Quality v3. 0 (No. 2020-01-0573); SAE Technical Paper; SAE International: Warrendale, PA, USA, 2020. [Google Scholar]
- Kurian, N.; Rishikesh, D. Real time based driver’s safeguard system by analyzing human physiological signals. Int. J. Eng. Trends Technol. 2013, 4, 41–45. [Google Scholar]
- Barnes, N.M.; Ng, T.W.; Ma, K.K.; Lai, K.M. In-cabin air quality during driving and engine idling in 546 air-conditioned private vehicles in Hong Kong. Int. J. Environ. Res. Public Health 2018, 15, 611. [Google Scholar] [CrossRef] [Green Version]
- Nguyen, P. Deep Learning Models for Predicting CO2 Flux Employing Multivariate Time Series; MileTS: Anchorage, AK, USA, 2019. [Google Scholar]
- Yamaguchi, K.; Kato, T.; Ninomiya, Y. Vehicle ego-motion estimation and moving object detection using a monocular camera. In Proceedings of the 18th International Conference on Pattern Recognition (ICPR’06), Hong Kong, China, 20–24 August 2006; Volume 4, pp. 610–613. [Google Scholar]
- Cho, S.; Lee, G.; Hyun, J.; Roh, C. Future direction of designing ADAS from user perspectives. In Proceedings of the KSAE Annual Conference Proceedings, Topeka, KS, USA, 11–12 December 2013. [Google Scholar]
- Ramos, S.; Gehrig, S.; Pinggera, P.; Franke, U.; Rother, C. Detecting unexpected obstacles for self-driving cars: Fusing deep learning and geometric modeling. In Proceedings of the IEEE Intelligent Vehicles Symposium, Los Angeles, CA, USA, 11–14 July 2017; pp. 1025–1032. [Google Scholar]
- Kim, H.; Song, B. Vehicle recognition based on radar and vision sensor fusion for automatic emergency braking. In Proceedings of the 13th International Conference on Control, Automation and Systems, Gwangju, Korea, 20–23 October 2013; pp. 1342–1346. [Google Scholar]
- Reddy, B.; Kim, Y.H.; Yun, S.; Seo, C.; Jang, J. Real-time driver drowsiness detection for embedded system using model compression of deep neural networks. In Proceedings of the IEEE Conference on Computer Vision and Pattern Recognition Workshops, Honolulu, HI, USA, 21–26 July 2017; pp. 121–128. [Google Scholar]
- Bojarski, M.; Del Testa, D.; Dworakowski, D.; Firner, B.; Flepp, B.; Goyal, P.; Jackel, L.D.; Monfort, M.; Muller, U.; Zhang, J.; et al. End to end learning for self-driving cars. arXiv 2016, arXiv:1604.07316. [Google Scholar]
- Pham, L.; Molden, N.; Boyle, S.; Johnson, K.; Jung, H. Development of a standard testing method for vehicle cabin air quality index. SAE Int. J. Commer. Veh. 2019, 12. [Google Scholar] [CrossRef] [Green Version]
- Papadelis, C.; Chen, Z.; Kourtidou-Papadeli, C.; Bamidis, P.D.; Chouvarda, I.; Bekiaris, E.; Maglaveras, N. Monitoring sleepiness with on-board electrophysiological recordings for preventing sleep-deprived traffic accidents. Clin. Neurophysiol. 2007, 118, 1906–1922. [Google Scholar] [CrossRef]
- Occupational Safety and Health Administration (OSHA). Sampling and Analytical Methods: Carbon Dioxide in Workplace Atmospheres. 2012. Available online: http://www.osha.gov/dts/sltc/methods/inorganic/id172/id172 (accessed on 20 March 2020).
- American Conference of Governmental Industrial Hygienists (ACGIH). TLVs and BEIs. In Proceedings of the American Conference of Governmental Industrial Hygienists, Cincinnati, OH, USA, 20–23 April 2011. [Google Scholar]
- Kang, C.; Chung, Y.; Chang, Y.J. Injury severity analysis of truck-involved crashes on Korean freeway systems using an ordered probit model. J. Korean Soc. Civ. Eng. 2019, 39, 391–398. [Google Scholar]
- Available online: https://ww3.arb.ca.gov/research/indoor/in-vehsm.htm (accessed on 29 February 2020).
- Ziebinski, A.; Cupek, R.; Erdogan, H.; Waechter, S. A survey of ADAS technologies for the future perspective of sensor fusion. In Proceedings of the International Conference on Computational Collective Intelligence, Halkidiki, Greece, 28–30 September 2016; pp. 135–146. [Google Scholar]
- Batista, J.P. A real-time driver visual attention monitoring system. In Proceedings of the 2nd Iberian Conference on Pattern Recognition and Image Analysis, Estoril, Portugal, 7–9 June 2005; pp. 200–208. [Google Scholar]
- Jung, H.G.; Cho, Y.H.; Kim, J. ISRSS: Integrated side/rear safety system. Int. J. Automot. Technol 2010, 11, 541–553. [Google Scholar] [CrossRef]
- Abtahi, S.; Omidyeganeh, M.; Shirmohammadi, S.; Hariri, B.; Yaw, D.D. A yawning detection dataset. In Proceedings of the 5th ACM Multimedia Systems Conference, Singapore, 19–21 March 2014; pp. 24–28. [Google Scholar]
- Lee, B.-G.; Chung, W.-Y. Driver alertness monitoring using fusion of facial features and bio-signals. IEEE Sens. J. 2012, 12, 2416–2422. [Google Scholar] [CrossRef]
- Oh, M.Y.; Jeong, Y.S.; Park, G.H. Driver drowsiness detection algorithm based on facial feature points. J. Korea Multimed. Soc. 2016, 19, 1852–1861. [Google Scholar] [CrossRef] [Green Version]
- Increased Possibility of Drowsy Driving when Running Continuously for Two Hours in a Confined Space. Available online: http://www.korea.kr/news/pressReleaseView.do?newsId=156120968 (accessed on 29 November 2019).
- Zeng, W.; Miwa, T.; Morikawa, T. Application of the support vector machine and heuristic k-shortest path algorithm to determine the most eco-friendly path with a travel time constraint. Transp. Res. D 2017, 57, 458–473. [Google Scholar] [CrossRef]
- Bhatt, P.P.; Trivedi, J.A. Various methods for driver drowsiness detection: An overview. Int. J. Comput. Sci. Eng. 2017, 9, 70–74. [Google Scholar]
- Daza, I.; Bergasa, L.; Bronte, S.; Yebes, J.; Almazán, J.; Arroyo, R. Fusion of optimized indicators from Advanced Driver Assistance Systems (ADAS) for driver drowsiness detection. Sensors 2014, 14, 1106–1131. [Google Scholar] [CrossRef] [PubMed]
- Choi, I.H.; Hong, S.K.; Kim, Y.G. Real-time categorization of driver’s gaze zone using the deep learning techniques. In Proceedings of the IEEE International Conference on Big Data and Smart Computing, Hong Kong, China, 18–20 January 2016; pp. 143–148. [Google Scholar]
- LeCun, Y.; Bengio, Y.; Hinton, G. Deep learning. Nature 2015, 521, 436–444. [Google Scholar] [CrossRef] [PubMed]
- Ngxande, M.; Tapamo, J.R.; Burke, M. Driver drowsiness detection using behavioral measures and machine learning techniques: A review of state-of-art techniques. In Proceedings of the 2017 Pattern Recognition Association of South Africa and Robotics and Mechatronics (PRASA-RobMech), Bloemfontein, South Africa, 29 November–1 December 2017; pp. 156–161. [Google Scholar]
- Wijnands, J.S.; Thompson, J.; Nice, K.A.; Aschwanden, G.D.P.A.; Stevenson, M. Real-time monitoring of driver drowsiness on mobile platforms using 3D neural networks. Neural Comput. Appl. 2019. [Google Scholar] [CrossRef] [Green Version]
- Mahdavinejad, M.S.; Mohammadreza, R.; Mohammadamin, B. Machine learning for internet of things data analysis: A survey. Digit. Commun. Netw. 2018, 4, 161–175. [Google Scholar] [CrossRef]
- Caron, M.; Bojanowski, P.; Joulin, A.; Douze, M. Deep clustering for unsupervised learning of visual features. In Proceedings of the European Conference on Computer Vision (ECCV), Munich, Germany, 8–14 September 2018; pp. 132–149. [Google Scholar]
- Camero, A.; Toutouh, J.; Stolfi, D.H.; Alba, E. Evolutionary deep learning for car park occupancy prediction in smart cities. In Proceedings of the International Conference on Learning and Intelligent Optimization, Kalamata, Greece, 10–15 June 2018; pp. 386–401. [Google Scholar]
- Xie, X.; Wu, D.; Liu, S.; Li, R. IoT data analytics using deep learning. arXiv 2017, arXiv:1708.03854. [Google Scholar]
- Ma, X.; Dai, Z.; He, Z.; Na, J.; Wang, Y.; Wang, Y. Learning traffic as images: A deep convolutional neural network for large-scale transportation network speed prediction. arXiv 2017, arXiv:1701.04245v4. [Google Scholar] [CrossRef] [Green Version]
- Badrinarayanan, V.; Kendall, A.; Cipolla, R. Segnet: A deep convolutional encoder-decoder architecture for image segmentation. IEEE Trans. Pattern Anal Mach. Intell. 2017, 39, 2481–2495. [Google Scholar] [CrossRef]
- Hill, D.J.; Minsker, B.S.; Amir, E. Real-time Bayesian anomaly detection for environmental sensor data. In Proceedings of the Congress-International Association for Hydraulic Research, Venice, Italy, 1–6 July 2007. [Google Scholar]
- Na, S.I.; Kim, H.J. Design of anomaly detection system based on Big Data in Internet of Things. J. Digit. Contents Soc. 2018, 19, 377–383. [Google Scholar]
- Chalapathy, R.; Chawla, S. Deep learning for anomaly detection: A survey. arXiv 2019, arXiv:1901.03407. [Google Scholar]
- Akcay, S.; Atapour-Abarghouei, A.; Breckon, T.P. GANomaly: Semi-supervised anomaly detection via adversarial training. arXiv 2018, arXiv:1805.06725. [Google Scholar]
- Malhotra, P.; Ramakrishnan, A.; Anand, G.; Vig, L.; Agarwal, P.; Shroff, G. LSTM-based encoder-decoder for multi-sensor anomaly detection. arXiv 2016, arXiv:1607.00148. [Google Scholar]
- Gers, F.A.; Schmidhuber, J.; Cummins, F. Learning to forget: Continual prediction with LSTM. In Proceedings of the 9th International Conference on Artificial Neural Networks: ICANN ’99, Edinburgh, UK, 7–10 September 1999. [Google Scholar]
- Chandola, V.; Banerjee, A.; Kumar, V. Anomaly detection: A survey. ACM Comput. Surv. 2009, 41, 15. [Google Scholar] [CrossRef]
- Hayes, M.A.; Capretz, M.A. Contextual anomaly detection framework for big sensor data. J. Big Data 2015, 2, 2. [Google Scholar] [CrossRef] [Green Version]
- Donahue, J.; Krähenbühl, P.; Darrell, T. Adversarial feature learning. arXiv 2016, arXiv:1605.09782. [Google Scholar]
- Syafrudin, M.; Alfian, G.; Fitriyani, N.; Rhee, J. Performance analysis of IoT-Based sensor, big data processing, and machine learning model for real-time monitoring system in automotive manufacturing. Sensors 2018, 18, 2946. [Google Scholar] [CrossRef] [Green Version]
- Zhao, Z.; Chen, W.; Wu, X.; Chen, P.C.Y.; Liu, J. LSTM network: A deep learning approach for short-term traffic forecast. IET Intell. Trans. Sys. 2017, 11, 68–75. [Google Scholar] [CrossRef] [Green Version]
- Omar, S.; Ngadi, M.A.; Jebur, H.H.; Benqdara, S. Machine learning techniques for anomaly detection: An overview. Int. J. Comput. Appl. 2013, 79. [Google Scholar] [CrossRef]
- Xu, H.; Chen, W.; Zhao, N.; Li, Z.; Bu, J.; Li, Z.; Liu, Y.; Zhao, Y.; Pei, D.; Feng, Y.; et al. Unsupervised anomaly detection via variational auto-encoder for seasonal KPIs in web applications. In Proceedings of the World Wide Web Conference, Lyon, France, 23–27 April 2018; pp. 187–196. [Google Scholar]
- Abduljabbar, R.; Dia, H.; Liyanage, S.; Bagloee, S.A. Applications of artificial intelligence in transport: An overview. Sustainability 2019, 11, 189. [Google Scholar] [CrossRef] [Green Version]
- Schlegl, T.; Seeböck, P.; Waldstein, S.M.; Schmidt-Erfurth, U.; Langs, G. Unsupervised anomaly detection with generative adversarial networks to guide marker discovery. In Proceedings of the International Conference on Information Processing in Medical Imaging, Boone, NC, USA, 25–30 June 2017. [Google Scholar]
- Abbasnejad, E.; Dick, A.; van den Hengel, A. Infinite variational autoencoder for semi-supervised learning. In Proceedings of the IEEE Conference on Computer Vision and Pattern Recognition, Honolulu, HI, USA, 21–26 July 2017. [Google Scholar]
Figure 1.
Main sources of air pollution inside modern cars.

Figure 2.
Internet of Things (IoT) sensor platform.

Figure 3.
Photograph of sensor model and circuit.

Figure 4.
Example of anomaly detection from air quality sensor (AQS) data.

Figure 5.
Anomaly detection using long short-term memory (LSTM) (top: normal, bottom: abnormal).

Figure 6.
Anomaly detection using variational auto-encoder (VAE) (top: normal, bottom: abnormal).

Figure 7.
Anomaly detection using the skip generative adversarial network (GAN) (top: normal, bottom: abnormal).
Figure 7.
Anomaly detection using the skip generative adversarial network (GAN) (top: normal, bottom: abnormal).


Table 1.
Effects of CO2 concentrations in vehicles [28].
Table 1.
Effects of CO2 concentrations in vehicles [28].
| CO2 Concentration (ppm) | Description/Effects |
|---|---|
| 250–350 | Normal outdoor air level |
| 350–1000 | Normal air level in a room with good air circulation |
| 1000–2000 | Discomfort due to poor air quality |
| 2000–5000 | Possible headaches, drowsiness, reduced concentration, loss of attention, increased heart rate, and slight nausea |
| >5000 | Abnormal outdoor air level; possible toxicity and O2 deficiency; exposure limit allowed for daily workplace exposure |
Table 2.
Sensor model specifications.
| Sensor | Specifications | Measuring Range |
|---|---|---|
| CO | Type: Electrochemical Sensor Measurement Range: 0–100 ppm Resolution: 0.1 ppm Maximum Overload: 5000 ppm | Operating Temperature: −20–+50 °C Storage Temperature: 0–20 °C Humidity: 15–95% RH |
| CO2 | Type: NDIR (Nondispersive Infrared) Sensor Measurement Range: 0–5,000 ppm Accuracy: 400–5000 ppm ± 75 ppm or 10% of reading, whichever is greater | Operating Temperature: +10–+50 °C Storage Temperature: −30–+70 °C Humidity: 0–95% RH |
| PM (1.0, 2.5, 10) * | Type: Laser-based light scattering Concentration Range: 1–500 µg/m3 Accuracy Error: ± 15% or ± 10 µg/m3 | Operating Temperature: +10–+60 °C Storage Temperature: −20–+70 °C Humidity: 0–95% RH |
| Temperature | Specified Range: −40–+125 °C Resolution: 0.01 °C | Operating Temperature: −40–+125 °C Storage Temperature: −40–+1500 °C |
| Humidity | Specified Range: 0–100% RH − Resolution: 0.01% RH | Operating Temperature: −40–+125 °C Storage Temperature: −40–+1500 °C |
* PM (Particulate matter) with an aerodynamic diameter equal to or less than 2.5 µg/m3 is referred to as PM2.5, and PM with a diameter between 2.5 and 10 µg/m3 is referred to as PM10. PM with a diameter less than 1.0 µg/m3 is defined as PM1
© 2020 by the authors. Licensee MDPI, Basel, Switzerland. This article is an open access article distributed under the terms and conditions of the Creative Commons Attribution (CC BY) license (http://creativecommons.org/licenses/by/4.0/).
Share and Cite
MDPI and ACS Style
Chung, J.-j.; Kim, H.-J. An Automobile Environment Detection System Based on Deep Neural Network and its Implementation Using IoT-Enabled In-Vehicle Air Quality Sensors. Sustainability 2020, 12, 2475. https://doi.org/10.3390/su12062475
AMA Style
Chung J-j, Kim H-J. An Automobile Environment Detection System Based on Deep Neural Network and its Implementation Using IoT-Enabled In-Vehicle Air Quality Sensors. Sustainability. 2020; 12(6):2475. https://doi.org/10.3390/su12062475
Chicago/Turabian StyleChung, Jae-joon, and Hyun-Jung Kim. 2020. "An Automobile Environment Detection System Based on Deep Neural Network and its Implementation Using IoT-Enabled In-Vehicle Air Quality Sensors" Sustainability 12, no. 6: 2475. https://doi.org/10.3390/su12062475
Note that from the first issue of 2016, this journal uses article numbers instead of page numbers. See further details here.