Eye Movement Analysis of Digital Learning Content for Educational Innovation


1
College of Computer and Information Sciences, Fujian Agriculture and Forestry University, Fuzhou 350002, China
2
School of Computer and Information Engineering, Xiamen University of Technology, Xiamen 361024, China
3
Department of Computer Science, National Chiao Tung University, Hsinchu 300, Taiwan
*
Authors to whom correspondence should be addressed.
Sustainability 2020, 12(6), 2518; https://doi.org/10.3390/su12062518
Submission received: 29 January 2020
/
Revised: 13 March 2020
/
Accepted: 22 March 2020
/
Published: 23 March 2020
(This article belongs to the Special Issue Selected Papers from the Eurasian Conference on Educational Innovation 2020)
Abstract
:Eye movement technology is highly valued for evaluating and improving digital learning content. In this paper, an educational innovation study of eye movement behaviors on digital learning content is presented. We proposed three new eye movement metrics to explain eye movement behaviors. In the proposed method, the digital content, which were slide-deck-like works, were classified into page categories according to the characteristics of each page. We interpreted the subjects’ eye movement behaviors on the digital slide decks. After data regularization and filtering, the results were analyzed to give directions for how to design an attractive digital learning content from the viewpoint of eye movement behaviors. The relationships between the subjects’ evaluation scores, page categories, and eye movement metrics are discussed. The results demonstrated that the proposed fixation time percentage (FTP) was a representative, strong, and stable eye movement metric to measure the subjects’ interest. Moreover, a reasonable portion of semantic content had a positive influence on the subjects’ interest.
1. Introduction
As an intuitive way to inspect what is attractive to humans through the fixation of gaze since the very beginning of human attention studying, eye movement has been a popular research area in human–computer interaction research for decades. McCormick and Sanders [1] indicated that 80% of humanity’s cognitive information processing is through vision. Recently, with the popularity of low-cost eye trackers and open source eye movement data analytic software, one of the significant areas of progress in eye movement and concentration research is that we can now obtain eye movement data more precisely and easily [2]. A large number of studies have been focused on the eye movement research of evaluating the usability of a system, studying interface design and implementing remote manipulation applications for those with disabilities [3,4,5].
Currently, with the major development and widespread reach of digital content, the habit of reading has gradually changed from reading paper books to reading electronic books. More and more schools began to adopt digital learning courses [6]. Thus, studies on reading habits through eye movement drew attention from educators and human behavior researchers. For educators in the area of educational innovation, eye movement data is an excellent opportunity to evaluate and improve digital learning content to obtain more interest from readers [7,8,9]. Therefore, eye tracking technology is highly valued in e-learning and educational innovations [10,11]. The researchers indeed found an attention pattern in the research of web viewing [12], from which the results point out that the attention models are quite different between the semantic and graphic content. Several studies [13,14] also indicated that font size and style have a major amount of influence on human attention.
Eye tracking analysis plays a crucial role in human behavior research, and there are still many questions about the relationship between the degree of interest and the eye movement behaviors. An ideal and precise model can draw viewers’ interest or attention towards a simple sentence, or even a formula [15]. For educators or designers, it is very convenient to evaluate how attractive an e-book or a digital learning slide deck is using metrics. Furthermore, researchers can utilize such models to improve their design and layout, to obtain more attention. Unfortunately, there is currently no simple and stable coefficient to measure or predict the degree of interest in a digital learning area. Though there are many studies on eye movement and degree of interest [16], the behaviors change with the viewing environment, which means that we cannot simply consider every viewing behavior as being directly comparable.
While studying digital learning content, we found that the pages or slide decks have their own unique features, correlated with the eye movement behaviors of the digital learning process. Therefore, in this paper, a study on eye movement behaviors while reading digital learning content is presented to reveal the regular pattern of eye viewing on different types of slides. Three new eye movement metrics are proposed to explain eye movement behaviors: Fixation time percentage (FTP) represents the percentage of the total fixation time in the whole reading process; Mean time to fixation (MTTF) represents the average time to the next fixation to be generated; Spatial diversity of fixations (SDOF) represents the average distance from each fixation point to the mean point in a certain page of a slide deck. The digital content, which was a slide-like work edited online with the software Microsoft Sway, was classified according to the characteristics of each page. The experiment was carried out to interpret the eye movement behaviors on the digital content, and the result was analyzed to give directions of how to design attractive digital learning content from the viewpoint of eye movement behaviors. Furthermore, this paper also attempts to find the relationship between the subjects’ evaluation scores, page categories, and the proposed eye movement metrics, including:
- (1)
- The relationship between the eye movement indicators and scores.
- (2)
- The relationship between the page categories and the subjects’ evaluation scores.
- (3)
- The relationship between the eye movement indicators and page categories.
The rest of this paper is organized as follows: Section 2 presents the related work of eye tracking. The proposed methods for analyzing eye movement data and the hypothesis about these statistics is described in Section 3. Section 4 presents the experimental results, the hypothesis evaluation, and the discussion of the relationship between subjects’ evaluation scores, page categories, and the proposed eye movement metrics. Finally, the conclusions and the future work are presented in Section 5.
2. Related Work
Human eye movement and concentration have been studied for decades. Researchers work on recording eye movement data with eye trackers, which have two parts: records about the positions and about the times of gaze. Fixation identification is the key technique that transfers eye movement data into relevant human eye behaviors [17], such as fixation and saccade. Salvucci and Goldberg [18] proposed several algorithms to achieve fixation identification from different angles. The methods for fixation identification can roughly be divided into spatial methods and temporal methods. Spatial methods include velocity-based, dispersion-based, and area-based methods. All of them emphasize the moving distance while eye scanning, which takes advantage of the fact that the fixation behavior has a lower moving distance than the saccade behavior. On the other hand, in temporal methods, the duration sensitive and locally adaptive methods are based on the fact that fixations are rarely less than 100 ms and often in the range of 200–400 ms, making fixation identification successful as well. These fixation identification methods can lead to similar results, providing a foundation for further eye movement analysis.
Subsequently, a great amount of the following eye tracking studies paid attention to the area of interest (AOI) [2], which usually represents an area of a graphic or an object that is attractive to human concentration. AOI-based algorithms provide an effective method for translating subject concentrations raw data into an analyzable number. While the AOI method has its own limitations [7], it still is a popular analytic tool for eye research. To interpret eye movement data more intuitively and deeply, several visual analytic mythologies are widely used [19,20]. The scan path allows us to determine how people redirect their attention between elements; duration plots and heat maps provide an intuitive way to understand which part of an image received the most attention; the cover plot highlights the image area covered by fixations. Furthermore, we can classify the fixation data to select the most suitable analytic metric while researching large data or data with high variations with a summary map of the time clusters [21]. These visualization modalities and other visual metrics provide observers with an opportunity to examine other aspects of information.
With the major development and wide spread of neural networks and machine learning, many researchers have attempted to analyze eye movements with learning-based methods [22,23] to improve object detection results by training the model with eye movement data. The features that can drive an observer’s attention are classified into two levels. The low-level features include the luminance, color, edge, and density, whereas the high-level features, which can only be recognized in higher brain visual neural areas, include the content and semantic text in pictures. These two types of statics are used in learning-based methods to construct the saliency model, which represents human attention more precisely than a heat map.
The fundamental premise of eye tracking analysis is that researchers must choose adequate metrics to measure the eye movement behavior. There are many visual-effort metrics that have been proposed, and Table 1 shows a list of metrics used in previous studies based on fixation [24]. Fixation duration (FD), fixation number (FN), and fixation average duration (FAD) are very common eye tracking metrics to measure the required time for analyzing and processing depth on the stimulus. The ratio of on-target: all-target fixation time (ROAFT) and the average duration of relevant fixations (ADRF) focus on relevant AOIs, which are used to measure efficiency while searching the stimulus. In order to further explain the degree of interest for the stimulus, we propose several metrics and hypotheses in this paper, attempting to understand the interest pattern and uncover the relationship between the degree of interest and eye movement behaviors.
3. Materials and Methods
3.1. Participants
The experiment was carried out in a senior high school located in northern Taiwan. Sixty-five students from three classes of the first-grade students voluntarily participated in the study. All of the students were selected by a questionnaire that ensured they were used to reading the digital learning content and had enough knowledge to evaluate the content of experimental materials. To ensure accuracy in capturing the eye movement data, participants were limited to those with normal visual acuity or fully corrected visual acuity. The total effective sample size of this study included the data from students who completed the task, as their eye movement data were recorded successfully for analysis, while 23 students’ eye movement records were counted as being invalid. Specially, seven students’ eye movement records failed due to human errors. The recording system can only record data from one Chrome browser. However, during the experiment the researcher activated more than one Chrome browser at a time, which lead to an error in the URL event record. Five students’ eye movement records were also discarded due to data loss caused by the recording system. The remaining 11 records failed with unknown problems. Thus, the total effective sample size of this study was 42. The average age of the sample was 15.8 years (SD = 0.42).
3.2. The Tasks and Materials
In our experiments, the students were asked independently to read and evaluate the selected materials and to submit their assessment. At the same time, their eye movement behaviors were recorded through eye trackers.
The experiment materials were from a previous work [25], where 20 students participated in re-editing a section of the textbook in an online web environment. They were provided with a textbook (a pdf file) and were asked to search for relative multimedia as content to complete their editing using Microsoft Sway. Each student was required to complete a slide deck that was restricted in the range of 8 to 12 pages. We successfully collected the work of 20 students, that is, 20 online slide decks. These works were page-turned, which allowed us to study the eye movement behavior page by page. Among them, we further selected six slide decks as experimental materials. To identify the quality of the work, two experts rated each work based on assessment scale that is the same as the student assessment scale defined in Section 3.5.
Finally, six different Microsoft Sway slide decks were selected as learning content for the students to read in this experiment. Two of them had high evaluation scores, two had medium evaluation scores, and two had low evaluation scores. We scored each of them with the measurement and divided them into three groups by their score. The scores were regarded as a metric to measure the degree of interest. The two slide decks with high evaluation scores were named #1 and #2. The two slide decks with medium evaluation scores were named #3 and #4. The two slide decks with low evaluation scores were named #5 and #6.
The six slide decks have their respective characteristics. The average page number of the six selected slide decks is 10. To understand the features of each work according to the eye movement behavior, we organized the composition of each slide deck by page. Each page was presented as a visual stimulus. To identify the page composition, we divided the pages into eight categories according to the visually similar features and similar characteristics regarding the statics, including “Upper left title”, “Centered title”, “Image with upper left title”, “Image with centered title”, “Image with instructions”, “Scattered text”, “Centralized text”, and “Little centralized text”, as shown in Table 2. Figure 1 shows the examples of each category.
3.3. Procedure
Before the experiment, we prepared the eye tracker and eye movement recording system. The Tobii eye tracker 4C [26] was selected as the device to process the experiment as it is quite simple to set up and can access to the recording system. An open-source eye analytic software called Chrome Plus Record (CPR) [27] with Tobii’s analytical use license, was used in this work for eye movement data recording, as it was more convenient and more suitable to fulfill our research purposes compared with other eye tracking analytic applications.
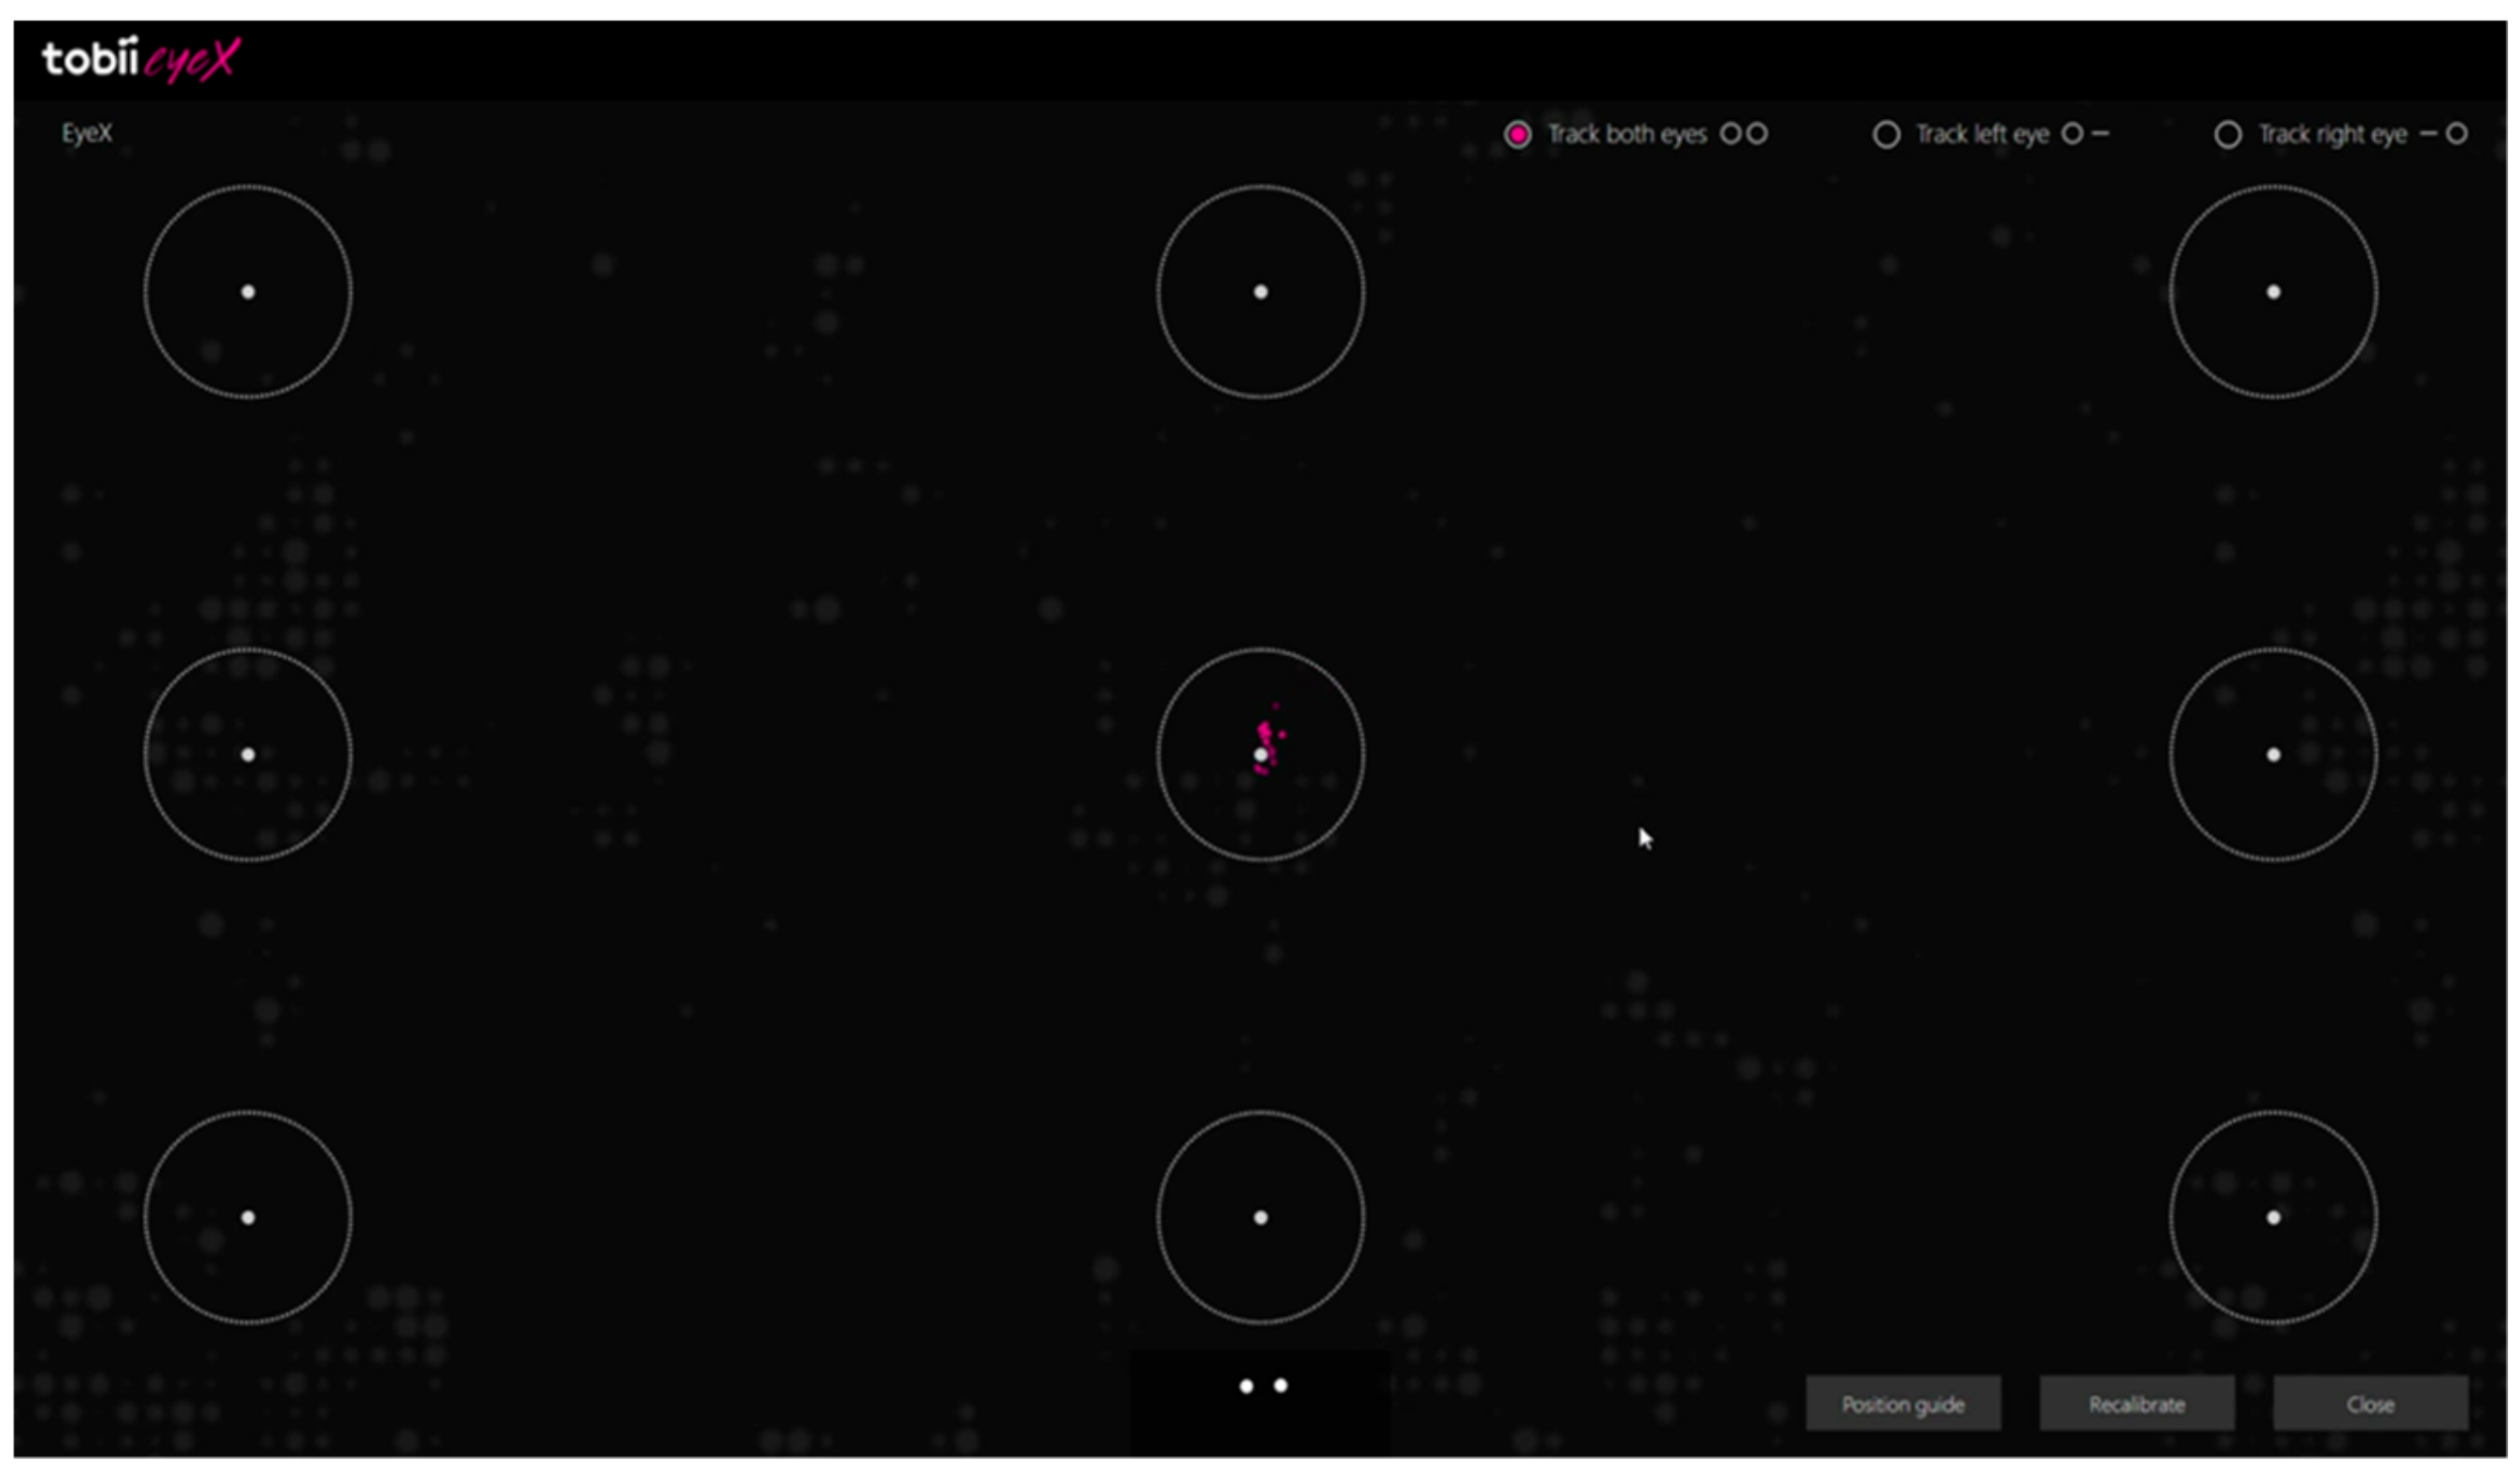
The eye tracker was placed in front of the user under the screen with an attached magnet, as shown in Figure 2. After the installation, we need one more step to finish the setting: i.e., calibration. The calibration is based on the nine-point calibration function implemented in CPR system with the Tobii development SDK, as shown in Figure 3, where all calibration points are visualized with a circle. In the calibration process, subject needed to look at the calibration point on the screen by following an instruction of staring at specific points, and the eye tracker started reading the subject’s gaze data. By checking if the subject’s gaze matched the location of an alternately moving and stopping display point on the monitor, the CPR system will automatically determine if the calibration passed or not. We utilized a 23 inch LCD with 1920 × 1080 resolutions as the experimental device. The distance between the subject’s eye and the screen was not strictly prescribed as the 4C eye tracker can capture the human face and trace the eye ball model.
Before the experiment, the subjects were clearly informed that the experiment would store their eye tracking data for further analysis in this work. To start the experiment, we first asked the subject to sit in front of the prepared screen with the eye tracker placed in front of them. The calibration process was conducted for each subject to adjust the eye tracker. Only once the subject passed the calibration, was he or she allowed to go on with the next step. Secondly, after calibration, we asked the subject to read the Microsoft Sway slide decks in order, while we recorded the eye movement behaviors with the CPR system. To prevent the influence of the reading order on the evaluation scores, the reading order of the slide decks for each participant were randomly arranged. Thirdly, after reading each slide deck, the participant was asked to evaluate each work by filling in the assessment questionnaire that is defined in Section 3.4. The steps mentioned above, including calibration and reading and filling in the questionnaire were repeated until all of the six slide decks were successfully evaluated. In general, it took 10 minutes for each participant to evaluate one slide deck. Finally, the experimental instructor checked the completion of the entire process. If the data were correctly recorded into the database, we exported them as a csv file for further analysis.
3.4. Questionnaire
The participants were asked to fill in an assessment questionnaire after reading each of the six selected works. There were a total of six items in the questionnaire, including “Does the text properly match the media?”, “Is the layout logical?”, ”Is the layout creative?”, “Is the content complete?”, “Is the content correct?”, and “Is the key point described clearly?”. The question responses for each item were captured using a 5-point Likert scale, ranging from 1 (strongly disagree) to 5 (strongly agree). The assessment criteria were divided into two topic areas, namely content and design [28]. Each area was further subdivided into individual items.
3.5. Measured Values
We mainly focused on the information provided by GazeFixation.csv, URLEvent.csv, and Rawdata.csv, which were generated by the CPR system. The GazeFixation file recorded the information regarding the fixations, including the fixation ID, subject name, start time of the fixation in milliseconds, duration in milliseconds, the position information in pixels, and the scrollTop property information in pixels. The threshold for a meaningful fixation in this work was defined as 250 ms. The URLEvent file shows the information of the webpages visited by the subjects, including the URL ID, subject name, webpage URL, keyword, and visiting time. Combining GazeFixation with the webpage viewing information provided by the URLEvent file, we were able to analyze the eye behaviors for each slide deck. Furthermore, after separating the slide decks into several single pages, we were able to analyze the eye movement deeply on each certain page. The Rawdata file recorded the raw mouse and eye movement data, including the event ID, the subject name, the event time, the mouse position information, the gaze point position information, and the scrollTop information. It provided the information of single movements of the subject’s eye and mouse, allowing us to study any single event during the reading process.
We used the following common eye tracking metrics to represent a slide deck or a page: duration, fixation duration (FD), fixation number (FN), and fixation average duration (FAD). The duration referred to the total duration of viewing on this slide deck. FD referred to the total duration of fixations on this slide deck. A longer duration or a longer fixation duration indicated that the participant considered that information to be important and was more focused on it [29]. FN referred to the total fixation count in the slide deck. A higher fixation count indicated more devoted attention was given to this stimulus [30]. FAD was the mean value of the durations of fixations on this slide deck. A longer FAD indicated more overall effort spent by a participant during the experiment [31].
In addition, we proposed several new fixation-based metrics to measure the depth of student’s processing in the content, including the fixation time percentage (FTP), mean time to fixation (MTTF), and spatial diversity of fixations (SDOF). In the experiment, we researched whether the proposed metrics were stable or not in measuring the subjects’ interest while viewing the slide decks. FTP was defined as the percentage of total fixation duration takes of total viewing duration on the page/slide deck, can be obtained by using the following equation:
Fixation time percentage = (all fixation duration)/(total viewing duration).
FTP is a metric that focuses on the proportion of all fixation duration in the total viewing duration of a stimulus. It is different from the metrics, such as the Ratio of Fixation Time and ROAFT [32], which focus on the ratio of fixation duration of an AOI in all fixation duration of the stimulus. FTP is supposed to explain the subject’s attention while viewing the slide decks. In general, a larger fixation time percentage means that the participant pays more attention and is more concerned with the content of the slide deck. MTTF is the average time until the next fixation is generated, which is calculated as the following equation:
Mean time to fixation = (total viewing duration)/(fixation number).
While studying deeply page by page, we find that the characteristics of each page, such as the density and layout of the visual elements on the screen, have a strong connection with the MTTF. For example, a page with a small font size and high density of text leads to a small MTTF. On the other hand, a page that is text-only with a large font size and low density, leads to a large MTTF. Therefore, in the experiment we also attempted to determine whether MTTF was a representative metric or not to measure the subjects’ interest while viewing slide decks. The SDOF is the average distance (pixel) to the mean point of all fixation points. It was utilized to evaluate the balance of visual elements on the screen, usually referred to as the mean point. The SDOF is described with the following equation:
Spatial diversity of fixations = (total distance from each fixation to the mean point)/(fixation number).
We bring two definitions of the mean point here. One is the average position of all fixation points, the other is the average point weighted by the duration of fixation. In general, these two mean fixation points were located at almost the same location. However, in some special cases, the two mean fixation points did not fall in the same position, such as a small-type page where participants gave an extremely short viewing duration. We speculated that during the viewing process, the subjects made fixations on searching for the “next page” button that is on the bottom right corner of the screen. Due to the lack of content, the page was not attractive enough for the subjects. The existence of the difference between the two versions of mean point demonstrated the inconsistency of the fixation durations. Being aware of that, we conducted a filter to clear the unnecessary fixation points in the research. We will discuss the filtering method in Section 3.6. As the two different definitions usually cause the same results, we simply use “average fixation point” here. In the experiment, we also attempted to determine whether the SDOF could represent the degree of dispersion of the fixations, or whether a lower SDOF indicated a higher attraction of the page.
3.6. Regularization and Filters
Before the analysis of the data, we needed to arrange the raw data, transforming it into readable data. There were two parts to preprocess the data: data regularization and fixation filtering. The data preprocessing can be separated into five steps:
- (1)
- Reading order recoveryTo prevent the results from being affected by the reading order, we made a random reading order list for each participant while doing the experiment. Thus, the first task of the data regularization was to rearrange the reading order of the record corresponding to the real order. In this step, we used the timestamp obtained from the URLEvent.csv generated by CPR system and the URL of the slide decks to cut the viewing process into several sections, and we then arranged everyone’s section records in a uniform order.
- (2)
- Video offset recoveryIn this step, we recovered the “frame loss” of the generated video. The frame loss represents some of the frames that caused timestamp offsets in the video that were not recorded during the experiment process. The CPR system provided us eye tracking data and screen records. However, the qualities of the generated videos were not consistent. We speculated that the poor performance of the operating computer could not fully support the CPR system. As a result, these screen videos faced a problem named “frame loss”, which means that some frames were not recorded during the experiment process, resulting in timestamp offset in the video. The images displayed by the video did not match with the event recorded in the database. To solve this problem, we assumed that the frame lost rate was consistent in one video, computing the real FPS and scaling the video to the correct length. After recovery, we found that the events and the images finally matched, proving the effectiveness of the recovery method.
- (3)
- Timestamp labelingTo analyze the eye movement behavior of the slide deck by page, we labeled the timing of page switching manually to get the information regarding page switching during the reading process. We manually sampled the timestamp three times to reduce the artificial error made by humans. Finally, each timestamp was labeled as the mean value of three samples. The difference between three different timestamps was narrowed down to less than 0.5 seconds. The process of data regularization was finished when the labeling was complete.
- (4)
- Button maskAs described in Section 3.5, we knew that the fixations on the “next page” button of the screen might change the position of the weighting mean fixation point to be different from that of another mean point. A feature of Sway’s slide decks is that there is a button on the bottom right corner for users to skip to the next page. However, the button caused the visual offset, reflected in the inconsistency of the calculated mean point. Obviously, the gazes generated in these areas did not represent the influence of the page itself. Thus, we masked these areas to filter the fixations. The mask size was 167 × 190, located in the bottom right corner of the page.
- (5)
- Outlier removalDuring the experiment, some fixations had singular durations with either extremely high or low values. We filtered these extreme values in order to make the data distribution correspond to a normal distribution. The standard deviation method, which is common in statistics, was used to remove the outliers.
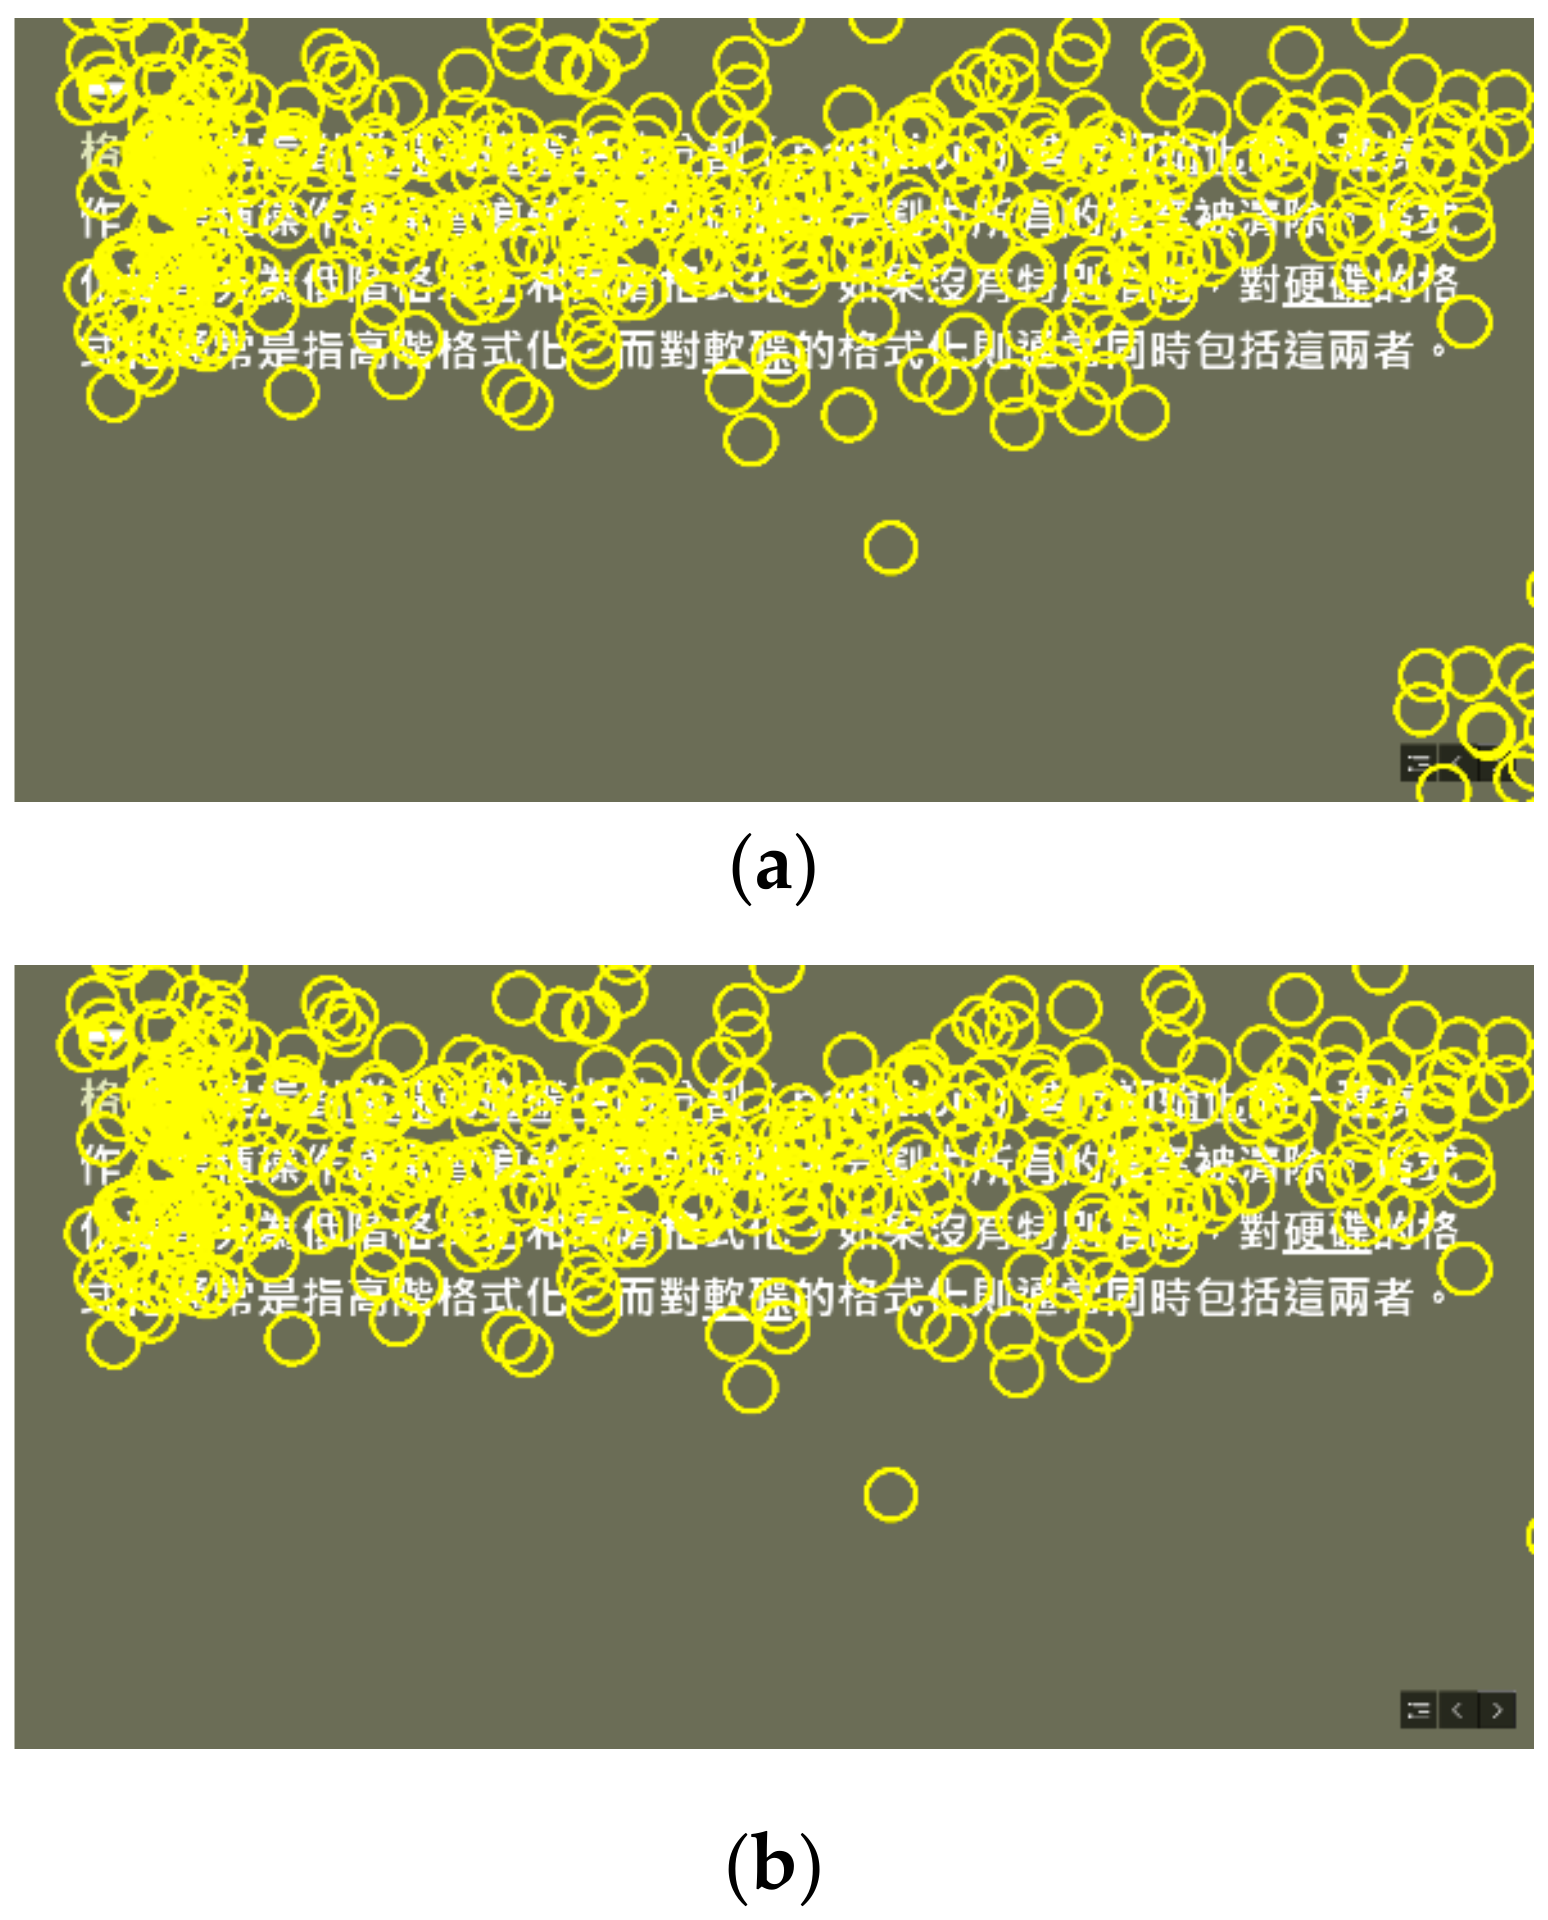
After these steps, the data preprocessing was complete. Figure 4 shows an example of the comparison of the original fixation data and the filtered data, where the yellow circles represent the fixations. It can be found that the filters improved the performance on the normality test.
4. Results and Discussions
4.1. The Relationship between Eye Movement Indicators and Scores
Pearson’s correlation coefficient (PCC) [33] was utilized to measure the statistical relationship among the eye movement variables and the evaluation scores of each slide deck. This test statistic measures the statistical relationship, or association, between two continuous variables. To interpret the value of PCC, if the PCC value between two variables is above 0.7, it represents a strong linear relationship. If the PCC value is between 0.5 and 0.7, it represents a moderate linear relationship, and if the PCC value is between 0.3 and 0.5, it represents a weak linear relationship. The PCC results of the eye movement indicators and scores are shown as Table 3. Apart from the common eye tracking metrics defined in Section 3.5, the average total number of words (WC) and font size (FS) on each slide deck were also considered as indicators.
Table 3 shows that most PCC results between coefficients and the scores valued by subjects were weaker than the scores valued by experts. The results might be caused by the different judging criteria because the experts considered the degree of interest when they scored the lecture, while the subjects needed to understand the content first. Despite the PCC results between the eye movement indicators and the scores valued by experts and students being different, the PCC result between Score(S) and Score(E) was 0.615, which still represents a moderate linear relationship. In addition, Table 3 shows a negative linear relationship between the scores and the FAD, FTP, and WC, and a positive linear relationship between the SDOF, FS, and scores.
In terms of the proposed metric FTP, the results in Table 3 show that the FTP achieved a very strong negative linear relationship with the scores, which indicates that FTP was a significant metric to measure the participations’ interest and predict the evaluation score of the content. The results demonstrated that a high FTP value would lead to a low score, which is because a longer fixation duration corresponded to more difficult-to-process context in the digital learning content, which reflected the degree of cognitive difficulty in the region [32,34]. Therefore, a slide deck with small font and massive content would make subject feel tired and more difficult to understand, and hence would influence the scores.
In terms of the other proposed metric MTTF, the results in Table 3 showed that MTTF appeared to not have a good performance on the correlation coefficient with the scores. It indicated that the “time to fixation (TTF)” was not a significant metric for measuring the participants’ interest or predicting the evaluation score of the content. With respected to the SDOF, the results in Table 3 did not show a stronger relationship with the scores. Table 3 indicates that only the SDOF had a positive moderate linear relationship with the scores. We assume that not only diversity but also brightness, contrast, or other features can affect human interest, so there are still more facts to be discovered. In addition, the SDOF was the only spatial metric in the research. The result proved that the spatial features of eye movement had a relationship with the degree of interest, just as the temporal features did. Table 3 also demonstrates that the fixation average duration (FAD), word count (WC), and font size (FS) had an influence on the eye movement behaviors and the subjects’ degree of interest. This fact proved our hypothesis and demonstrated a similar result to the previous related work [13,14].
After the PCC test, we also used regression analysis to further examine the relationship of scores and the combination of multiple eye movement metrics, to attempt to determine more significant features. However, the final results showed that only FTP could pass the F test where the P-value of Significance F equaled 0.007761. The regression models were not significant in terms of other eye movement metrics and their combination. In addition, the P-value of FTP in the regression model was less than the common significant level of 95% confidence. The proposed metric FTP was further demonstrated to be significant in the regression model with the evaluating scores.
4.2. The Relationship between Page Categories and Scores
Table 4 shows the compositions of the six slide decks with respect to the eight categories defined in Section 3.2. The average page number of the six selected slide decks is 10. The final scores of each work for experts and students are also shown in Table 4, where score(E) represents the score results from experts, and score(S) represents the score results from subjects. The scores were calculated based on the questionnaire defined in Section 3.4. Table 4 shows that the Slide decks #1, #2, and #3 resulted in a higher score(E) than Slide decks #4, #5, and #6, which indicates that based on the experts’ opinions, Slide decks #1, #2, and #3 are better works. On the other side, the score results from the subjects score(S) are similar to the experts’ scores, and the Slide decks #1, #2, and #4 resulted in a higher score(S) than Slide decks #3, #5, and #6. Therefore, in accordance with the score results from both experts and subjects, we can conclude that the Slide decks #1 and #2 are relatively better works, whereas Slide decks #5 and #6 are relatively worse works.
To further discuss the relationship between the page category and scores, Table 5 shows the page composition table of the high score works (Slide decks #1 and #2) and low score works (Slide decks #5 and #6). While analyzing the page composition, we noticed that the scattered text pages, which are, in total, eight pages, had the largest portion of the high score works, which was a total of 22 pages. On the other hand, the categories that had the largest part in the low score group were the centered title (6/19) and centralized text (6/19). We assumed that these page categories had some characteristics affecting the ranking or scores.
From Table 5, for the page categories: Upper left title, Centered title, Image with upper left title, Image with instructions, and Little centralized text, their portion of the high and low score works are very similar and balanced. Additionally, they usually had similar features in the class table. On the other hand, the difference between the portion of the page categories: Image with centered title, Scattered text, and Centralized text, in the high and low score works is significant. The results indicated that the subjects were more interested in the works with more “Image with centered title” and “Scattered text” pages. On the other hand, the works with more “Centralized text” pages had a negative relationship with scores as a slide deck with small font and massive content would likely make the subject feel labored and lose interest [35]. Therefore, the scattered text page, image with centered title page, and centralized text page had significant features and provided a major influence on the scores.
4.3. The Relationship between the Eye Movement Indicators and Page Categories
To evaluate the subjects’ attention paid to different page categories, Table 6 shows the relationship between the page categories and the eye movement indicators. The results demonstrated that the subjects had a greater fixation on scattered text and centralized text pages, and less on title style pages. In addition, we found from Table 6 that the relationship was very similar in some features but quite unique in some others. The results demonstrated that even if a scattered text type page and a centralized text type page had similar textual content and word count, they had a different effect on the viewer. For example, pages in scattered text type had a low fixation time percentage (FTP) and fixation average duration (FAD), yet pages in centralized text had an extremely high score in these two features. However, both had high fixation duration (FD) and fixation number (FN).
After analyzing the relationship between the page categories and scores in Section 4.2, we found that the “scattered text page”, “image with centered title page”, and “centralized text page” had significant features and would have a major influence on the scores. To further evaluate the difference of the subjects’ attention paid to the three page categories, Table 7 shows the relationship between the three significant page categories and the eye movement indicators. Based on the results listed in Table 7, we found that comparing to the negative correlation centralized text page, the positive correlation pages (scattered text and image centered title pages) had the following features:
- (1)
- Lower fixation average duration (FAD),
- (2)
- Lower fixation time percentage (FTP),
- (3)
- Higher font size (FS).
The results lead to a similar conclusion to that discussed in Section 4.1: The FTP and FAD demonstrated a negative, lean relationship with the scores, the FS showed a positive one. Among the three metrics, FTP was the most significant. The results also demonstrated that even if a scattered text type page and a centralized text type page had a similar textual content and word count, they had a different effect on the viewer. In addition, after deeply studying the tables and features, we found that the word count (WC), duration, fixation duration (FD), and fixation number (FN) had a strong, lean correlation with each other. The results indicate that a major portion of the subjects’ gaze or fixations happened during the reading process.
The most representative slide deck, ID #6, had the most centralized text pages and 1360 word counts that were almost twice the average. However, almost every subject gave this lecture a bad score. At the same time, slide deck ID #5 had two centralized text pages and the lowest word counts 312, but the score was still not good. On the other hand, slide deck ID #2 had four scattered text pages and a word count of 458 words, and every subject gave this work a good score. This indicates that although the semantic content did not perform well as being interesting to subjects, a reasonable portion of the semantic content had a positive influence on the total score.
5. Conclusions
This paper presents a study on eye movement behaviors while reading digital learning content. The CPR system and Tobii eye tracker 4C were utilized to process the experiments with 42 effective records. After data preprocessing, the Pearson’s correlation coefficient test was applied to measure the linear relationship between the scores and the eye movement indicators. For the proposed three new eye movement metrics: FTP, MTTF, and SDOF, FTP was proven to be a symbolic, strong, and stable metric to measure the subjects’ interest, and the SDOF also showed a moderate to strong correlation with the scores.
According to the collected eye movement and page categories, we found the scattered text page, image with centered title page, and centralized text page had significant features and had a great influence on the scores. The highly scored lectures had the common following features: (1) a lower fixation average duration (FAD); (2) a lower fixation time percentage (FTP); and (3) a higher font size (FS). We also found that the word count (WC), duration, fixation duration (FD), and fixation number (FN) had a strong, lean correlation with each other. The result indicated that a major portion of the subjects’ gaze or fixations happened during the reading process. From the results, we proposed that a reasonable portion of semantic content had a positive influence on the subjects’ interest as well.
For future work, research could focus on the visual stimulation, as the visual elements including brightness, contrast, or animation may also have an influence on the fixation behaviors. In our research, we proved that the spatial features also had a correlation with the subjects’ value. However, it only made use of a modest number of samples that may not adequately represent the e-learning content. Moreover, as the score in this work was calculated with respect to each slide deck, the PCC results can only reflect the relationship among the eye movement variables and the scores of each slide deck. In the future, we will attempt to design a work where the score is respectively evaluated for each page category to further study the relationship among the eye movement variables and the score of each page category.
Author Contributions
Conceptualization, X.Z. and S.-M.Y.; Data curation, W.-W.C.; Formal analysis, X.Z.; Funding acquisition, X.L. and S.-M.Y.; Investigation, W.-W.C.; Methodology, X.L., X.Z. and S.-M.Y.; Project administration, S.-M.Y.; Resources, W.-W.C.; Software, X.Z. and S.-M.Y.; Supervision, S.-M.Y.; Validation, X.L., X.Z. and S.-M.Y.; Writing – original draft, X.L. and W.-W.C.; Writing – review & editing, X.L. and X.Z. All authors have read and agreed to the published version of the manuscript.
Funding
This research was funded by (MOE (Ministry of Education in China) Project of Humanities and Social Sciences) grant number (17YJC880076), (XIAMEN UNIVERSITY OF TECHNOLOGY) grant number (YKJ19004R), (Distinguished Young Scholars of Fujian Agriculture and Forestry University) grant number (xjq201809), and (the MOST OF TAIWAN) grant number (108-2511-H-009-009-MY3).
Conflicts of Interest
The authors declare no conflict of interest. The funders had no role in the design of the study; in the collection, analyses, or interpretation of data; in the writing of the manuscript or in the decision to publish the results.
References
- Sanders, M.S.; McCormick, E.J. Human Factors in Engineering and Design; McGraw-Hill: New York, NY, USA, 1982. [Google Scholar]
- Zhang, X.; Yuan, S.M.; Chen, M.D.; Liu, X. A complete system for analysis of video lecture based on eye tracking. IEEE Access 2018, 6, 49056–49066. [Google Scholar] [CrossRef]
- Kuperman, V.; Matsuki, K.; Dyke, J.A.V. Contributions of Reader- and Text-Level Characteristics to Eye-Movement Patterns during Passage Reading. J. Exp. Psychol. Learn. Mem. Cognit. 2018, 44, 11. [Google Scholar] [CrossRef] [PubMed]
- Javadi, E.; Gebauer, J.; Mahoney, J.T. The Impact of User Interface Design on Idea Integration in Electronic Brainstorming: An Attention-Based View. J. Assoc. Inf. Syst. 2013, 14, 1–21. [Google Scholar] [CrossRef] [Green Version]
- Zhang, X.; Liu, X.; Yuan, S.M.; Lin, S.F. Eye Tracking Based Control System for Natural Human-Computer Interaction. Comput. Intell. Neurosci. 2017, 2017, 1–9. [Google Scholar] [CrossRef] [PubMed] [Green Version]
- Vymetalkova, D.; Milkova, E. Experimental Verification of Effectiveness of English Language Teaching Using MyEnglishLab. Sustainability 2019, 11, 1357. [Google Scholar] [CrossRef] [Green Version]
- Orquin, J.L.; Ashby, N.J.S.; Clarke, A.D.F. Areas of Interest as a Signal Detection Problem in Behavioral Eye-Tracking Research. J. Behav. Decis. Mak. 2016, 29, 103–115. [Google Scholar] [CrossRef]
- Sibert, L.E.; Jacob, R.J.K. Evaluation of eye gaze interaction. In Proceedings of the SIGCHI Conference on Human Factors in Computing Systems, The Hague, The Netherlands, 1–6 April 2000. [Google Scholar]
- Jamet, E. An eye-tracking study of cueing effects in multimedia learning. Comput. Hum. Behav. 2014, 32, 47–53. [Google Scholar] [CrossRef]
- Daraghmi, E.Y.; Fan, C.; Lin, W.; Peng, Z.; Yuan, S.M. Eye-Tracking Assisted Self-Directed Learning System. In Proceedings of the 2015 IEEE 15th International Conference on Advanced Learning Technologies, Hualien, Taiwan, 6–9 July 2015; pp. 52–54. [Google Scholar]
- Njeru, A.M.; Paracha, S. Learning analytics: Supporting at-risk student through eye-tracking and a robust intelligent tutoring system. In Proceedings of the 2017 International Conference on Applied System Innovation (ICASI), Sapporo, Japan, 13–17 May 2017; pp. 1002–1005. [Google Scholar]
- Stenfors, I.; Morn, J.; Balkenius, C. Behavioural Strategies in Web Interaction. A View from Eye-movement Research. Minds Eye Cognit. Appl. Asp. Eye Mov. Res. 2003, 14, 633–644. [Google Scholar]
- Beymer, D.; Russell, D.; Orton, P. An eye tracking study of how font size and type influence online reading. In Proceedings of the 22nd British HCI Group Annual Conference on People and Computers: Culture, Creativity, Interaction, Liverpool, UK, 1–5 September 2008; Volume 2. [Google Scholar]
- Kanonidou, E.; Gottlob, I.; Proudlock, F.A. The Effect of Font Size on Reading Performance in Strabismic Amblyopia: An Eye Movement Investigation. Investig. Ophthalmol. Vis. Sci. 2014, 55, 451. [Google Scholar] [CrossRef] [Green Version]
- Jianu, R.; Alam, S.S. A Data Model and Task Space for Data of Interest (DOI) Eye-Tracking Analyses. IEEE Trans. Vis. Comput. Graph. 2018, 24, 1232–1245. [Google Scholar] [CrossRef]
- Li, K.; Liu, Y. Effect of disparity and viewing ambient illumination on stereoscopic viewing: An eye movement approach: Effect of disparity and ambient illumination. J. Soc. Inf. Disp. 2018, 26, 14–20. [Google Scholar] [CrossRef]
- Chamberlain, L. Eye Tracking Methodology; Theory and Practice. Qual. Market Res. 2007, 10, 217–220. [Google Scholar] [CrossRef]
- Salvucci, D.D.; Goldberg, J.H. Identifying fixations and saccades in eye-tracking protocols. In Proceedings of the 2000 Symposium on Eye Tracking Research & Applications, Palm Beach Gardens, FL, USA, 6–8 November 2000; pp. 71–78. [Google Scholar]
- Bylinskii, Z.; Borkin, M. Eye Fixation Metrics for Large Scale Analysis of Information Visualizations; ETVIS 2015; Mathematics and Visualization; Springer: Chicago, IL, USA; pp. 235–255.
- Al-Rahayfeh, A.; Faezipour, M. Eye Tracking and Head Movement Detection: A State-of-Art Survey. IEEE J. Transl. Eng. Health Med. 2013, 1, 2100212. [Google Scholar] [CrossRef]
- Andrienko, G.L.; Andrienko, N.V.; Burch, M.; Weiskopf, D.; Graphics, C. Visual Analytics Methodology for Eye Movement Studies. IEEE Trans. Vis. Comput. Graph. 2012, 18, 2889–2898. [Google Scholar] [CrossRef] [PubMed] [Green Version]
- Shen, C.; Huang, X.; Zhao, Q. Predicting Eye Fixations on Webpage with an Ensemble of Early Features and High-Level Representations from Deep Network. IEEE Trans. Multimed. 2015, 17, 2084–2093. [Google Scholar] [CrossRef]
- Ren, Y.; Wang, Z.; Xu, M. Learning-Based Saliency Detection of Face Images. IEEE Access 2017, 5, 6502–6514. [Google Scholar] [CrossRef]
- Sharafi, Z.; Shaffer, T.; Sharif, B.; Gueheneuc, Y.G. Eye-Tracking Metrics in Software Engineering. In Proceedings of the 2015 Asia-Pacific Software Engineering Conference (APSEC), New Delhi, India, 1–4 December 2015; pp. 96–103. [Google Scholar]
- Zhang, X.; Liu, X.; Yuan, S.-M.; Fan, C.-C.; Sun, C.-T. Exploring Students’ Behaviors in Editing Learning Environment, in Intelligent Tutoring Systems; Springer International Publishing: Montreal, QC, Canada, 2018; pp. 399–404. [Google Scholar]
- Tobii Gaming. Tobii Eye Tracker 4C-The Game-Changing Eye Tracking Peripheral for PC Gaming. Available online: https://gaming.tobii.com/product/tobii-eye-tracker-4c/ (accessed on 10 November 2019).
- Chen, Y.-J. Eye- and Mouse-Tracking Analysis System for Webpages. Master’s Thesis, Institute of Computer Science and Engineering, National Chiao Tung University, Hsinchu City, Taiwan, 2018. [Google Scholar]
- Gray, K.; Thompson, C.; Sheard, J.; Clerehan, R.; Hamilton, M. Students as Web 2.0 authors: Implications for assessment design and conduct. Australas. J. Educ. Technol. 2010, 26, 105–122. [Google Scholar] [CrossRef] [Green Version]
- Van, B.; Ineke, W.A.; Albert, P. Design principles and outcomes of peer assessment in higher education. Stud. High. Educ. 2006, 31, 341–356. [Google Scholar]
- Ali, N.; Sharafi, Z.; Guéhéneuc, Y.-G.; Antoniol, G. An empirical study on the importance of source code entities for requirements traceability. Empir. Softw. Eng. 2015, 20, 442–478. [Google Scholar] [CrossRef]
- Crosby, M.E.; Scholtz, J.; Wiedenbeck, S. The roles beacons play in comprehension for novice and expert programmers. In Proceedings of the 14th Workshop of the Psychology of Programming Interest Group, Brunel University, London, UK, 18–21 April 2002; pp. 18–21. [Google Scholar]
- Garlandini, S.; Fabrikant, S.I. Evaluating the Effectiveness and Efficiency of Visual Variables for Geographic Information Visualization. In Lecture Notes in Computer Science; Springer: Berlin/Heidelberg, Germany, 2009; Volume 5756, pp. 195–211. [Google Scholar]
- Mu, Y.; Liu, X.; Wang, L. A Pearson’s correlation coefficient based decision tree and its parallel implementation. Inf. Sci. 2017, 435, 40–58. [Google Scholar] [CrossRef]
- Soh, Z.; Sharafi, Z.; den Plas, B.V.; Porras, G.C.; Guéhéneuc, Y.-G.; Antoniol, G. Professional status and expertise for UML class diagram comprehension: An empirical study. In Proceedings of the 20th International Conference on Program Comprehension (ICPC), Passau, Germany, 11–13 June 2012; pp. 163–172. [Google Scholar]
- Huang, M.S.; Hsiao, W.H.; Chang, T.S. Design and implementation of a cooperative learning system for digital content design curriculum: Investigation on learning effectiveness and social presence. Turkish Online J. Educ. Technol. 2012, 11, 94–107. [Google Scholar]
Figure 1.
(a) “Upper left title” page; (b) “Centered title” page; (c) “Image with upper left title” page; (d) “Image with centered title” page; (e) “Image with instructions” page; (f) “Scattered text” page; (g) “Centralized text” page; (h) “Little centralized text” page.
Figure 1.
(a) “Upper left title” page; (b) “Centered title” page; (c) “Image with upper left title” page; (d) “Image with centered title” page; (e) “Image with instructions” page; (f) “Scattered text” page; (g) “Centralized text” page; (h) “Little centralized text” page.

Figure 2.
A User in front of an eye tracker.

Figure 3.
Nine-point calibration.

Figure 4.
Comparison of the original fixation data and filtered data: (a) original data; (b) filtered data.
Figure 4.
Comparison of the original fixation data and filtered data: (a) original data; (b) filtered data.


Table 1.
Eye tracking metrics.
| Metrics | Description |
|---|---|
| Fixation Duration (FD) | The total duration of fixations on the stimulus |
| Fixation Number (FN) | The total fixation count on the stimulus |
| Fixation Average Duration (FAD) | The mean value of the durations of fixations on the stimulus |
| Ratio of ON-target: All-target Fixation Time (ROAFT) | The sum of the durations of all fixations in an AOI, divided by the total duration of all fixations on the stimulus |
| Average Duration of Relevant Fixations (ADRF) | The total duration of the fixations for relevant AOIs, divided by the total number of relevant AOIs |
Table 2.
Page Categories.
| Page Category | Description |
|---|---|
| Upper left title | A page with simply a title located at the upper left corner. |
| Centered title | A page with simply a title located at the center of the screen. |
| Image with upper left title | A page with a title located at the upper left of the screen and an image as background. |
| Image with centered title | A page with a title located at the center of the screen and an image as background. |
| Image with instructions | A page with an image and a small amount of text for instruction, usually in small font size. |
| Scattered text | A page with a large amount of scattered text, usually in big font size. The text accounts for the vast majority area of the page. |
| Centralized text | A page with a large amount of centralized text, usually in small font size. The text accounts for the vast majority area of the page. |
| Little centralized text | A page with a small amount of centralized text, usually in small font size. |
Table 3.
The coefficient of the correlation between the eye movement indicators and the scores.
| ID | Score(E) | FD | FAD | FN | FTP | MTTF | SDOF | WC | FS | Score(S) |
|---|---|---|---|---|---|---|---|---|---|---|
| 1 | 3.286 | 83035 | 466 | 192 | 0.319 | 1511 | 281 | 751 | 16.86 | 3.939 |
| 2 | 3.214 | 154206 | 476 | 336 | 0.336 | 1474 | 416 | 458 | 47.86 | 4.085 |
| 3 | 3.143 | 118787 | 538 | 217 | 0.333 | 1676 | 389 | 717 | 18.32 | 3.825 |
| 4 | 3 | 113672 | 642 | 188 | 0.336 | 2340 | 264 | 764 | 30.12 | 4.069 |
| 5 | 2.929 | 88875 | 496 | 182 | 0.353 | 1479 | 327 | 312 | 19.65 | 3.772 |
| 6 | 2.785 | 191107 | 725 | 238 | 0.378 | 2019 | 226 | 1360 | 14.01 | 3.703 |
| PCC with Score(E) | 1.000 | −0.470 | −0.792 | 0.240 | −0.927 | −0.525 | 0.571 | −0.467 | 0.378 | 0.615 |
| PCC with Score(S) | 0.615 | −0.186 | −0.341 | 0.357 | −0.663 | 0.094 | 0.330 | −0.398 | 0.808 | 1.000 |
Table 4.
The composition and scores of the six slide decks.
| Page Category/Slide Deck ID | #1 | #2 | #3 | #4 | #5 | #6 |
|---|---|---|---|---|---|---|
| Upper left title | 0 | 2 | 2 | 0 | 2 | 0 |
| Centered title | 3 | 0 | 0 | 1 | 0 | 6 |
| Image with upper left title | 0 | 3 | 2 | 0 | 2 | 0 |
| Image with centered title | 5 | 0 | 0 | 0 | 0 | 0 |
| Image with instructions | 0 | 0 | 4 | 1 | 1 | 0 |
| Scattered text | 4 | 4 | 0 | 0 | 0 | 0 |
| Centralized text | 0 | 1 | 2 | 3 | 2 | 4 |
| Little centralized text | 0 | 0 | 0 | 3 | 1 | 1 |
| Total page number | 12 | 10 | 10 | 8 | 8 | 11 |
| Score(E) | 3.286 | 3.214 | 3.143 | 3 | 2.929 | 2.785 |
| Score(S) | 3.939 | 4.085 | 3.825 | 4.069 | 3.772 | 3.703 |
Table 5.
The page composition table of the high score and low score works.
| Page Category | High Score Works | Low Score Works |
|---|---|---|
| Upper left title | 2 | 2 |
| Centered title | 3 | 6 |
| Image with upper left title | 3 | 2 |
| Image with centered title | 5 | 0 |
| Image with instructions | 0 | 1 |
| Scattered text | 8 | 0 |
| Centralized text | 1 | 6 |
| Little centralized text | 0 | 2 |
| Total | 22 | 19 |
Table 6.
The relationship between the page categories and eye movement indicators.
| Page Category | FD | FAD | FN | FTP | MTTF | SDOF | WC | FS |
|---|---|---|---|---|---|---|---|---|
| Upper left title | 629,60 | 461 | 137 | 0.3559 | 1325 | 401 | 5 | 50.8 |
| Scattered text | 214,363 | 419 | 508 | 0.3664 | 1155 | 404 | 127.5 | 38.6 |
| Image with upper left title | 692,00 | 438 | 155 | 0.3704 | 1193 | 381 | 3.4 | 49.5 |
| Image with centered title | 470,53 | 452 | 103 | 0.3932 | 1157 | 259 | 3.8 | 47.5 |
| Centered title | 683,93 | 477 | 143 | 0.4013 | 1246 | 258 | 9.5 | 41.3 |
| Image with instructions | 124,824 | 469 | 263 | 0.4381 | 1076 | 397 | 61.3 | 13.5 |
| Little centralized text | 128,268 | 506 | 246 | 0.4584 | 1132 | 262 | 52.8 | 16.8 |
| Centralized text | 360,274 | 542 | 642 | 0.5107 | 1070 | 234 | 198.8 | 15.4 |
Table 7.
The relationship between the three significant page categories and eye movement indicators.
Table 7.
The relationship between the three significant page categories and eye movement indicators.
| Page Category | FD | FAD | FN | FTP | MTTF | SDOF | WC | FS |
|---|---|---|---|---|---|---|---|---|
| Scattered text | 214363 | 419 | 508 | 0.3664 | 1155 | 404 | 127.5 | 38.6 |
| Image with centered title | 47053 | 452 | 103 | 0.3932 | 1157 | 259 | 3.8 | 47.5 |
| Centralized text | 360274 | 542 | 642 | 0.5107 | 1070 | 234 | 198.8 | 15.4 |
© 2020 by the authors. Licensee MDPI, Basel, Switzerland. This article is an open access article distributed under the terms and conditions of the Creative Commons Attribution (CC BY) license (http://creativecommons.org/licenses/by/4.0/).
Share and Cite
MDPI and ACS Style
Liu, X.; Zhang, X.; Chen, W.-W.; Yuan, S.-M. Eye Movement Analysis of Digital Learning Content for Educational Innovation. Sustainability 2020, 12, 2518. https://doi.org/10.3390/su12062518
AMA Style
Liu X, Zhang X, Chen W-W, Yuan S-M. Eye Movement Analysis of Digital Learning Content for Educational Innovation. Sustainability. 2020; 12(6):2518. https://doi.org/10.3390/su12062518
Chicago/Turabian StyleLiu, Xiaolong, Xuebai Zhang, Wei-Wen Chen, and Shyan-Ming Yuan. 2020. "Eye Movement Analysis of Digital Learning Content for Educational Innovation" Sustainability 12, no. 6: 2518. https://doi.org/10.3390/su12062518
Note that from the first issue of 2016, this journal uses article numbers instead of page numbers. See further details here.