Article

Demand Response Economic Assessment with the Integration of Renewable Energy for Developing Electricity Markets

by
Abdul Conteh
1,2,*,
Mohammed Elsayed Lotfy
1,3,
Oludamilare Bode Adewuyi
1,
Paras Mandal
4,
Hiroshi Takahashi
5 and
Tomonobu Senjyu
1
1
Department of Electrical and Electronics Engineering, University of the Ryukyus, Okinawa 903-0213, Japan
2
Electricity Distribution and Supply Authority (EDSA), Freetown 00232, Sierra Leone
3
Department of Electrical Power and Machines, Zagazig University, Zagazig 44519, Egypt
4
Department of Electrical and Computer Engineering, University of Texas, El Paso, TX 79968, USA
5
Fuji Elctric Co., Ltd., Tokyo 141-0032, Japan
*
Author to whom correspondence should be addressed.
Sustainability 2020, 12(7), 2653; https://doi.org/10.3390/su12072653
Submission received: 19 February 2020 / Revised: 18 March 2020 / Accepted: 23 March 2020 / Published: 27 March 2020
(This article belongs to the Collection Power System and Sustainability)

Abstract

:
Electricity disparity in sub-Saharan Africa is a multi-dimensional challenge that has significant implications on the current socio-economic predicament of the region. Strategic implementation of demand response (DR) programs and renewable energy (RE) integration can provide efficient solutions with several benefits such as peak load reduction, grid congestion mitigation, load profile modification, and greenhouse gas emissions reduction. In this research, an incentive and price-based DR programs model using the price elasticity concepts is proposed. Economic analysis of the customer benefit, utility revenue, load factor, and load profile modification are optimally carried out using Freetown (Sierra Leone) peak load demand. The strategic selection index is employed to prioritize relevant DR programs that are techno-economically beneficial for the independent power producers (IPPs) and participating customers. Moreover, optimally designed hybridized grid-connected RE was incorporated using the Genetic Algorithm (GA) to meet the deficit after DR implementation. GA is used to get the optimal solution in terms of the required PV area and the number of BESS to match the net load demand after implementing the DR schemes. The results show credible enhancement in the load profile in terms of peak period reduction as measured using the effective load factor. Moreover, customer benefit and utility revenues are significantly improved using the proposed approach. Furthermore, the inclusion of the hybrid RE supply proves to be an efficient approach to meet the load demand during low peak and valley periods and can also mitigate greenhouse gas emissions.

1. Introduction

Access to a sustainable, affordable, and reliable source of energy is key to the socio-economic advancement of Africa. The electricity access rate for sub-Saharan Africa reported as 62.5%, in 2017, with millions remaining connected to unreliable networks that cannot satisfy their electricity needs. A significant portion of this region has electricity access rates estimated at 20%, and two out of three people lack access to modernized energy services [1,2]. The electricity access rate in sub-Saharan Africa improved from 43% in 2016 and it is estimated that it will improve by 59% in 2030. Nonetheless, a significant amount of the populace is without access to electricity. Of the 674 million people that will be without access to electricity in 2030, 90% are in sub-Saharan Africa [3]. Sub-Saharan Africa is plagued with the problem of deficiency in electricity supply and excessive demand in both grid-connected and off-grid regions; often, consumers are connected to an unreliable grid that does not satisfy their daily energy service needs. Despite being connected, some consumers cannot afford to consume electricity due to high energy bills. Moreover, the levels of service interruption are appalling, with no option but to hinge on diesel generators with a high cost of operation. Meeting the electricity disparities in sub-Saharan Africa is a multi-dimensional challenge with significant implications on how to frame the region’s energy predicament.

1.1. Sierra Leone’s Energy Sector Situation

Sierra Leone, located on the coast of West Africa, flanked by Liberia, Guinea, and with an estimated population of 7 million, has experienced significant economic growth in recent years. The disastrous outcome of the civil war, crippling effects of dwindling global demand of iron ore and the outbreak of the Ebola epidemic are still present. The energy requirement of the country is immensely under-served, with 20.3% having access to electricity, with the capital city of Freetown accounting for a significant amount of the demand [4,5]. In [6], the authors highlighted the current state-owned installed generation capacity of 130 MW across the country and the projected load demand for the industries, commercial, and residential consumers. Inadequate motivations for investment in large-scale renewable energy technologies is highlighted as a significant obstacle to Sierra Leone’s sustainable energy development.
In order to mitigate the immediate power challenges in the capital Freetown and to ensure affordable and sustainable power supply, the government recently renegotiated the electricity tariffs of a 30 MW offshore floating power plant, with an independent power producer (IPP) (karpower) from USc$19.596/kWh to 16.4 USc/kWh resulting in an estimated US$9 million annual savings [7]. The electricity sector in Sierra Leone is severely challenged with the problem of low network capacity, coupled with high system losses (commercial and technical) estimated at 35% in the distribution network. Heavy fuel oil thermal generating plants are required to supplement the current generation as a result of seasonal variations in hydropower generation, which often results in an imbalance between generation and load demand. The scale of the imbalance is highly seasonal, being far less in the raining season as the main hydropower provides 40 MW to the capital, Freetown, compared to less than 10 MW in the dry season. The mismatch in generation capacity and load demand has forced grid operators to issue emergency notifications for voluntary conservation response and load shedding, especially in the capital city of Freetown, which, in turn, has resulted in a substantial financial loss estimated at 15% (of annual sale) to the distribution authority [8,9]. Moreover, according to [9], in 2017, 32.6% of firms identified the country’s inadequate electricity generation to match with high load demand as a significant challenge in doing business in the country. In order to enhance the country’s energy demands, several intervention approaches are being explored. Notable among these is the unbundling in 2011 of the power sector by an act of parliament into two state-owned entities, namely, the Electricity Distribution and Supply authority (EDSA) and the Electricity Generation and Transmission Company (EGTC) [10]. Both have paved the way for IPPs and other Public-Private Partnerships (PPPs) to partner with the energy market in Sierra Leone.
However, the country’s energy sector remains severely challenged and requires more sustainable solutions. Modification to the Freetown load profile has long been recognized by policymakers at EDSA as an efficient technique to reduce the need for peak power generation units beneficially while meeting load demand in a planned transition to a carbon-constrained. The utilization of sustainable and reliable techniques such as the use of demand-side management (DSM) and RE injection scheme methodologies in order to meet the exponential growth in load demand of electricity in the country, is essential, especially in urban settlements. In [11], the authors evaluate various access techniques to electricity for Sierra Leoneans not connected to the grid in rural communities, and also highlighted set indicators in developing rural electrification approach and proposed the implementation of mini-grids for rural electrification as opposed to standalone systems and expansion of the existing grid. To reduce the mismatch in the load demand and generation in the capital city of Freetown, [12] proposed optimum sizing of a ground-based energy storage system and rooftop solar photovoltaic (PV) panels for government buildings. However, the authors did not consider, implementation of DSM methodology. Moreover, [13] assessed enhancing domestic energy services for pre-urban and rural off-grid communities in Sierra Leone and analyzed various PV systems on their cost-effectiveness in achieving improved energy services. One of the primary responsibilities of IPPs is to match generation and load demand economically and sustainably. A mismatch in load demand and generation capacity will jeopardize system performance. Promotion and execution of DR programs in the capital city of Freetown are one of the most feasible solutions to meet the growth in load demand requirements for the industries and domestic consumers.

1.2. Relevant Country-Wide Reports on DSM Implementation

In recent years, researchers have given prominent attention to various strategies and methodologies towards harmonizing the mismatch in load demand and generation reliability and sustainability. Some recent studies discussed micro-grid control schemes, smart microgrids security and overhead cranes using several theoretical models [14,15,16,17,18,19]. Demand response methodologies for economically reliable operation of a smart microgrid are gaining prominence in recent times. Demand response is a potential technique applied to achieve the demand and supply balance by having the consumers rather than suppliers control the amount of power supply needed. According to [20], the contribution of DR program in the US electricity markets improved by approximately 3% to a total of 27,541 MW in 2017 compared to 2016. Furthermore, as a result of the drop in peak load demand levels in 2017, the execution of DR to matching peak load demand also increased considerably from 5.3% in 2016 to 5.6% in 2017. The author in [21] proposed DR economic model, which illustrates the change in consumption pattern of individual consumers to maximize consumer utility constrained through periodic consumption or budget. Demand-side load management methodology that is efficient in controlling residential household load at minimum cost, such that consumer satisfaction is maximized is presented in [22] also in [23], Davide Caprino et al. exemplifies an approach to the peak load shaving, management, and modelling of household appliances using real-time scheduling algorithm analysis. The scheduling method realizes a load reduction by up to 46%. DR programs have been applied in some European countries, [24,25,26], and execution DR have proven their potential benefits. In Norway, distinct DR programs have been executed, with the aspirations of deferring the grid capacity expansion leading to a 10% decrease in peak demand achieved for the Oslo area. After the implementation of the DR, pilot studies confirmed that the execution of the DR programs reduced the peak load by 4.5 MW, which brought about 15% energy savings for commercial consumers [27]. Reference [28] highlights the execution of interruptible load DR program in Italy for large industries that resulted in 6.5% in peak load shedding during a system emergency. H.A. Aalami et al. in [29] proposed the execution of an interruptible load DR scheme for the Iranian load curve to alter the peak load to the valley and off-peak period using price elasticity concepts. The proposed methodology will enhance independent system (ISO) to apply suitable DR program which enhances the load profile and can also be welcomed by customers.
Moreover, similar work proposed [30] for the introduction of automatic interruptible load DR scheme for residential buildings in Singapore that enhanced DR management load curtailments. In [31], the authors evaluate the economic and the technical DSM potential in Nigeria for its various industrialization strata. According to the authors, the implementation of DSM could generate 7 billion USD cumulative savings with interruptible DR programs for more significant industrial consumers. Reference [32], proposed and developed an hourly model of electricity demand for 14 countries in West Africa; from 2016-2030 and takes into account the electrification rate, occupancy patterns, household appliances, climatic condition, amongst others. Seasonal electricity demand for non-residential, electricity access rates for rural and urban was considered in the forecast model. The results show a seasonal disparity in demand, notably higher during the dry season compared to the rainy season. Moreover, energy in West Africa is estimated to be five times in 2030 to that of 2016. Proper planning and execution of DR approaches could be a vital tool in closing the demand and supply gap. The literature in [33] reviews the electricity sector demand-side in Ghana. The author examined significant hypotheses; in essence, “the deregulation of the electricity process does not advance energy conservation.” Using the Stock and Watson dynamic, the author demonstrated that deregulating electricity prices in Ghana had influenced practices that are more harmonious with energy conservation enhancements. Moreover, in [33], simulation results demonstrated that more economic enhancement would likely jeopardize energy conservation, notably in the industrialized sector than the domestic sector. Additionally, the studies in [28,34,35,36,37] examined the significant implementation of DR scheme, RE integrations, and smart grid advanced metering infrastructure amongst others for electricity market.

1.3. Motivation for Research and Research Contribution

Power sector policymakers in several countries, especially developing countries like Sierra Leone, are faced with severe financial constraints to improve electricity access rate sustainably and reliably. Prioritizing and execution of the DR programs and incorporating RE technologies to match the constant peak load demand at a low-cost is becoming an increasingly widespread methodology, as reported in the literature. Furthermore, the implementation of DR technique for load curve levelling has been verified has a proactive approach to get energy consumers engaged in preventing detrimental power system scenarios that can jeopardize network reliability. Moreover, it could contribute to energy security and environmental sustainability while providing a secure pathway to a sustainable economy.
In this research, a two-stage approach that involves the strategic combinations of several DR models, alongside the introduction of RE sources, towards modifying the customers’ demand profile is investigated for Freetown, Sierra Leone electricity market. The research objective is directed towards minimizing the disparity between the system load demand and the total available generation with minimum need for additional generation and also control the usage patterns of maximum energy demand users, which consumed the bulk of the generated power economically. The performance of the proposed model is analyzed based on the effects on the reliability and cost-effectiveness of the power system using the Freetown (Sierra Leone) distribution network. The proposed approach is an extension of the authors’ earlier work [38]; in stage-I, time-based, incentive-based, and the combination of incentive and time-based DR programs are executed using the price elasticity concept to meet the peak load demand and the modification to the load profile characteristics. Consequently, the strategic selection index (SSI) is employed to prioritize and implement relevant DR response program that is efficient from the IPPs and customer perspective and also for the most effective load profile modification. In stage II, hybridized RE technologies are included to meet the load deficit after the execution of the DR menu. Genetic Algorithm (GA) is utilized for hybridized RE infusion into the generation mix with the reduction in maintenance and operational cost as the objective function concurrently with greenhouse gas emission reduction. The overall significance of this study is to assist in implementing technical and economic evaluation to policymakers for the implementation of DSM programs and the introduction of hybrid RE technologies into the generation mix for Sierra Leone’s capital city (Freetown).

2. STAGE I: Implementation of Demand-Side Management (DSM)

DSM is a powerful energy-efficient technique that reduces or modifies the overall consumption and energy usage pattern. In the capital city Freetown, disruptions in the power supply are recurrent and leads to constant challenges to the grid and system reliability, especially during the dry season due to the considerable drop in the hydropower generation capacity. Matching the demand and supply is a massive challenge to the distribution authority. DSM is employed to reduce the mismatch in demand and supply, thereby facilitating further sustainable and less expensive funding situations. As a result of the complex characteristics of various consumers, each having their electricity usage, execution of pertinent DSM programs is highly beneficial and can be deployed to harmonize the supply and thus enhance the grid network capacity efficiently [39]. DSM strategies such as DR enable the modification of load profiles by getting end-users to modify their consumption patterns during system constraints in order to match the generation supply. The United States Federal Energy Regulatory Commission (FERC) staff report [20] categorized DR programs regarding their operational mechanism into two broad categories (time-based and incentive-based DR programs). In the time-based program (TBP), the price of electricity in different periods are varied. Penalty or incentives are not considered for these programs. In this research, TBP considered include, Time of Use (ToU), real-time pricing (RTP), and critical peak pricing (CPP). In the incentive-based program (IBP), incentive prices are structured by the utility provider, and the customer is notified [40]. If the customers find the offered incentives prices lucrative, they will react or contrarily ignore the incentive given by the utility. IBP considered in this research include: Interruptible load (IC), load as capacity resource, direct load control (DLC), and emergency demand response (EDRP). Additional details on demand response can be found in [20,41,42].

2.1. Overview of the Proposed DSM Scheme and Analytical Modelling

Customers participating in the incentive-based DR program are required to predetermined load curtailment level when notified by the utility through advance smart metering notification whenever the system reliability is compromised. The successful execution of these programs depends on the infiltration level of the advanced smart meter system. Penalties will then be employed, for customers who failed to comply with the contractual agreement with the utility provider within a maximum annual interruption recurrence of 100 h. In this research, the IBP is considered suitable for maximum demand users (MDI). In this research, the formulation and modelling of pertinent incentive-based and time base DR programs and the impact on the Freetown load profile are outlined below. Penalties, incentives, and customer benefits are also investigated in system formulation. This research is an augmentation of earlier work presented in [38].

2.1.1. Dr Elasticity Model

According to economic principles, keeping other factors constant, a surge in energy prices will decrease its demand. Furthermore, economic principles described consumers’ responsiveness to price changes as a measure of price elasticity [43]. Elasticity can be defined as the responsiveness in demand for variation in price [43,44].
E = h h / p p
where, E = coefficient of elasticity, p = electricity price and h = load demand.
The consumers’ response to variations in the price of electricity is constrained to time considered. For instance, an increment in the price of electricity will reduce the demand in period i but may increase the demand in another period j. A negative “self-elasticity” is applied to represent the first effect and a positive “cross-elasticity” the second [45].
E i i = h h / p p 0 E i j = h h / p p 0
where E i i is the coefficient of self-elasticity, E i j is the coefficient of cross-elasticity.

2.1.2. Modelling of Proposed Single and Multi-Period Elastic Load

Customer benefits, penalty, and incentive remuneration are crucial motivating factors for the customers to modify or curtail their initial consumption h 0 i value to the modified demand h i at period i, based on the predetermined contract with the utility provider [29,38].
h i = h i - h 0 i
Incentive revenue for consumers participating in this DR program during the period i is as defined by Equation ( 4 ) .
m n ( h i ) = k i . ( h i - h 0 i )
where the incentive rate ($/kWh) = k i , incentive payment ( $ ) = mn ( h i )
In a scenario whereby the participating customer fails to comply with the provision of the contract agreement, the customer must make the imposed penalty payments.
Z n ( h i ) = g i · ( P ( i ) - [ h i - h 0 i ] )
where Z n is the imposed customer penalty cost ($), g i is the penalty rate ($/kWh) and P ( i ) is DR program level of contract agreement (kWh) during the same period i. Hence, the benefit of customer C b for period i is as shown in Equation ( 6 ) below.
C b = B ( h i ) - h ( i ) · p ( i ) + m n ( h ( i ) - Z n ( h ( i ) )
where p ( i ) and B ( h i ) are the electricity price ($/kWh) and customer income ( $ ) in i period, respectively. Assuming the customers prefer demand level h i to maximize their benefits after the execution of DR program then, C b h i = 0 is equated to zero thereby maximizing customer benefit.
C b h i = B ( h i ) h i - ρ o ( i ) + m n h i - Z n h i = 0
So,
B ( h i ) h i = p ( i ) + k i + g i
The benefit function is a quadratic function as shown below;
B ( h i ) = B 0 ( i ) + ρ o ( i ) [ h i - h 0 i ] 1 + h i - h 0 i 2 E i . h 0 i
where B 0 ( i ) = benefit price at nominal value, ρ o ( i ) = electricity prices at nominal value. Differentiating Equation (9) then solving for B h i and substitute into Equation (8) gives;
ρ ( i ) + k i + g i = ρ o ( i ) ( i ) 1 + h i - h 0 i E i . h 0 i
Customer’s utilization is as expressed below;
h i = h 0 i 1 + E i i . ρ ( i ) - ρ o ( i ) + k i + g i ρ o ( i )
From Equation ( 11 ) , h i and h 0 i remain the same if the electricity cost prevails the equivalent without considering incentive and the penalty after the execution of the DR program.

2.1.3. Multi-Period Load Program Modelling

The cross elasticity E i j , in the multi-period is calculated, for the ith period in considering all other periods applying the linearity assumption shown below [29,38];
h i p j : constant for i , j = 1 , 2 , 3 , 4 . . . . 24
Moreover, a linear correlation in demand and price;
h i = h 0 i + i = 1 i j 24 E i j . h 0 i ρ o ( j ) . ρ ( j ) - ρ o ( j ) } constant for i , j = 1 , 2 , 3 , 4 . . . . 24
It follows that the multi-period including penalty and incentive model can be expressed as given below;
h i = h 0 i 1 + i = 1 i j 24 E i j ρ ( j ) - ρ o ( j ) + k j + g j ρ o ( j )
Merging Equations ( 11 ) and ( 14 ) will result in a responsive and economic load model as shown below;
h i = h 0 i 1 + E i i . ρ ( i ) - ρ o ( i ) + k i + g i ρ o ( i ) + i = 1 i j 24 E i j ρ ( j ) - ρ o ( j ) + k j + g j ρ o ( j )
Equation ( 15 ) shows the customer maximum benefit in the 24 h period while signed to this DR program.

2.2. Demand Response Attribute Selection

Execution of DR programs enhances grid reliability. Various DR programs will have distinctive impacts on load profile attributes and market efficiency. However, it is imperative for IPPs’ system operators to choose and execute related DR program, which yields an efficient market value. However, in achieving the objectives, IPP analyses different strategies such as load factor enhancement, energy consumption, peak to valley reduction, customer benefits, utility revenue, incentives, etc. On this premise, IPP prioritizes these situations by employing the Strategy Index (SI) and Strategy Success Index (SSI), as shown in the equations below [46,47].
S I = i = 1 24 S t 1 ( i ) y 1 S t 2 ( i ) y 2 . . . S t m ( i ) y m
S I = i = 1 z S I ( i ) i = 1 z S I ( i ) ( m a x )
In Equation (16), S t m ( i ) designates the performance value mth attribute for each alternative in the ith and z denotes the period under study. Equation (16), y m depicts the weight of the mth attribute.
SSI in Equation (17), denotes the normalized value of the SI factor. The higher the SSI coefficient, the better the execution of DR programs. On this background, the IPPs prioritize distinct DR programs due to their preferences. In this research, the effectiveness of different DR programs and indices are being evaluated in Table 1 and Table 2.

3. Stage-Ii: Assessment of Renewable Energy (RE) Introduction

Power system resiliency centers on averting interruption in electricity supply whiles meeting the load demand and, in the event of an outage, restoring power supply as quickly as possible while mitigating the consequences of the outage. Network resiliency and supply reliability are of high priority for IPPs as a result of experiencing substantial financial loss due to power interruptions. The conventional approach for providing power backup during system downtime is diesel generators. However, in recent times, several RE technologies have started to gain significant roles in energy resiliency as a result of their zero-greenhouse gas emission intensity. There is an extensive backing for the use of hybridize grid-connected RE technologies, notably the solar Photovoltaic (PV) and battery energy storage systems (BESS); this provides electricity without producing any greenhouse gas emissions. RE sources have significant potential to meet current electricity demands [48]. Harnessing these to meet load demand relies on the cost and effectiveness of the technology, which is continually improving. Hence there is a continuously decreasing costs per peak kilowatt and per kWh of RE technology at the source.
In this study, the DSM approach employed when the diesel generating units in the network fails to match the required load demand after a pertinent DR program has been executed, and the RE technology has been injected. Figure 1 shows the system configuration for STAGE II analysis. Energy from the solar generators or grid power may be stored when there is a surplus generated PV power or when the cost of electricity from the grid is efficient. It is worthy to note that RE sources are being utilized in the low peak and valley periods.

Output of Pv Array

The output power in the low peak and valley by the PV panel during period i presented as follows;
P V o u t = η P V . A P V . R ( i )
where P V o u t depicts the output power of PV, η P V = PV panels efficiency, A P V = area occupied by PV panels in m 2 and K ( i ) = solar radiation during period i in kW/m 2 .

Battery Energy Storage System (Bess) Dynamics

Thermal generating unit aggregated power P z and that of PV panel output in period i is as follows;
P x ( i ) = P p v ( i ) + P z ( i )
where P x is the summation of the generated power. From Equation (17) earlier, if the sum generated power fails to match the load demand h at a given period i, it signifies that the battery state of charge (SoC) at period i with the efficiency of the inverter η i n v is:
P x ( i ) h ( i ) η i n v
At any given period, i when there is an excess generation from the thermal and PV, BESS can be charged. The state of charge is calculated as follows [38];
S o C ( i ) = S o C ( i - 1 ) ( 1 - β ) + P x ( i ) - h ( i ) η i n v η b a t
The S o C s ( i ) , at the end of the period i, as a function of its state of charge at the preceding period of the charging or discharging that took place during the period i . where S o C ( i ) is the state of charge, β is the self-hourly discharge rate and η b a t battery charging efficiency.
S o C ( i ) S o C m a x
where S o C m a x is 80% of the overall capacity of the battery bank. In situations wherein P x ( i ) h ( i ) η i n v , hence there is inadequate generation capacity from, i.e., thermal and PV, the load demand will be satisfied by the BESS. Throughout the discharging period, the S o C is as shown below;
S O C ( i ) = S O C ( i - 1 ) ( 1 - β ) + h ( i ) η i n v - P x η d i s
where η d i s is the battery discharge efficiency
The state of charge must be above the minimum S o C m i n
S o C ( i ) S o C m i n
Hence the minimum state of charge is 20% of the cumulative capacity of the battery bank and in Table 3.

4. Case Study, Simulation Results, and Discussion

In order to assess the impact of incentive and time-based DR model, the proposed scheme is applied to Freetown load network demand for December 2017, as shown in Figure 2. The average electricity price retailed by EDSA and the Ministry of Energy (MoE) in 2018 was 18.76 USc/kWh [7,49]. The load curve is segmented in intervals depending on the nature of the demand: Low peak (00:00–7:00), valley (8:00–14:00), and peak load (15:00–22:00).

4.1. Stage I: Implementation of DSM

DR program is executed to decrease the demand in peak load periods. Data was obtained through key informant interviews, sector policymakers, desk research, discussion with senior engineers at EGTC and EDSA. In this research, the implementation of the proposed scheme during system contingency is a 10% modification of the total load of the participating customer. Moreover, incentive and time-based DR programs are analyzed in this study. The incentive-based programs (group A) comprise; DLC, EDRP, CAP, and IC. Time-based programs (group B) comprise; ToU, CPP, RTP, and combination of ToU and CPP. Furthermore, in group C, the combination of incentive and time base programs are investigated. The price elasticity designated for customers who signed up for this program and incentive and penalty values are shown in Table 1 [38] and Table 2, respectively. Table 2 data was formulated by authors through key interviews of policymakers at EDSA, EGTC, Ministry of Energy, and the customers.
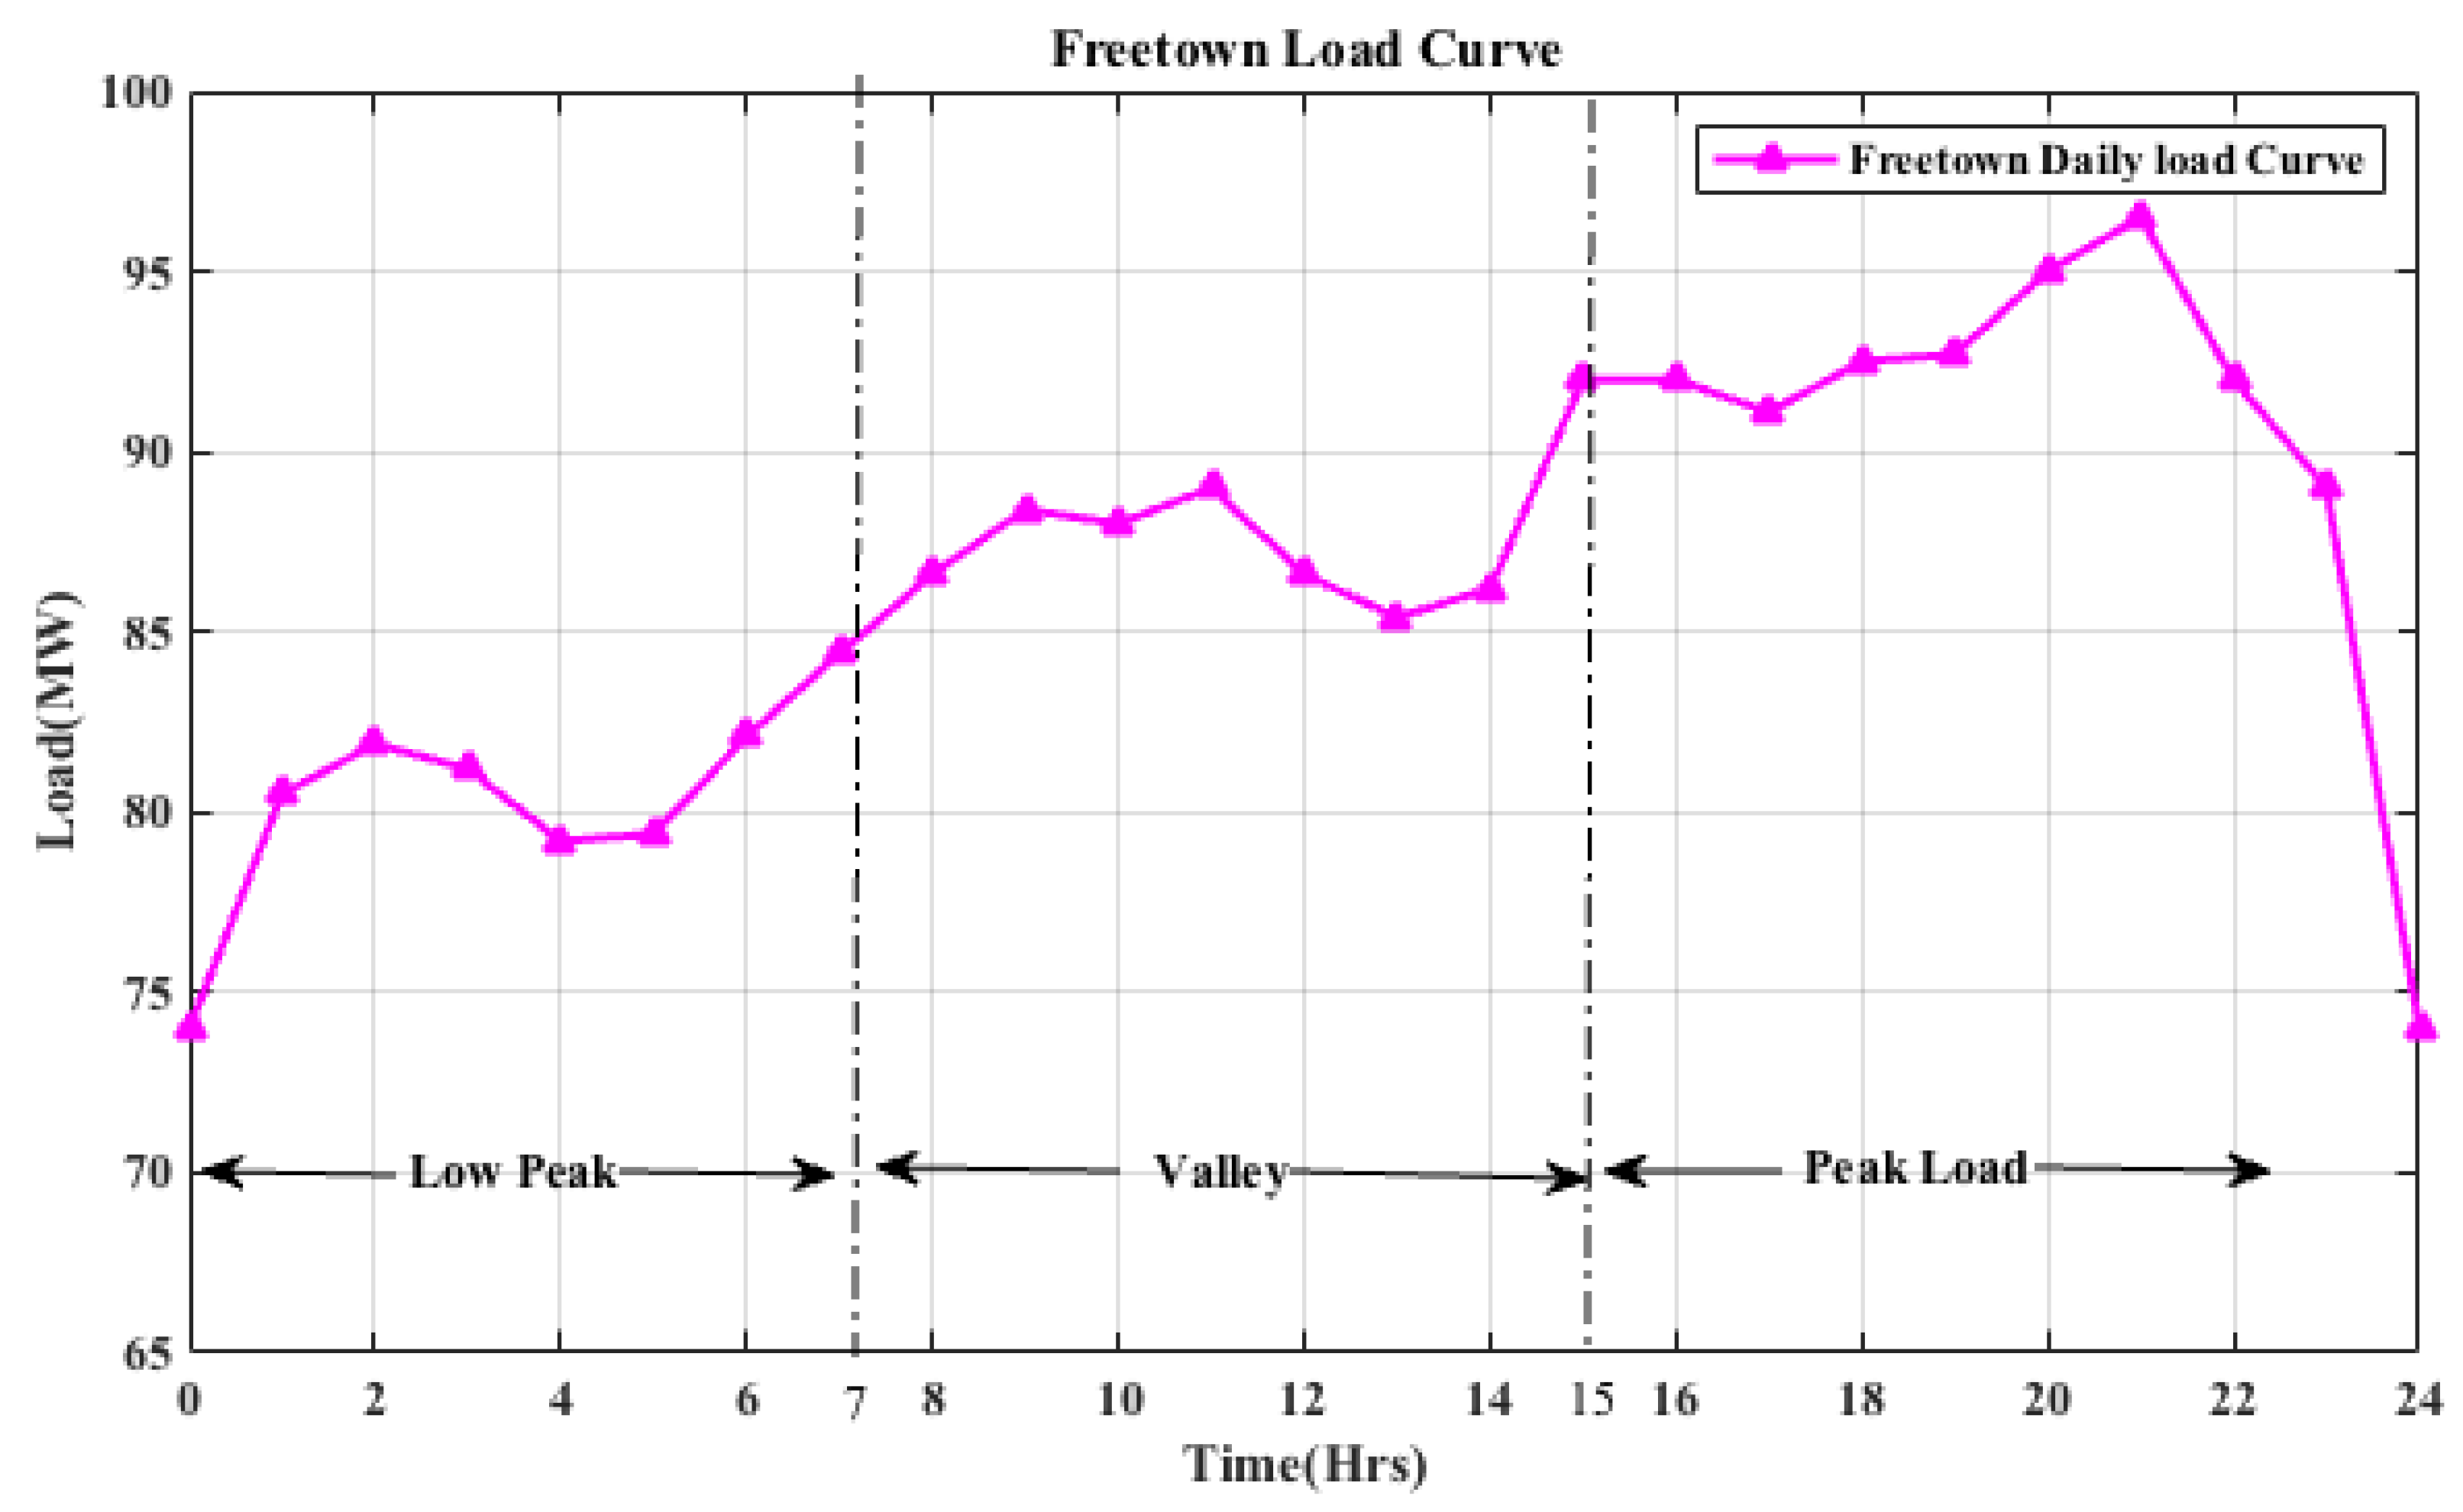
  • Initial load (base case): The peak load curve considered without the implementation of the proposed DR program in Figure 2 as shown in Table 5 and Figure 3, the peak load is 96.5 MW, the energy consumption of 2085.7 MWh, a load factor of 87%, which depicts the lowest after the execution of the proposed scheme with a maximum peak to valley reduction of 22.500 MW observed. These four indices improved after implementation of the proposed DR model, as subsequently illustrated in the following subsections. Moreover, in Table 4, customer bill and utility revenue of $377,050 are achieved concurrently.
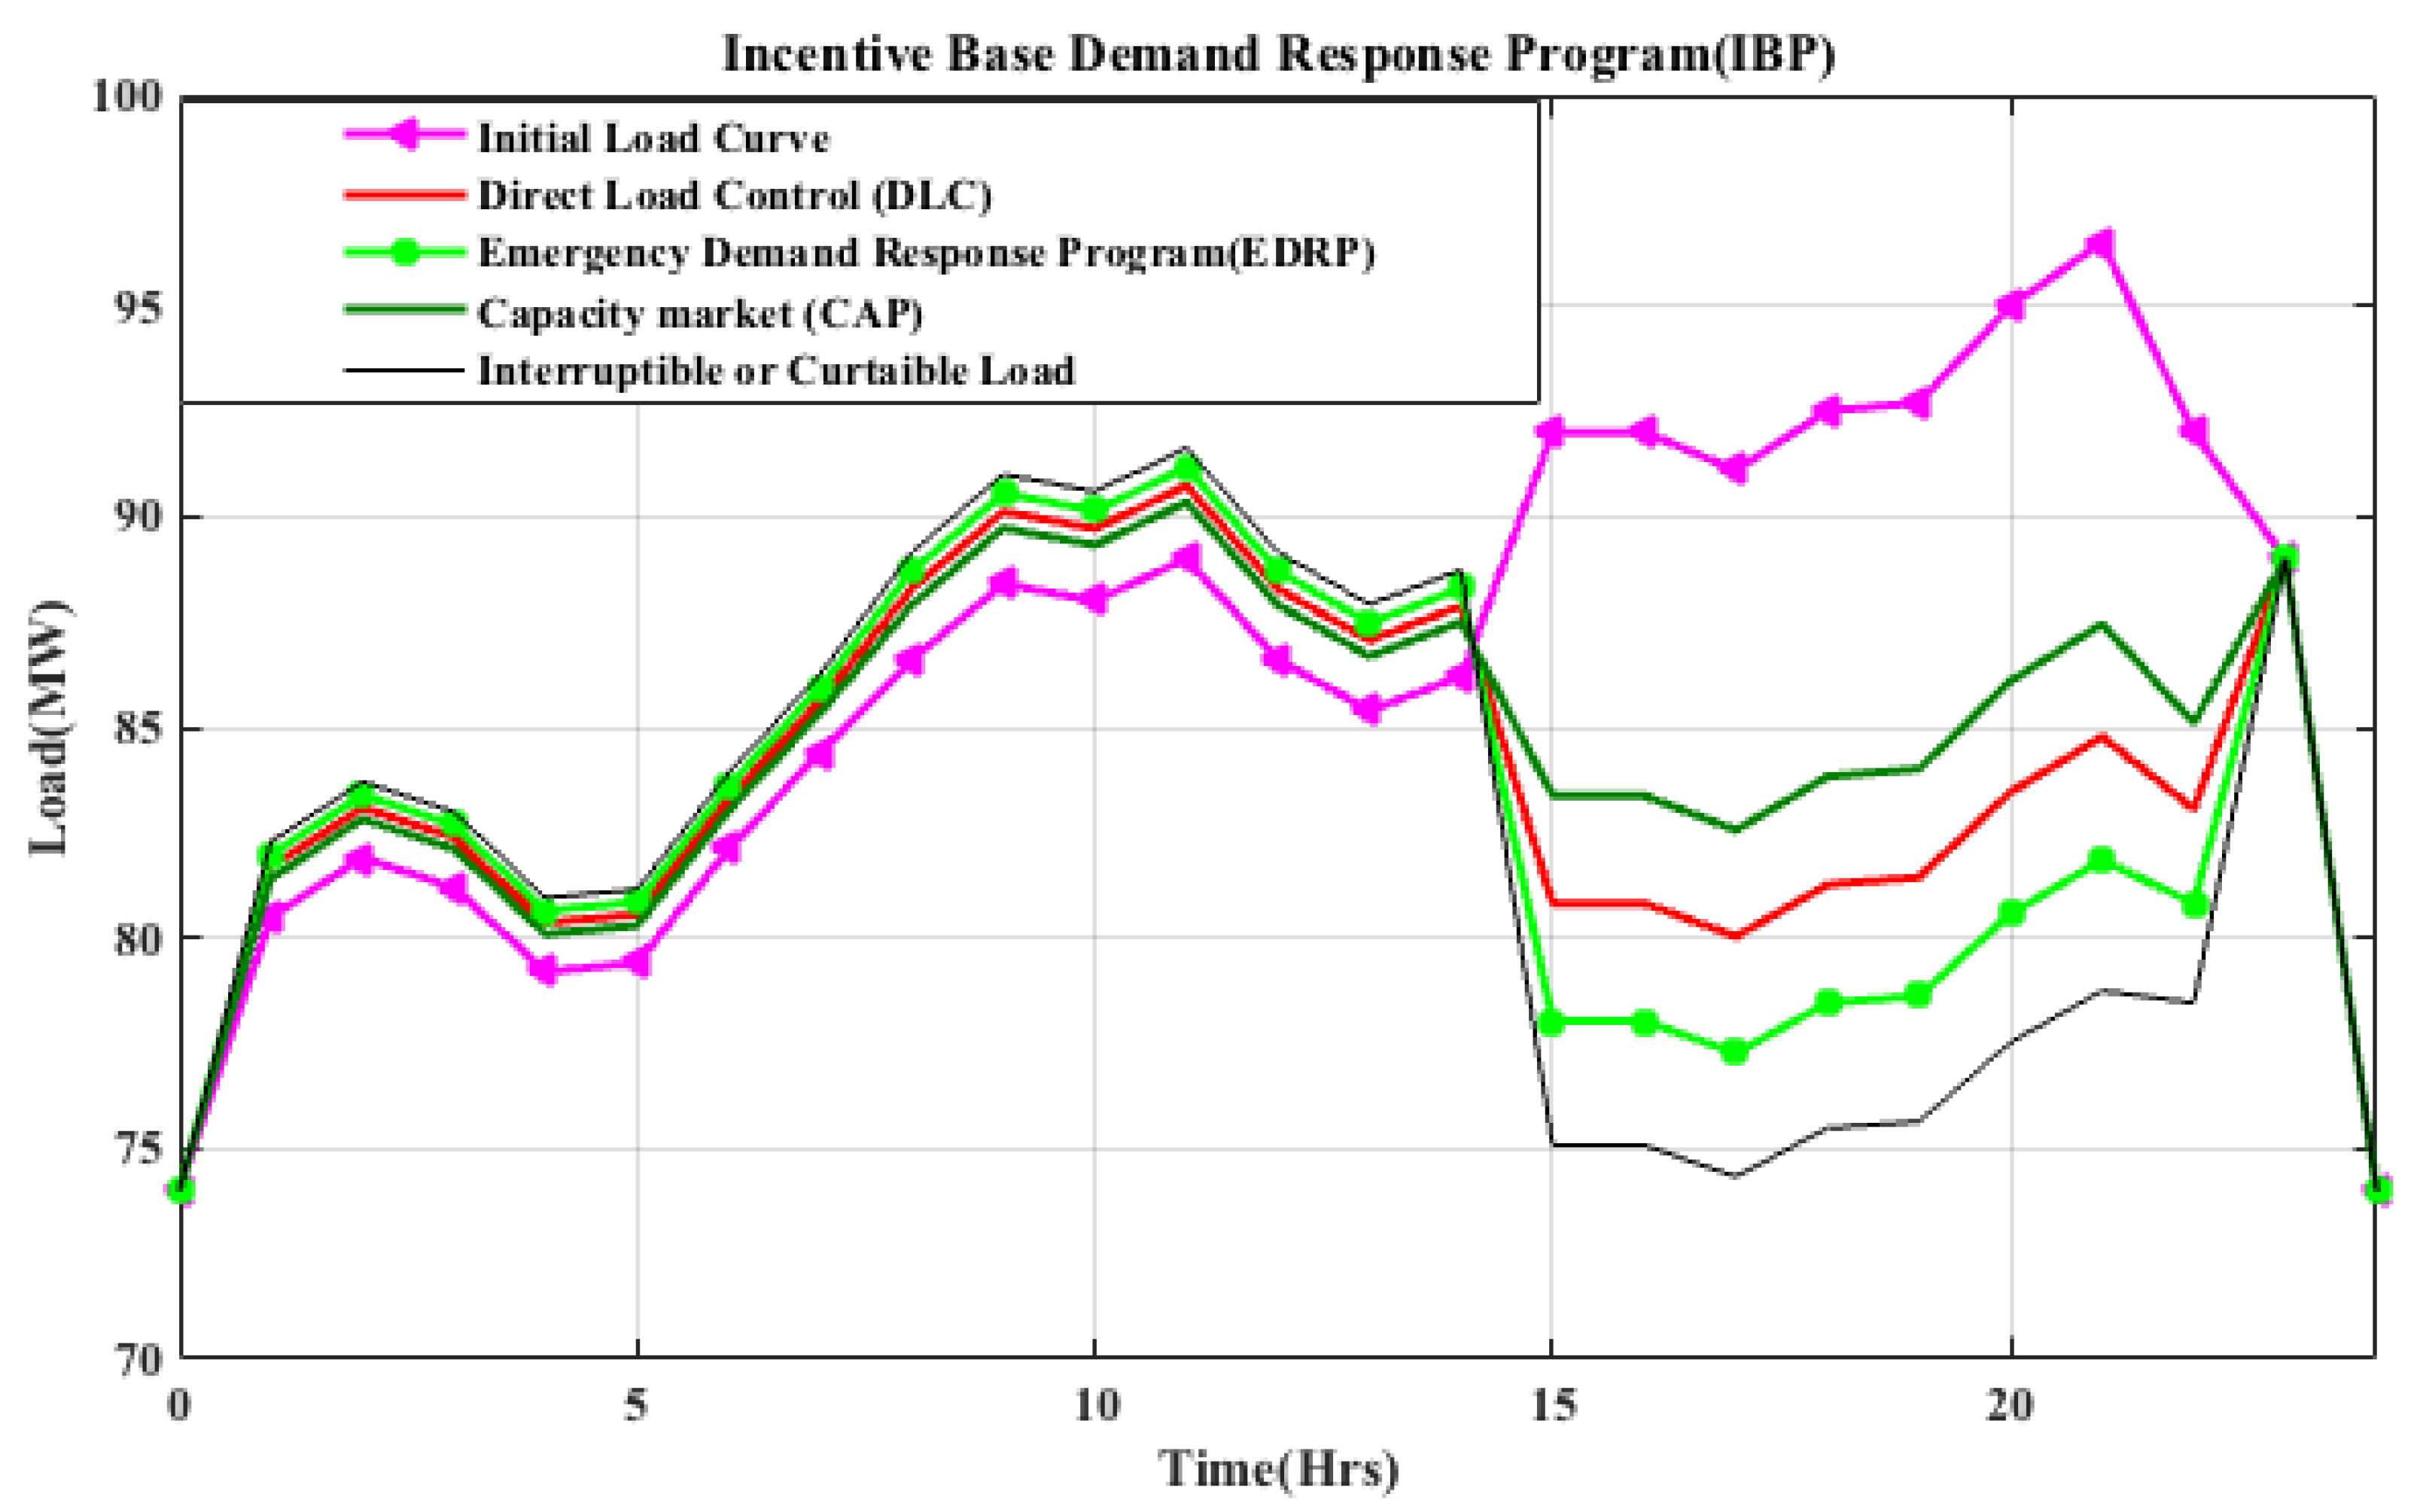
  • Program 1: In this case, the DLC program is implemented. From Table 2, the incentive and penalty are given as 22.79 Us/kWh and 0 Us/kWh, respectively. In this program, IPPs reward consumers for modification in their load profile with zero penalties for load curtailment failure. From Table 4 and Table 5 and comparing the results to the baseload; peak reduction of 90.73 MW (5.98% peak reduction) is achieved. Moreover, as shown in Figure 3, the load profile characteristics enhanced the customer’s benefit to $42,052 with a peak to valley and energy reduction by 25.6% (16.73 MW) and 3.37%, respectively.
  • Program 2: In this case, EDPR is executed, from Table 2 with incentive value of 22.79 Usc/kWh for load modification, with 0 Usc/kWh as the penalty, which implies that IPPs do not penalize customers for the violation if customers fail to modify the load agreed in the contract level. From the simulation results shown in Table 4 and Table 5, peak load reduction of 94.70 MW (1.86%), energy reduction of 0.50%, peak to valley reduction of 20.70 MW (8%), customer benefit of $ 3835 attained relative to the base case.
  • Program 3: In this program, CAP is implemented, and it assumed that 11 . 725 Usc/kWh is the penalty fee if customers fail to modify their load profile to a predetermined level during system contingency, and 5.8625 Usc/kWh as incentive fee for load profile alteration is employed by the IPPs. The result of executing this program is as shown in Figure 3. From the simulation results, shown in Table 4 and Table 5, 2066.60 MWh reduction in energy consumption, 0.92 % of energy reduction, 19.21 MW (14.6%) peak to valley reduction is observed as compared to the base case. Moreover, the load factor of 92 % and customer benefit of $ 6316 achieved.
  • Program 4: For this program, the IC program is implemented, as shown in Figure 3. The penalty and incentive values set as 11.725 Usc/kWh and 22.79 Usc/kWh, respectively. Enhancement in the load profile characteristic with customer benefit of $51,303, is shown in Table 4. Furthermore, 91.62 MW (5.06%) of peak load reduction, 5.19% energy reduction, and 17.620 MW (21.69%) peak to valley reduction were achieved as compared to the base case shown in Table 5 with an achieved load factor increment of 90%.
  • Program 5: As shown in Table 4 and Table 5 and Figure 4, the ToU program is implemented, with a reduction of 91.18 MW (5.51%) peak load, 0.48% energy reduction, 2075.6 MWh energy consumption, peak-to-valley by 17.18 MW (23.65%) as compared to the base case. Moreover, the customer benefit of $8835 was achieved.
  • Program 6: In this case, the CPP program implemented at 19, 20, and 21 h, respectively, as shown in Table 2. The results obtained after the execution of the program in Table 4 and Table 5, Figure 4, shows enhancement in the load profile with customer benefits of $ 25419. This program has the highest customers’ bills, and a peak load reduction of 2.09%, in correlation with other programs due to the high electricity price. Moreover, an increase in energy reduction to 0.03% is observed.
  • Program 7: As shown in Figure 4, the load profile characteristic is enhanced after the implementation of the RTP program. As shown in Table 4 and Table 5, the peak reduction of 93.02 MW (3.61%) and peak to valley reduction of 18.764 MW (16.6%) is realised in correlation with the base case. Moreover, there is an upsurge in the energy reduction of 0.17% and the load factor of 94%, which is the second-highest after the execution of the program as compared with the base case, with customer benefit of $11,079.
  • Program 8: In this program, the ToU and CPP are executed concurrently, as shown in Figure 4. From the simulation result shown in Table 4 and Table 5, a load factor of 94% and 19.53 MW (13.12%) peak to valley reduction achieved, which is the maximum. Moreover, the customer benefit increased to $27,460, and the energy consumption reduced by 2102.3 MWh (0.8%) in assessment with the base case.
  • Program 9: In this program, ToU and DLC are executed concurrently, as shown in Figure 5 with enhanced load profile characteristics. From the simulation results shown in Table 4 and Table 5, 90.20 MW (6.54%) peak load reduction, 16.20 MW reduction in peak to valley, 2.16% in energy reduction in comparison with the base case. Moreover, 94% load factor, which is the highest after the execution of this program and customer benefit of $29,409, was attained.
  • Program 10: In this program, ToU and EDRP are executed concurrently, enhancement in the load profile characteristics is obtained, as shown in Figure 5. Moreover, an increase in the customer benefit of $60,025, peak load reduction, and peak to valley load reduction is accomplished, as shown in Table 4 and Table 5.
  • Program 11: In this program, ToU and CAP executed simultaneously. As shown in Figure 5, the attributes of the load profiles are enhanced. As shown in Table 4 and Table 5, a peak load reduction of 90.67 MW (6.05%), reduction in energy consumption by 3.09% (2023.20 MWh), peak to valley reduction by 16.166 MW (28.1%) was achieved, while customer’s benefit increased by $29,901 was attained in comparison with the base case.
  • Program 12: The ToU with IC executed concurrently. The load attribute of the load profile improved. From the simulation results shown in Table 4 and Table 5, 4.74% (91.93 MW) peak load reduction, energy reduction by 5.68%, and peak load to valley reduction of 0.3 % (22.45 MW) in comparison with the base case. Moreover, this increased customer benefit to $70,048, which is the maximum in the execution of this program was achieved.

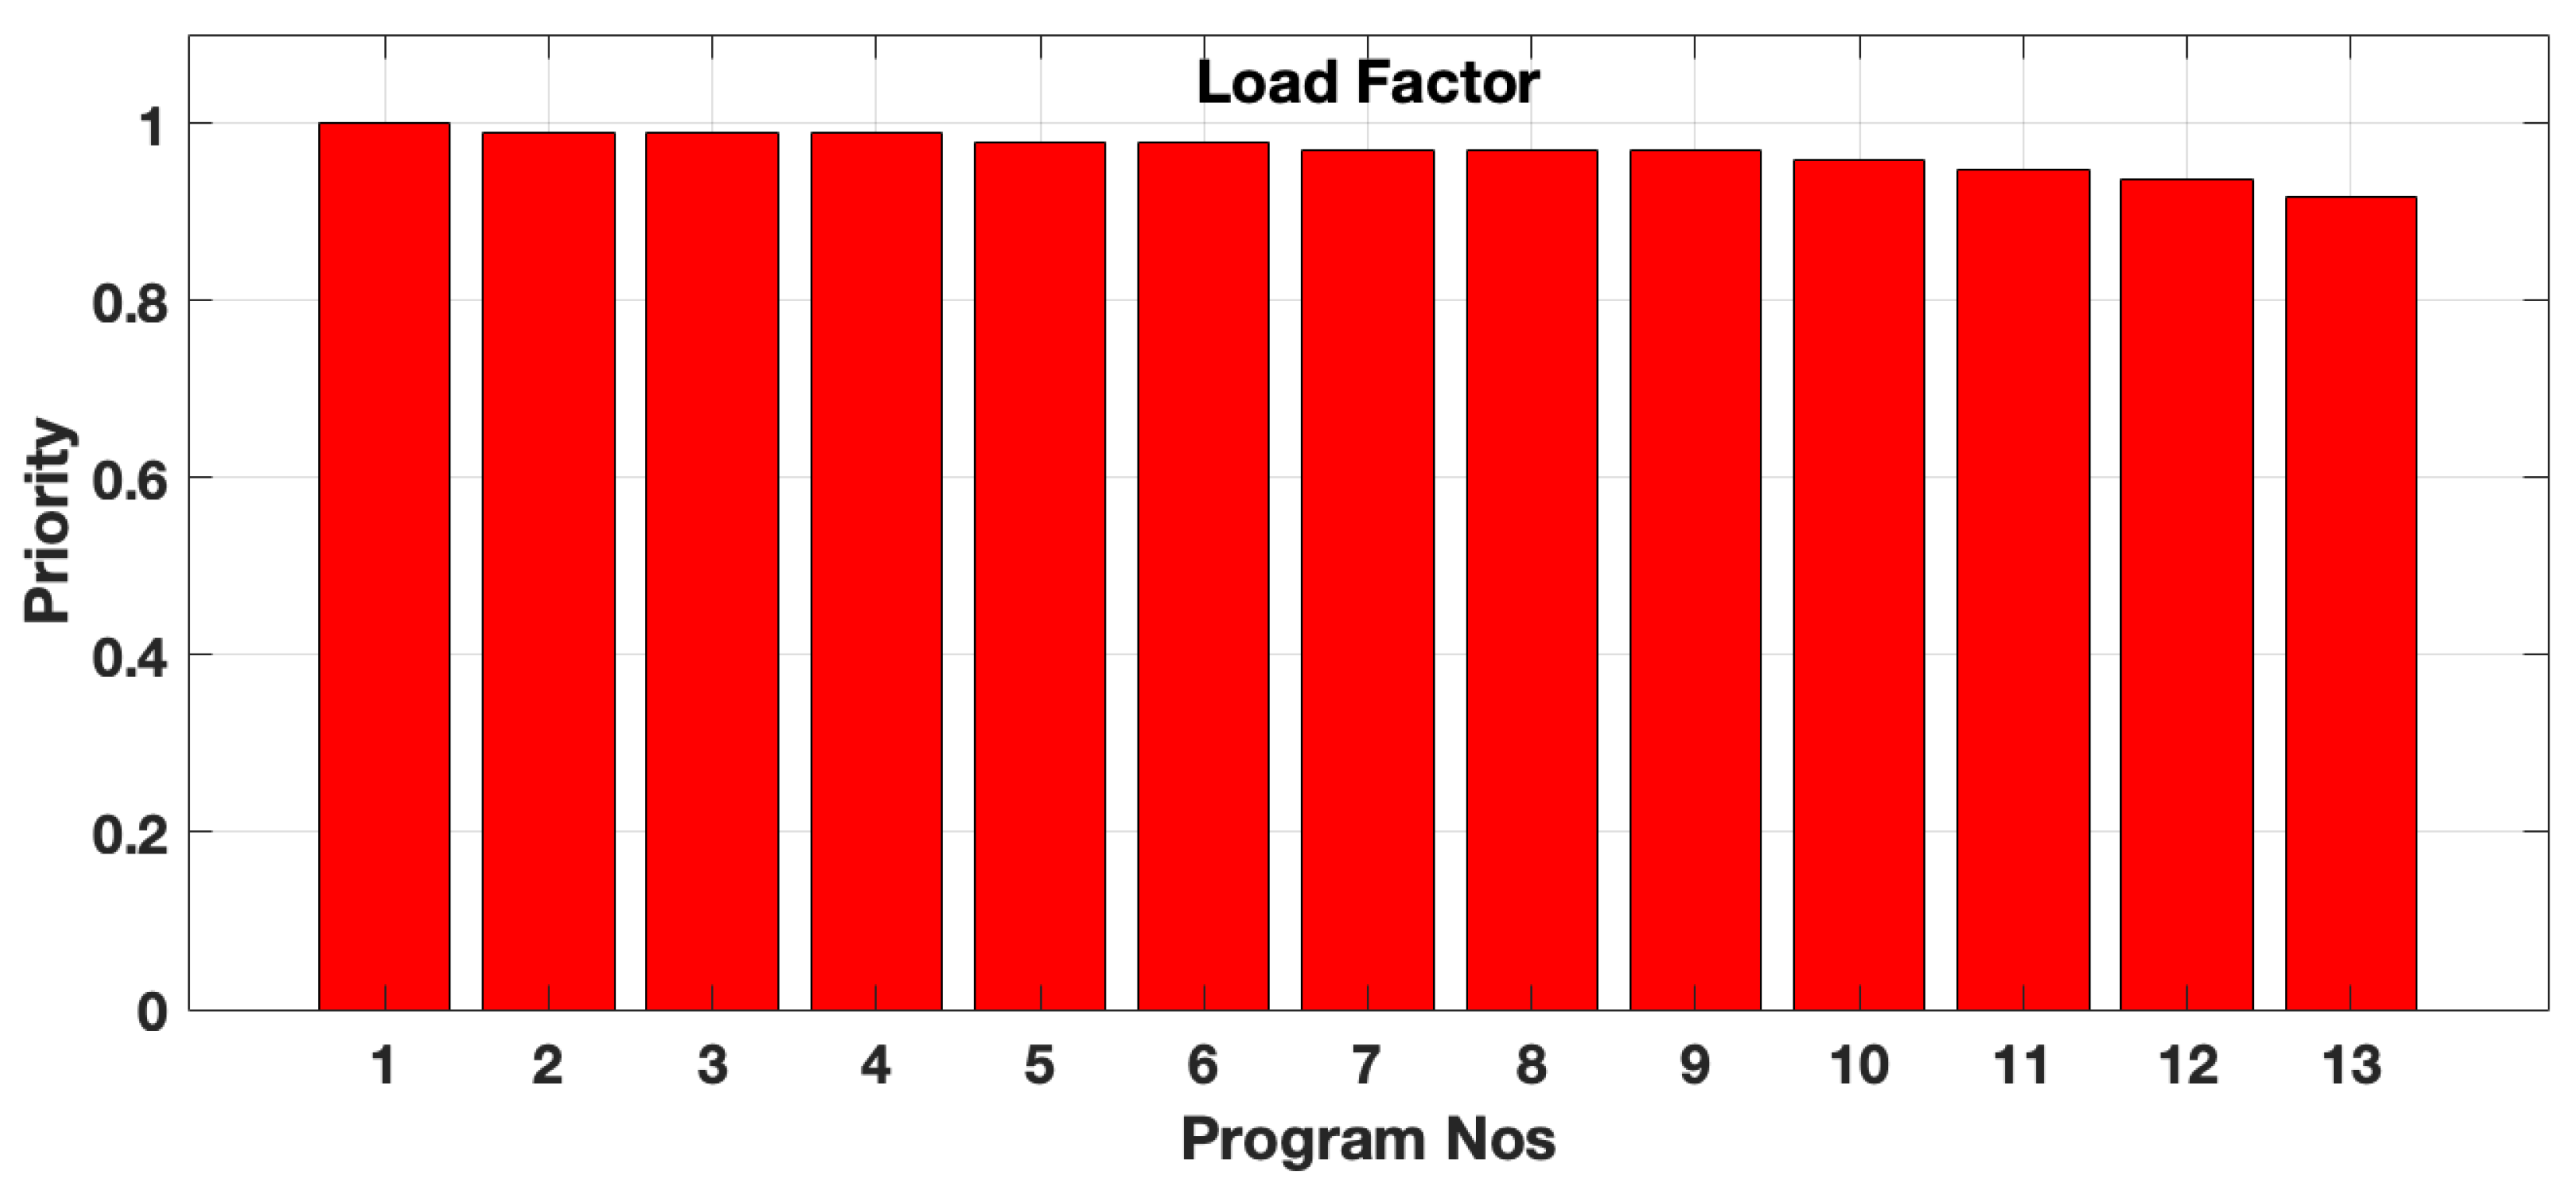
4.2. Prioritizing DR Program for IPPs and Customer Perspective Using SSI Analysis

In this study the strategic selection index, as shown in Equations ( 16 ) and ( 17 ) are used to prioritize and select appropriate DR programs, as shown in Table 6 and Figure 6, Figure 7 and Figure 8 from the IPPs and customer perspective. In addition to the revenue, the load factor has significant relevance to the IPPs evaluation, while the customer benefit is an essential motivating factor to the customer, as shown in Table 6. Usually, when constraints exist for execution of a specific program with higher demand, the IPPs can select distinct programs with a cost-effective requirement.
Table 6 shows the highest priority attained by simultaneous execution of time-based and incentive-based DR programs for both the IPPs’ and customers’ point of view. Evaluating the performance value of the different scenarios considering the customer benefits, IPPs revenue, and the load factor, using the SSI coefficient is considered to be 100% for the most effective program, as shown in Table 6 and Figure 6, Figure 7 and Figure 8. From the analysis shown in Table 6, the ToU/IC, CPP, and ToU proved to be most effective from the customer and IPPs’ perspective considering customer bills, IPPs revenue, and load factor, respectively.

Stage Ii: Introduction of Renewable Energy

Figure 9 exhibits the injection of RE technologies in the generation mix after the implementation of the DR scheme. The proposed model is assessed by utilizing a Genetic Algorithm (GA). GA is an approach to solve both unconstrained and constrained optimization problems based on natural selection. A key stage in GA applications is the definition of the objective (fitness) function, which is the function to enhance. In this instance, the fitness functions are the summation of the net disparity between the load and the generation, i.e., for peak load, valley, and low peak periods. Equation (25) below shows the fitness function ( F n x ) .
F n x = m i n i = 1 N g e n - l o a d
In this study, BESS and PV are injected to compensate for the mismatch in the present generation capacity from the thermal units primarily during peak and valley periods prominently throughout the dry season, when the main hydropower supply to the capital city decreased to more than its designed capacity due to climatic conditions. Table 3 shows the solar irradiance [50]. The synchronized execution of ToU and IC selected for the penetration of BESS and PV due to its load factor index is shown in Table 6 after the execution of DR. It represents the lowest load factor index. Moreover, an extensive mismatch in the load profile characteristic is observed and should be covered in the valley and peak interval. From the simulation results shown in Figure 9, within the hours 00:00–10:00 where we have inadequate solar radiation, the BESS can be seen discharging it stored energy covering the deficiency for the PV power. From 11:00–14:00, we observed an increase in solar irradiance. During this period, the PV will be providing power supply while the BESS is charging as we reach the peak load period. The state of discharge and charging is, as shown in Figure 9.

5. Conclusions

In this research, a two-stage DR program-curtailed optimal integration of hybridized RE source has been implemented to meet the daily load demand for Freetown, Sierra Leone. In Stage-I, time-based, incentive-based, and the combination of incentive and time-based DR programs are executed using the price elasticity concept to meet the peak load demand. From the simulation results analysis, for CAP and the simultaneous execution of ToU with DLC 6.5% and 6.39 % peak load reduction are attained, respectively. Both yielded the highest benefits of the executed proposed DR programs scheme; The reduction of energy consumption of 2041.7 MWh was achieved with CAP and 2033.2 MWh as achieved with ToU-DLC. Both scenarios enhance peak load reduction with significant modifications to the customers’ load characteristics. The SSI analysis is employed to prioritize and implement relevant DR response programs that are efficient from both the IPPs’ and customers’ perspective. From the results obtained, the CPP and concurrent execution of ToU and IC DR programs prove to be economically efficient from the IPPs and customer perspective. Moreover, considering the load factor based on the SSI analysis, the ToU program is found to be more productive. Conclusively, Stage II of this study involved the optimal introduction of hybridized RE technologies to satisfy the new load profile after the execution of the relevant DR programs. Genetic Algorithm (GA) was utilized for the optimal RE infusion into the generation mix with the reduction in maintenance and operational cost as the objective function, alongside greenhouse gas emissions reduction. The results show the ability of the proposed control scheme to match the increased load demand in off-peak and valley periods that shifted from peak periods due to utilizing the DR approach. In the future, the research will be extended towards investigating the possibilities of a very high renewable energy fraction using appropriate demand-side management approach and generation extension planning.

Author Contributions

Conceptualization, A.C., M.E.L., O.B.A.; methodology, A.C., M.E.L., H.T.; validation, M.E.L, P.M., T.S.; formal analysis and investigation, A.C., M.E.L., O.B.A.; writing—original draft preparation, A.C., M.E.L.; writing—review and editing, A.C., M.E.L., O.B.A.; supervision and project administration, T.S. All authors have read and agreed to the published version of the manuscript.

Funding

This research received no external funding.

Acknowledgments

The authors wish to acknowledge the Japan international cooperation agency (JICA) for the support provided in the form of African business education (ABE) scholarship to the main author (A. Conteh) towards the success of this research work. The first author (A. Conteh) wishes to appreciate the effort of the management and colleagues at EDSA, Freetown for principal support in terms of supplying the relevant up-to-date data needed for this project.

Conflicts of Interest

The authors declare no conflict of interest.

References

  1. World Economic Forum: Energy-Access-Africa. 2019. Available online: http://www.weforum.org/projects/ (accessed on 1 February 2019).
  2. Kammen, D. The energy challenge in sub-Saharan Africa: A guide for advocates and policy makers. In Part 1: Generating Energy for Sustainable and Equitable Development; Oxfam America Report; OXFAM: Nairobi, Kenya, 2017. [Google Scholar]
  3. INTERNATIONAL ENERGY AGENCY: Energy Access Outlook. 2017. Available online: http://www.iea.org/ (accessed on 1 November 2017).
  4. The World Bank: Access to Electricity. Available online: http://data.worldbank.org/ (accessed on 22 February 2018).
  5. STATISTICS SIERRA LEONE: 2015 Population and Housing Census. Available online: https://www.statistics.sl/ (accessed on 5 March 2019).
  6. Konneh, D.A.; Howlader, H.O.R.; Shigenobu, R.; Senjyu, T.; Chakraborty, S.; Krishna, N. A Multi-Criteria Decision Maker for Grid-Connected Hybrid Renewable Energy Systems Selection Using Multi-Objective Particle Swarm Optimization. Sustainability 2019, 11, 1188. [Google Scholar] [CrossRef] [Green Version]
  7. Ministry of Energy. Available online: http://www.energy.gov.sl/ (accessed on 22 March 2019).
  8. Trace, S. Developing a Programme of Research on the Electricity Sector in Sierra Leone; EEG Energy Insight Series; EEG: San Rafael, CA, USA, 2017. [Google Scholar]
  9. World Bank Group: Enterprise Surveys with business Experience. Available online: http://http://www.enterprisesurveys.org/ (accessed on 5 March 2019).
  10. The National Electricity ACT, 2011: Supplement of the Sierra Leone Gazette Volume CXIII, No.6 dated 9th February 2012. Available online: http://www.sierra-leone.org/ (accessed on 5 March 2019).
  11. Ochs, A.; Gioutsos, D. Rural Electrification in Sierra Leone: The Role of Mini Grids vis-à-vis Stand-alone Home Systems and Grid Extension; LEDS: Golden, CO, USA, 2017. [Google Scholar]
  12. Konneh, D.A.; Lotfy, M.E.; Shigenobu, R.; Senjyu, T. Optimal Sizing of Grid-connected Renewable Energy System in Freetown Sierra Leone. IFAC-PapersOnLine 2018, 51, 191–196. [Google Scholar] [CrossRef]
  13. Cok, B. A techno-Economic Analysis of Various Photovoltaic Systems for Decentralized Electrification in Sierra Leone. Master’s Thesis, Utrecht University, Utrecht, The Netherlands, 2011. [Google Scholar]
  14. Huang, W.; Lu, M.; Zhang, L. Survey on Microgrid Control Strategies. Energy Procedia 2011, 12, 206–212. [Google Scholar] [CrossRef] [Green Version]
  15. Ng, E.J.; El-Shatshat, R.A. Multi-microgrid control systems (MMCS). In Proceedings of the IEEE PES General Meeting, Providence, RI, USA, 25–29 July 2010; pp. 1–6. [Google Scholar]
  16. Kim, S.K.; Huh, J.H. A Study on the Improvement of Smart Grid Security Performance and Blockchain Smart Grid Perspective. Energies 2018, 11, 1973. [Google Scholar] [CrossRef] [Green Version]
  17. Xiao, Z.; Tinghua, L.; Ming, H.; Jihong, S.; Jingjing, Y.; Jiang, Y.; Wei, W. Hierarchical MAS Based Control Strategy for Microgrid. Energies 2010, 3, 1622. [Google Scholar] [CrossRef]
  18. Wu, X.; He, X.; Sun, N.; Fang, Y. A novel anti-swing control method for 3-D overhead cranes. In Proceedings of the 2014 American Control Conference, Portland, OR, USA, 4–6 June 2014. pp. 2821–2826.
  19. Kim, T.; Huh, K. Improvement of MPPT Control Performance Using Fuzzy Control and VGPI in the PV System for Micro Grid. Sustainability 2019, 11, 5891. [Google Scholar] [CrossRef] [Green Version]
  20. Federal Energy Regulatory Commission Staff Report: 2018 Assessment of Demand Response and Advanced Metering Staff Report. Available online: Https://www.ferc.gov/legal/ (accessed on 18 March 2020).
  21. Monyei, C.; Adewumi, A. Integration of demand side and supply side energy management resources for optimal scheduling of demand response loads—South Africa in focus. Electr. Power Syst. Res. 2018, 158, 92–104. [Google Scholar] [CrossRef]
  22. Ogunjuyigbe, A.; Ayodele, T.; Akinola, O. User satisfaction-induced demand side load management in residential buildings with user budget constraint. Appl. Energy 2017, 187, 352–366. [Google Scholar] [CrossRef]
  23. Caprino, D.; Vedova, M.L.D.; Facchinetti, T. Peak shaving through real-time scheduling of household appliances. Energy Build. 2014, 75, 133–148. [Google Scholar] [CrossRef]
  24. Demand Response: A decisive breakthrough for Europe. Available online: http://www.capgemini.com/ (accessed on 1 May 2018).
  25. Bertoldi, P.; Zancanella P, B.K.B. Demand Response Status in EU Member States; Europa.eu: Brussels, Belgium, 2016. [Google Scholar]
  26. Prepared for theWorld Bank 1818H Street N.WWashington DC 20433 Primer on Demand-Side Management with Emphasis on Price Response Programs. Available online: http://www.worldbank.org/ (accessed on 1 March 2019).
  27. Torriti, J.; Hassan, M.G.; Leach, M. Demand response experience in Europe: Policies, programmes and implementation. Energy 2010, 35, 1575–1583. [Google Scholar] [CrossRef] [Green Version]
  28. Aghaei, J.; Alizadeh, M.I. Demand response in smart electricity grids equipped with renewable energy sources: A review. Renew. Sustain. Energy Rev. 2013, 18, 64–72. [Google Scholar] [CrossRef]
  29. Aalami, H.; Moghaddam, M.P.; Yousefi, G. Demand response modeling considering Interruptible/Curtailable loads and capacity market programs. Appl. Energy 2010, 87, 243–250. [Google Scholar] [CrossRef]
  30. Sivaneasan, B.; Thachinamoorthi, K.; Goh, K.P. Interruptible load scheme: Demand response management for buildings. In Proceedings of the 2016 IEEE Region 10 Conference (TENCON), Singapore, 22–25 November 2016; pp. 1716–1719. [Google Scholar]
  31. Ikpe, E.; Torriti, J. A means to an industrialisation end? Demand Side Management in Nigeria. Energy Policy 2018, 115, 207–215. [Google Scholar] [CrossRef]
  32. Adeoye, O.; Spataru, C. Modelling and forecasting hourly electricity demand in West African countries. Appl. Energy 2019, 242, 311–333. [Google Scholar] [CrossRef]
  33. Adom, P.K. The long-run price sensitivity dynamics of industrial and residential electricity demand: The impact of deregulating electricity prices. Energy Econ. 2017, 62, 43–60. [Google Scholar] [CrossRef]
  34. Montuori, L.; Alcázar-Ortega, M.; Álvarez-Bel, C.; Domijan, A. Integration of renewable energy in microgrids coordinated with demand response resources: Economic evaluation of a biomass gasification plant by Homer Simulator. Appl. Energy 2014, 132, 15–22. [Google Scholar] [CrossRef] [Green Version]
  35. Shen, B.; Ghatikar, R.; Lei, Z.; Li, J.; Wikler, G.; Martin, P. The role of regulatory reforms, market changes, and technology development to make demand response a viable resource in meeting energy challenges. Appl. Energy 2014, 130, 814–823. [Google Scholar] [CrossRef]
  36. Ma, O.; Alkadi, N.; Cappers, P.; Denholm, P.; Dudley, J.; Goli, S.; Hummon, M.; Kiliccote, S.; Macdonald, J.; Matson, N.; et al. Demand Response for Ancillary Services. Smart Grid IEEE Trans. 2013, 4, 1988–1995. [Google Scholar] [CrossRef]
  37. Alcazar-Ortega, M.; Calpe, C.; Theisen, T.; Carbonell-Carretero, J.F. Methodology for the identification, evaluation and prioritization of market handicaps which prevent the implementation of Demand Response: Application to European electricity markets. Energy Policy 2015, 86, 529–543. [Google Scholar] [CrossRef] [Green Version]
  38. Conteh, A.; Lotfy, M.E.; Kipngetich, K.M.; Senjyu, T.; Mandal, P.; Chakraborty, S. An Economic Analysis of Demand Side Management Considering Interruptible Load and Renewable Energy Integration: A Case Study of Freetown Sierra Leone. Sustainability 2019, 11, 2828. [Google Scholar] [CrossRef] [Green Version]
  39. Noor, S.; Guo, M.; van Dam, K.H.; Shah, N.; Wang, X. Energy Demand Side Management with supply constraints: Game theoretic Approach. Energy Procedia 2018, 145, 368–373. [Google Scholar] [CrossRef]
  40. Gadham, K.R.; Ghose, T. Design of incentive price for voluntary Demand Response Programs using fuzzy system. In Proceedings of the 2016 International Conference on Electrical Power and Energy Systems (ICEPES), Bhopal, India, 14–16 December 2016; pp. 363–367. [Google Scholar]
  41. Paterakis, N.G.; Erdinç, O.; Catalão, J.P. An overview of Demand Response: Key-elements and international experience. Renew. Sustain. Energy Rev. 2017, 69, 871–891. [Google Scholar] [CrossRef]
  42. Coordination of Energy Efficiency and Demand Response: Energy-access-africaA RESOURCE OF THE NATIONAL ACTION PLAN FOR ENERGY EFFICIENCY JANUARY. 2010. Available online: https://www.epa.gov/sites/production/files/2015-08/documents/ee_and_dr.pdf) (accessed on 18 March 2020).
  43. Jadid, S.; Amoli, N.A. Factoring the price elasticity of demand in the optimal power flow. In Proceedings of the 2007 International Power Engineering Conference (IPEC 2007), Singapore, 3–6 December 2007; pp. 12–17. [Google Scholar]
  44. Maqbool, S.D.; Babar, M.; Al-Ammar, E.A. Effects of demand elasticity and price variation on load profile. In Proceedings of the 2011 IEEE PES Conference on Innovative Smart Grid Technologies-Middle East, Jeddah, Saudi Arabia, 17–20 December 2011; pp. 1–5. [Google Scholar]
  45. Kirschen, D.; Strbac, G.; Cumperayot, P.; De Mendes, D. Factoring the elasticity of demand in electricity prices. IEEE Trans. Power Syst. 2000, 15, 612–617. [Google Scholar] [CrossRef] [Green Version]
  46. Abdollahi, A.; Parsa Moghaddam, M.; Rashidinejad, M.; Sheikh-El-Eslami, M.K. Investigation of Economic and Environmental-Driven Demand Response Measures Incorporating UC. IEEE Trans. Smart Grid 2012, 3, 12–25. [Google Scholar] [CrossRef]
  47. Shafie-khah, M.; Shoreh, M.H.; Siano, P.; Fitiwi, D.Z.; Godina, R.; Osório, G.J.; Lujano-Rojas, J.; Catalão, J.P.S. Optimal Demand Response Programs for improving the efficiency of day-ahead electricity markets using a multi attribute decision making approach. In Proceedings of the 2016 IEEE International Energy Conference (ENERGYCON), Leuven, Belgium, 4–8 April 2016; pp. 1–6. [Google Scholar]
  48. World Nuclear Association: Renewable Energy and Electricity. Available online: http://www.world-nuclear.org/ (accessed on 1 March 2019).
  49. Electricity Distribution and Supply Authority (EDSA). Available online: Http://www.edsa.sl/ (accessed on 10 December 2018).
  50. Solar Energy for Professionals. 2018. Available online: http://www.soda-pro.com/ (accessed on 5 August 2018).
Figure 1. System configuration with renewable energy integration.
Sustainability 12 02653 g001
Figure 2. Freetown demand curve.
Sustainability 12 02653 g002
Figure 3. Impact of incentive base program.
Sustainability 12 02653 g003
Figure 4. Impact of time base program.
Sustainability 12 02653 g004
Figure 5. Impact of time and incentive base program.
Sustainability 12 02653 g005
Figure 6. Customer benefit strategic selection index (SSI).
Sustainability 12 02653 g006
Figure 7. IPP revenue SSI.
Sustainability 12 02653 g007
Figure 8. Load factor SSI.
Sustainability 12 02653 g008
Figure 9. Renewable energy injection.
Sustainability 12 02653 g009
Table 1. Self and cross elasticity for various periods.
PeriodLow Peak (00:00–7:00)Valley (8:00–14:00)Peak Load (15:00–22:00)
Low Peak (00:00–7:00)−0.10.010.012
Valley (8:00–14:00)0.01−0.10.016
Peak Load (15:00–22:00)0.0120.016−0.1
Table 2. Demand response programs parameters.
Program no.Program parametersElectricity Price
USc/kWh
Penalty
USc/kWh
Incentive
USc/kWh
0Initial load(Base Scenario)18.7600
AIncentive Base programs(IBP)
1Direct load Control (DLC)18.76022.79
2Emmergency Demand
Response Program (EDRP)
18.76028.49
3Capacity Market Program (CAP)18.765.862511.725
4Interruptible/Curtaible (IC)18.7611.72522.79
BTime Base programs(IBP)
5Time of use (ToU)7.28(Valley), 18.76(Low peak), 28.14(Peak)00
6Critical Price Peaking (CPP)93.8 (20:00–22:00),18.76(Other hours)00
7Real Time Pricing (RTP)7.28 (00:00–03:00),3.64 (04:00–07:00),18.76(08:00–11:00),
23.45(12:00–15:00)
18.76(16:00-18:00),58.625(19:00–21:00),
18.76(22:00-23:00)
00
8
ToU & CPP7.28(Valley), 18.76(Low peak), 28.14(Peak) 93.8(20:00–22:00)Hrs00
CIncentive & Time Base programs(IBP)
9ToU & DLC7.28(Valley), 18.76(Low peak), 28.14(Peak)011.395
10ToU & EDRP7.28(Valley), 18.76(Low peak), 28.14(Peak)022.79
11ToU & CAP7.28(Valley), 18.76(Low peak), 28.14(Peak)5.862511.725
12ToU & IC7.28(Valley), 18.76(Low peak), 28.14(Peak)11.39522.79
Table 3. Solar irradiance.
TimeSolar Radiation w/m 2 TimeSolar Radiation w/m 2
0:00012:00531
1:00013:00873
2:00014:00543
3:00015:00587
4:00016:00646
5:00017:00347
6:00018:000
7:00019:000
8:00020:000
9:005021:000
10:006022:000
11:006623:000
Table 4. Economic analysis of demand response profile.
Program No.Program
Parameters
Incentive
($)
Penalty
$
Customer Bill
($)
Customer Benefit
($)
Utility Revenue
($)
0Initial load(Base Scenario)00377,0500377,050
1DLC20,0830355,08042052334,990
2EDRP4710373,6803835373,210
3CAP1414125637,0906316370,730
4IC30,41612,385343,77051,303325,740
5ToU00368,2108835368,210
6CPP00578,60025,419578,600
7RTP00422,56011,079422,560
8ToU & CPP00535,73027,460535,730
9ToU & DLC95890357,23029,409347,640
10ToU & EDRP29,2200346,24060,025317,020
11ToU & CAP12,6758563351,26029,901347,150
12ToU & IC39,26211,003335,26070,048307,000
Table 5. Technical analysis of demand response load profiles.
Program No.Program
Parameters
Peak (MW)Peak
Reduction (%)
Energy
Consumption (MWh)
Energy
Reduction (%)
Load
Factor (%)
Peak to
Valley (MW)
0Base Scenario96.500.002085.700.008722.50
1DLC90.735.982017.703.379316.73
2EDRP94.701.862075.300.509120.70
3CAP93.213.402066.600.929219.21
4IC91.625.061982.805.199017.62
5TOU91.185.512075.600.489517.18
6CPP94.482.092086.30−0.039219.06
7RTP93.023.612089.20−0.179418.76
8ToU&CPP93.343.282102.30−0.799419.53
9ToU&DLC90.206.532041.702.169416.20
10ToU&EDRP91.065.642007.703.899217.06
11ToU&CAP90.676.052023.203.099316.67
12ToU&IC91.934.741973.705.688922.45
Table 6. Prioritizing demand response (DR) programs using strategic selection index.
Program Priority
Order
CUSTOMER BENEFITIPPs REVENUELOAD FACTOR
Demand Response ProgramSSI%Demand Response ProgramSSI%Demand Response ProgramSSI%
1ToU&IC100.00CPP100.00ToU100.00
2IC73.24ToU&CPP92.59ToU & DLC99.44
3ToU&EDRP64.45RTP73.03ToU & CPP98.95
4EDRP54.36BASE CASE65.17CAP98.87
5ToU&CAP48.14ToU63.64RTP98.67
6ToU&CPP39.22CAP62.72ToU & CAP98.03
7DLC36.50ToU&DLC61.67DLC97.69
8CPP36.29DLC60.75CPP97.01
9ToU&DLC28.91ToU&CAP59.33ToU & EDRP96.86
10CAP20.20EDRP58.58EDRP96.42
11RTP15.82ToU&EDRP57.36IC95.07
12ToU12.61IC56.30ToU & IC94.32
13BASE CASE0.00ToU&IC53.06BASE CASE91.43

