Research on the Knowledge Association Reasoning of Financial Reports Based on a Graph Network

1
School of Management, Jinan University, Guangzhou 510632, China
2
School of Accounting and Auditing, Guangxi University of Finance and Economics, Nanning 530007, China
*
Author to whom correspondence should be addressed.
Sustainability 2020, 12(7), 2795; https://doi.org/10.3390/su12072795
Submission received: 26 February 2020
/
Revised: 25 March 2020
/
Accepted: 31 March 2020
/
Published: 1 April 2020
(This article belongs to the Section Economic and Business Aspects of Sustainability)
Abstract
:With increasingly strict supervision, the complexity of enterprises’ annual reports has increased significantly, and the size of the text corpus has grown at an enormous rate. Information fusion for financial reporting has become a research hotspot. The difficulty of this problem is in filtering the massive amount of heterogeneous data and integrating related information distributed in different locations according to decision topics. This paper proposes a Graph NetWork (GNW) model that establishes the overall connection between decentralized information, as well as a graph network generation algorithm to filter large and complex data sets in financial reports and to mine key information to make it suitable for different decision situations. Finally, this paper uses the Planar Maximally Filtered Graph (PMFG) as a benchmark to show the effect of the generation algorithm.
1. Introduction
With the increasing textual information disclosure requirements of financial reports, the scale of text corpora has increased dramatically, and information integration capabilities have become the key to measuring the quality and value of reports [1]. The main reason for this increase is the expansion of the disclosure requirements needed by accounting standards and securities regulators. In recent years, for example, the International Accounting Standards Board (IASB) and the Financial Accounting Standards Board (FASB) have increased the number of disclosures in key areas, such as ongoing concerns, leasing, financial instruments, and follow-up events. Moreover, the U.S. Securities and Exchange Commission (SEC) requires additional qualitative disclosures in financial reports, including misstatements and revenue recognition [2].
These additional disclosures provide information for decision making [3,4]. Since information on the same decision topic may appear in multiple parts of a financial report, it is challenging to integrate information into the decision [5]. For example, in stock investment decision making, fund managers need to mine semantic data, such as cross holdings and stock pledge risks of a package of enterprises to obtain the correlation between enterprises and potential financial risks to assist in investment decisions. In theory, disclosure in text form (such as management discussion and analysis (MD&A), related party information disclosure, etc.) is very valuable, because it includes information related to the contents listed in the quantitative section of the financial report, which can provide supplementary information for users to cross-reference relevant data from different sources [6,7]. The knowledge related to decision making contained in a financial report is scattered in various fields, such as financial risk analysis, investment analysis, related transaction analysis, and other knowledge bases. Some knowledge bases already have semantic relationships that describe the relationship between different kinds of knowledge, such as the corresponding relationship among the pledge data, the enterprise association relation, and the financial index knowledge base. However, it is still necessary to deduce the possible correlation between cross-shareholding and financial risk. The main purpose of this paper is to propose a graph network model and algorithm for complex data set filtering and knowledge discovery for financial reporting to support the intelligent fusion of multi-perspective and cross-domain decision-making information. Based on the “related transaction disclosure” in financial reports, this paper demonstrates the effectiveness of the model and algorithm in practice.
2. Literature Review
One of the main objectives of narrative disclosure is to improve the overall quality of financial disclosure by adding more meaningful and descriptive information to financial reports. Some studies have investigated whether the qualitative disclosures in financial reports are value-related, and have then drawn a positive conclusion [8]. Although qualitative disclosure is related to value, the high cost of information processing and the lack of processing methods leads to the use level of qualitative disclosure being quite limited compared with digital data or “hard” data [9].
Semantic analysis combined with knowledge management or text analysis methods for information extraction is the focus of current mainstream research. Wu et al. found that the stock price of the company fails to reflect the news of companies with similar businesses through text analysis of the annotated “company business scope” [10] in a timely manner, which results in a linkage effect of stock prices over time. Moreover, Song and Huang used natural language processing technology to conduct word frequency analysis [11], keyword co-occurrence analysis, and preliminary text semantic analysis on the annotation content in order to explore the applicability of the text analysis method in the disclosure of financial reports. Aiming at the problem that the information obtained by natural language processing methods is too fragmented, Chou et al. adopted the design science methodology and proposed the semi-automatic method to solve the integration problem of decentralized information [12], and then used the Simple Knowledge Organization System (SKOS) to realize information integration. However, SKOS is incompatible with eXtensible Business Reporting Language (XBRL), and it requires high accuracy in text analysis, making it impossible to generalize. Thus, Chou et al. proposed a topic integration framework with XBRL terms as the theme to establish a link between qualitative information and quantitative data in financial reports [13]. However, according to the literature, the methods of data mining and information integration for massive texts in financial reports are still being explored.
Filtering complex data sets and obtaining key information is another important area related to the research in this paper. Although the use of complex networks to model and analyze the relationship between financial markets and enterprises has become the mainstream method of economic physics, as it is constrained by traditional parameters, such as node degree, intermediary, clique and cluster, and flow, this method has difficulty reflecting the multi-layer attribute interaction effect of a single-node cluster system when performing dynamic analysis and structural evolution prediction tasks for large and complex systems, as well as providing little support for analysis and reasoning tasks, such as the dynamic changes in the intra-cluster association relationship between different clusters on the system dynamics [14].
Using graph theory and complex network modeling methods to extract key structural features from large data sets and to derive the correlations—and even causal relationships—implied by mining is at the forefront of research on filtering and extracting information from large and complex data sets and complex systems [15,16,17]. The Planar Maximally Filtered Graph (PMFG) algorithm is proposed to filter information in complex systems. The data set is filtered by extracting sub-graphs composed of data connection edges, and the parameters are adjusted to control the size of the sub-graphs to meet different data needs. Then, the PMFG algorithm is extended to form a family of algorithms for the structural information mining of the system. Financial market analysis techniques, such as the PCTN (Partial Correlation Threshold Network) and the PCPG (Partial Correlation Planar maximally filtered Graph), are used to mine the structural information of specific financial systems for the study of financial risk transmission, asset portfolio strategies, enterprise cluster structures, etc. [18,19,20]. In the past ten years, the method of applying artificial neural networks to graphs to calculate and infer structural information has attracted much attention, and has gradually formed a “graph neural network” method family [21]. Several papers have unified methods based on graph neural networks into the “graph network” framework [22,23,24,25,26]. The graph network’s task-oriented, flexible structure features multi-attribute characterization, relational reasoning, and system prediction [27,28], providing useful references for this paper.
Nevertheless, text disclosure contains multi-level and multi-dimensional information, such as temporal and spatial relationships, causality, and correlations of the economic activities of enterprises. Therefore, the further exploration and integration of text information requires new methods. The key to information fusion lies in the recognition of the relationship among some of the knowledge bases contained in the information, as well as the aggregation of information scattered in different locations and knowledge fields. Taking the “information disclosure of related party transactions” in financial reports as an example, related party transactions not only provide evidence for accounting confirmations, such as the income structure, receivables, and payables, but also reflect many factors in the financial management of an enterprise, such as risks in investment, financing, and operation. These manifestations in the integration of financial report text information mean that the report not only contains knowledge of related party enterprises, such as the correlation properties of the industry and region, the enterprise scale, and the business type, but also knowledge of inter-enterprise relationships, including relationship types (commodity transaction, guarantee, agency, etc.), relationship intensity (transaction amount and frequency, etc.), as well as relationship attributes (symmetric, transfer, function, reverse, etc.).
Specifically, reports identify attributes of the knowledge itself, mine the relationship between knowledge and its attributes, infer the implicit relationship of the information through efficient algorithms to further discover new knowledge or complete information, and then finally form cross-domain information integration. Thus, the following question arises: how should we conduct large-scale and cross-domain knowledge association reasoning in financial reports? First, cross-domain knowledge models need to be built that can flexibly express and support large-scale deep learning. Second, it is necessary to design algorithms to meet the multi-domain knowledge association reasoning of financial reports because of the high complexity of cross-domain knowledge reasoning.
Based on the literature [21,29,30], this paper converts this type of problem into problems of the graph network structure, attribute, and link analysis. In large-scale texts, the attributes, association relations and attributes, relationship categories, and the properties of their concepts, entities, or objects are discovered by analyzing the global network structure, the node attributes, and the adjacency matrix. This paper designs the cross-domain knowledge graph model of financial reports and proposes a text information graph network algorithm to support the deep learning and reasoning of a large-scale financial report. The graph network generation module, with an embedded learning architecture, adopts an expandable attribute space, which can effectively improve the generalization ability of the model and can provide support for multi-domain knowledge fusion in financial reporting.
3. Knowledge Graph Network Model of Financial Reports
3.1. Multi-Domain Knowledge Graph of Financial Reports
Our approach is founded on the idea of representing the enterprise interaction knowledge that extracted from the financial reports as graphs: the companies and their correlations correspond to the nodes and edges, respectively, as depicted in Figure 1. Here, a (directed) graph is defined as , where u is a vector of global features, is a set of nodes where each is a vector of node features, and is a set of directed edges where is a vector of edge features, and and are the indices of the sender and receiver nodes, respectively. Combined with an example of related party transaction disclosure, i is an enterprise, and V can represent the knowledge about related enterprises, such as the association type, the enterprise scale, the industry, or the region. In this case, E can represent the knowledge of the inter-enterprise relationship, such as the relationship types of commodity transaction, guarantee, principal-agent, and executive compensation, as well as the transaction amount, the transaction frequency, and other relationship strengths (empowerment network).
3.2. Graph Network Generation Function of Text Information in Financial Reports
After defining the graph, the graph network generation function was further constructed, which was composed of the “iterative update function” and the “aggregation function” . This was used to generate the whole graph network of text information from the edges or nodes, as shown in Figure 2.
is the map formed by traversing each edge to calculate the update, while is the map formed by traversing each node to calculate the update, and is used for the global update. The function takes a set as input, and then outputs the elements containing key information. Its operation rules are as follows:
In which , , and .
3.3. Graph Network Generation Module of Text Information in Financial Reports
The main problem here is transforming the original complex data set into a graph network with a good structure and performing attribute collection by iteratively updating all nodes and connected edge attributes. We used the traversal algorithm to generate the graph network. Taking the original data set as the input, the edge and node were traversed, respectively, and the “iterative update function“ and the “aggregation function” were calculated in turn, thus forming a graph network of the global structure, nodes, and edges and their attributes. The algorithm was designed as follows:
| Algorithm 1. Generating Module. |
| Input , |
| for do #Compute updated edge attributes |
| end for |
| for do |
| let #Aggregate edge attributes per node |
| # Compute updated node attributes |
| end for |
| let |
| let #Aggregate edge attributes globally |
| #Aggregate node attributes globally |
| #Compute updated global attribute |
| return |
| end function |
In this example, the disclosure information can be extracted from the financial reporting of the “related party transactions” of a single enterprise. The calculation steps of the above algorithm are as follows:
STEP 1: Run e on the edge; the parameters are . Then, the output is .
In this case, traversing each edge can form the entity information of the related party transaction, as well as the transaction type, the transaction amount, and other attribute information. The output gathers each edge by node i, forming , and traversing the output of all edges in the network gives the set .
STEP 2: Run on , update the edges of the connection node i, and aggregate them into for the next node update.
In this case, means forming an information set with information such as the transaction amount, the guarantee amount, or the compensation incurred by the enterprise i.
STEP 3: Run for each node to calculate and update the attribute of node i.
In this case, this can be understood as the related party type, scale, location, industry, and other attributes of each enterprise. After traversal, the output of each node is set .
STEP 4: Run on to update all edges and aggregate them into for the next global update.
In this case, means calculating the type, number, or amount of related transactions in general.
STEP 5: Run on to update all nodes and aggregate them into for the next global update.
In this case, means calculating the structural and expansion information, such as the category of global related transaction objects and the industry of the main transaction subject.
STEP 6: is only run once on each graph to update and calculate the global attribute .
In this case, can be regarded as the total amount, structure, distribution, and other information of the overall related transactions.
According to the above steps, Algorithm 1 can be run from an enterprise as the starting node. From the event information of the “information disclosure of related transactions,” the graph network module of the related transactions of the enterprise can be formed, including the transaction party types and attributes, as well as the transaction types and the global graph network. Each iteration adds a new enterprise and repeats the algorithm to finally form a hypergraph network covering the enterprise clusters of different industries and regions, as well as the time complexity of the algorithm .
It should be pointed out that the above algorithm steps can be adjusted according to different application scenarios, and can be further divided into global perspective, node–center perspective, and edge–center perspective. For example, the analysis of the related party transactions and risks requires not only the information of related parties, but also the information of the related party transactions, the transaction amounts, the transaction times, the accounts receivable, the accounts payable, the balance, etc. At this time, a panoramic graph network is available, as shown in Figure 3a. If it is only necessary to understand the cross-holding situation of enterprises, then the node–center perspective can be adopted to obtain the information of holding enterprises in the associated types, as shown in Figure 3b. To analyze the situation of related transactions in the main revenue of an enterprise, an edge–center perspective can be adopted to obtain information, such as the transaction type and the transaction amount, as shown in Figure 3c.
4. Applications
4.1. Data Preparation
After collecting the 2015 annual reports of 400 Shanghai A-share companies (www.cninfo.com.cn) [31] by using Python, PDFbox was used to convert these reports into text format (txt). The final text file occupied 80 M, which formed all of the intercepted text of the “information disclosure of related transaction.” The Language Technology Platform (LTP) developed by Harbin Institute of Technology was used for Chinese text segmentation and part-of-speech tagging [32]. The methods in [33,34] were used for entity relationship recognition and event extraction. We defined the enterprise attribute space and the relationship attribute space , as shown in Table 1.
4.2. Graph Network of Related Transactions in a Single Enterprise
By selecting related party information of a certain type of enterprise, information regarding cross-shareholding among shareholders of listed enterprises can be obtained. With the help of social network software, the related information can be generated by the listed company due to cross-shareholding, the participation of the same shareholder, the private placement, and the joint investment. If it is necessary to further determine the details of related party transactions, more fine-grained information can be generated according to the disclosure of the related party transactions in the financial report, as shown in Figure 4.
In Figure 4, The company name is indicated by the initial capital abbreviation of the company Pinyin, the box and solid ellipse represent the enterprise, and the solid line box in the middle represents the starting enterprise YL company; the solid ellipse represents the enterprise that has an associated relationship with YL, such as BJZC directly above the box Company; the real connected edge indicates that related transactions have occurred between enterprises, that is, related events have occurred between nodes; the real connected edge with a single arrow indicates the cash outflow direction of related transactions, and the double arrow indicates that there are only other related relationships between enterprises (like a controller, etc.), rather than no related transactions. Different colors of the real connected edge represent different transaction types, blue represents a leasing business, purple represents purchasing service, pink represents purchasing goods, yellow represents guarantee, and gray represents others. As shown in the figure, YL-BJCZ has related transactions of the leasing type, YL is the cash payer, and BJZC is the lessee. YL-SCSD is associated with the type of service purchased. YL is the cash payer and SCSD is the service provider. There are other relationships between YL-YXTC, and there is a holding relationship between YL and YXTC. The node attribute pair and edge attribute pair are connected by dotted lines without arrows, which are descriptions of the node and edge attributes. The hollow solid line ellipse represents the node attribute and the hollow dotted line ellipse represents the edge attribute. For example, if the blue link is from YL to BJCZ, it can be seen that YL paid cash to BJZC in the leasing business. Furthermore, it can be seen from the three link attributes connected with the BJCZ dotted line that the three attributes of the transaction are, respectively, as follows: the transaction type is equipment leasing, the current transaction amount is 6,157,625 and the last transaction amount is 0.
4.3. Graph Network Link Analysis of Enterprise-Related Transactions
After iteratively generating multiple graph networks of enterprise-related transactions from a single enterprise association graph, we were able to use the link analysis method to determine the implicit association between enterprises, as shown in Figure 5.
Starting from the selected enterprise i—the red square in Figure 5—we first traversed the nodes of all connected edges ; that is, the lines with arrows in Figure 5 stand for the in and out links of node i, allowing us to obtain all of the first-order-associated nodes , associated with enterprise i. Then, according to the direction of entry and exit, we continued to update , respectively, to get all of the second-order-associated nodes of enterprise i, and so on, until no new nodes could be added in the new iteration, and then the iteration was terminated. In Figure 5, the path connected by the same colored lines means that the enterprise is associated with enterprise i at a special step size; the light red path means two steps, the green one means four steps, and the blue stands for six steps. It should be highlighted that this paper adopted a directed graph perspective; the model of an undirected graph can be used only if the correlation is taken into account without considering the nature of the association.
4.4. Global Attribute Mining of the Enterprise-Related Transaction Graph Network
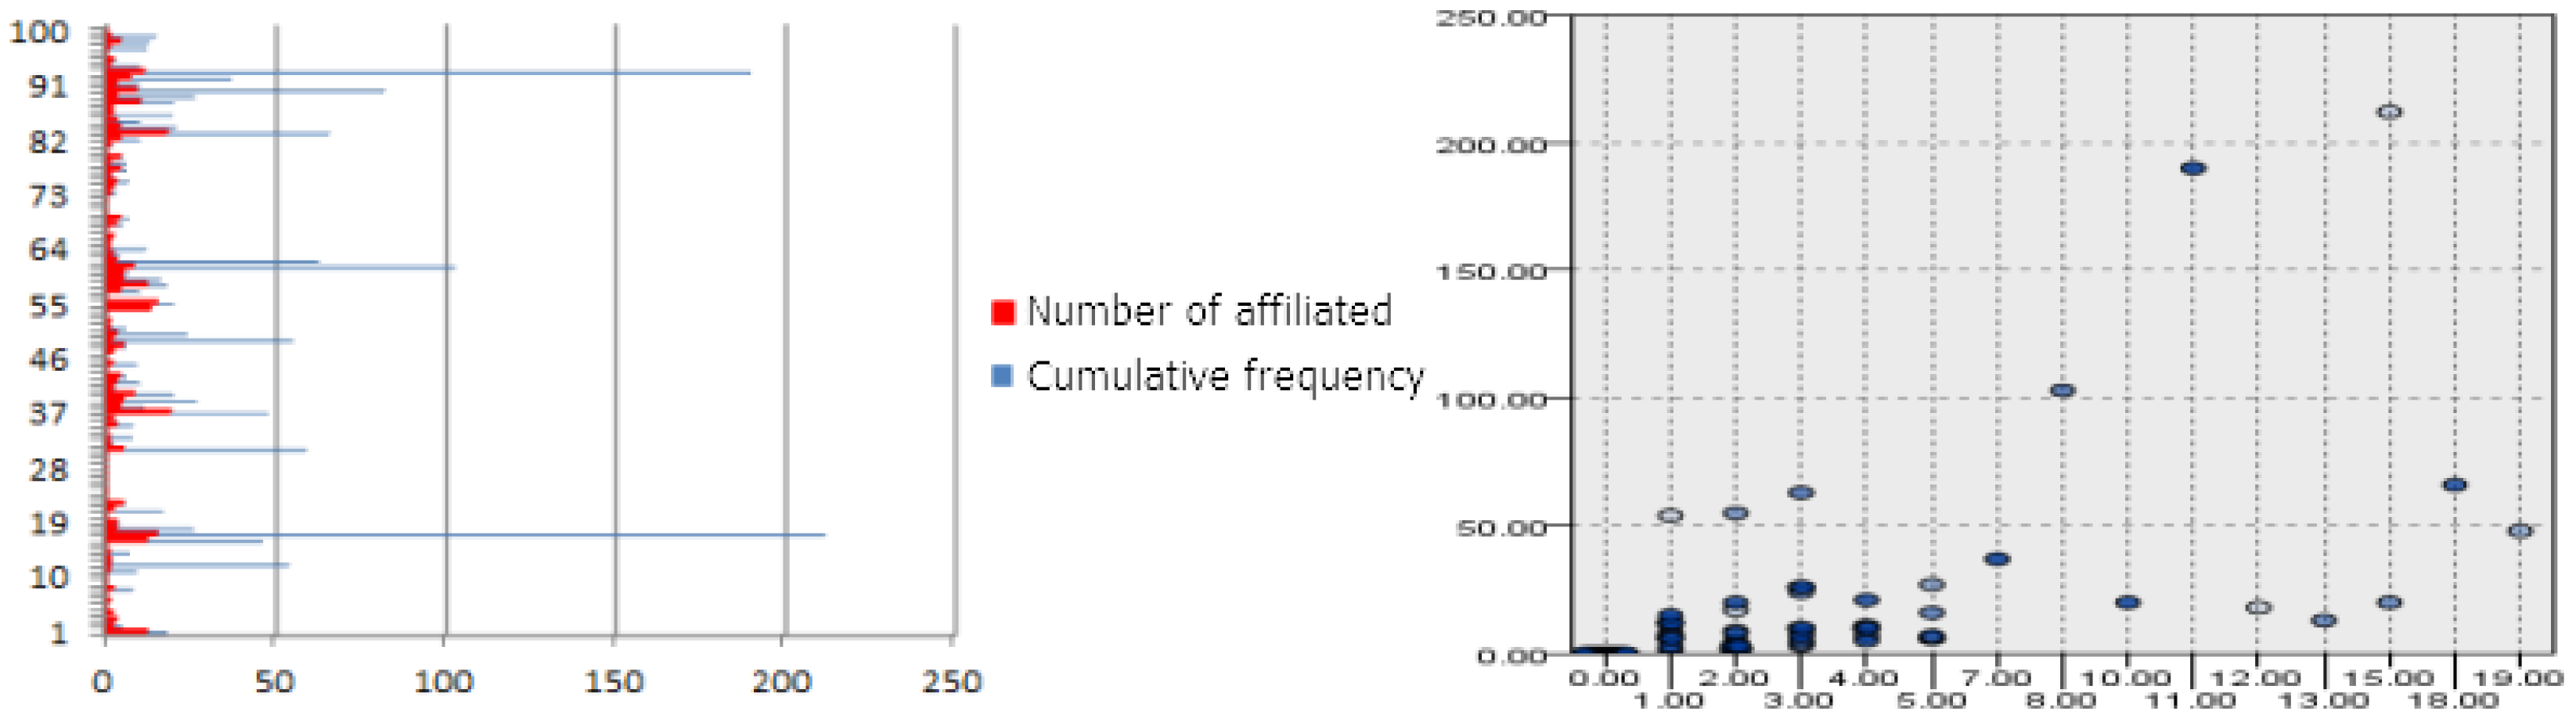
The enterprise association knowledge graph can be further mined to obtain the implicit knowledge of enterprise association. For example, according to the event extraction template of the financial report, we randomly selected the related event data of 100 enterprises in the past three years and extracted the top three related parties with the largest weight of each enterprise. The weight setting depends on the analysis type, such as the total amount of transactions in the past three years, the total amount of investment in the past three years, and the co-occurrence frequency in the past three years. After regularization, multiple weight matrices are formed to shape a new enterprise association network. The overall attributes of the enterprise association relationship can be determined through mining aggregation.
Taking enterprise association mining as an example, it can be found that the average number of the related enterprises in the sample is four, among which a few companies frequently publish related matter disclosures (221 times in three years), and the high-frequency related information are generally concentrated in two sectors: asset restructuring, and MD&A and investment. Although internal enterprises in the same industry do not necessarily have a close relationship, the relationship between upstream and downstream enterprises is closer, and its overall distribution is approximately t-shaped, as shown in Figure 6. However, there is a large difference in the amount of business generated by co-occurring companies, and few companies have more than the mean amount of business, resulting in the variance being approximate to the power law distribution. This means that the frequency of co-occurrence of the related parties in the sample is concentrated in a certain interval, but there are also some abnormal values that are much higher than the average. Meanwhile, the amount of related business varies greatly, and the related business of a few related parties accounts for a relatively high proportion of the total, showing the “characteristics of the 80/20 principle” (Pareto principle).
5. Discussion
This section uses the PMFG algorithm as a benchmark to discuss the effectiveness of the graph network model in the detection and identification of enterprise associations. The detection of group structures, such as regiments and clusters, is the focus of complex system research [35]. Therefore, this paper further clustered the nodes on the network generated by the graph network generation algorithm and the PMFG algorithm, respectively, to compare the effects of the two on the group structure detection in the network. In this paper, the spectral clustering method of Normalized Spectral Clustering (NSC) was used [36]. The similarity matrix of the generated network was used as the input weight and further divided into the generated network node set. Firstly, the similarity of the nodes based on the attributes (connected edges) was given, and then NSC was run on the similarity matrix obtained by the two network generation algorithms to compare the corresponding effects.
5.1. Similarity
Based on the graph network generation, we were able to layer according to the specific attributes of node or edge to further analyze the structural characteristics of enterprise-related transactions. Taking the attributes of nodes as an example, we used A to represent the V layer network structure of n nodes, where and where = 1, when there are connected edges between nodes i and j. Let be the total number of consecutive edges in the α layer; then, K represents node pairs with at least one connected edge in all levels, . Next, we considered the role of nodes on different levels; let the connected-edge overlap of node i be , that is, the number of all consecutive edges in all layers of node i. The larger the value of , the stronger the centrality of node i. The multi-level activity of node i is ; when , this means that node i is mainly active in a certain level, and means that the connected edges of node i are evenly distributed in E levels. These two indicators can be used to measure the role heterogeneity of nodes in a multi-layer network. Sort and , respectively, calculate the similarity or correlation strength between nodes or hierarchies, and generate a similarity matrix . The matrix elements are determined by the following formula:
where is the ordinal number of node i in the α layer, and is the total ordinal number of the α layer. The higher the similarity of two nodes in the multi-layer network, the closer is to 1. The similarity of nodes can be calculated from multiple aspects, and a weighted average of multi-dimensional similarity can be taken. The structural similarity between levels can also be deduced from the similarity of nodes and connected edges. In particular, it should be pointed out that the value of , when dealing with a high degree of heterogeneity or large-scale sparse networks, sets the sorting threshold, where those above the threshold are counted as ordinal numbers and those below the threshold are counted as 0. Therefore, in this paper, the value range of was set to a closed interval of 0–1.
5.2. Distribution of the Clustering Degree
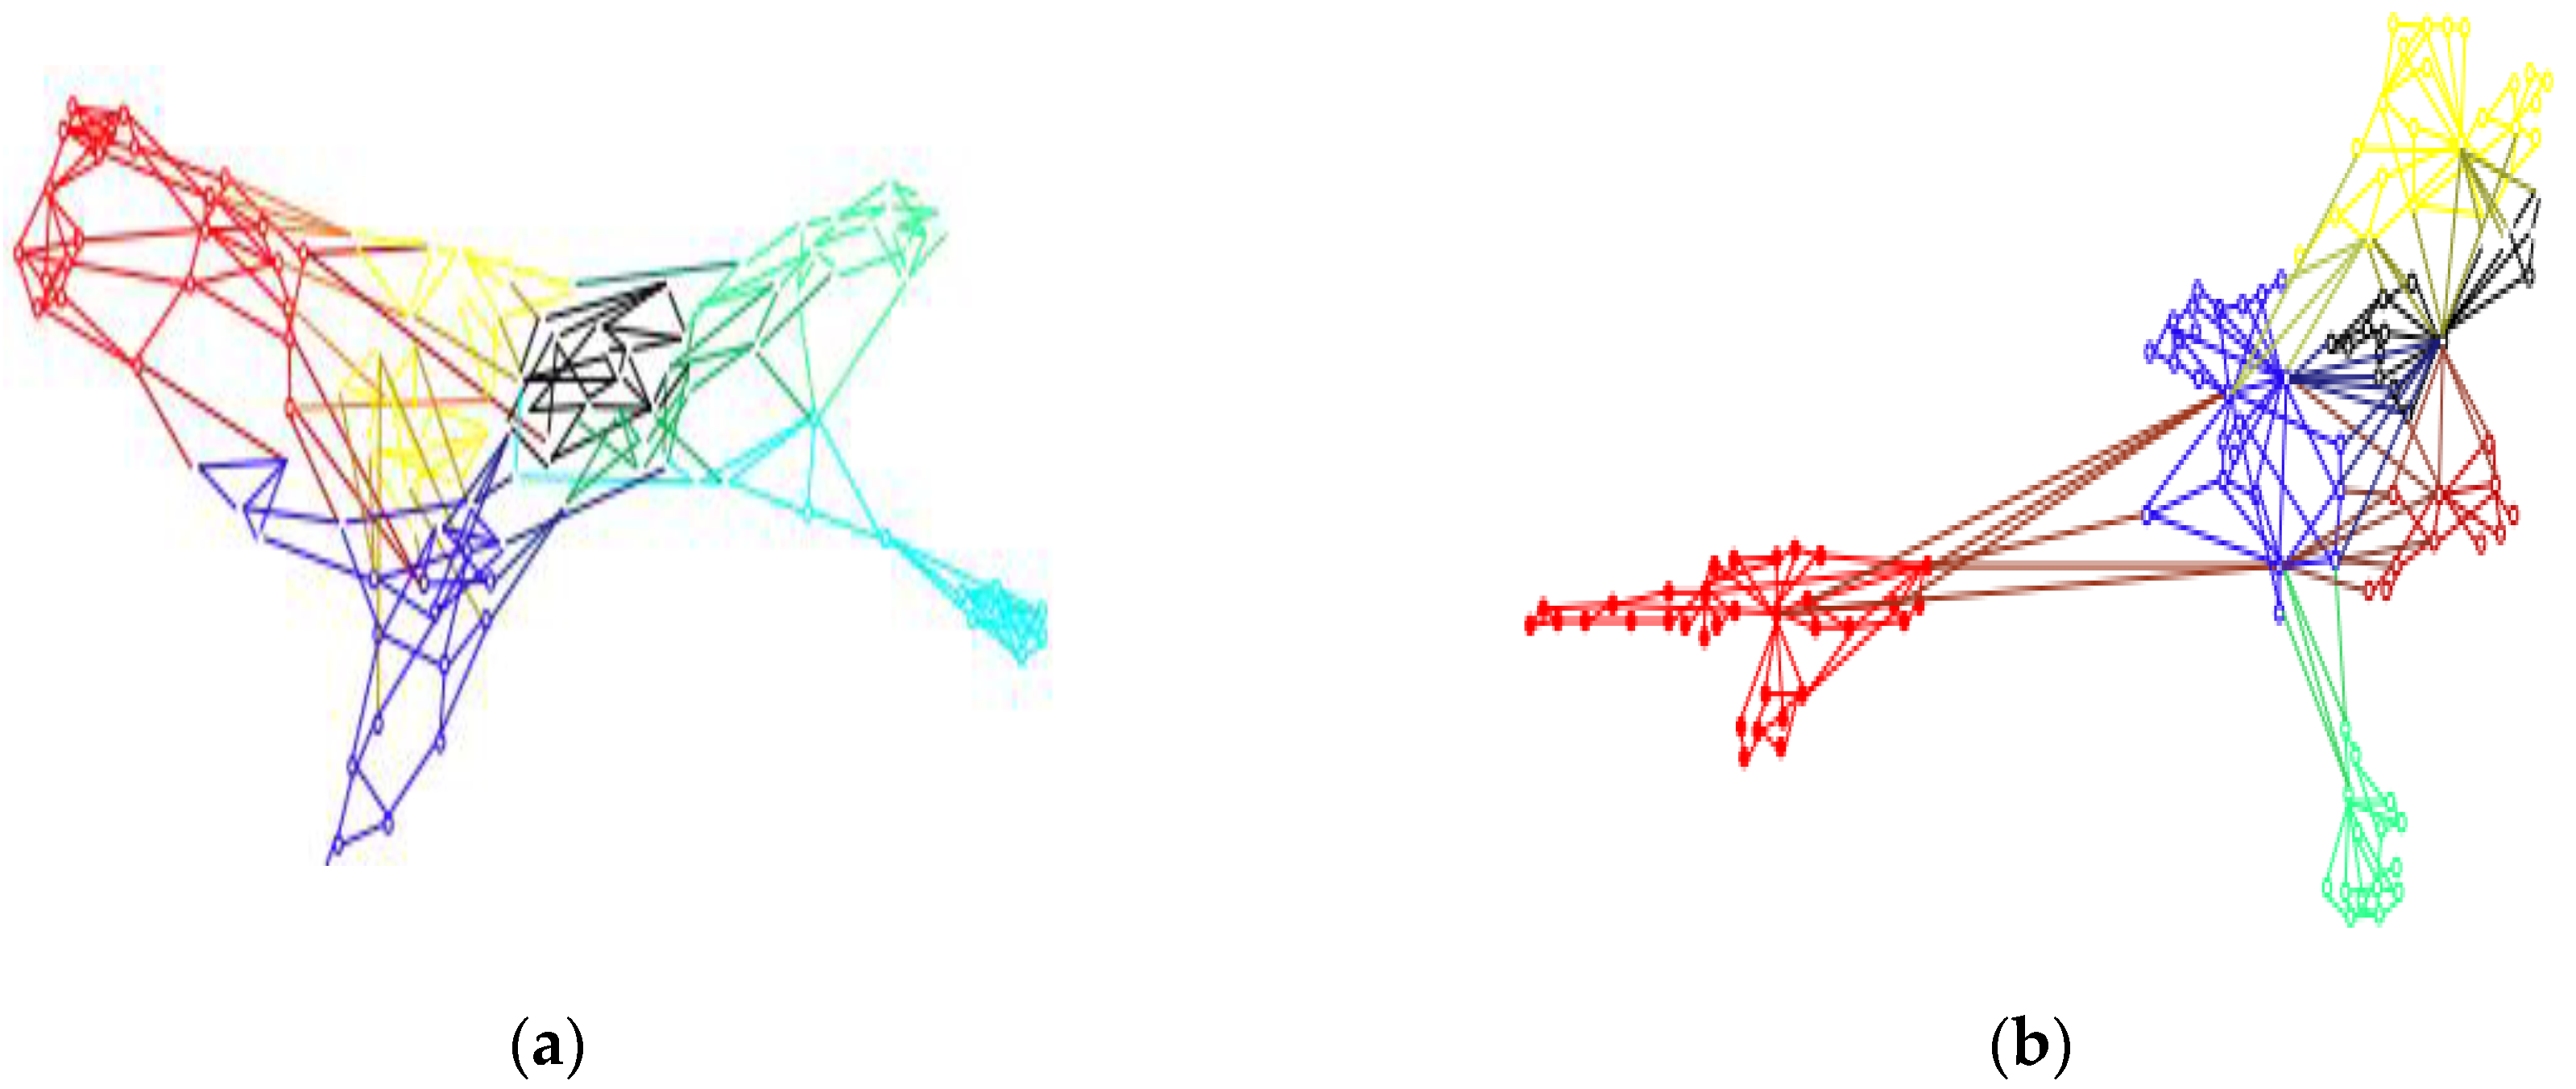
In order to obtain the similarity among all of the enterprises, the listed company that appeared in the text was selected as the network node. We used the Louvain algorithm [37] to detect two clusters for the generated network. The range of the GNW generated node degree was 1–9, and the range of PMFG was 3–46, as shown in Figure 7.
5.3. Clustering Effect
Using NSC on the enterprise similarity matrix, the cluster partition set was . Then, we applied NSC to the graph network and the PMFG network and used and to represent the corresponding partitions, respectively. For the similarity matrix input into NSC, we used the binary adjacency matrix of the network. The k value was determined according to the eigenvalue gap heuristic principle [38]. The eigenvalues of the similarity matrix were defined as . The value of k that makes significantly larger than was the value of cluster division. The Adjusted Rand Index (ARI) was used to measure the clustering effect [39]. The test results are shown in Figure 8.
In Figure 8, the y-axis is the ARI of and and the ARI of and , and the x-axis is k. If the ARI of the algorithm was larger than , then we considered that the algorithm had good performance. It can be seen that when the value of k is small, the two algorithms have little difference. When k = 7, 8, the performance of PMFG is better. When k > 8, the performance of GNW is always better than PMFG.
According to the principle of determining the gap [38], the maximum gap of the eigenvalues of the similarity matrix is = 0.74, = 0.35, = 0.16, and the corresponding k= 4,10,11; thus, the performance of GNW is better than PMFG. In addition, when classifying companies by industry, some sub-sectors may be hidden. The experimental data in this paper contained 15 large industries, and the number of clusters was k > 15. For these k values, GNW’s ARI performs better than PMFG. Although NSC performs mediocrely for sparse networks [40], the threshold filtering in this paper excluded the nodes with less influence so that the experimental results matched. In addition, the result of this table is another indicator that the small value of k is invalid, because the ARI of and is smaller than that of and . In addition, compared with a larger k value, the ARI of / and is smaller at a smaller k value, as shown in Figure 9.
The main reason for this difference may be that the PMFG algorithm is derived from the maximum plan graph method. We generated the network according to the established rules; for example, it is stipulated that maximum cliques of greater than four cannot appear in the PMFG algorithm. Such cliques cannot be embedded in the plane without any two edges crossing (g = 0, the gap is 0). In fact, there can be at most n minus 3 of the largest 4-cliques and 3n minus 6 of the 3-cliques in any plane view. It is difficult to homogenize nodes and connected edges to reveal the diverse characteristics of corporate association interactions. Therefore, when identifying the multi-dimensional associations contained in financial reports, PMFG exhibits low accuracy in identifying enterprise clusters. However, in the GNW generation algorithm, traversing the generated graph network based on the attributes of nodes and connected edges has the expressive ability of the multi-layer network itself. When the activity is used as the basis for similarity construction, the attribute classification of the enterprise is implicit; after adding the threshold, the key is to filter the sparse network to a certain degree to extract the key information with a corresponding granularity.
6. Conclusions
The complexity and length of corporate annual reports have increased significantly over the past few decades, raising concerns about inconsistencies in financial reports and a potential information overload for users of financial reports. These concerns are also the subject of cross-over studies in fields such as accounting, financial management, and finance. Moreover, the difficulty of this research lies in the decision-making information being scattered over a large text; thus, a better method of information integration must be found. This paper proposed a graph network model that unifies the relationships between information scattered in different positions in financial reports by generating graphs. The graph network module embedded with the learning architecture was used to discover and integrate the information related to decision making. At the same time, this paper transformed text into data resources through event and graph network embedding for the use of different decision-support tools. This can improve the decision-making support ability of text information in financial reports and can promote a process of financial information fusion that is cross-domain and cross-data-type and supports multiple reporting formats. In follow-up research, a reasoning model based on the graph network and logic will be further constructed to discover the short- and long-term causal relationships between economic events and their impact on the participants.
Author Contributions
Conceptualization, Z.L. and D.P.; formal analysis, Y.D.; writing—original draft preparation, Y.D. and Z.L. All authors have read and agreed to the published version of the manuscript.
Funding
This paper was supported by the National Natural Science Foundation of China (Grant No. 71771104).
Conflicts of Interest
The authors declare no conflict of interest.
References
- Cazier, R.A.; Pfeiffer, R.J. Why are 10-k filings so long? Account. Horiz. 2015, 30, 150731110748009. [Google Scholar]
- Li, F.; Lundholm, R.; Minnis, M. A Measure of Competition Based on 10-K Filings. J. Account. Res. 2012, 51. [Google Scholar] [CrossRef]
- Hodder, L.; Koonce, L.; McAnally, M.L. SEC market risk disclosures: Implications for judgment and decision making. Account. Horiz. 2001, 15, 49–70. [Google Scholar] [CrossRef]
- Chaudoir, S.R.; Fisher, J.D. The disclosure processes model: Understanding disclosure decision making and postdisclosure outcomes among people living with a concealable stigmatized identity. Psychol. Bull. 2010, 136, 236. [Google Scholar] [CrossRef] [Green Version]
- Mayew, W.J.; Sethuraman, M.; Venkatachalam, M. MD&A disclosure and the firm’s ability to continue as a going concern. Account. Rev. 2015, 90, 1621–1651. [Google Scholar]
- Shirata, C.Y.; Takeuchi, H.; Ogino, S.; Watanabe, H. Extracting key phrases as predictors of corporate bankruptcy: Empirical analysis of annual reports by text mining. J. Emerg. Technol. Account. 2011, 8, 31–44. [Google Scholar] [CrossRef] [Green Version]
- Shuai, F.; Bonan, G.; Guohua, J. Value Investment: A Study on the Cumulative Effects of the Value of Accounting Information. Accouting Res. 2018, 366, 38–46. [Google Scholar]
- Merkley, K.J. Narrative disclosure and earnings performance: Evidence from R&D disclosures. Account. Rev. 2014, 89, 725–757. [Google Scholar]
- Davis, A.K.; Tama-Sweet, I. Managers’ use of language across alternative disclosure outlets: Earnings press releases versus MD&A. Contemp. Account. Res. 2012, 29, 804–837. [Google Scholar]
- Wu, X.; Tian, G.L.; Li, Y.T. Linkage of Operating Information Disclosure and Stock Returns-Analysis Based on Notes to Financial Report Texts. Nankai Bus. Rev. Int. 2019, 3, 173–186. [Google Scholar]
- Song, Y.; Huang, Q. Research on Disclosure of Notes to Financial Statements Based on Text Mining Technology. Friends Account. 2019, 601, 144–149. [Google Scholar]
- Chou, C.C.; Chang, C.J.; Peng, J. Integrating XBRL data with textual information in Chinese: A semantic web approach. Int. J. Account. Inf. Syst. 2016, 21, 32–46. [Google Scholar] [CrossRef]
- Chou, C.C.; Hwang, N.C.R.; Wang, T.; Debreceny, R. The topical link model-integrating topic-centric information in XBRL-formatted reports. Int. J. Account. Inf. Syst. 2018, 29, 16–36. [Google Scholar] [CrossRef]
- Kartun-Giles, A.P.; Bianconi, G. Beyond the clustering coefficient: A topological analysis of node neighbourhoods in complex networks. ChaosSolitons Fractals 2019, 1, 100004. [Google Scholar] [CrossRef]
- Li, Y.; Tarlow, D.; Brockschmidt, M.; Zemel, R. Gated graph sequence neural networks. In Proceedings of the International Conference on Learning Representations (ICLR), Caribe Hilton, San Juan, Puerto Rico, 2–4 May 2016. [Google Scholar]
- Scarselli, F.; Gori, M.; Tsoi, A.C.; Hagenbuchner, M.; Monfardini, G. The Graph Neural Network Model. Ieee Trans. Neural Netw. 2009, 20, 61–80. [Google Scholar] [CrossRef] [PubMed] [Green Version]
- Birch, J. Modelling Financial Markets using Methods from Network Theory. Ph.D. Thesis, University of Liverpool, Liverpool, UK, 2015; pp. 48–54. [Google Scholar]
- Tumminello, M.; Aste, T.; Di Matteo, T.; Mantegna, R.N. A tool for filtering information in complex systems. Proc. Natl. Acad. Sci. USA 2005, 102, 10421–10426. [Google Scholar] [CrossRef] [Green Version]
- Di Matteo, T.; Pozzi, F.; Aste, T. The use of dynamical networks to detect the hierarchical organization of financial market sectors. Eur. Phys. J. B 2010, 73, 3–11. [Google Scholar] [CrossRef]
- Musmeci, N.; Nicosia, V.; Aste, T.; Di Matteo, T.; Latora, V. The multiplex dependency structure of financial markets. Complexity 2017. [Google Scholar] [CrossRef]
- Battaglia, P.W.; Hamrick, J.B.; Bapst, V.; Sanchez-Gonzalez, A.; Zambaldi, V.; Malinowski, M.; Gulcehre, C. Relational inductive biases, deep learning, and graph networks. arXiv 2018, arXiv:1806.01261. [Google Scholar]
- Sanchez-Gonzalez, A.; Heess, N.; Springenberg, J.T.; Merel, J.; Riedmiller, M.; Hadsell, R.; Battaglia, P. Graph networks as learnable physics engines for inference and control. In Proceedings of the 35th International Conference on Machine Learning (ICLR), Stockholm, Sweden, 30 April 2018. [Google Scholar]
- Santoro, A.; Raposo, D.; Barrett, D.G.; Malinowski, M.; Pascanu, R.; Battaglia, P.; Lillicrap, T. A simple neural network module for relational reasoning. In Advances in Neural Information Processing Systems; Mit Press: Cambridge, MA, USA, 2017. [Google Scholar]
- Kipf, T.; Fetaya, E.; Wang, K.-C.; Welling, M.; Zemel, R. Neural relational inference for interacting systems. In Proceedings of the International Conference on Machine Learning (ICML), Stockholm, Sweden, 10–15 July 2018. [Google Scholar]
- Hamaguchi, K.; Kurihara, T.; Fujimoto, M.; Iemitsu, M.; Sato, K.; Hamaoka, T.; Sanada, K. The effects of low-repetition and light-load power training on bone mineral density in postmenopausal women with sarcopenia: A pilot study. Bmc Geriatr. 2017, 17, 102. [Google Scholar] [CrossRef] [Green Version]
- Kipf, T.N.; Welling, M. Semi-supervised classification with graph convolutional networks. arXiv 2016, arXiv:1609.02907. [Google Scholar]
- Yang, Y.; Zheng, X.; Sun, Z. Coal Resource Security Assessment in China: A Study Using Entropy-Weight-Based TOPSIS and BP Neural Network. Sustainability 2020, 12, 2294. [Google Scholar] [CrossRef] [Green Version]
- Khalili, H.; Rincón, D.; Sallent, S.; Piney, J.R. An Energy-Efficient Distributed Dynamic Bandwidth Allocation Algorithm for Passive Optical Access Networks. Sustainability 2020, 12, 2264. [Google Scholar] [CrossRef] [Green Version]
- Hamrick, J.B.; Allen, K.R.; Bapst, V.; Zhu, T.; McKee, K.R.; Tenenbaum, J.B.; Battaglia, P.W. Relational inductive bias for physical construction in humans and machines. arXiv 2018, arXiv:1806.01203. [Google Scholar]
- Griffiths, T.L.; Chater, N.; Kemp, C.; Perfors, A.; Tenenbaum, J.B. Probabilistic models of cognition: Exploring representations and inductive biases. Trends Cogn. Sci. 2010, 14, 357–364. [Google Scholar] [CrossRef]
- JuChao informaiton network. Available online: www.cninfo.com.cn (accessed on 24 November 2019).
- Language technology platform. Available online: http://www.ltp-cloud.com/ (accessed on 1 February 2020).
- Vo, D.T.; Bagheri, E. Extracting temporal event relations based on event networks. In European Conference on Information Retrieval; Springer: Cham, Switzerland, 2019; pp. 844–851. [Google Scholar]
- Li, P.; Zhou, G.; Zhu, Q. Semantics-based joint model of Chinese event trigger extraction. J. Softw. 2016, 27, 280–294. [Google Scholar]
- Boccaletti, S.; Bianconi, G.; Criado, R.; Del Genio, C.I.; Gómez-Gardenes, J.; Romance, M.; Zanin, M. The structure and dynamics of multilayer networks. Phys. Rep. 2014, 544, 1–122. [Google Scholar] [CrossRef] [Green Version]
- Krzakala, F.; Moore, C.; Mossel, E.; Neeman, J.; Sly, A.; Zdeborová, L.; Zhang, P. Spectral redemption in clustering sparse networks. Proc. Natl. Acad. Sci. USA 2013, 110, 20935–20940. [Google Scholar] [CrossRef] [Green Version]
- Ghosh, S.; Halappanavar, M.; Tumeo, A.; Kalyanaraman, A.; Lu, H.; Chavarria-Miranda, D.; Gebremedhin, A. Distributed louvain algorithm for graph community detection. In Proceedings of the 2018 IEEE International Parallel and Distributed Processing Symposium (IPDPS), Vancouver, BC, Canada, 21–25 May 2018; IEEE: Piscataway, NJ, USA, 2018; pp. 885–895. [Google Scholar]
- Von Luxburg, U. A tutorial on spectral clustering. Stat. Comput. 2007, 17, 395–416. [Google Scholar] [CrossRef]
- Hoffman, M.; Steinley, D.; Brusco, M.J. A note on using the adjusted Rand index for link prediction in networks. Soc. Netw. 2015, 42, 72–79. [Google Scholar] [CrossRef]
- Amini, A.A.; Chen, A.; Bickel, P.J.; Levia, E. Pseudo-likelihood methods for community detection in large sparse networks. Ann. Stat. 2013, 41, 2097–2122. [Google Scholar] [CrossRef]
Figure 1.
Internal structure and main definitions of the graph.

Figure 2.
Update of the graph network generation.

Figure 3.
Graph network generated by selecting different algorithm steps.

Figure 4.
Graph network of related transactions in a single enterprise.

Figure 5.
Analysis and prediction of enterprise-related links.

Figure 6.
The distribution and clustering of the number of related enterprises and the frequency of the related events.
Figure 6.
The distribution and clustering of the number of related enterprises and the frequency of the related events.

Figure 7.
(a) Network cluster generated using GNW. (b) A network cluster generated using PMFG.

Figure 8.
Comparison of the Adjusted Rand Index (ARI) indicators of the two algorithms.

Figure 9.
Comparison of the two algorithms with full graph ARI values at different values of k.


Table 1.
Attribute space of the related transaction graph network.
| Space Name | Attribute Description |
|---|---|
| Enterprise attribute space | Correlation property represents the correlation property belonging to the index type and takes an integer value in [1,5]. |
| Size represents the related enterprise scale and belongs to the numerical type. Size = . The amount of registered capital of the related parties is the logarithm with a base of 10,000. | |
| Industry belongs to the index type and adopts the code of the annual industry classification guidance of China Securities Regulatory Commission (CSRC). | |
| Attribute space of transaction relationship | = (Type, Contract amount, Frequency) |
| Type represents the type of related transaction and belongs to the index type. It takes an integer value in [1,11] and refers to the 11 types of related transactions of enterprise accounting standards. | |
| Contract amount refers to the transaction contract amount, which is a numerical type and a positive real number. | |
| Frequency represents the transaction frequency, which belongs to the numerical type and is an integer. | |
| takes the capital flow direction as the marking basis of the access node. For example, in commodity sales, the enterprise receiving funds are in the investment, the enterprise paying the funds are . | |
| Notes | 1. This paper takes the domestic region as an example, and then the overseas region can be embodied by the expanded code. 2. The numerical attributes in the attribute space of the related transactions can only be algebraic, set, or Boolean, while the attributes in the enterprise attribute space can only be set or Boolean. |
© 2020 by the authors. Licensee MDPI, Basel, Switzerland. This article is an open access article distributed under the terms and conditions of the Creative Commons Attribution (CC BY) license (http://creativecommons.org/licenses/by/4.0/).
Share and Cite
MDPI and ACS Style
Liang, Z.; Pan, D.; Deng, Y. Research on the Knowledge Association Reasoning of Financial Reports Based on a Graph Network. Sustainability 2020, 12, 2795. https://doi.org/10.3390/su12072795
AMA Style
Liang Z, Pan D, Deng Y. Research on the Knowledge Association Reasoning of Financial Reports Based on a Graph Network. Sustainability. 2020; 12(7):2795. https://doi.org/10.3390/su12072795
Chicago/Turabian StyleLiang, Zhuoqian, Ding Pan, and Yuan Deng. 2020. "Research on the Knowledge Association Reasoning of Financial Reports Based on a Graph Network" Sustainability 12, no. 7: 2795. https://doi.org/10.3390/su12072795
Note that from the first issue of 2016, this journal uses article numbers instead of page numbers. See further details here.