Research on the Psychological Model of Free-floating Bike-Sharing Using Behavior: A Case Study of Beijing

1
Beijing Key Laboratory of Traffic Engineering, College of Metropolitan Transportation, Beijing University of Technology, Beijing 100124, China
2
Beijing Municipal Institute of City Planning and Design, Beijing 100045, China
*
Author to whom correspondence should be addressed.
Sustainability 2020, 12(7), 2977; https://doi.org/10.3390/su12072977
Submission received: 6 March 2020
/
Revised: 3 April 2020
/
Accepted: 3 April 2020
/
Published: 8 April 2020
(This article belongs to the Special Issue Toward Sustainability: Bike-Sharing Systems Design, Simulation and Management)
Abstract
:As a clean, sustainable transport tool, bicycles have significant advantages in short-distance travel. Despite many efforts assumed in Beijing to improve the cycling environment, the popularity of cycling remains relatively low. However, the advent of the free-floating bike-sharing (FFBS) system has engendered an unexpected cycling enthusiasm in Beijing. Therefore, it is of great importance to delve into why travelers prefer FFBS as a transportation form from a psychological perspective. In this paper, 352 valid questionnaires were collected from an online survey, and an extended theory of planned behavior (TPB) was adopted to examine the psychological determinants of intention and actual behavior to use FFBS. The results showed that men and car-owners prefer vehicles and show a lower willingness to use FFBS. In contrast, residents under the age of 60, residents with FFBS riding experience, and residents skilled in cycling are inclined to use FFBS; the economic convenience of FFBS is the most important attractant for FFBS, while bad weather is the biggest hindrance factor for residents to use FFBS; however, imperfection in infrastructure has no significant impact on reducing residents’ willingness to use FFBS. These results have important implications for planners to better understand the FFBS use behavior, and several suggestions are proposed to support the policymaking about FFBS.
1. Introduction
Cycling is widely acknowledged as a sustainable and clean mode of travel with significant advantages in short-distance travel [1]. It is commonly considered a healthy lifestyle to reduce deaths caused by the urban sedentary lifestyle and an effective way to alleviate air pollution caused by automobile exhaust [2,3,4]. During the 1980s, China was called the “kingdom of bicycles”, and bicycles were the most common urban transportation. However, with the rapid development of motorization and urbanization, the proportion of cycling in Beijing had declined from 62.7% in 1986 to 12.4% in 2015 (see Figure 1) [5], due to a variety of factors. The increasing travel distance with the fast growth at the urban scale is partly responsible for the decrease of bicycle usage. Fifty-five percent of journeys in Beijing are still within five kilometers according to a 2014 survey, thanks to its reasonable urban layout and extensive living facilities. However, twelve percent of these short-distance trips were still made by car, which were fundamentally suitable for cycling [6]. Therefore, it is very important to promote the prevalence of bicycles, particularly for short-distance travel, for the sake of the sustainable development of urban traffic.
According to the success of Copenhagen and other cities, many measures have been taken in Beijing to improve the cycling environment. From 2013 to 2016, more than 700 kilometers of bike lanes were constructed in Beijing; 328,000 square meters of colored intersections were paved; 1702 meters of bike lanes were broadened. However, the popularity of the usage of bicycles as a transportation form is yet dissatisfactory. To promote sustainable transportation, the bike-sharing system has been valued. There are mainly three types of bike-sharing programs, including the public bike-sharing system (PBS), the closed campus bike-sharing system (CBS), and free-floating (FFBS). CBS (Figure 2a) is a kind of bike-sharing system that is used only inside the campus. PBS (Figure 2b) is often run or subsidized by the government, involving massive docking station constructions, whilst FFBS is a newer form, which has been developing rapidly in China since 2016. It is found that FFBS (Figure 2c) not only provides a new kind of sharing mode, but also gives rise to an unexpected change for sustainable transport [7].
FFBS, which is represented by OFO and MOBIKE, has emerged in China at the right moment as a result of the mobile Internet. FFBS are completely sponsored and operated by enterprises. They have overcome the limit of fixed sites, that is people can rent or return bikes anywhere. Each bike can be located by a Global Positioning System (GPS) module in its smart lock. Users can rent bikes by scanning a QR code (a kind of two-dimensional code) with the help of a smartphone. [7] By June 2018, over 1.9 million bikes were available, and the average amount of daily usage reached approximately 2,250,000. The declining trend of the share rate of cycling for the past few years has been altered, or even slightly increased by 1.1%, with the emergence of FFBS [5]. Such progress is beyond the other approaches. Therefore, it is of great importance to understand the motivations and barriers underlying the usage of shared bikes, so that further methods can be proposed to enhance the sustainability of FFBS and, more importantly, to promote the development of cycling.
2. Literature Review
In order to understand the cycling prevalence of FFBS, numerous studies have been conducted. The present research is mainly concerned with the impact of various factors such as social demography, travel details, infrastructure, meteorological environment, and FFBS operating system. Factors influencing the use of bicycles and PBS, which constitute a part of the basis for the current research, were also included in the literature review.
FFBS usage is related to social demographic factors. Most studies demonstrated that male cyclists outnumber female cyclists. Pucher et al. [8] believed that there was a negative correlation between cycling frequency and age. The results of Guo showed that the usage of FFBS was affected by household bicycle/car ownership [9]. It is generally believed that PBS users have high average incomes [10], high levels of education [11], and full-time or part-time employment [12]. In addition to social demographic factors, travel details also affect FFBS usage: travel distance has a greater influence than travel time and purpose [9,13,14]. Likewise, there is a relationship between infrastructure and FFBS usage. According to the study of Gamez-Perez [15], a safe and adequate infrastructure is a guarantee for the potential usage of FFBS. Barnes [16] found that setting up a dedicated bike road could increase the amount of cyclists by 1% to 2%. Stinson and Bhat [17] made a survey and found that cyclists preferred continuous roads in cycling. Environmental factors are often a barrier to the use of FFBS. The study results of Li [18] showed that reduced air pollution exhibited a favorable influence on non-motorized transport usage. It was also found that rainy weather discouraged the use of public bikes [19]. Demand for FFBS is evidently reduced by temperature and poor air quality [20]. Additionally, the exclusive advantages of FFBS are particularly important for its popularity. First of all, convenience is the major motivator for FFBS use [21]. Other merits such as favorable ease of access with a smart phone, convenience of pickup and parking, low expense [22], and extensive presence of docking stations within 250 m of their workplace were found to be statistically significant contributions to the preference for shared bikes [10], while primary obstacles for FFBS usage came from malfunction and limited regulations [23]. Additionally, FFBS is confronted with competition from the others transportation in terms of cost and travel experience [24].
However, the interrelationship between these factors is complex, and the governing mechanism is unclear. Scholars try to explore the unobservable potential variables based on the perspective of social psychology. Some new aspects of social psychology have been explored with the widespread application of planned behavior theory (TPB) [25], among which attitude, social norms, and perceived behavior control are the three most important potential variables.
In the early stage, the cycling behavior was studied based on TPB, and some general laws were found. Dill [26] argued that a positive attitude toward cycling led to the increase of the likelihood of cycling. Similarly, Abraham et al. [27] argued that negative views of driving also encouraged people to use bicycles. The studies of De [28] showed that cyclists were more likely to get help and support from cycling groups. At the same time, Bamber [24] found that people who had ridden a bicycle had less anxieties about and more willingness toward cycling. TPB can be also used to explain the intentions and behaviors towards FFBS. Scholars studied the social effects of shared bikes: the membership increase of shared bikes seemed to be slightly due to contagion from neighboring membership [29]. Social influence has a positive effect on users’ trust attitude and hence subjective well-being [30]. According to a structural equation model (SEM) of intentions, the significance of factors is a sequence of subjective norms > attitude > perceived pleasure > effects of flexibility and convenience [31].
Compared with bicycles, except for some common socio-demographic factors, the use of PBS and FFBS is more susceptible to the system factors and perceived potential variables, while the infrastructure displays an insignificant influence. More details are shown in Table 1.
2.1. Theory of Planned Behavior
The following variables are involved according to the theoretical framework of standard TPB: ATT (attitude), SN (subjective norm), PBC (perceived behavior control), BI (intention), and BV (behavior) [25]. Attitude indicates negative or positive assessment of persons towards some behavior; a subjective norm refers to the detailed feelings of other people regarding decision making; and PBC is similar to the concept of self-control over one’s own behavior. On the basis of TPB, behavior is mainly predicted by intentions, which inversely suffer from the influences of ATT towards the behavior, PBC over the behavior, and SN pertaining to the behavior.
TPB is a kind of primary social-cognitive theory developed by Ajzen [25], who implied that personal behavior is mainly predicted by behavioral intentions, which are further determined by three salient motivational factors: attitude, subjective norms, and perceived behavioral control (PBC). Despite that the basic model could provide an interpretation for a majority of the alterations in intention, several scholars have proposed that it would lead to an evident improvement in its explanatory power with consideration of attitudes toward bad weather, attitudes toward cars [32], and external restrictions (infrastructure). On the basis of TPB, Han et al. [33] predicted the intention of bike traveling, using the attractiveness of unsustainable alternatives as a moderator and personal norm and past behavior as predictors. The results offered a thorough understanding of the role of volitional and non-volitional processes, personal norm, past behavior, and the attractiveness of unsustainable alternatives in explaining the intention formation of bike traveling. The predicted intention of car usage [24] indicated that role beliefs increased the explanatory power of the Ajzen model, and car use habit significantly contributed to the predictive power of the Ajzen model, while the personal norm exerted an insignificant effect either on intention or on behavior.
However, the explanatory power of these variables was involved in a few related explorations for FFBS usage. As a consequence, the present study employed an extended the TPB model that accounted for the basic TPB model, as well as attitudes toward bad weather, attitudes toward cars, and external restrictions regarding infrastructure, to explain FFBS usage intentions and behaviors.
2.1.1. Original PBC Variables
Perceived behavior control (PBC): Perceived behavior control means self-control over one’s own FFBS usage behavior.
Subjective norm (SN): Subjective norms mean the social pressure received from several important referents to perform a particular behavior.
Attitude towards FFBS (BATT): Attitude towards FFBS is the original attitude, explained as the extent of one’s favor or praise towards FFBS usage behavior (BATT is used to represent attitude towards FFBS here to distinguish it from other attitudes).
2.1.2. Additional Variables
Attitude towards cars (CATT): Attitude towards cars represents the inclination toward FFBS usage on the condition of the preference for cars.
Attitude towards bad weather (WATT): Attitudes towards bad weather, exhaust fumes, and haze represent the inclination towards FFBS usage in the case of bad weather.
External restrictions regarding infrastructure (IER): External restrictions regarding infrastructure reflect restrictions for FFBS use that are beyond the control of the user.
In order to explain the prevalence in the choice of FFBS as a mode of transport, three main concerns are involved in the present paper, including: (1) identification of the psychosocial factors that play a role in FFBS use intention and actual behaviors; (2) the complex interrelation among those factors; (3) advice for promoting FFBS use. It should be noted that this paper mainly discusses the influence of cars on the use of FFBS, considering that travelling by bus belongs to a green mode of transportation.
3. Research Hypotheses
For the sake of an interpretation of the FFBS usage behavior in Beijing, the TPB model was incorporated in the current study. Besides, a special concern of the current study refers to the direct influence of attitudes toward bad weather, attitudes toward cars, and external restrictions regarding infrastructure, together with their effects as mediators that account for FFBS usage behaviors. A hypothesis framework was proposed based on the summary of the above discussion. The hypotheses and the proposed model (Figure 3) are shown as follows.
Hypothesis 1 (H1).
Intention shows a positive relation toward FFBS usage behaviors.
Hypothesis 2 (H2).
PBC (H2a), SN (H2b), and BATT (H2c) will positively predict FFBS usage intentions.
Hypothesis 3 (H3).
WATT (H3b) and IER (H3c) will have negative, direct effects on users’ intentions to use FFBS.
Hypothesis 4 (H4).
PBC will positively predict users’ behavior toward the use of FFBS.
Hypothesis 5 (H5).
IER has an influence on intention by reducing BATT.
4. Methods
4.1. Participants and Procedure
In this study, data were collected within five days in July 2018 from an online survey in Beijing. The questionnaire link was forwarded to 12 WeChat groups covering people with differences in age, education, and cycling experience. To ensure that all the respondents were residents living in Beijing, the questionnaire link was set with IP restrictions accessible only for respondents in Beijing. Three-hundred-eighty-five group members responded, and each were paid CNY 4 (approximately $0.44). After the filtration of incomplete data and extreme data (i.e., those respondents whose answering time was 6 min less than the minimum time limit), there were in all 352 valid questionnaires from 197 women and 155 men, with an acceptable proportion of 91.43%.
4.2. Measure
The questionnaire included 3 parts: introduction, demographic information, and latent variable items. The introduction part helped participants complete the questionnaire; the demographic information part mainly included gender, age, income, education, occupation, vehicle ownership, cycling ability, frequency of FFBS use, and working location; and the latent variable items were derived from the hypothetical framework of this paper and previous studies. According to the actual usage of shared bikes, a six-point scale was designed to measure the variable BV, and the other variables were evaluated according to a five-point Likert scale, ranging from 1 = “strongly unlikely” to 5 = “strong likely”. A further revision was employed for the questionnaire to enhance its clarity and reliability based on feedback, after a pretest of 100 people.
- ▪
- Perceived behavior control (PBC):Three items were used to assess perceived behavior control.Respondents demonstrated the following three behavioral beliefs for FFBS:PBC 1: I have the ability to pay the deposit;PBC 2: I can afford a membership card;PBC 3: I can afford to use it;
- ▪
- Subjective norm (SN):Five items were used to assess subjective norm.SN1: My friends would support me to use shared bikes;SN2: My family would support me to use shared bikes;SN3: Most people in society would support me to use shared bikes;SN4: News medium would support me to use shared bikes;SN5: Social media would support me to use shared bikes;
- ▪
- Attitude towards FFBS (BATT):Five items were used to assess residents’ attitude towards FFBS.BATT1: It is economical because I don’t have to buy a bicycle;BATT2: It is economical because it’s cheap to use;BATT3: It is convenient because it can be rented anywhere;BATT4: It is convenient because I can stop to do other things at any time in travel;BATT5: It is convenient for I need not to worry about maintenance and theft;
- ▪
- Attitude towards cars (CATT):Five items were used to assess residents’ attitude towards cars.CATT1: It is economical;CATT2: It is convenient;CATT3: It is efficient;CATT4: It is comfortable;CATT5: It is safe;
- ▪
- Attitude towards bad weather (WATT):Two items were used to assess residents’ attitude towards bad weather.WATT1: It is uncomfortable as it exposes me to exhaust fumes and haze directly;WATT2: It is uncomfortable because I might suffer from bad weather;
- ▪
- External restrictions regarding infrastructure (IER):Three items were used to assess residents’ attitude towards bad weather.IER 1: Incomplete bike lanes would limit my use of FFBS;IER 2: Insufficient parking space would limit my use of FFBS;IER 3: Poor cycling environment (shade) would limit my use of FFBS;
- ▪
- FFBS usage intentions (BI):Three items were used to measure residents’ FFBS usage intentions.IN1: I intend to travel by shared bikes frequently in the next three months;IN2: I try to travel by shared bikes frequently in the next three months;IN3: I plan to travel by shared bikes frequently in the next three months;
- ▪
- FFBS usage behavior (BV):The FFBS usage behavior was measured by one item:BV1: How often have you used BSS in the past three months? (1 never 2 once a month 3 once a week 4 2–4 times a week 5 almost every weekday 6 almost every day)
5. Results
5.1. Demographic Results
After deleting responses that did not meet the minimum response time requirement, 352 valid samples with 155 males and 197 females were collected from the survey. This distribution was basically consistent with the permanent resident population structure in Beijing in 2019 with 50.8% male and 49.2% female [34]. The average age was 30.77 (SD = 9.58). The proportion of the surveyed people under 12 or over 65 was relatively small compared to the age distribution of the permanent resident population in Beijing. The reason was mainly due to the survey being conducted by means of WeChat. However, considering the prohibition of children under 12 to use a shared bike and the inconvenience of elderly people over 65, who seldom ride a bike, such a discrepancy did not have a sensible influence on the following discussion. Different income levels, occupations, education levels, and working locations were covered. Thirty-one-point-two-five percent of participants owned cars, and 41.48% of participants owned private bicycles. With regard to FFBS usage frequency, only 10 participants had never used shared bikes in the past three months (2.84%), and more than half of participants used bicycles regularly (63.07%). More details are shown in Table 2.
Independent t-tests proved to be suitable for the analysis of the difference between two independent groups of small samples [35] and were conducted to analyze the differences between two independent groups in terms of seven extended TPB variables (e.g., male/female, old/young, have cycling experience/not, owning a car or a bike/not, riding ability/not), respectively. Men usually had a more friendly attitude towards cars than women; residents under 60 years old had stronger perceived behavioral control, subjective norms, and external restrictions regarding infrastructure; they were also more likely to use FFBS. Attitudes toward cars showed significant differences in car ownership: residents who owned cars had better attitudes toward cars. However, the difference was absent between the group of bicycle owners and that without a bicycle. Residents with FFBS cycling experience showed stronger subjective norms and less preference for cars than those without FFBS cycling experience. In addition, people with good cycling skills had stronger subjective norms (see Table 3).
For the sake of further exploring the significant difference of demographics in FFBS usage frequency, a variance analysis [36] was conducted after a normality test. The results showed that gender, age, cycling ability, car ownership, occupation, and education level contributed to the variation in the use frequency of FFBS (see Table 4). Men, young people, and students were more likely to use shared bikes. Residents with a car and cycling ability showed higher enthusiasm toward shared cycling. A high education level also showed higher bike-sharing use frequency.
5.2. Reliability and Validity Analysis
The scale in this study was redesigned based on TPB. Therefore, the quality of the scale needed to be re-evaluated to test the validity and reliability of the questionnaire and ensure that the questionnaire could reflect the objective reality.
5.2.1. Reliability Analysis
In order to examine the reliability of the collected data, a corresponding analysis was carried out for the extended TPB scale. Calculation of Cronbach’s alpha provided a method for the estimation of the internal consistency of the questionnaire and of each factor of the remaining items according to the exploratory factor analysis. As shown in Table 2, the reliability for each of the remaining factors was larger than 0.60, and the total scale α = 0.792, indicating the acceptable reliability of the TPB questionnaire.
5.2.2. Validity Analysis
Exploratory factor analysis [37] provides assistance in the determination of the contribution from indicators to the evaluation of each latent variable. Before the factor analysis, the KMO test and the Bartlett test were required to analyze the correlation between variables and the independence between variables, respectively. KMO = 0.804, and the Bartlett test showed a significance level of p < 0.01, indicating the suitability for the factor analysis. The approach to derive principal components by means of varimax rotation was subsequently employed for the identification of seven factors. Items should be assigned to factors based on their factor loadings. In the case of a factor loading less than 0.4 or the presence of cross-loading in more than one factor, the items should be removed [38]. The eigenvalues for the seven factors—PBC, SN, BATT, CATT, WATT, IER, and BI—were 2.251, 3.353, 3.396, 2.745 1.570, 2.389, and 2.333, respectively. The seven factors could explain the variations of 8.66%, 12.90%, 13.06%, 10.56%, 6.04%, 9.19%, and 8.97%, respectively. The accumulative variance for the contribution rate was 69.38%, and each of the seven factors had a value above one (see Table 5). Consequently, the validity and reliability of the extended TPB questionnaire were confirmed, and thus, the extended TPB questionnaire was a feasible measurement for the use behavior of FFBS.
5.3. Correlation Analysis
As Table 6 shows, SN, BATT, CATT, WATT, and IER were highly correlated with the intention to use FFBS; PBC, SN, BATT, CATT, and IER were highly correlated with the FFBS use behavior.
5.4. Structural Equation Modeling
Based on an unbiased method via Amos 17.0, a structural equation model was established to explore the relationship among potential variables and confirm the results of the exploratory analysis through a confirmatory factor analysis (see Figure 4). Such an analysis approach is able to estimate latent variables with the indicators and to further relate them with an observed measure of the studied object, which is the frequency of FFBS use for the present case.
Results of Hypotheses Testing
Attitudes toward FFBS (β = 0.55, p < 0.001) produced the foremost predictive contribution to intention, followed by subjective norms (β = 0.39, p < 0.05), supporting H2b and H2c, respectively. Although perceptual behavior control had no direct effect on intention, it positively predicted users’ behavior to use FFBS (β = 0.12, p < 0.01), rejecting H2a and supporting H4. Attitudes toward bad weather (β = −0.84, p < 0.001) produced the largest direct and negative predictive influence on intention, with the second foremost contribution from attitudes toward cars (β = −0.17, p < 0.001), supporting H3b and H3a, respectively. However, the direct effects of external constraints regarding infrastructure (β = −0.24, p > 0.05) on intention were of little significance, thereby rejecting H3c and H5. Lastly, intention gave a significant prediction of users’ behavior to use FFBS (β = 0.47, p < 0.001), completely supporting H1.
The χ2 test and its fit indices (root mean squared error of approximation (RMSEA), efficiency of fit index (GFI), incremental fit index (IFI), non-normed fit index (NNFI), Tucker–Lewis coefficient (TLI), and comparative fit index (CFI)) were employed to determine whether the actual data were in general agreement with the proposed model. According to the results of the fit indexes from Table 7, the values of χ2/df ranged from one to three, indicating the general consistency between the model and data. Additionally, the RMSEA < 0.08, and only the NFI was slightly below the standard value. Meanwhile, the remaining fit indexes were greater than 0.9. The results indicated a favorable fit ability; thus, the model met our expectations regarding statistical adequacy.
6. Discussion
The current study was primarily aimed at identifying the psychosocial variables that play a role in FFBS use intention and actual behaviors, as well as to further explore the complex interrelation among those factors and to provide a useful effective method to promote FFBS use.
As expected, the extended planned behavior theory in this paper could reasonably explain FFBS usage intention and behavior. The structure involved herein showed that the positive indicators associated with FFBS usage could be revealed through three latent variables: perceived behavioral control, subjective norms, and residents’ attitudes toward FFBS, among which residents’ attitudes toward FFBS were related to indicators that made cycling a competitive mode of transport. On the other hand, the negative indicators associated with FFBS usage could be revealed through three latent variables: attitudes toward cars, attitudes toward bad weather, and external constraints regarding infrastructure, among which bad weather was the biggest obstacle for residents to use FFBS.
6.1. Influence of Demographic Variables
The current study investigated the correlation between extended TPB variables and demographic factors. According to the results of independent t-tests, residents’ gender, age, car ownership, FFBS riding experience, and riding ability had significant influences on the psychological variables. In the current study, men showed a better attitude toward cars; one reasonable explanation might be that cars exhibit more attraction for men than for women and that women account for a relatively small proportion of licensed drivers. [39]. This implied that motivation for car usage was quite different for men and women. Thus, men could be affected by factors that might make little sense for women. People under 60 years old were more willing to use FFBS, which might be due to the higher ability of young people to accept new things, and studies showed that people who were more receptive to new things were more likely to perceive the ease of use and usefulness of shared bikes [40]. There was a dissimilarity in attitudes towards cars between people with cars and those without. This was related to car owners being used to driving for travel, and thus, they were less susceptible to new ways of travel. In the current study, there was a clear difference between the perceptions of users that had FFBS experience and those that never used a shared bike [41], which was consistent with previous studies. Adequate advice for the promotion in FFBS is to encourage people to experience FFBS riding [42]. In addition, it was reasonable that FFBS was more attractive for skilled cyclists with stronger subjective norms. On the other hand, according to the results of the analysis of variance, the significant influence of different demographic variables on the frequency of shared bikes was identified through this study. Men, younger people, and students were more likely to use shared bikes. Car owners and skilled cyclists showed higher enthusiasm toward shared cycling. Well-educated cyclists also showed higher inclination to becoming bike-sharing users.
6.2. Influence of Psychosocial Variables
6.2.1. Perceptual Behavior Control
The perceptual behavior control explained by resources and ability (deposit, membership card, cost) had a direct and predictive effect on FFBS use behavior: the stronger the perceived behavioral control, the more likely residents were to use FFBS, consistent with previous work [43]. Therefore, it is adequate advice to lower the cost for FFBS usage.
6.2.2. Subjective Norms
A general consensus has been achieved by most researches that subjective norms have predictive effects on intention [44], also confirmed in this study. In addition, the results from the current study revealed the crucial role that social media, news media, and society play in FFBS prevalence. With the development of society, people are more and more dependent on social media and news media for information. Moreover, shared bikes have obvious social attributes, which leads to the significant influence of media on residents’ behaviors. Policies could encourage the recommendation of this environmentally-friendly travel mode to neighboring friends, relatives, and social contacts [7,45]. On the other hand, urban governments should dispel residents’ anxieties through news media, social atmosphere, and word-of-mouth among groups [3] to improve residents’ willingness to use shared bikes.
6.2.3. Attitudes toward FFBS
The results of this paper showed that a positive attitude towards shared bikes was the key to promote residents to use shared bikes. One possible explanation might be the unique advantages of FFBS that it can be rented and returned anywhere and anytime with a low cost and that in some cases, it could replace one’s own bicycle, as well as the users are relieved from the maintenance work and security anxieties. These are beyond the capability of other vehicles. This result was in accordance with the finding of Yan [31]: the more these characteristics are perceived by the cyclist with use, the more important convenience becomes to explain their decisions. This paper also explored the success of FFBS over the PBS launched by the Beijing government. Although there are seemingly plenty of PBS stations in Beijing, people often have to walk more than 200 m to a fixed site to rent a bike, and they are not sure about the location or the existence of a PBS station near the destination. In addition, the procedure to register membership and get a card is time consuming, and thus, it is impractical for non-members to use a bike right away. However, all these inconveniences are eliminated with FFBS: people can even get an available shared bike at the gate of the community by scanning a QR code with a smartphone and leave the bike anywhere at the destination. Therefore, the convenience of user experience belongs to an important user experience that FFBS operators should further improve, and some potential approaches for the improvement of the service level should also be considered.
6.2.4. Attitudes toward Cars
The current study confirmed the competitive relationship between cars and FFBS. The more friendly residents are toward cars, the less likely they are to choose shared bikes. Koller found that car usage is often accompanied by functional, economic, emotional, and social values [32]. Interestingly, contrary to expectations, the results of this paper indicated that the “comfort and safety of cars” was the main reason for people to choose cars over “time saving”. Such a conclusion was established based on the transportation mode itself and the perception of users, without considering other potential factors such as the daily intention to ride a bike. Therefore, in an area suitable for bicycle travel (such as the transit-oriented development area), targeted measures and designs to limit cars, such as higher parking fees, less parking convenience, and building a dense road network in small blocks, can effectively improve residents’ intention to choose FFBS.
6.2.5. Attitudes toward Bad Weather
Previous studies had consistently reported the negative effects of bad weather, such as rainy weather [19], temperature, and poor air quality [18] as observation variables. In the present study, attitudes toward bad weather represented by variables of rainy weather, exhaust fumes, and haze were also a significant factor for intention, consistent with previous work. This may be due to the limitation of FFBS. Residents’ intention to travel by shared bikes will be greatly reduced under harsh travel environment such as rain, snow, exhaust fumes, and haze. Therefore, it is a key consideration for FFBS operators to address the restrictions of bicycles by corresponding optimization, such as the incorporation of fenders and adding rain shelters.
6.2.6. External Restrictions Regarding Infrastructure
Previous studies have emphasized the importance of infrastructure for bike or shared bike trips; however, this paper showed a different conclusion: limitations regarding infrastructure such as inadequate bike lanes had no significant effect on the change in the willingness to use FFBS. One possible explanation is that in terms of infrastructure in Beijing, which is far from satisfactory even with the improvement in recent years, the convenience brought by FFBS outweighs the obstacles of infrastructure. This conclusion explains why Beijing’s efforts in infrastructure are not as significant an effect on shared bike usage.
7. Conclusions
This study conducted an online survey in Beijing and then adopted an extended TPB to examine the psychological determinants of intention and actual behavior to use FFBS. Both reliability and validity analysis confirmed the reasonability of the extended TPB with regard to interpreting Beijing residents’ intentions to adopt FFBS. The main findings in this study were as follows.
- The SEM model outputs showed that H1, H2b, H2c, H3a, H3b, and H4 were supported, while H2a and H3c were rejected. Psychological variables influencing residents’ use of FFBS were divided into motivation factors and hindering factors. Among them, perceived behavior control, subjective norms, and attitude toward FFBS were the motivating factors, while friendly attitude toward cars, attitude toward bad weather, and external restrictions of infrastructure were the hindering factors.
- The economic convenience of FFBS was the most important attraction factor for residents to use FFBS, while bad weather was the biggest hindrance factor for residents to use FFBS. However, barriers of imperfect infrastructure had no significant impact on reducing residents’ willingness to use FFBS.
- The overall process simplification and high convenience were the main reasons for FFBS’s success in promoting sustainable transport development over PBS and efforts in infrastructure.
- For FFBS operating enterprises, the use threshold (reducing costs, etc.) and system convenience (scheduling, etc.) are key to improve the utilization of FFBS. For governments, the car restrictions (raising parking costs, etc.) and the bicycle travel restrictions improving (adding shelters, etc.) play an important role in the development of sustainable transport.
Limitations and Future Research Needs
This study also had limitations. First, both cars and buses form a competitive relationship with FFBS in short-distance travel. Considering the green travel mode of buses, this paper mainly discussed the influence of car attitude on the use of FFBS. The influence of buses will be studied in future research. In addition, publicity and experience of using FFBS have been found influential in the use of FFBS, yet the effects of the intervention are not clear; thus, the effect assessment of psychological intervention measures could be carried out in future work, so as to evaluate the effects.
Author Contributions
Conceptualization, D.X.; data curation, S.S.; methodology, D.X.; resources, Y.B.; writing, original draft, D.X.; writing, review and editing, Y.B. and S.S. All authors have read and agree to the published version of the manuscript.
Funding
This research received no external funding.
Conflicts of Interest
The authors declare no conflict of interest.
References
- Heredia, A.; Monzón, A.; Jara-DíazIt, S. Understanding cyclists’ perceptions, keys for a successful bicycle promotion. Transp. Res. Part A Policy Pract. 2014, 63, 1–11. [Google Scholar] [CrossRef]
- Heinen, E.; Maat, K.; Wee, B.V. The role of attitudes toward characteristics of bicycle commuting on the choice to cycle to work over various distances. Transp. Res. Part D Transp. Environ. 2011, 16, 102–109. [Google Scholar] [CrossRef]
- Cervero, R.; Duncan, M. Walking, bicycling, and urban landscapes: Evidence from the San Francisco Bay Area. Am. J. Public Health 2003, 93, 1478–1483. [Google Scholar] [CrossRef] [PubMed]
- Yan, X.; Handy, S.L.; Mokhtarian, P.L. Factors associated with proportions and miles of bicycling for transportation and recreation in six small US cities. Transp. Res. Part D Transp. Environ. 2010, 15, 73–81. [Google Scholar]
- Beijing Transport Annual Report 2017. Available online: http://www.bjtrc.org.cn/JGJS.aspx?id=5.2&Menu=GZCG (accessed on 26 August 2019).
- The Fourth Comprehensive Traffic Survey in Beijing. Available online: http://www.bjtrc.org.cn/JGJS.aspx?Id = INN20120227005 & Menu = YJXMNR&sort = JCYJ (accessed on 26 August 2019).
- Xu, D.D.; Bian, Y.; Rong, J.; Wang, J.C.; Yin, B.C. Study on Clustering of Free-Floating Bike-Sharing Parking Time Series in Beijing Subway Stations. Sustainability 2019, 11, 5439. [Google Scholar] [CrossRef] [Green Version]
- Pucher, J.; Buehler, R. Why Canadians cycle more than Americans: A comparative analysis of bicycling trends and policies. Transp. Policy 2006, 13, 265–279. [Google Scholar] [CrossRef] [Green Version]
- Guo, Y.Y.; Zhou, J.B.; Wu, Y. Identifying the factors affecting bike-sharing usage and degree of satisfaction in Ningbo, China. PLoS ONE 2017, 12, e0185100. [Google Scholar] [CrossRef] [Green Version]
- Fishman, E.; Washington, S.; Haworth, N.; Watson, A. Factors influencing bike share membership: Analysis of Melbourne and Brisbane. Transp. Res. Part A Policy Pract. 2015, 71, 17–30. [Google Scholar] [CrossRef] [Green Version]
- Shaheen, S.; Cohen, A.P.; Martin, E.W. Public bikesharing in north America: Early operator understanding and emerging trends. Transp. Res. Rec. J. Transp. Res. Board 2013, 1568, 83–92. [Google Scholar] [CrossRef]
- Woodcock, J.; Tainio, M.; Cheshire, J.; O’Brien, O.; Goodman, A. Health effects of the London bicycle sharing system: Health impact modelling study. Br. Med. J. 2014, 348, 1–14. [Google Scholar] [CrossRef] [Green Version]
- Pan, C.; Guo, Z. A study on commuting behavior selection of commuters under social interaction effect. Transp. Syst. Eng. Inf. 2017, 17, 101–106. [Google Scholar]
- Zhao, P.; Li, S. Bicycle-Metro integration in a growing city: The determinants of cycling as a transfer mode in metro station areas in Beijing. Transp. Res. Part A Policy Pract. 2017, 99, 46–60. [Google Scholar] [CrossRef]
- Gámez-Pérez, K.M.; Arroyo-López, P.; Cherry, C.R. Defining a Primary Market for Bikesharing Programs. Transp. Res. Rec. J. Transp. Res. Board 2017, 2634, 50–56. [Google Scholar] [CrossRef]
- Barnes, G.; Thompson, K. A longitudinal analysis of the effect of bicycle facilities on commute mode share. In Proceedings of the 85th Annual Meeting of Transportation Research Board, Washington, DC, USA, 22–26 January 2006. [Google Scholar]
- Stinson, M.; Bhat, C. Frequency of bicycle commuting: Internet-based survey analysis. Transp. Res. Rec. J. Transp. Res. Board 2004, 1878, 122–130. [Google Scholar] [CrossRef] [Green Version]
- Li, W.; Kamargianni, M. Air pollution and seasonality effects on mode choice in China. Transp. Res. Rec. J. Transp. Res. Board 2017, 2634, 101–109. [Google Scholar] [CrossRef]
- Lu, C.; Xu, F.; Dong, S. Observations of Public Bikesharing. Transp. Res. Board 2017, 2662, 93–101. [Google Scholar] [CrossRef]
- Campbell, A.A.; Cherry, C.R.; Ryerson, M.S. Factors influencing the choice of shared bicycles and shared electric bikes in Beijing. Transport. Res. Part C Emerg. Technol. 2016, 67, 399–414. [Google Scholar] [CrossRef] [Green Version]
- Fishman, E. Bikeshare: A Review of Recent Literature. Transp. Rev. 2015, 36, 92–113. [Google Scholar] [CrossRef]
- Gu, T.; Kim, I.; Currie, G. To be or not to be dockless: Empirical analysis of dockless bikeshare development in China. Transp. Res. Part A Policy Pract. 2019, 119, 122–147. [Google Scholar] [CrossRef]
- Li, X.; Zhang, Y.; Du, M. Social factors influencing the choice of bicycle: Difference analysis among private bike, public bike sharing and free-Floating bike sharing in Kunming, China. KSCE J. Civ. Eng. 2019, 23, 2339–2348. [Google Scholar] [CrossRef]
- Bamberg, S.; Schmidt, P. Incentives, morality, or habit? Predicting students’ car use for university routes with the models of Ajzen, Schwartz and Triandis. Environ. Behav. 2003, 35, 264–285. [Google Scholar] [CrossRef]
- Ajzen, I. The theory of planned behavior. Organ. Behav. Hum. Decis. Process. 1991, 50, 179–211. [Google Scholar] [CrossRef]
- Dill, J.; Voros, K. Factors affecting bicycling demand: Initial survey findings from the Portland region. In Proceedings of the 86th Annual Meeting of Transportation Research Board, Washington, DC, USA, 21–25 January 2007. [Google Scholar]
- Abraham, J.; Mcmillan, S.; Brownlee, A.; Hunt, J.; Mcmillan, A. Investigation of cycling sensitivities. In Proceedings of the 81th Annual Meeting of Transportation Research Board, Washington, DC, USA, 13–17 January 2002. [Google Scholar]
- de Geus, B.; De Bourdeaudhuij, I.; Jannes, C.; Meeusen, R. Psychosocial and environmental factors associated with cycling for transport among a working population. Health Educ. Res. 2008, 23, 697–708. [Google Scholar] [CrossRef] [PubMed] [Green Version]
- Schoner, J.; Lindsey, G.; Levinson, D. Is bike sharing contagious? Modeling its effects on system membership and general population cycling. Transp. Res. Rec. J. Transp. Res. Board 2016, 2587, 125–132. [Google Scholar] [CrossRef] [Green Version]
- Ma, L.; Zhang, X.; Ding, X.Y. Bike sharing and users’ subjective well-Being: An empirical study in China. Transp. Res. Part A Policy Pract. 2018, 118, 14–24. [Google Scholar] [CrossRef]
- Yan, R.; Chu, J.L.; Yang, X.G. Intention of urban residents to use public bike-sharing system: A case study in Hefei. J. Transp. Inf. Saf. 2017, 35, 101–107. [Google Scholar]
- Koller, M.; Floh, A.; Zauner, A. Further insights into perceived value and consumer loyalty: A “green” perspective. Psychol. Market. 2011, 28, 1154–1176. [Google Scholar] [CrossRef]
- Han, H.; Meng, B.; Kim, W. Emerging bicycle tourism and the theory of planned behavior. J. Sustain. Tour. 2017, 25, 292–309. [Google Scholar] [CrossRef]
- Beijing statistical yearbook 2019. Available online: http://202.96.40.155/nj/main/2019-tjnj/zk/indexch.htm (accessed on 8 March 2020).
- Cressie, N.A.; Whitford, H. How to use the two sample t-Test. Biom. J. 1986, 28, 131–148. [Google Scholar] [CrossRef]
- Larson, M.G. Analysis of Variance. Circulation 2008, 117, 115–121. [Google Scholar] [CrossRef] [Green Version]
- Spearman, C. General intelligence, objectively determined and measured. Am. J. Psychol. 1904, 15, 201–293. [Google Scholar] [CrossRef]
- Badland, H.; Schofield, G. Understanding the relationships between private automobile availability, overall physical activity, and travel behavior in adults. Transportation 2008, 35, 363–374. [Google Scholar] [CrossRef]
- Kronsell, A.; Rosqvist, L.S.; Hiselius, L.W. Achieving climate objectives in transport policy by including women and challenging gender norms: The Swedish case. Int. J. Sustain. Transp. 2016, 10, 703–711. [Google Scholar] [CrossRef]
- Chen, C.H.; Li, X.Y. Research on the effect factors of customer use intention of shared bicycles. Chin. J. Manag. 2018, 15, 1601–1610. [Google Scholar]
- Rondinella, G.; Fernandez-Heredia, A.; Monzón, A. Analysis of perceptions of utilitarian cycling by level of user experience. In Proceedings of the 91th Annual Meeting of Transportation Research Board, Washington, DC, USA, 12–19 January 2012. [Google Scholar]
- Broach, J.; Dill, J.; Gliebe, J. Where do cyclists ride? A route choice model developed with revealed preference GPS data. Transp. Res. Part A Policy Pract. 2012, 46, 1730–1740. [Google Scholar] [CrossRef]
- Chen, S.Y. Using the sustainable modified TAM and TPB to analyze the effects of perceived green value on loyalty to a public bike system. Transp. Res. Part A Policy Pract. 2016, 88, 58–72. [Google Scholar] [CrossRef]
- Pelling, E.L.; White, K.M. The theory of planned behavior applied to young people’s use of social networking web sites. Cyberpsychol. Behav. 2009, 12, 755–759. [Google Scholar] [CrossRef] [Green Version]
- Gong, X.S.; Xu, L.; Li, Z.L. Research on the relationship between different types of reference group influence and residents’ consumption intentions. Chin. J. Manag. 2017, 14, 1829–1839. [Google Scholar]
Figure 1.
Proportion of bicycle trips in Beijing.

Figure 2.
Bike-sharing program. (a) CBS: campus bike-sharing; PBS: (b) public bike-sharing; (c) FFBS: free-floating bike-sharing.
Figure 2.
Bike-sharing program. (a) CBS: campus bike-sharing; PBS: (b) public bike-sharing; (c) FFBS: free-floating bike-sharing.
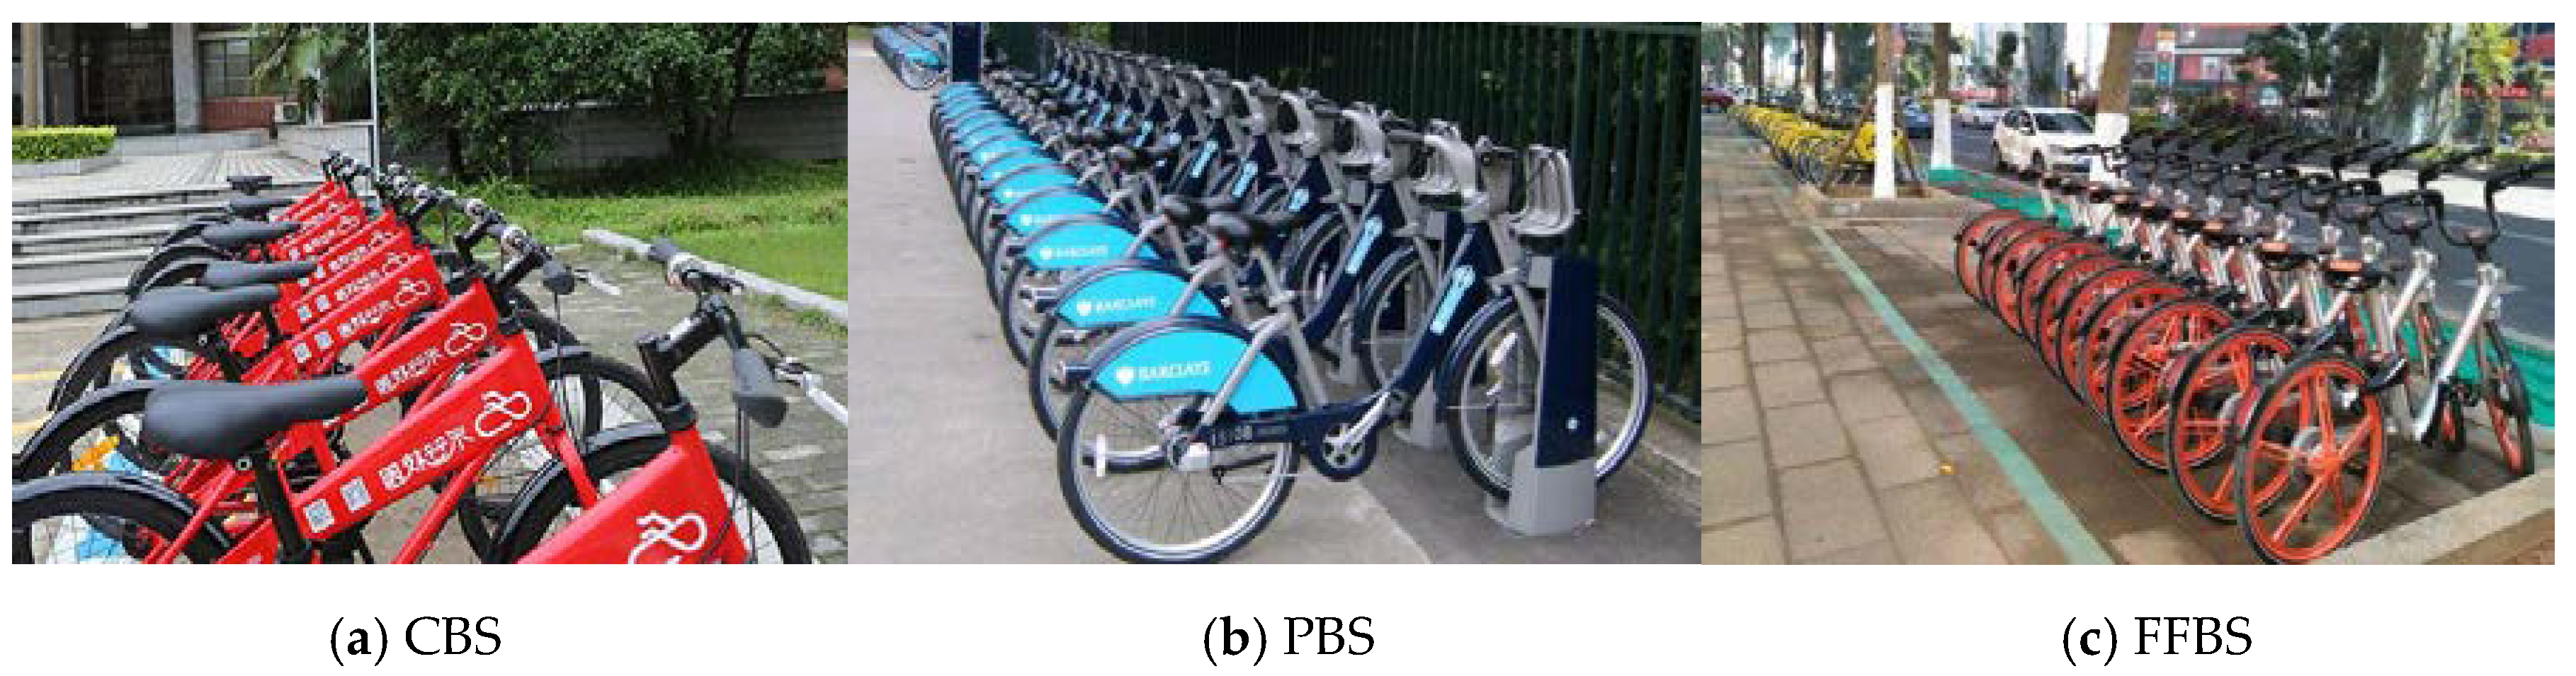
Figure 3.
The proposed path model.

Figure 4.
Path diagram of the proposed model to explain the use of FFBS.


Table 1.
Influence factors for bicycles, PBS and FFBS.
| Bicycle | PBS | FFBS | |
|---|---|---|---|
| Social demographic factor | Age, Gender, Bicycle ownership | Age, Income, Education, Full-/part-time occupation | Bicycle/car ownership |
| Travel factor | Travel distance, Travel purpose | Travel time, Travel purpose | |
| Infrastructure factor | Bicycle road | ||
| Environmental factor | Air pollution | Rainy weather | Poor air, Temperature |
| System factors | Convenience, Member or not | Convenience of pickup and parking, Low expense, Malfunction, Limited regulations | |
| Latent variable | Attitude toward cycling, Attitude toward driving, Experience | Experience, Subjective norm, Attitude, Perceptual behavior control | Experience, Subjective norm, Attitude, Perceptual behavior control, Preference, External restrictions |
Table 2.
Summary of respondents’ demographic information (n = 352).
| Gender | Frequency | Percentage | Occupation | Frequency | Percentage |
|---|---|---|---|---|---|
| Male | 155 | 44.03% | Government/public institution | 41 | 11.65% |
| Female | 197 | 55.97% | Enterprise employers | 122 | 34.66% |
| Age | Frequency | Percentage | Business/service personnel | 10 | 2.84% |
| <18 | 2 | 0.56% | Medical personnel | 4 | 1.14% |
| 19–24 | 101 | 28.69% | Teacher | 16 | 4.55% |
| 25–34 | 152 | 43.21% | Student | 111 | 31.53% |
| 35–44 | 58 | 16.49% | Worker | 5 | 1.42% |
| >45 | 39 | 11.07% | Community worker | 3 | 0.85% |
| Monthly Income (US$) | Frequency | Percentage | Individual owner or operator | 5 | 1.42% |
| <221 | 76 | 21.59% | Retirement | 11 | 3.13% |
| 221–442 | 47 | 13.35% | Free employment | 8 | 2.27% |
| 443–738 | 56 | 15.91% | Unemployed | 5 | 1.42% |
| 739–1180 | 64 | 18.18% | Others | 11 | 3.13% |
| 1181–2214 | 82 | 23.3% | Education | Frequency | Percentage |
| >2214 | 27 | 7.67% | Primary school | 1 | 0.28% |
| Car Ownership | Frequency | Percentage | Junior high school | 7 | 1.99% |
| Have | 110 | 31.25% | Senior high school | 22 | 6.25% |
| Have no | 242 | 68.75% | College | 165 | 46.87% |
| Private Bicycle Ownership | Frequency | Percentage | Master or above | 157 | 44.6% |
| Have | 146 | 41.48% | Working Location | Frequency | Percentage |
| Have no | 206 | 58.52% | inside the second ring road | 25 | 7.10% |
| FFBS Usage Frequency | Frequency | Percentage | the second ring road-the third ring road | 68 | 19.32% |
| Never | 10 | 2.84% | the third ring road-the fourth ring road | 140 | 39.77% |
| Once a month | 64 | 18.18% | the fourth ring road-the fifth ring road | 60 | 17.05% |
| Once a week | 56 | 15.91% | outside the second ring road | 49 | 13.92% |
| Times a week | 142 | 40.34% | Cycling Ability | Frequency | Percentage |
| Almost every workday | 33 | 9.38% | Have | 343 | 97.44% |
| Almost every day | 47 | 13.35% | Have no | 9 | 2.56% |
Table 3.
Independent t-tests between demographics and theory of planned behavior (TPB) variables.
| Variable | Gender M (SD) | t-Tests | Age M (SD) | t-Tests | ||||
| Male (n = 155) | Female (n = 197) | t Value | Effect Size | Over 60 (n = 8) | Under 60 (n = 344) | t Value | Effect Size | |
| PBC | 0.36 ± 0.26 | 0.35 ± 0.27 | 0.24 | 0.81 | 0.21 ± 0.13 | 0.36 ± 0.26 | −3.049 | 0.015 * |
| SN | 4.20 ± 0.74 | 4.24 ± 0.82 | −0.516 | 0.606 | 3.63 ± 0.90 | 4.24 ± 0.78 | −2.191 | 0.029 * |
| BATT | 4.21 ± 0.69 | 4.27 ± 0.73 | −0.714 | 0.475 | 4.30 ± 1.06 | 4.24 ± 0.70 | 0.158 | 0.879 |
| CATT | 2.67 ± 0.78 | 2.50 ± 0.79 | 2.114 | 0.035 * | 2.15 ± 0.89 | 2.58 ± 0.79 | −1.542 | 0.124 |
| WATT | 1.93 ± 0.78 | 1.84 ± 0.80 | 1.071 | 0.285 | 2.00 ± 0.85 | 1.87 ± 0.79 | 0.452 | 0.651 |
| IER | 4.17 ± 0.86 | 4.26 ± 0.86 | −0.935 | 0.351 | 3.54 ± 0.89 | 4.24 ± 0.85 | −2.277 | 0.023 * |
| BI | 4.15 ± 0.72 | 4.01 ± 0.94 | 1.585 | 0.114 | 3.46 ± 0.94 | 4.09 ± 0.85 | −2.071 | 0.039 * |
| Variable | Car Ownership M (SD) | t-Tests | Bike Ownership M (SD) | t-Tests | ||||
| Have (n = 242) | Have No (n = 110) | t Value | Effect Size | 0.0 (n = 206) | 1.0 (n = 146) | t Value | Effect Size | |
| PBC | 0.37 ± 0.26 | 0.33 ± 0.27 | 1.394 | 0.164 | 0.38 ± 0.26 | 0.32 ± 0.26 | 1.85 | 0.065 |
| SN | 4.23 ± 0.73 | 4.21 ± 0.91 | 0.2 | 0.842 | 4.18 ± 0.82 | 4.29 ± 0.73 | −1.381 | 0.168 |
| ATT | 4.26 ± 0.67 | 4.21 ± 0.80 | 0.588 | 0.557 | 4.22 ± 0.78 | 4.28 ± 0.59 | −0.875 | 0.382 |
| CATT | 2.67 ± 0.76 | 2.37 ± 0.81 | 3.314 | 0.001 ** | 2.59 ± 0.79 | 2.55 ± 0.80 | 0.486 | 0.628 |
| WATT | 1.87 ± 0.76 | 1.88 ± 0.86 | −0.036 | 0.971 | 1.92 ± 0.81 | 1.81 ± 0.76 | 1.337 | 0.182 |
| IER | 4.26 ± 0.80 | 4.15 ± 0.97 | 1.013 | 0.312 | 4.18 ± 0.84 | 4.28 ± 0.88 | −1.112 | 0.267 |
| BI | 4.11 ± 0.80 | 3.99 ± 0.95 | 1.25 | 0.212 | 4.04 ± 0.85 | 4.12 ± 0.85 | −0.909 | 0.364 |
| Variable | Experience M (SD) | t-Tests | Riding Ability M (SD) | t-Tests | ||||
| ≥1 (n = 342) | 0 (n = 10) | t Value | Effect Size | Have (n = 343) | Have No (n = 9) | t Value | Effect Size | |
| PBC | 0.36 ± 0.26 | 0.26 ± 0.24 | 1.189 | 0.235 | 0.35 ± 0.26 | 0.38 ± 0.33 | −0.281 | 0.779 |
| SN | 4.25 ± 0.77 | 3.46 ± 1.04 | 3.155 | 0.002 ** | 4.26 ± 0.75 | 3.00 ± 1.21 | 3.104 | 0.014 * |
| BATT | 4.26 ± 0.68 | 3.56 ± 1.18 | 1.877 | 0.093 | 4.25 ± 0.70 | 3.84 ± 1.01 | 1.71 | 0.088 |
| CATT | 2.60 ± 0.78 | 1.80 ± 0.65 | 3.188 | 0.002 ** | 2.59 ± 0.79 | 2.16 ± 0.68 | 1.617 | 0.107 |
| WATT | 1.86 ± 0.78 | 2.30 ± 1.11 | −1.731 | 0.084 | 1.86 ± 0.78 | 2.28 ± 1.03 | −1.553 | 0.121 |
| IER | 4.22 ± 0.87 | 4.30 ± 0.67 | −0.288 | 0.773 | 4.22 ± 0.86 | 4.19 ± 1.04 | 0.132 | 0.895 |
| BI | 4.12 ± 0.80 | 2.43 ± 1.03 | 6.528 | 0.000 ** | 4.10 ± 0.83 | 2.93 ± 0.72 | 4.184 | 0.000 ** |
* p < 0.05 ** p < 0.01.
Table 4.
Analysis of variance between demographics and FFBS usage frequency.
| Gender | M (SD) | F | p | Occupation | M (SD) | F | p |
|---|---|---|---|---|---|---|---|
| Male | 3.99 ± 1.27 | 5.132 | 0.024 * | Government/public institution | 3.77 ± 1.23 | 1.892 | 0.034 * |
| Female | 3.69 ± 1.20 | Enterprise employers | 3.88 ± 1.30 | ||||
| Age | M (SD) | F | p | Business/service personnel | 3.70 ± 0.95 | ||
| <18 | 4.00 ± 1.22 | 3.299 | 0.011 * | Medical personnel | 3.60 ± 0.55 | ||
| 19–24 | 3.91 ± 1.26 | Teacher | 3.88 ± 1.26 | ||||
| 25–34 | 3.99 ± 1.21 | Student | 4.03 ± 1.23 | ||||
| 35–44 | 3.64 ± 1.32 | Worker | 2.60 ± 0.89 | ||||
| >45 | 3.26 ± 0.99 | Community worker | 2.67 ± 1.15 | ||||
| Income | M (SD) | F | p | Individual owner or operator | 3.60 ± 1.14 | ||
| <221 | 3.79 ± 1.28 | 0.813 | 0.541 | Retirement | 3.33 ± 0.89 | ||
| 221–442 | 4.04 ± 1.30 | Free employment | 4.00 ± 1.12 | ||||
| 443–738 | 3.61 ± 1.15 | Unemployed | 2.20 ± 0.45 | ||||
| 739–1180 | 3.78 ± 1.19 | Others | 3.70 ± 1.16 | ||||
| 1181–2214 | 3.94 ± 1.26 | Education | M (SD) | F | p | ||
| >2214 | 3.77 ± 1.24 | Primary school | 3.00 ± null | 6.386 | 0.000 ** | ||
| Cycling Ability | M (SD) | F | p | Junior high school | 2.71 ± 0.95 | ||
| Have | 3.85 ± 1.23 | 6.844 | 0.009 ** | Senior high school | 3.41 ± 0.91 | ||
| Have no | 2.40 ± 0.55 | College | 3.62 ± 1.21 | ||||
| Car Ownership | M (SD) | F | p | Master or above | 4.15 ± 1.24 | ||
| Have | 3.59 ± 1.14 | 5.979 | 0.015 * | Working Location | M (SD) | F | p |
| Have no | 3.93 ± 1.27 | inside the second ring road | 3.65 ± 1.06 | 1.253 | 0.288 | ||
| Private Bicycle Ownership | M (SD) | F | p | the second ring road-the third ring road | 4.03 ± 1.27 | ||
| Have | 3.87 ± 1.17 | 0.361 | 0.548 | the third ring road-the fourth ring road | 3.89 ± 1.20 | ||
| Have no | 3.79 ± 1.29 | the fourth ring road-the fifth ring road | 3.70 ± 1.23 | ||||
| outside the fifth ring road | 3.60 ± 1.39 |
* p < 0.05 ** p < 0.01 M: mean, SD: standard deviation.
Table 5.
Factor analysis (n = 352).
| Items | Mean Score | Eigen-Values | Cronbach’s Alpha | Factors Loading | Variance Explained (%) | Cumulative Variance Explained (%) |
|---|---|---|---|---|---|---|
| Factor 1: PBC | 3.579 | 2.251 | 0.823 | 8.66% | 8.66% | |
| PBC1 | 3.46 | 0.866 | ||||
| PBC2 | 3.543 | 0.879 | ||||
| PBC3 | 3.733 | 0.8 | ||||
| Factor 2: SN | 4.224 | 3.353 | 0.854 | 12.90% | 21.56% | |
| SN1 | 4.54 | 0.695 | ||||
| SN2 | 4.199 | 0.619 | ||||
| SN3 | 4.128 | 0.843 | ||||
| SN4 | 4.116 | 0.855 | ||||
| SN5 | 4.139 | 0.868 | ||||
| Factor 3: BATT | 4.242 | 3.396 | 0.83 | 13.06% | 34.62% | |
| BATT1 | 3.801 | 0.71 | ||||
| BATT2 | 4.043 | 0.76 | ||||
| BATT3 | 4.455 | 0.771 | ||||
| BATT4 | 4.423 | 0.774 | ||||
| BATT5 | 4.489 | 0.702 | ||||
| Factor 4: CATT | 3.425 | 2.745 | 0.774 | 10.56% | 45.18% | |
| CATT1 | 2.727 | 0.651 | ||||
| CATT2 | 3.586 | 0.792 | ||||
| CATT3 | 3.094 | 0.675 | ||||
| CATT4 | 3.955 | 0.731 | ||||
| CATT5 | 3.781 | 0.772 | ||||
| Factor 5: WATT | 1.875 | 1.57 | 0.678 | 6.04% | 51.22% | |
| WATT1 | 1.966 | 0.82 | ||||
| WATT2 | 1.784 | 0.822 | ||||
| Factor 6: IER | 1.777 | 2.389 | 0.859 | 9.19% | 60.41% | |
| IER1 | 1.767 | 0.879 | ||||
| IER2 | 1.96 | 0.824 | ||||
| IER3 | 1.605 | 0.831 | ||||
| Factor 7: BI | 4.072 | 2.333 | 0.931 | 8.97% | 69.38% | |
| BI1 | 4.165 | 0.779 | ||||
| BI2 | 4.054 | 0.825 | ||||
| BI3 | 3.997 | 0.805 |
Table 6.
The correlation matrix between the factors of the scale and the total score.
| PBC | SN | BATT | CATT | WATT | IER | BI | BV | |
|---|---|---|---|---|---|---|---|---|
| PBC | 1 | |||||||
| SN | 0.004 | 1 | ||||||
| BATT | −0.043 | 0.295 ** | 1 | |||||
| CATT | 0.019 | −0.046 | −0.087 | 1 | ||||
| WATT | −0.085 | −0.058 | −0.275 ** | −0.139 ** | 1 | |||
| IER | −0.265 ** | −0.226 ** | −0.335 ** | 0.049 | 0.250 ** | 1 | ||
| BI | −0.045 | 0.401 ** | 0.569 ** | −0.167 ** | −0.244 ** | −0.293 ** | 1 | |
| BV | −0.107 * | 0.163 ** | 0.179 ** | −0.117 * | −0.064 | −0.126 * | 0.468 ** | 1 |
* p < 0.05 ** p < 0.01.
Table 7.
Results of the goodness of fit of the revised model: root mean squared error of approximation (RMSEA), efficiency of fit index (GFI), incremental fit index (IFI), non-normed fit index (NNFI), Tucker–Lewis coefficient (TLI), and comparative fit index (CFI).
Table 7.
Results of the goodness of fit of the revised model: root mean squared error of approximation (RMSEA), efficiency of fit index (GFI), incremental fit index (IFI), non-normed fit index (NNFI), Tucker–Lewis coefficient (TLI), and comparative fit index (CFI).
| Fit Index | RMSEA | GFI | IFI | NFI | TLI | CFI | |
|---|---|---|---|---|---|---|---|
| Measured value | 1.732 | 0.046 | 0.901 | 0.953 | 0.896 | 0.945 | 0.953 |
| Standard value | 1–3 | <0.08 | >0.90 | >0.90 | >0.90 | >0.90 | >0.90 |
| Adaptation judgment | Yes | Yes | Yes | Yes | No | Yes | Yes |
© 2020 by the authors. Licensee MDPI, Basel, Switzerland. This article is an open access article distributed under the terms and conditions of the Creative Commons Attribution (CC BY) license (http://creativecommons.org/licenses/by/4.0/).
Share and Cite
MDPI and ACS Style
Xu, D.; Bian, Y.; Shu, S. Research on the Psychological Model of Free-floating Bike-Sharing Using Behavior: A Case Study of Beijing. Sustainability 2020, 12, 2977. https://doi.org/10.3390/su12072977
AMA Style
Xu D, Bian Y, Shu S. Research on the Psychological Model of Free-floating Bike-Sharing Using Behavior: A Case Study of Beijing. Sustainability. 2020; 12(7):2977. https://doi.org/10.3390/su12072977
Chicago/Turabian StyleXu, Dandan, Yang Bian, and Shinan Shu. 2020. "Research on the Psychological Model of Free-floating Bike-Sharing Using Behavior: A Case Study of Beijing" Sustainability 12, no. 7: 2977. https://doi.org/10.3390/su12072977
Note that from the first issue of 2016, this journal uses article numbers instead of page numbers. See further details here.