Exploring the Impact of Intuitive Thinking on Creativity with Gray Relational Analysis


1
Department of Visual Communication Design, Asia University, Taichung City 41354, Taiwan
2
Department of Creative Product Design, Asia University, Taichung City 41354, Taiwan
3
Department of Medical Research, China Medical University Hospital, China Medical University, Taichung 40402, Taiwan
*
Author to whom correspondence should be addressed.
Sustainability 2020, 12(7), 2989; https://doi.org/10.3390/su12072989
Submission received: 27 February 2020
/
Revised: 6 April 2020
/
Accepted: 6 April 2020
/
Published: 8 April 2020
(This article belongs to the Special Issue Selected Papers from the Eurasian Conference on Educational Innovation 2020)
Abstract
:Creativity is important and constitutes a part of competitiveness in all walks of life. In the case of designers’ visual images, creativity is vital. Based on the perspective of visual design, visual image thinking has always been a widely used thinking mode in the field of design. Regarding whether or not other sensory stimuli can also provide a source of inspiration for designers, many studies have pointed out that different sources of inspiration can create different thinking patterns and even affect the behavior of a designer. Therefore, this study explores whether or not different sensory stimuli have an impact on the thinking of a designer, which in turn allows the designer to spark different inspirations. Here, we explore the relationships between creativity and vision, hearing, smell, taste, and touch. In this study, novice designers are required to use their creativity to design their works. Through the execution of design tasks, works are produced in two stages. First of all, a scenic spot is decided as the main theme, while the data of the field are collected through observation and experience. Next, the five senses are used to feel the stimulation delivered by the field when located in the field. Last but not least, the five stimuli are transformed into abstract visual pictures. Different sensory stimuli do affect the thinking of a designer and inspire different types of works. A multiple-attribute decision-making (MADM) forecasting method is also used to establish a method for evaluating creative designs. By making a comparison between the students and the experts, the results of the creative thinking test show that different sensory stimuli do affect the thinking of a designer and inspire different types of works.
1. Introduction
The conversion of sensory stimuli into visual image synesthesia is a phenomenon in which sensory stimuli or cognitive pathways spontaneously and non-actively cause another perception. This phenomenon of synesthesia is rather rare and only a few people have this ability. However, some scholars believe that, more or less, everyone has had an experience of “synesthesia” at some point in their lives. Synesthesia is an important rhetorical technique in literary creation. However, with the integration of different disciplines, it has broken through the limitations of the literature, not only opening the creative road for graphic creation but also providing a wide range of thinking directions and methods. However, it is more helpful for designers to use graphics or image types in visual data [1]. Many related studies have also confirmed that designers tend to search and retrieve a large amount of visual data and use mental image synthesis to generate design ideas [2]. It is helpful to refer to relevant materials in the early stages of the design. Additionally, different sources of inspiration also have a significant influence on the interpretation process of the design [3].
Regarding graphic simplification in the artistic field, Piet Mondrian’s series of well-known works, “Trees”, were conceived from an entity, such that the specific images were gradually abstracted through concrete descriptions, simplified lines, and colors. Starting from the painting on the left in Figure 1, the outline of the tree can be clearly seen, and the middle painting in Figure 1 is simplified such that many finely divided branches are replaced by arcs. As to the painting on the right in Figure 1, the natural shape of the tree can no longer be seen but is instead replaced by basic geometric lines to achieve a new unity and balance. In addition, Picasso once painted a bull eleven times, from the realistic painting of the first painting to the concise lines in the middle stage, all the way to the last few lines. Although there were only a few lines, it accurately represents the shape and spirit of the bull. Picasso took a realistic image, gradually extracted important information from it, simplified it slowly, and finally obtained a nearly abstract graphic (Figure 2).
Graphic Simplification in Comics
The authors in [4] proposed five processes of graphic simplification (Figure 3). From left to right, the process from realism to simplification clearly shows the two representative directions. The image on the left is more realistic, with more details that make it easier to identify, while the image on the right is more abstract and requires a higher level of perception and a wider space of interpretation. Different expressions allow the readers to become part of the comic world, making the reading experience more enjoyable for the readers, with stronger effects through graphic simplification.
“Simplification” in the field of design refers to the change from complex to simple forms, that is, the process of organizing visual information in an orderly manner. Simplification is not only a reduction of trivial details but also an adjustment after the details are reduced. Simplified graphics can be widely used at various levels, such as in logo design, comics, illustrations, posters, graphic design, etc. Many studies have also pointed out that a simplification of image design is better at attracting viewers’ attention and even improving recognition. Since designers often handle graphics with sensitivity and intuition, the visual optimization of graphic design that has been simplified is a category on its own, used to discuss how to measure whether a graphic is easily recognizable and whether the advice constitutes good graphic design. By proposing clear operating rules and values to complement the insufficiency of a designer’s intuition, novice designers are provided with a clear standard to follow. In addition, the simplification approaches can be divided into “external visual imitation” and “internal psychological mechanism”, the former of which focuses on the abstraction of external entities while the latter is the embodiment of internal abstraction. The two most commonly used modes for graphic simplification are “extraction of overall shape” and “extraction of component features” (Figure 4; Figure 5), both of which are often used together in the field of design [5].
In the process of conception, the designer will spend a lot of time searching and retrieving “available data” to spark creative inspiration and enhance the speed of thinking. Among them, text, images, and other marks can be used as important tools to stimulate the thinking and associations of a designer [6].
However, it is usually more helpful for designers to use graphics or image data [1]. Many related studies have also confirmed that designers tend to search and retrieve a large amount of visual data and use mental image synthesis to generate design ideas [7,8,9,10,11]. It is helpful here to refer to relevant materials in the early stages of design conception [12]. Additionally, different sources of inspiration may also have a significant influence on the interpretation process of a given design [3,12,13]. From the discussions mentioned above, it can be seen that visual image data are the largest type of data used, and are more helpful to designers. Therefore, visual image thinking has become one of the habitual thinking habits in the field of design. However, besides visual image thinking, are there any other thinking modes for designers to refer to or apply? Many studies point out that the type of source material has a significant impact on the thinking of a designer and the core value of design lies in innovation, which depends on the creativity of the designer. Regardless of the design method and process, designers should be able to manage their creativity effectively and bring their creativity into full play. If designers cannot make good use of their intelligence and creativity, the concept of development will be slowed down, which will, in turn, adversely affect the quality of life of the designers. This dilemma may place a heavy psychological burden on designers and may prevent them from producing in-depth, broad, and breakthrough design ideas. At the present stage, there is no uniform objective standard to evaluate the creativity of design education in Taiwan. Therefore, teachers often evaluate new concepts and creativity in new works based on personal opinions and discussions, where subjectivity is inevitable. In response, a small-scale expert model is developed in this study, and a combination of gray theory and a development model is established to provide a creativity evaluation standard that is highly objective and unified. By taking campus attractions as the test field, the test subject is required to experience the field through different senses before transforming the sensory stimulus into a visual image. Afterward, an observation is made on the effects of different sensory stimuli on the thinking of a designer and the differences in output [14]. By observing the evolution of creative productivity and creative contributions, adults, in particular, are sometimes more productive than other age groups. These activity periods are also the periods when the most creative contributions were observed. In this contemporary theory, any creative response requires four elements; namely, three components of personal domain-related skills, the process of creativity, and the motivation for intrinsic tasks, which are an integral part of the work of the individual in the social environment. Creativity is the mission of designers. Despite the fact that designers have professional and design motivations in conceptual creativity, designer creativity and awareness will be restricted, the nature and the specific content of which also evolve with age. These changes exist in a model of the interaction between competence and knowledge, including the evolution of information processing, the size and relevance of knowledge bases, and expertise and complex reasoning capabilities, such as dialectical and post-formal thinking.
Multiple-attribute decision-making (MADM) is an important part of evaluation and decision-making as it focuses on solving the problem of a multi-attribute design solution. Due to the seniority of decision-makers and the uncertainty of various requirements, it is often not possible to determine the information acquired. Therefore, MADM is also classified as a decision group method that is under uncertainty. In order to solve the decision problem under uncertainty, the concept of fuzzy set theory can be integrated by using fuzzy decision-making to determine the design plan [15]. MADM uses various evaluation methods based on the fuzzy set theory to determine the importance of a group decision-making framework. When fuzzy set theory is used for different levels of risk tolerance and comparisons, the group decision-making framework can help companies prioritize design requirements to improve customer satisfaction [16]. Use of the integrated decision-making model to solve problems can also be combined with a fuzzy synthetic evaluation method [17]. Regarding the high degree of similarity between evaluation and decision-making between design concepts, [18] proposed a method, namely, the use of an intuitionistic fuzzy preference relationship (such as an intuitionistic fuzzy core and consensus winners, etc.) to assist with decision-making. To determine attribute weights, Atanassov, Pasi, and Yager (2005) [19] suggested using an algorithm to provide accurate attribute numbering. On the other hand, Li (2005) believed that fuzzy data should be studied first, before a linear programming model is established, in order to obtain the optimal weight attributes. Another way to clearly label the substitution attributes is to use fuzzy groups to indicate the satisfaction level of the substitution to the substitution attributes [20]. Gray theory uses the concept of “gray” to describe the attributes of the data in reality. If the data are complete, they are called “white.” If the data are incomplete, they are called “black”. If the data are somewhere in between, they are called “gray”. We may use the gray level to indicate the completion of the data in any gray event where the so-called “incomplete data” refers to (1) uncertain system factors, (2) unclear factor relationships, (3) an unclear system structure, or (4) unknown system principles. Decision-making problems often take into account multiple attributes, including the interplay between various factors. With limited resources and insufficient data, decision-makers often have to make the best decisions that meet the current situation. Unlike many tools designed to provide a complete picture of the work environment, the focuses on the factors in the work environment that are most likely to influence the expression and development of ideas. Multi-attribute decision-making (MADM) is an essential part of evaluation and decision-making because it focuses on solving the arrangement problems of multiple attribute design proposals. Because of decision-makers’ experiences and the uncertainty of various requirements, the messages acquired are usually undefined. Thus, MADM is also classified to the group of decision-making methods under uncertainty. In order to solve the problems of decision-making under uncertainty, the concept of vague set theory could be integrated by using fuzzy decisions to decide upon design proposals [15]. Alternatively, it could be combined with a fuzzy synthetic decision model by mixing a decision-making model to solve problems [17]. As for the high similarity of evaluation and decision-making among design concepts, [21] proposed a method using intuitionistic fuzzy preference relationships such as an intuitionistic fuzzy core and consensus winner, etc., to help make decisions. For the certainty of attribute weight, [22] suggested an algorithm to provide accurate attribute numbers.
Among the many types of materials, this research focuses on the most widely concerned graphic materials and explores the creative methods used in the transformation from concrete to abstract. In the process of design, the preferences of the decision-makers shall also be considered as the top priority, while graphics with more difficult and complicated designs shall be prioritized for evaluation. As we all know, each design has many parts, which are incomplete gray areas with a certain degree of similarity, all of which must be considered when making a decision. Therefore, based on the criteria of gray relational analysis (GRA), this study proposes a method for integrating sensory stimuli to address the issue of decision-making when evaluating designs. To select creativity, the design of sensory-stimulated vision using GRA is adopted as a case study for further experiments.
2. Study Process and Methods
The flowchart of MADM used to implement the system is shown in Figure 1, which includes the following steps:
- Decide the field by drawing lots (the school is the main source of inspiration for the field, the teacher first selects a few fixed fields and then the students draw lots to determine the field, the field is a fixed position).
- Enter the field to observe, experience, and collect data.
- Selection of inspiration sources.
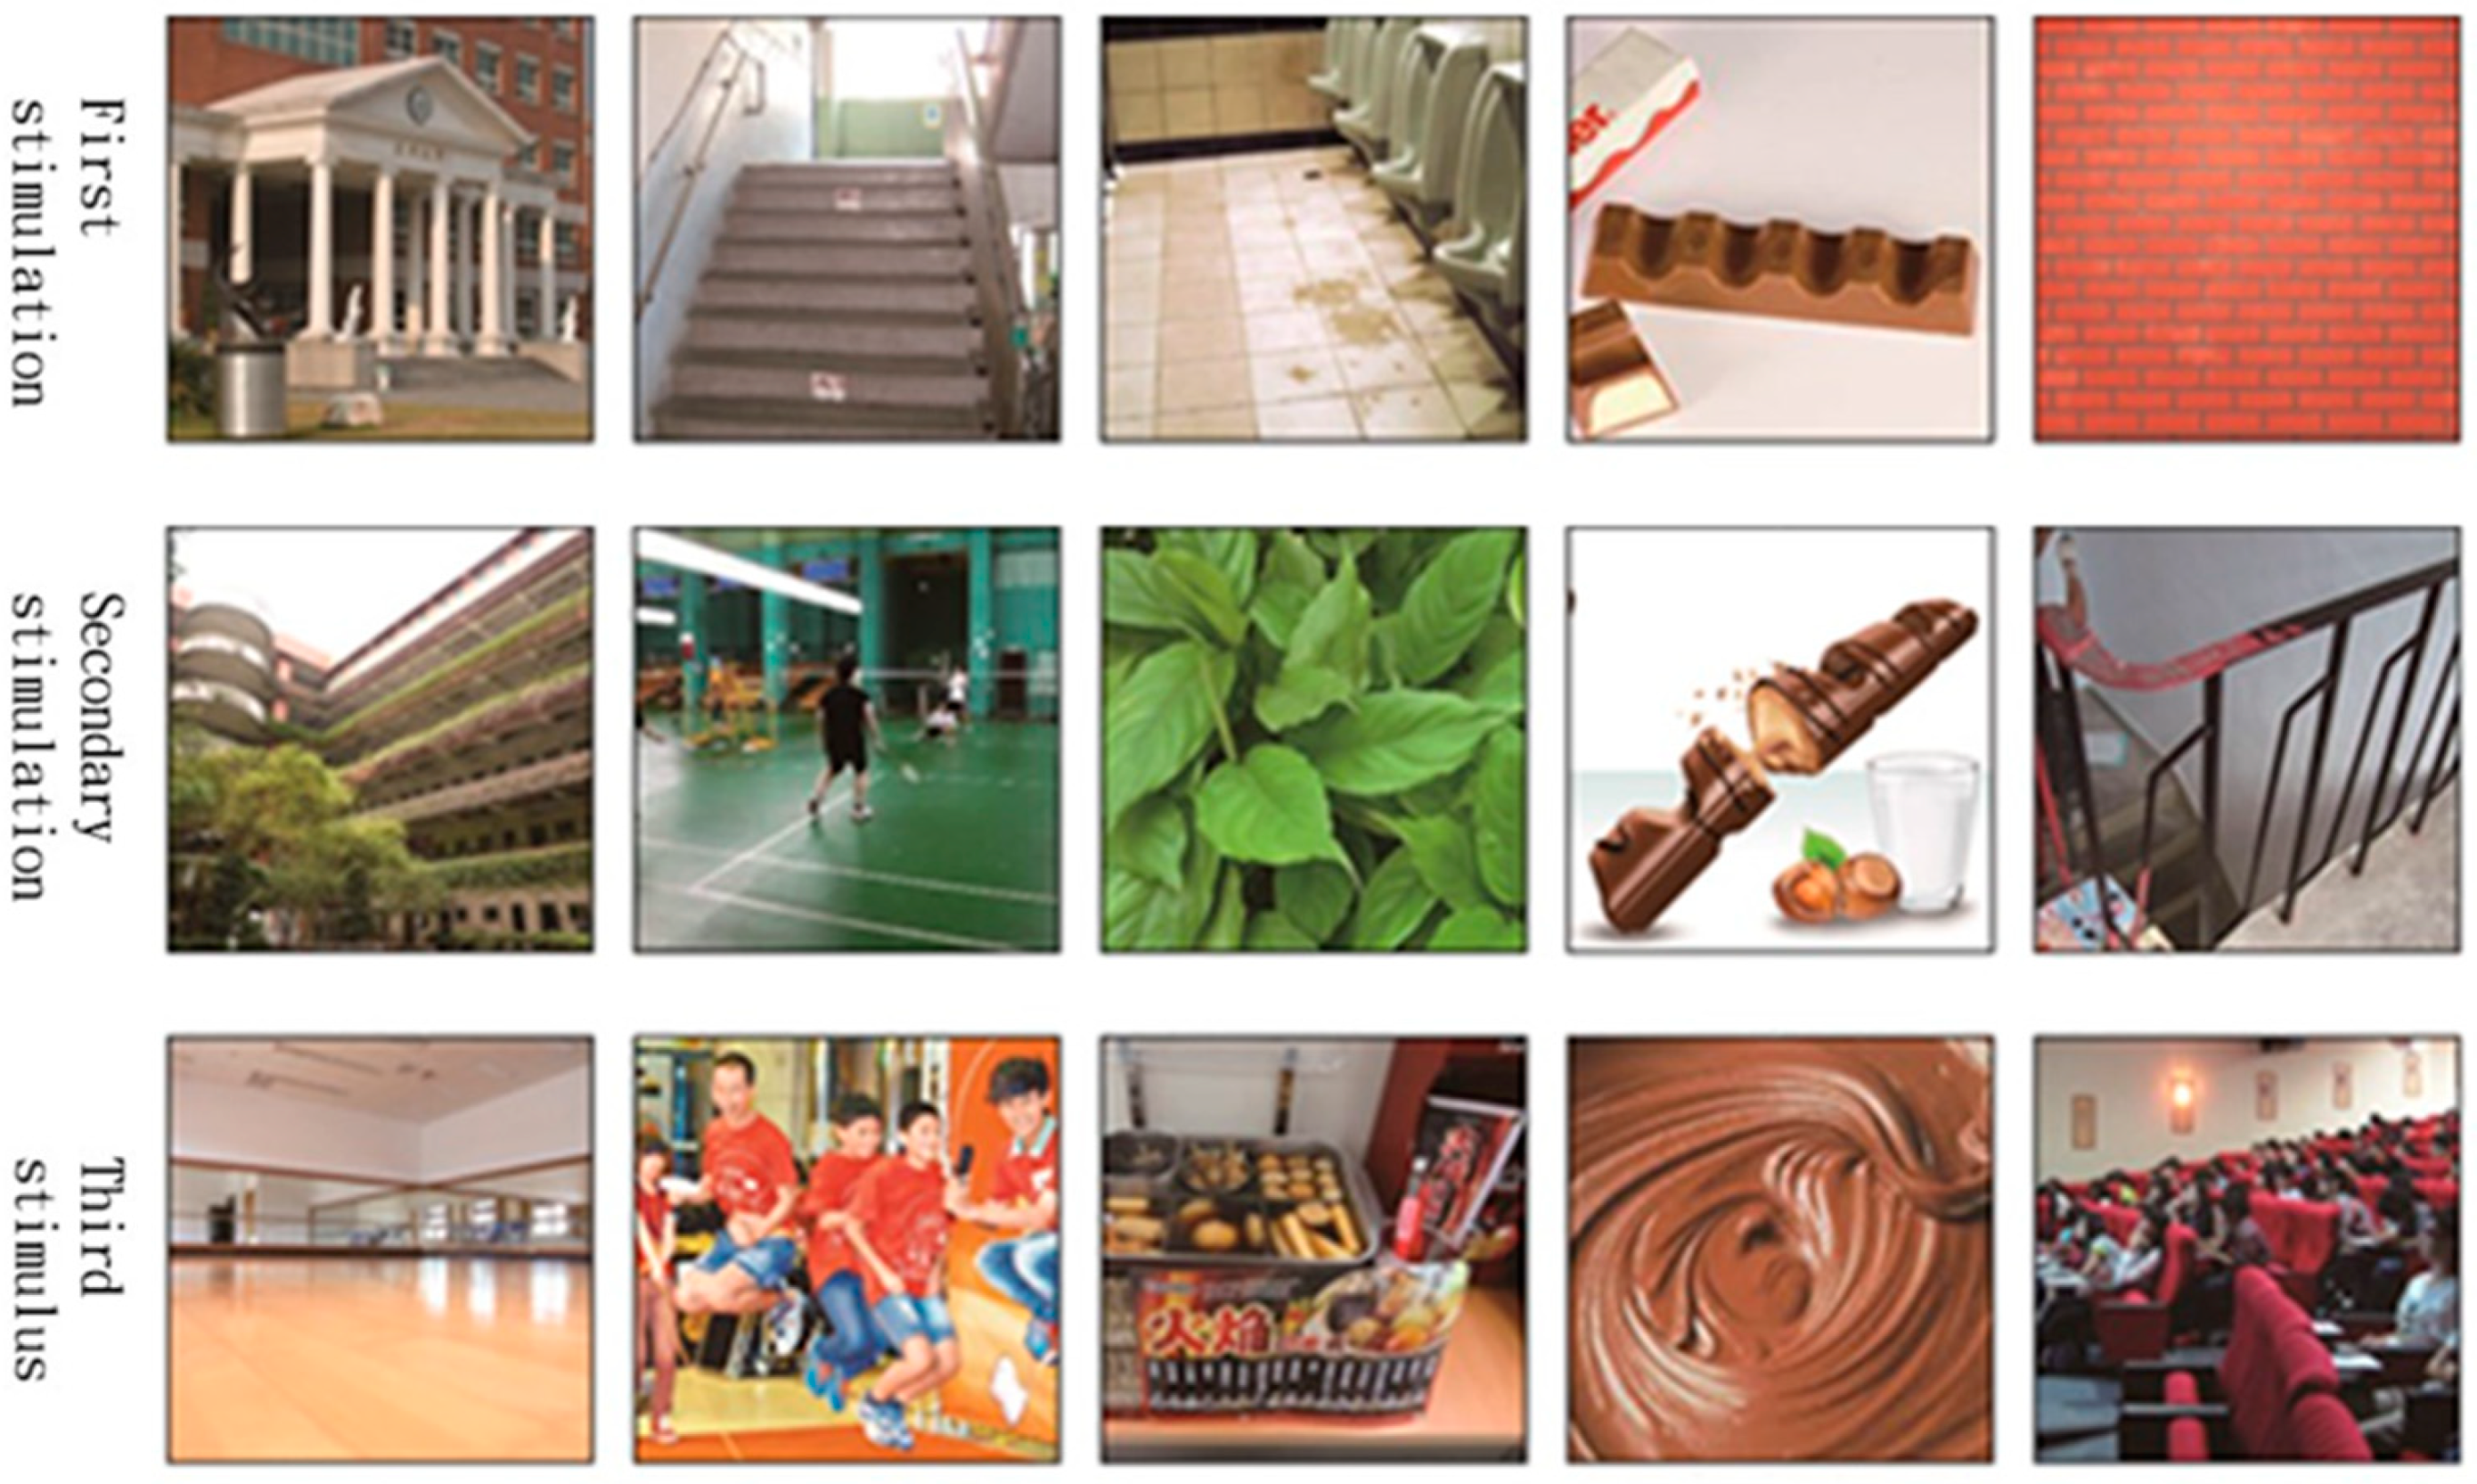
- Transform five sensory stimuli into abstract visual graphics (Figure 6).
- When feeling the field through the visual senses, most research participants tend to take in materials directly from buildings or surrounding landscapes, taking their shapes and colors, simplifying them, and then drawing.
- Because sound has no specific image, the research participant is better able to extract the depiction of specific objects, which are purely converted on the basis of the stimuli felt by hearing. (Because the sound does not have a specific image, the research participants can better extract the description of the specific object and convert it completely on the basis of the auditory stimulus. The sound collected within the time must be a fixed time and cannot be repeated for the time).
- The five sensory stimuli are vision, hearing, smell, taste, and touch.
- If the source of inspiration has a specific image (such as a certain food), the research participant is susceptible to the visual senses, and the picture is directly formed by the color and shape of the object.
- If the source of inspiration does not have a specific image (such as a certain odor), the research participant is more likely to start from the stimulus of the senses and create shapes and colors that represent the feeling.
- If the designer is not satisfied, make sure to move back to step (1).
- Among the five types of sensory-stimulated visual images, there are three layers of a total 15 types of sensory-stimulated visual images, which are presented in step (8).
- By obtaining three levels of visual images generated from five types of sensory stimulation, each level has five types of sensory-stimulated visual images, making a total of 15 combinations of three-stage sensory-stimulated visual images.
- For the measurement of consumer psychological preferences, the top five images of the products described in the questionnaire were found after the survey.
- The method is validated by taking grayness design as an example to evaluate the design of three types of sensory-stimulated visual images.
- A professional should evaluate the visual image.
- Through GRA, consumers use their perceptions to find out which factors are critical to visual images so that the designers can use this as a direction to evaluate the predictive series of visual images.
- Provide advice for the five sensory-stimulated visual images (Figure 7 is a flow chart of the gray relational analysis of creativity using sensory-stimulated visual images).
3. Gray Relationship
3.1. Gray Number
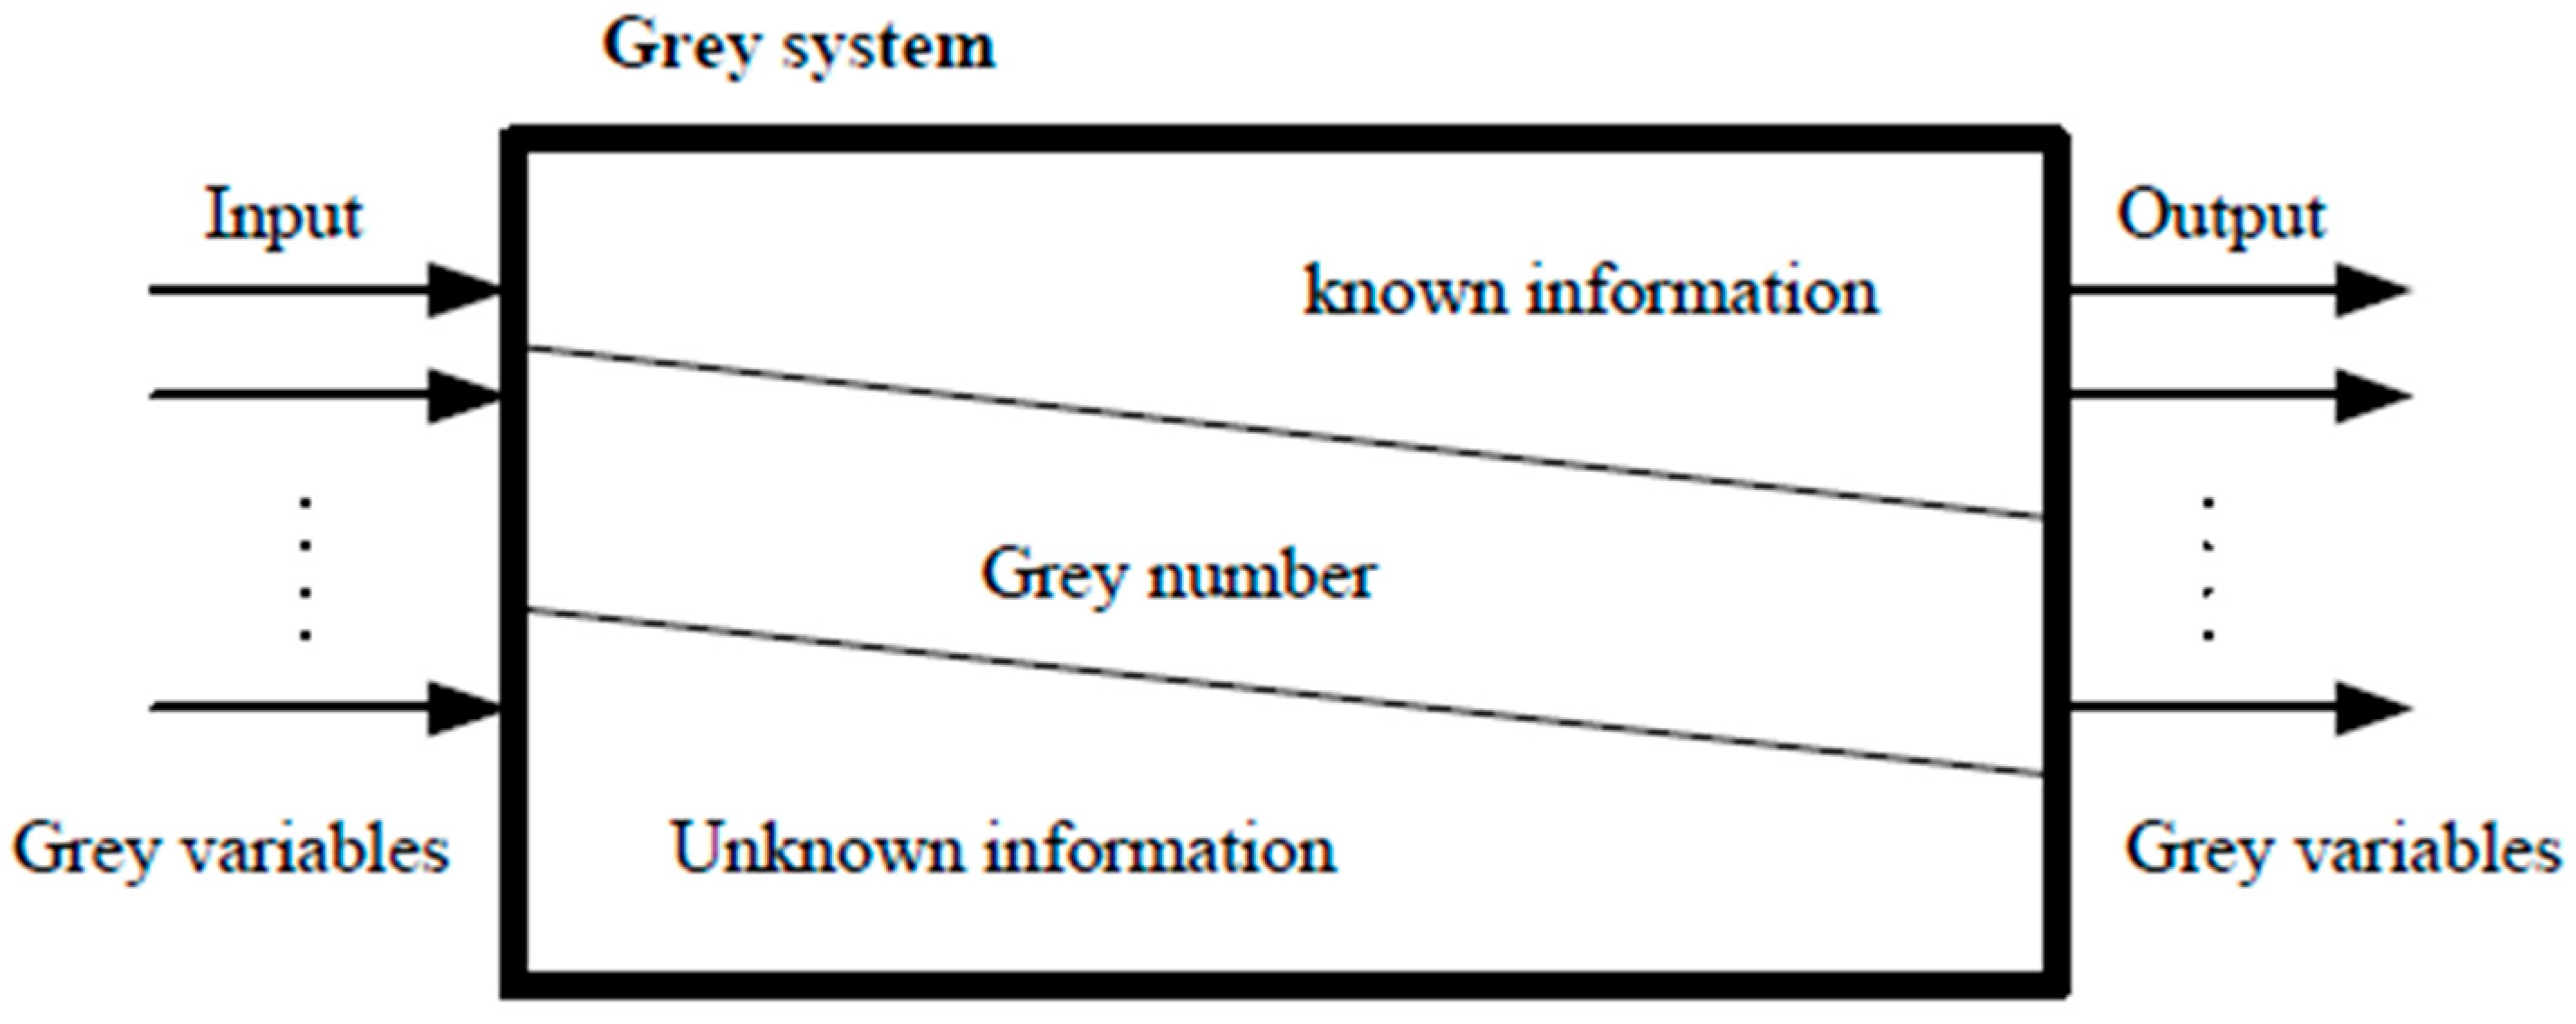
The concept of a gray system, which is a system consisting of gray numbers and gray variables, includes unknown information, as shown in Figure 8.
The gray number (⊗G) is defined as a constant variable of the uncertain information. The expression is used in one constant variable plus one uncertain area. This expression area covers both the lower limit and the upper limit, as shown in Figure 9.
After the uncertain region is limited by the upper and lower limit, the size of the gray number region is determined by Equation (1):
Four fundamental calculations of the gray numbers, G1=[ and G2=[, are defined as per Equations (2) and (5).
where the gray number, G = [], on the upper and the lower limits is a continuous linear function. Next, we rewrite it as in Equation (6):
where, when t = 0, f (t) is equal to the G lower limit value. Moreover, when t = 1, f (t) is equal to the G upper limit. We rewrite Equations (6) and (7):
We assume a function set of here, and , . Therefore, the related addition operation is expressed as per Equation (8):
For the subtraction of two functions, the addition function can be presented as +(-g). Moreover, thus the subtraction of two functions can be presented as per Equation (9):
The interval of the gray number, G, is defined by Equation (10):
The gray number whitening function, as shown in Equation (11), presents the whitening value from the gray number.
3.2. Gray Number Design Evaluation
First, the target project for evaluation is denoted by S. A series of design cases have a total of m designing solutions and are denoted by Sm, as shown in Equation (12).
Under the Sm design cases, there are a number, n, of single product solutions, which are denoted by Smn, as shown in Equation (13):
The set of design solutions is denoted by Qa, as shown in Equation (14):
In our image study, each evaluation criterion has its own weight. The weight of each evaluation criterion ranges from 1 to 7. The weights in the learning case are related to user perception and language expression issues. Therefore, each weight scale is represented by , as shown in Table 1, where there is a set of evaluation criteria, and the weight of each evaluation criterion is determined by Equation (15).
The evaluation result of each evaluation criterion is denoted by a value in the range of 1 to 7. The gray number of each scale is denoted by G, as shown in Table 2.
In the image scheme of each image case, S, there are three kinds of sensory information, namely, smell, taste, and touch. As for each single priority, there are n single product solutions that use Wn, as shown in Equation (16):
Step 1:
First, the weight of each evaluation criterion of the image is calculated. The weight of the evaluation criteria is evaluated and defined by the group members of interest. Suppose there are K focus group members who provide some j evaluation criteria for weight ranking, where the evaluation of person K to the j criterion is . Each criterion has points in total. We used Equation (17) to represent the equation of weight of items.
Step 2:
Calculate and obtain the members of K within the single image scheme solution, Smn. Obtain the gray numbers from a number of evaluation criteria, as shown in Equation (18).
The gray number, , from the Smn evaluation criteria can be simplified as per Equation (19). Moreover, we may rewrite Equation (18) as Equation (20).
In addition to the weight of the evaluation criteria, , Equation (21) can be obtained as well.
We rewrite the equation as per Equation (22):
Step 3:
The gray evaluation matrix trumpet for a series of image schemes is represented by Equation (23):
Step 4:
In order to standardize the gray evaluation matrix of the series, S, and the evaluation criteria, each factor from the matrix is normalized and represented by Equation (24):
Assuming that , the normalization leads to gray numbers in the range of 0–1. The normalized gray decision matrix, S**, can be obtained and is denoted by Equation (25):
Step 5:
Calculate the investment priority weight, W, from the normalized evaluation criteria matrix to obtain the adjusted evaluation matrix, , as per Equation (26):
Here, Using Equation (11), which is the gray whitening function, and assuming α = β = 0.5, the advanced gray numbers by weight whitening,, result in Equation (27).
The highest decision value of each single solution is the optimal decision for each item as , and the size of the ranking is the advantageous and disadvantageous ordering of Vin each single solution.
3.3. Gray Relational Analysis
Step 1: Determine the Ideal Optimal Target Series.
Here, we perform gray correlation analysis on a series of image schemes to produce a solution decision value, . The ideal optimal target series is denoted by S0, as shown in Equation (28):
Step 2: Calculate the gray relationship coefficient
Here, we initialize the value of the sequence in each solution. We calculate the gray relationship coefficient in a sequence, as shown in Equation (29):
where is the identified coefficient and . Here, we take .
Step 3: Calculate the gray relation
Here, we calculate the gray relation between each evaluation solution, Si= {S1,S2,…,Sm}, and the ideal target solution, S0. We calculate the gray relation between each solution using Equation (30), which is the average of gray relational coefficients :
Step 4: Prioritize Results
Finally, according to the gray relation between each solution and the optimal solution, S0, we weight the results generated from the sensory-stimulated visual images of S0 in the gray relational analysis in the weighting order of S1 + S2 + S3 to obtain the weight value of the sensory-stimulated visual images as a comparison value, which is an ideal image solution.
4. Case Study
4.1. Sensory Stimulation
Sensory stimulation has an impact on the thinking of a designer, which in turn allows the designer to spark different inspirations by studying the relationship between creativity and smell, taste, and touch. The relationship can be used to describe an image, either collected from the literature or created by the author. The questionnaire aims to design 15 major color images that appropriately describe the five sensory-stimulated visual images. A total of 32 students, aged 18 to 32 with normal color discrimination (50/50 male to female ratio), were asked to complete the questionnaire. After investigation, the top five images found were related to sight, hearing, smell, taste, and touch. In order to simplify data expression and processing, thinking habits were changed to cultivate creative thinking. Most creative breakthroughs are based on links to messages that are not generally considered to be relevant. Many studies also point out that different sources of inspiration may influence how a designer thinks, which, in turn, dominates the behavior of a designer. Therefore, this study proposes a hypothesis by extending the source of inspiration from visual to other senses to see if the thinking of a designer changes. This study focuses on campus attractions and requires each research participant to try and transform the five senses into visual pictures in the early stages of creation before saving the data of their membership function to calculate the gray relation value. The steps of this are outlined below.
4.2. Calculator program
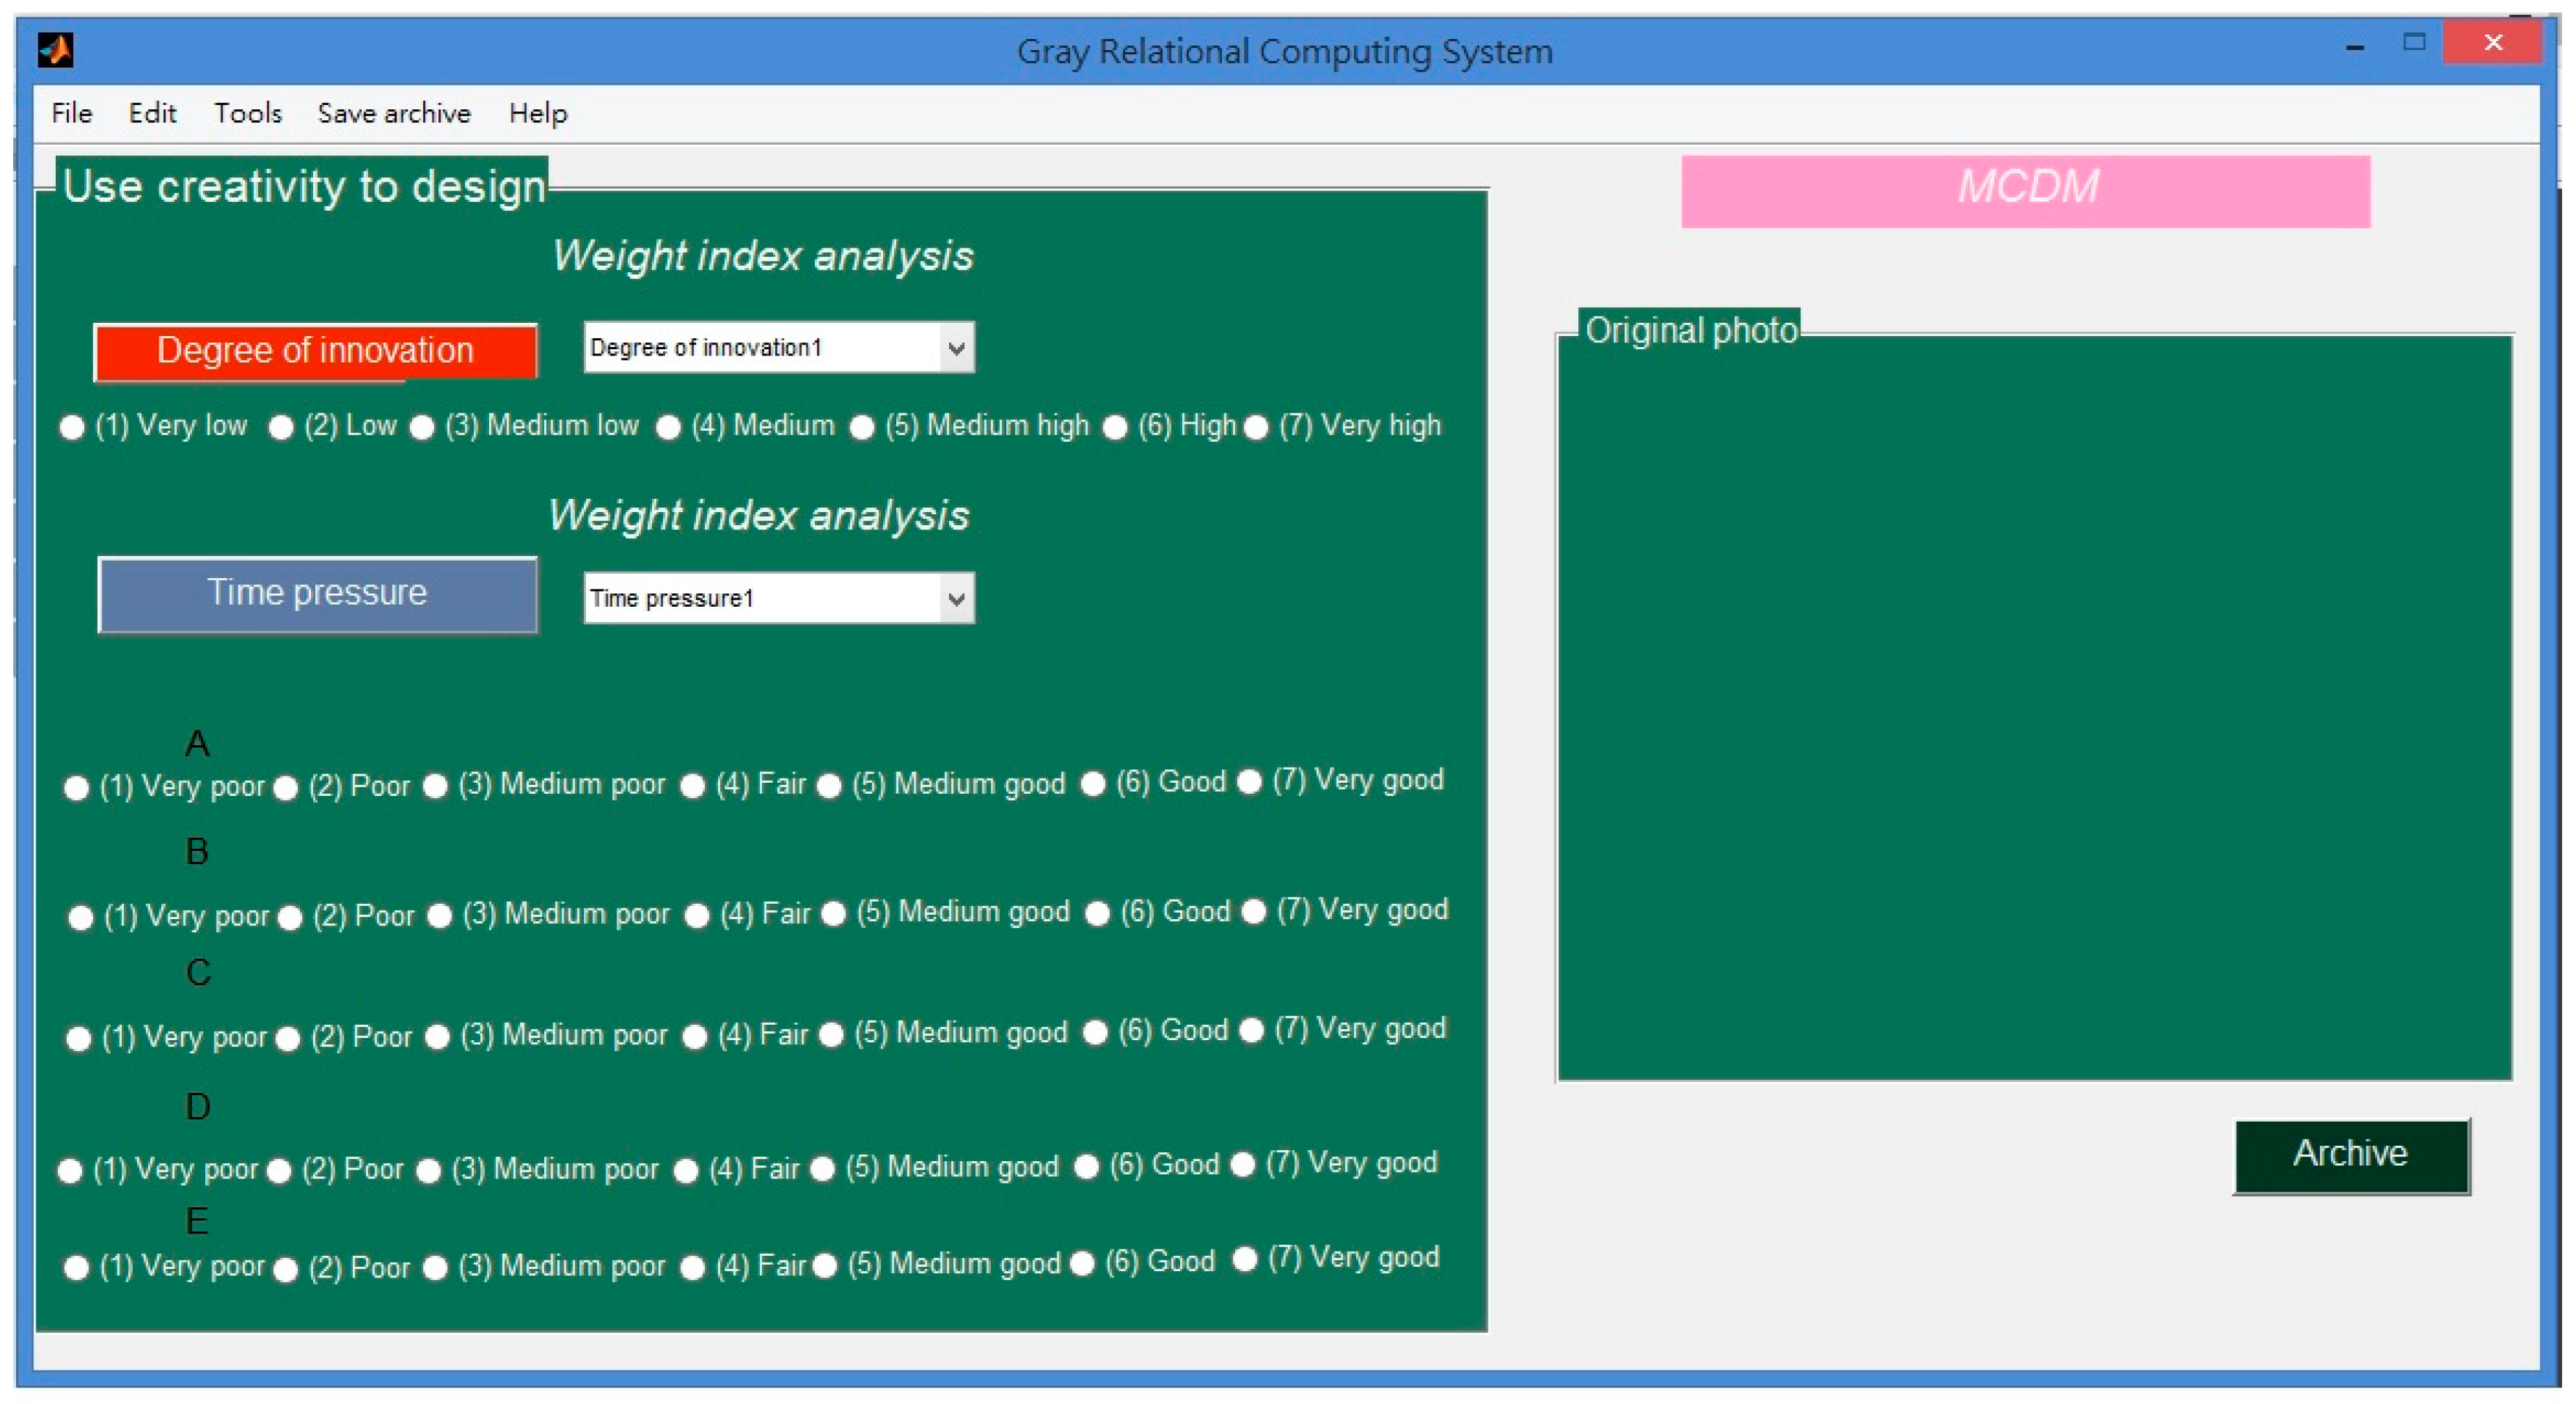
In order to systematically and accurately review a large number of questionnaires, a compilation of required compilers was used, which was integrated with MATLAB 2012 (MathWorks, Natick, MA, USA) [23]. The user interface is simple (Figure 1), and the gray theoretical calculation formula (Equation 1) was used here to handle the calculation. The user interface is rather simple (Figure 10), and the gray theoretical calculation formula was used to handle calculation.
4.3. Gray Relation Value (Weight Evaluation)
The results of the questionnaire survey of “five sensory-stimulated visual images”, calculated from gray relation, were used for the gray relation calculation. When the designer determines an image of an adjective, the image provided by the gray relation value may be used to predict the weight value. In the case of our study, each evaluation criterion has a different weight. As a matter of fact, the weight of each evaluation criterion is different from the weighted consumer’s perception and language expression in the case of ratios from 1 to 7. Other than that, the designer’s evaluation criteria are represented by a gray number of 1 to 7 on each scale as ⊗G, including vision, hearing, smell, taste, and touch.
The gray relation values were calculated as shown in the following steps: Step 1, a questionnaire survey of 26 consumers for color products was conducted. Step 2, a total of 32 students with a design background were required to fill out the questionnaires.
4.4. Design of Gray Relation Values
The outline of the design of the gray relation value system proposed by the five types of sensory-stimulated visual image planning is shown in Figure 10. Here, the product image is entered first. Based on the input data, the visual image questionnaire survey results of the visual image consumer shall be taken as a standard. The designer inputs the visual image questionnaire results into the visual image evaluation, as shown in Figure 11. Afterward, the gray theoretical values are analyzed and the five types of sensory-stimulated visual image suggestions for gray relation analysis are proposed to obtain the final decision of each proposal. Here, is the ideal maximum and represents the best goals of the S0 series:.
4.5. Screening and Evaluation
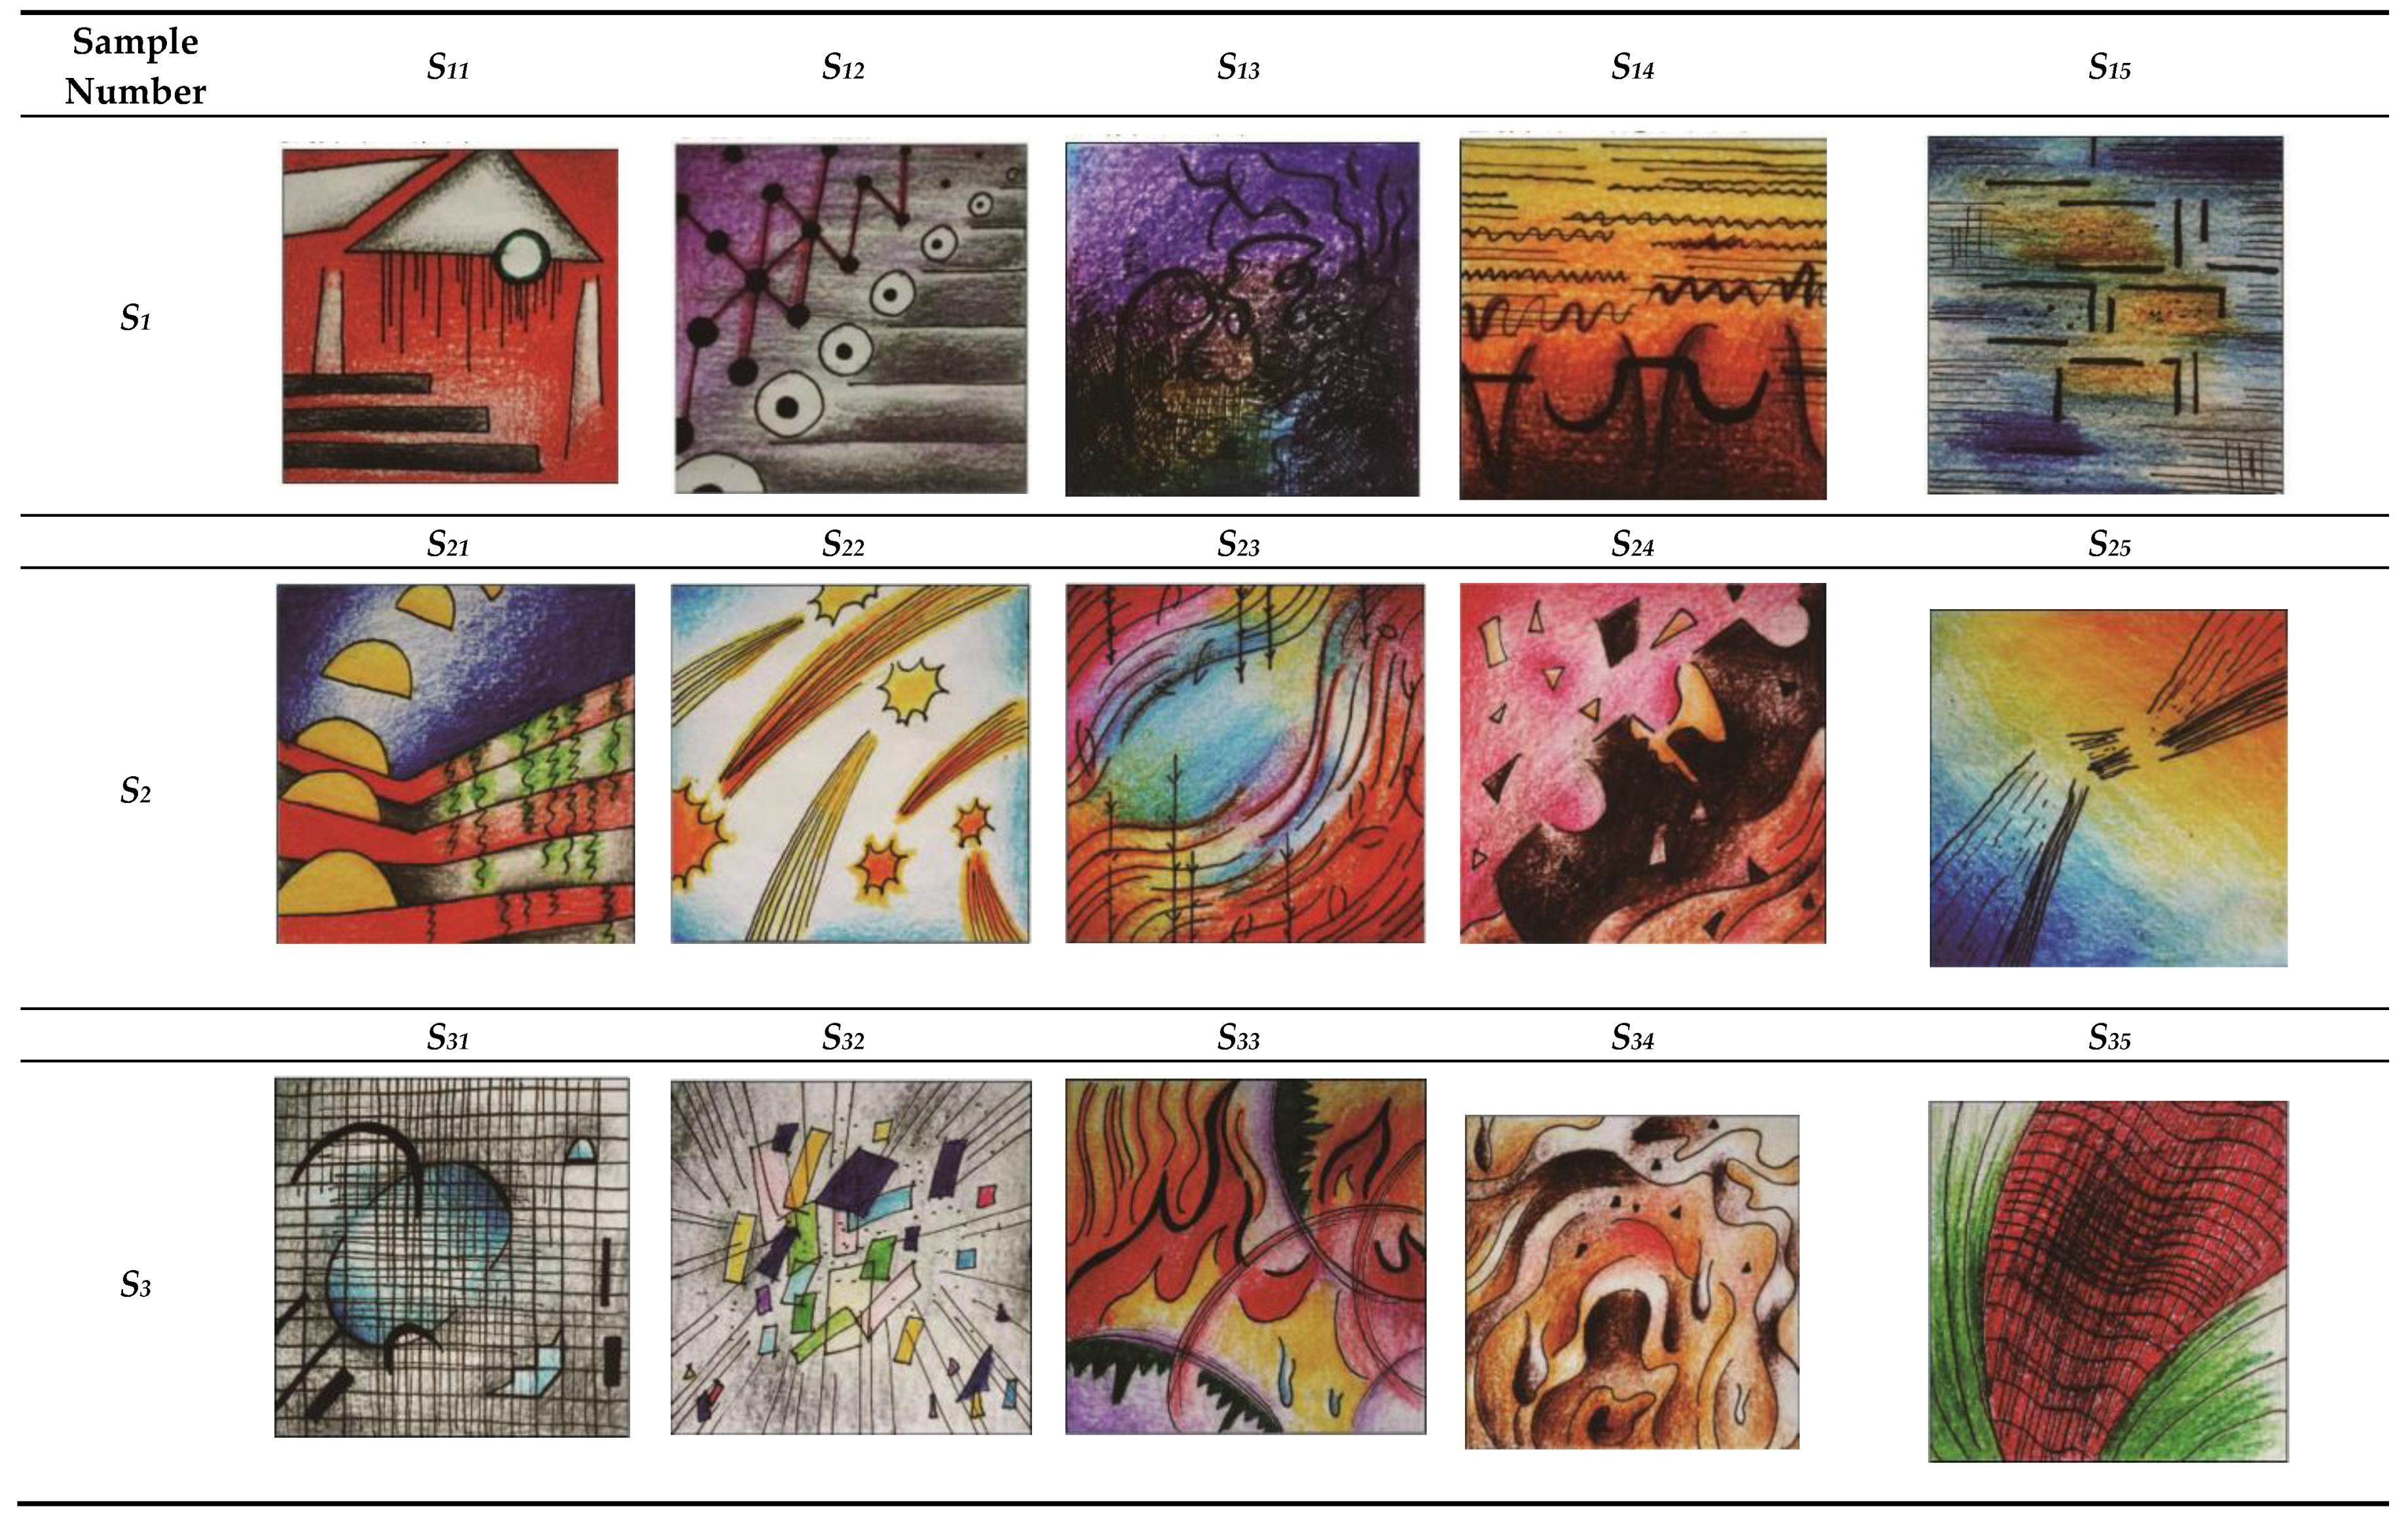
The purpose of the case study was to study the impact of multi-attribute assessment on the visual images of a single type of five sensory stimuli. In the visual image solution, to evaluate sensory stimulation, the overall evaluation of each of the five visual image solutions for sensory stimulation will have a single sensory stimulus, dual sensory stimulus, and multiple sensory stimuli, which shall be done before the ranking of the sensory stimuli. The effect of selecting five types of sensory stimulation visual images as the target images has been investigated in this study, while the standard classification of five sensory stimulation visual images is shown in Figure 12, where visual images correspond to five types of sensory stimulation.
5. Example Verification
As mentioned above, the gray relation value design obtained the sensory-stimulated visual images and generated advice successfully. Therefore, the image planning of the transformed system was validated to apply the gray relation value to the sensory-stimulated visual images.
Finally, according to the gray relation between each solution and the optimal solution, S0, we weighted the results generated from the sensory-stimulated visual images of S0 in the gray relational analysis in the weighting order of S1 + S2 + S3 to obtain the weight value of the sensory-stimulated visual images as a comparison value. The gray relation values are shown in Table 3, where S1 = r1.
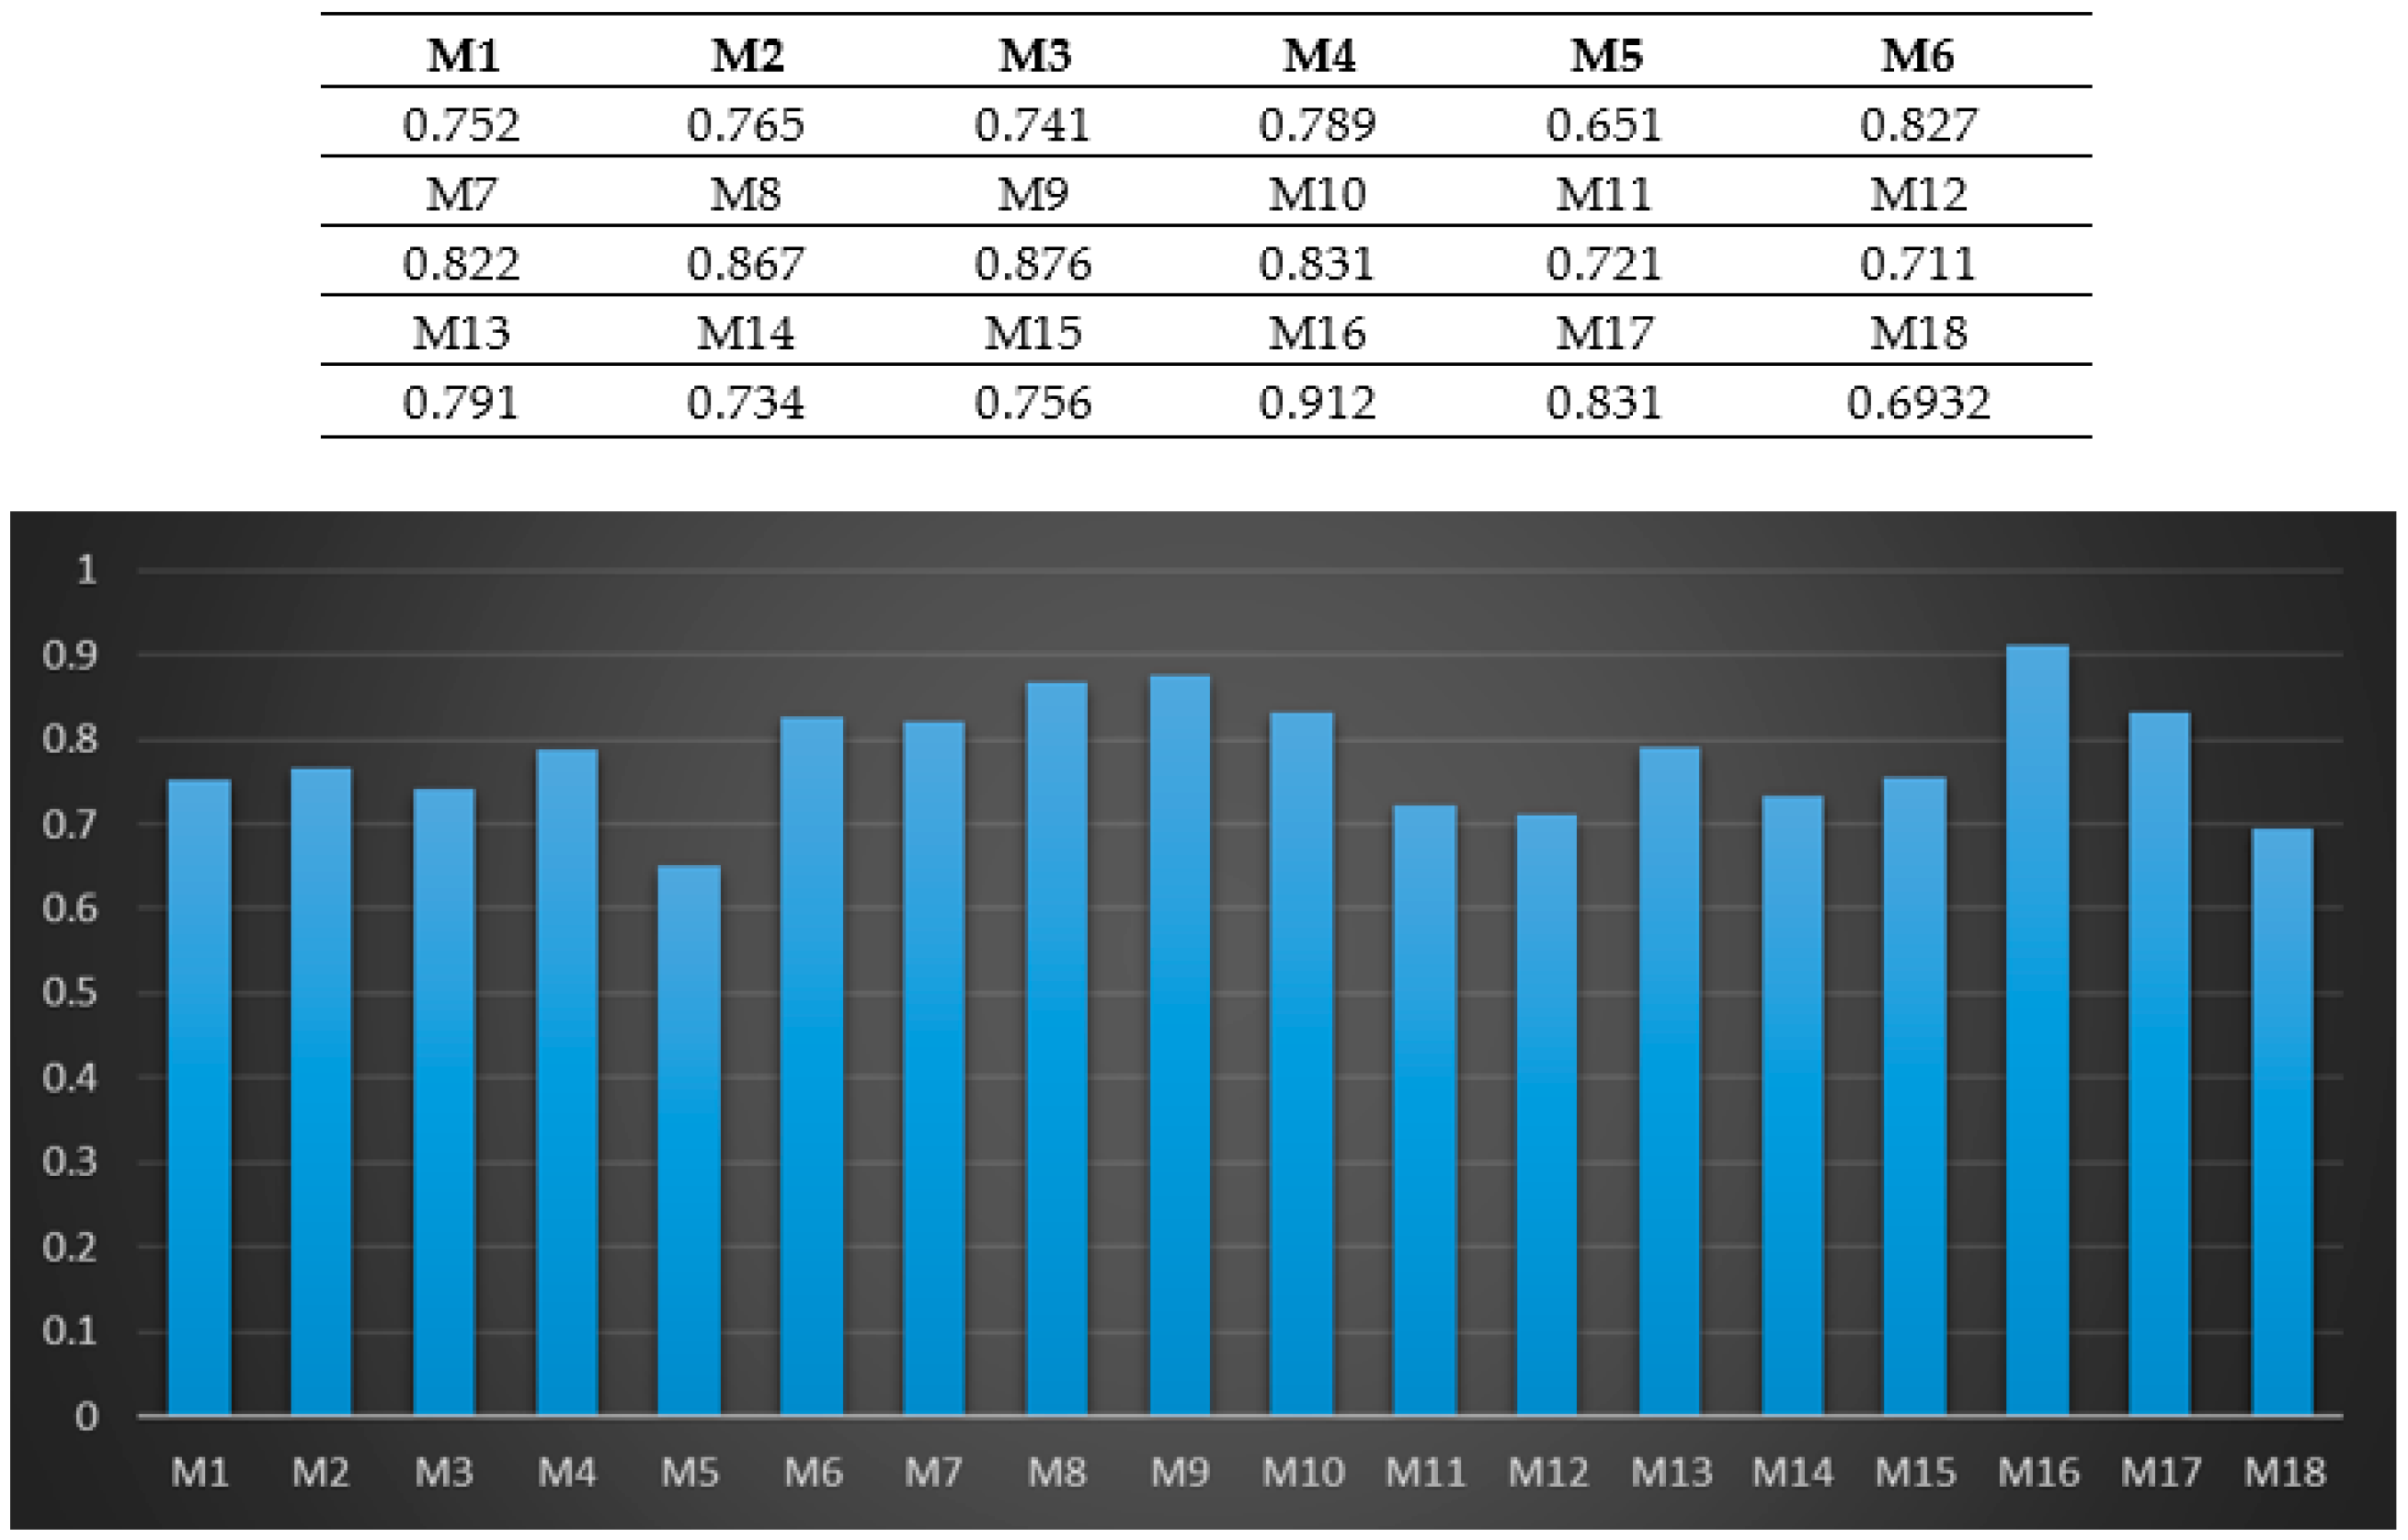
In this study, a total of 18 groups of sketches corresponding to the visual images derived from five sensory stimuli were collected, organized, and analyzed, and the following results were found:
- When feeling the field through the visual senses, most research participants tend to take in materials directly from buildings or surrounding landscapes, taking their shapes and colors, then simplifying and drawing.
- Because sound has no specific image, the research participant is better able to extract the depiction of specific objects, which are purely converted on the basis of the stimuli felt by hearing.
- The five sensory stimuli are vision, hearing, smell, taste, and touch. If the source of inspiration has a specific image (such as a certain food), the research participant is susceptible to the visual senses, and the picture is directly formed by the color and shape of the object. If the source of inspiration does not have a specific image (such as a certain odor), the research participant is more likely to start from the stimulus of the senses and create shapes and colors that represent the feeling.
The above observations respond to many relevant studies. Design is a “searching” process. Designers find similar situations by searching for past memories and experiences before analyzing, reasoning, and transforming unstructured problems into structured problems, so that the best solution can be found in the end. In the process of forming derivatives, the same situation occurs. Designers generally search for similar visual experiences in the past, which include shape and color factors, and try to cite them inferentially to promote creativity. Therefore, the visual thinking phenomenon produced by visual experience plays an important role in the process of design (Figure 13 and Appendix A).
Regarding the final experimental results, the overall creativity score in the overall scoring weight is higher than 0.912 for M16, while the sensory-stimulated visual weight value at the lowest point is 0.651 for M5. These results prove that the sensory-stimulated visual graphic required in this method can be applied to design feasibility studies in an objective manner. On the other hand, a large amount of data has to be aggregated in order to build the system using this method. The conclusions in this study were well-calculated via the gray relation values. In the prediction system, 18 different designers reviewed the factors of the relationship between creativity and vision, hearing, smell, taste, and touch. In the planning of the sensory-stimulated visual graphics, the theory of a multi-attribute decision-making gray theory evaluation model has been adopted to obtain the combination of weight values, thereby providing an effective system for predicting the creativity of a designer. In particular, post-test experiments were used to verify this system. These results show that it is helpful for designers to predict the right combination of creativity, where the prediction system can be used to acquire the best benefits, and this method can also be used to design other products.
6. Conclusions
This research was conducted using the gray theory evaluation model of creativity and multi-attribute decision-making, among which different sensory stimuli do indeed affect the thinking of designers. At the beginning of the design task, multiple senses can be used to receive stimulation in order to spark inspiration. Through different thinking models, a wider range of ideas and sketches can be produced. Even if most of the subjects have not received relevant training, they can transform different sensory stimuli into visual pictures, complete their design tasks, and give a full account of their works. However, the following problems may show up during the transitional process:
- The most difficult sensory stimulus for most research participants to convert was the visual sense. Since the visually perceived objects have specific images, the research participants are easily affected by the shape and color of the objects, which impedes them from formulating an abstract graphic composition.
- Even if it is not felt through visual senses, as long as these stimuli have a specific image, the research participants will be affected by their past visual experience and the shape and color of the object will be used as the basis of the graphic composition.
- Using the MADM method of five sensory experience, students’ design thinking creation uses this systematic way to get the weight value of the evaluation, so you can use the five sensory experience to convert it into a graph and then get important information by statistical methods. The weight value is used as the student’s score ranking.
However, the above problems can be solved by the following methods. For example, in order to improve the visual conversion ability of the research participants, additional training for converting a concrete object to an abstract painting can be arranged by referring to the processes of converting trees or cows used by Mondrian and Picasso. For other sensory aspects, objects without specific images may be used as the source of stimulation, or a blind test may also be applied, such that the research participant can feel the source of stimulation. This way, the research participant can draw their attention away from the vision and focus on the pure stimulus of the senses, establish a gray relation analysis design, and evaluate their choices. Therefore, in this study, a series of sensory-stimulated visual graphics were taken as an example. A gray relation analysis method based on gray quantity evaluation and decision making for serialized product solutions has been proposed. Since this study argues that scholars shall make connections with actual visual designs, the following method is proposed: By adopting the modification of marketing and sales as a whole, creative design is filtered such that the weight value of the solution is designed to meet the actual needs.
Author Contributions
The author contributed to the paper. H.-H.L. collected and organized the data and acted as the corresponding author. H.-P.L. proposed the methods. All authors have read and agreed to the published version of the manuscript.
Funding
This work was supported by the Ministry of Science and Technology of the Republic of China under grant MOST-108-2410-H-468-008 and MOST-108-2221-E-468-003.
Conflicts of Interest
The authors declare no conflict of interest.
Appendix A
Figure A1.
Determine grey numbers for design evaluation.


Step 1: This study can be classified into three types, which are denoted by . Each type includes five criteria, which are denoted by .
Step 2: Calculate the grey weights of the assessment criteria by Equation (17) along with the assessment criteria , as shown in Table A1.
Step 3: Determine the grey assessment results, i.e., .

Table A1.
Weights of each evaluation criterion.
| Product Designer | |
|---|---|
| Mobility | [0.529,0.686] |
| Manufacturability | [0.457,0.586] |
| Product form | [0.586,0.771] |
| Creativity | [0.671,0.800] |
| Cost | [0.571,0.700] |
Step 4: Calculate the grey assessment results of the target product series. An example is shown in Table A2.
Table A2.
Grey numbers obtained by five evaluation criteria.
| Product Designer | |
|---|---|
| Mobility | [6.286,7.571] |
| Manufacturability | [4.429,6.000] |
| Product form | [6.714,8.286] |
| Creativity | [5.143,6.714] |
| Cost | [4.714,6.000] |
The resulting grey numbers are (6.286,7.571), (4.429,6.000), (6.714,8.286), (5.143,6.714), and (4.714,6.000) respectively. With the addition of the design evaluation criteria weight, , we can obtain [27.286,34.571].
Step 5: Build the Grey evaluation matrix. Calculate the scores of every single grey evaluation matrix,, as shown in Table A3.
Table A3.
Grey evaluation criteria matrix of product series.
| 1 | 2 | 3 | 4 | 5 | |
|---|---|---|---|---|---|
| S1 | [27.286,34.571] | [27.570,36.231] | [28.857,35.428] | [27.234,35.285] | [27.321,36.612] |
| S2 | [28.857,38.571] | [32.190,37.532] | [25.831,41.235] | [27.714,36.142] | [28.285,39.285] |
| S3 | [25.225,33.428] | [25.857,32.340] | [25.753,38.156] | [28.533,36.285] | [27.963,37.942] |
Step 6: Normalize the grey evaluation matrix in Table A7. Normalize the factors in the matrix and build the grey evaluation matrix, ** S, of normalized product series solutions, as shown in Table A4.
Table A4.
Grey evaluation matrix of normalized product series.
| 1 | 2 | 3 | 4 | 5 | |
|---|---|---|---|---|---|
| S1 | [0.707,0.896] | [0.735,0.965] | [0.700,0.859] | [0.751,0.972] | [0.695,0.932] |
| S2 | [0.748,1.000] | [0.858,1.000] | [0.626,1.000] | [0.764,0.996] | [0.720,1.000] |
| S3 | [0.654,0.867] | [0.689,0.862] | [0.625,0.925] | [0.786,1.000] | [0.712,0.966] |
Step 7: Specify the weight of each of the design combinations. This is the respective sales volume ratio of each of the pneumatic door closers. As shown in Table A5, the ratio of the smallest sales volume is 1, followed by an increasing geometric series.
Table A5.
Weights of five design models.
| 1 | 2 | 3 | 4 | 5 | |
|---|---|---|---|---|---|
| Sales volume ratio | 1 | 1 | 2 | 4 | 8 |
| Weight | W1 | W2 | W3 | W4 | W5 |
Step 8: Apply the weights in Table A5 to adjust the values in Table A3. First, the values in Table A5 were transformed by the scales in Table 1. After that, add the adjusted weights into the normalized evaluation matrix in Table A3. This results in a modified evaluation matrix, , as shown in Table A6.
Table A6.
Grey evaluation matrix, , with the prioritized weights according to the sales volume of each model.
Table A6.
Grey evaluation matrix, , with the prioritized weights according to the sales volume of each model.
| 1 | 2 | 3 | 4 | 5 | |
|---|---|---|---|---|---|
| S1 | [0.707,0.896] | [0.735,0.965] | [1.400,1.718] | [3.002,3.890] | [5.564,7.456] |
| S2 | [0.748,1.000] | [0.858,1.000] | [1.253,2.000] | [3.055,3.984] | [5.760,8.000] |
| S3 | [0.654,0.867] | [0.689,0.862] | [1.249,1.851] | [3.145,4.000] | [5.694,7.727] |
Step 9: Take the whitening procedure to calculate the grey numbers and put the results into Table A6, which is the whitened evaluation matrix D.
Table A7.
Evaluation matrix D of the whitened product series.
| 1 | 2 | 3 | 4 | 5 | |
|---|---|---|---|---|---|
| S1 | 0.802 | 0.850 | 1.182 | 2.360 | 4.727 |
| S2 | 0.874 | 0.929 | 1.126 | 2.528 | 4.872 |
| S3 | 0.760 | 0.775 | 1.055 | 2.498 | 4.847 |
Step 10: Obtain the resulting grey numbers after design evaluation of the whitened evaluation matrix in Table A11. After that, the ideal results of all solutions are listed in Table A8.
Table A8.
Advantageous and disadvantageous ranking of each product series.
| Item | Highest Score |
|---|---|
| 1 | 0.874 |
| 2 | 0.929 |
| 3 | 1.126 |
| 4 | 2.528 |
| 5 | 4.847 |
Appendix B. Grey Relational Analysis
Step 1: Generate the ideal optimal target ranking
After analyzing s by the grey relational analysis, the highest scores of the V_n^max can be obtained after the evaluation, as shown in Table A8. The scores can be combined so as to generate the ideal optimal target ranking as .
Step 2: Calculate grey relations
Calculate the grey relations between each of the evaluation solutions Si = {S1,S2,….,Sm} and the ideal optimal target alternative, S0. First of all, initialize the values of the alternative sequence as in Table A9.
Step 3: Determine the variances between the ideal optimal targets.
This step is to calculate the variances between the ideal optimal targets, as shown in Table A10.
Step 4: Calculate the grey relational coefficient, , within the sequences and the grey relation,
Calculate the grey relational coefficient, , in Equation (29) within the sequences and the grey relation, , in the solutions. Therefore, we can determine the average of the grey relational coefficient, , which are , respectively.
Table A9.
Initialized values of each solution series.
| 1 | 2 | 3 | 4 | 5 | |
|---|---|---|---|---|---|
| 1.000 | 1.000 | 1.000 | 1.000 | 1.000 | |
| 0.918 | 0.915 | 1.049 | 0.934 | 0.975 | |
| 1.000 | 1.000 | 1.000 | 1.000 | 1.005 | |
| 0.869 | 0.834 | 0.937 | 0.988 | 1.000 |
Table A10.
Variances between the ideal optimal targets in product series.
| 1 | 2 | 3 | 4 | 5 | |||
|---|---|---|---|---|---|---|---|
| 0.082 | 0.085 | 0.049 | 0.066 | 0.025 | 0 | 0.085 | |
| 0.000 | 0.000 | 0.000 | 0.000 | 0.005 | 0 | 0.005 | |
| 0.131 | 0.166 | 0.063 | 0.012 | 0.000 | 0 | 0.131 | |
| 0 | |||||||
| 0.131 |
Table A11.
and between product series.
| 1 | 2 | 3 | 4 | 5 | ||
|---|---|---|---|---|---|---|
| 0.444 | 0.435 | 0.572 | 0.498 | 0.724 | 0.53460 | |
| 1.000 | 1.000 | 1.000 | 1.000 | 0.754 | 0.95080 | |
| 0.333 | 0.283 | 0.510 | 0.845 | 1.000 | 0.59420 | |
| Total weight value r = | 0.6932 |
Step 5: Propose the result of grey relational analysis
The highest priority according to its grey relation between each solution and the optimal target solution, S0, is That is to say, . Total weight value, r 0.6932, as shown in Table A11.
References
- Menezes, A.; Lawson, B. How designers perceive sketches. Des. Stud. 2006, 27, 571–585. [Google Scholar] [CrossRef]
- Dorst, K.; Cross, N. Creativity in the design process co-evolution of problem-solution. Des. Stud. 2001, 22, 425–437. [Google Scholar] [CrossRef] [Green Version]
- Kokotovich, V.; Purcell, T. Mental synthesis and creativity in design: An experimental examination. Des. Stud. 2000, 21, 437–449. [Google Scholar] [CrossRef]
- McCloud, S. Understand Comics: The Invisible Art; Harper Collins Publishers: New York, NY, USA, 1993. [Google Scholar]
- Wang, R.; Hsu, C.C. Study of the design operation of graphic simplification. Des. J. 2007, 10, 54–73. [Google Scholar] [CrossRef]
- Palmet, S.E.; Xchloss, X.; Prado-León, L.R. Music-Color Association are Mediated by Emotion. Proc. Natl. Acad. Sci. USA 2013, 110, 8836–8841. [Google Scholar] [CrossRef] [PubMed] [Green Version]
- Schön, D.A.; Wiggins, G. Kinds of seeing and their function in designing. Des. Stud. 1992, 13, 135–156. [Google Scholar] [CrossRef]
- Casakin, H.; Goldschmidt, G. Expertise and the use of visual analogy: Implications for design education. Des. Stud. 1999, 20, 153–175. [Google Scholar] [CrossRef]
- McGown, A.; Green, G.; Rodgers, P. Visible ideas: Information patterns of conceptual sketch activity. Des. Stud. 1998, 19, 431–453. [Google Scholar] [CrossRef]
- Verstijnem, I.M.; Hennessey, J.; Leeuwen, C.; Hamel, R.; Goldschmidt, G. Sketching and creative discovery. Des. Stud. 1998, 19, 519–546. [Google Scholar] [CrossRef]
- Gero, J.S.; Kannengiesser, U. The situated Function-Behaviour-Structure framework. Des. Stud. 2004, 25, 373–391. [Google Scholar] [CrossRef]
- Herbert, D.M. Architectural Study Drawings; Nostrand Reinhold: New York, NY, USA, 1993. [Google Scholar]
- Suwa, M.; Tversky, B. What do architects and students perceive in their design sketches? A protocol analysis. Des. Stud. 1997, 18, 385–403. [Google Scholar] [CrossRef]
- Lin, H.H.; Hsiao, S.W. A Study of the Evaluation of Products by Industrial Design Students. EURASIA J. Math. Sci. Technol. Educ. 2018, 14, 239–254. [Google Scholar] [CrossRef]
- Hong, D.H.; Choi, C.H. Multicriteria fuzzy decision-making problems based on vague set theory. Fuzzy Sets Syst. 2000, 114, 103–113. [Google Scholar] [CrossRef]
- Liu, C.H. A Group Decision-Making Framework with Various Rating Attitudes Using Fuzzy Set Theory to Prioritize Design Requirements in Quality Function Deployment. Int. J. Ind. Eng. 2008, 15, 294–303. [Google Scholar]
- Zha, X.F.; Sriram, R.D.; Fernandez, M.G.; Mistree, F. Knowledge-intensive collaborative decision support for design processes: A hybrid decision support model and agent. Comput. Ind. 2008, 59, 905–922. [Google Scholar] [CrossRef]
- Szmidt, E.; Kacprzyk, J. Using intuitionistic fuzzy sets in group decision making. Control Cybern. 2002, 31, 1037–1053. [Google Scholar]
- Atanassov, K.; Pasi, G.; Yager, R. Intuitionistic fuzzy interpretations of multi-attribute multi-person and multi-measurement tool decision making. Int. J. Syst. Sci. 2005, 36, 859–868. [Google Scholar] [CrossRef]
- Liu, H.W.; Wang, G.J. Multi-criteria decision-making methods based on intuitionistic fuzzy sets. Eur. J. Oper. Res. 2007, 179, 220–233. [Google Scholar] [CrossRef]
- Lin, H.H.; Cheng, J.H.; Chen, C.H. A systematic approach of predicting color preference on the basis of gray relational grade. Color Res. Appl. 2019, 44, 194–204. [Google Scholar] [CrossRef]
- Lin, H.H. Application of Gray Relational Analysis and Computational Fluid Dynamics to the Statistical Techniques of Product Designs. Symmetry 2020, 12, 227. [Google Scholar] [CrossRef] [Green Version]
- MathWorks Company Overview, MathWorks: Natick, MA, USA, 2020.
Figure 1.
Mondrian’s “Tree” series of paintings (left, red tree (1910); middle, gray tree (1911); right, flowering apple tree (1912)).
Figure 1.
Mondrian’s “Tree” series of paintings (left, red tree (1910); middle, gray tree (1911); right, flowering apple tree (1912)).

Figure 2.
Picasso’s bull (a simplified process from figuration to abstraction).

Figure 3.
Five processes of graphic simplification. Source: McCloud, S. (1993). Understand comics: The invisible art. New York: Harper Collins Publishers.
Figure 3.
Five processes of graphic simplification. Source: McCloud, S. (1993). Understand comics: The invisible art. New York: Harper Collins Publishers.

Figure 4.
Extraction of overall shape.

Figure 5.
Extraction of component attributes.

Figure 6.
Source of sensory stimulus.

Figure 7.
Flow diagram of gray relational analysis with sensory-stimulated visual images for creativity.
Figure 7.
Flow diagram of gray relational analysis with sensory-stimulated visual images for creativity.

Figure 8.
The concept of a gray system.

Figure 9.
The concept of a gray number.

Figure 10.
An example of using the calculator.

Figure 11.
Five sensory visual image tests for creative thinking, showing sample response.

Figure 12.
Visual images corresponding to five types of sensory stimulation.

Figure 13.
Sensory-stimulated visual weights of the designers.

Table 1.
The scale of attribute weights ⊗w.
| Scale | |
|---|---|
| (7) Very high | [0.9,1.0] |
| (6) High | [0.6,0.9] |
| (5) Medium high | [0.5,0.6] |
| (4) Medium | [0.4,0.5] |
| (3) Medium low | [0.3,0.4] |
| (2) Low | [0.1,0.3] |
| (1) Very low | [0.0,0.1] |
Table 2.
The scale of attribute ratings ⊗G.
| Scale | ⊗G |
|---|---|
| (1) Very poor | [0,1] |
| (2) Poor | [1,3] |
| (3) Medium poor | [3,4] |
| (4) Fair | [4,5] |
| (5) Medium good | [5,6] |
| (6) Good | [6,9] |
| (7) Very good | [9,10] |
Table 3.
Visual weights of sensory stimuli.
| Sample Number | S11 | S12 | S13 | S14 | S15 |
| The first layer: Sensory-stimulated visual images |  |  |  |  |  |
| S1 = (0.7426) | |||||
| Sample Number | S21 | S22 | S23 | S24 | S25 |
| The second layer: Sensory-stimulated visual images |  |  |  |  |  |
| S2 = (0.7396) | |||||
| Sample Number | S31 | S32 | S33 | S34 | S35 |
| The third layer: Sensory-stimulated visual images |  |  |  |  |  |
| S3 = (0.8446) | |||||
| Total weight value r = (0.7756) |
© 2020 by the authors. Licensee MDPI, Basel, Switzerland. This article is an open access article distributed under the terms and conditions of the Creative Commons Attribution (CC BY) license (http://creativecommons.org/licenses/by/4.0/).
Share and Cite
MDPI and ACS Style
Lu, H.-P.; Lin, H.-H. Exploring the Impact of Intuitive Thinking on Creativity with Gray Relational Analysis. Sustainability 2020, 12, 2989. https://doi.org/10.3390/su12072989
AMA Style
Lu H-P, Lin H-H. Exploring the Impact of Intuitive Thinking on Creativity with Gray Relational Analysis. Sustainability. 2020; 12(7):2989. https://doi.org/10.3390/su12072989
Chicago/Turabian StyleLu, Hui-Ping, and Hsin-Hung Lin. 2020. "Exploring the Impact of Intuitive Thinking on Creativity with Gray Relational Analysis" Sustainability 12, no. 7: 2989. https://doi.org/10.3390/su12072989
Note that from the first issue of 2016, this journal uses article numbers instead of page numbers. See further details here.