The Hawaiian Islands: Conceptualizing an Industrial Ecology Holarchic System


1
Center for Industrial Ecology, School of Forestry and Environmental Studies, Yale University, New Haven, CT 06511, USA
2
Graduate School of Energy and Environment (KU-KIST Green School), Korea University, Seoul 02841, Korea
*
Author to whom correspondence should be addressed.
†
These authors contributed equally to this work.
Sustainability 2020, 12(8), 3104; https://doi.org/10.3390/su12083104
Submission received: 24 February 2020
/
Revised: 7 April 2020
/
Accepted: 8 April 2020
/
Published: 13 April 2020
(This article belongs to the Special Issue The Metabolism of Islands)
Abstract
:The Hawaiian Islands form a holarchic system with at least five nested layers (holons) at increasing spatial scales: from a single enterprise to cities, to individual islands, to the archipelago (the group of islands), and to the global resource base that connects them all. Each holonic layer operates individually but is also linked to holons at lower and higher levels by material input and output flows. An integrated study of the holarchic system allows us to explore the value of applying this concept to industrial ecology. We present examples from a multi-level material flow analysis combining a large quantity of material and energy flow data for Hawaii from the five holarchic levels. Our analysis demonstrates how a holarchic approach to the study of selected interacting systems can reveal features and linkages of their metabolism not otherwise apparent and can provide a novel basis for discovering material, energy, and societal connections.
1. Introduction
Industrial ecologists have established material flow analysis (MFA) as a premier tool for assessing the metabolism of human society. While an MFA can be a highly effective tool for optimizing resource allocation, researchers can easily overlook the relationships between a system under study and other related systems. Failing to understand the interdependencies of systems could lead to sub-optimal decision making when considering broader system boundaries for analyses. One such example is the shock in global automobile production following the 2011 earthquake in Japan, which revealed to many major automakers that parts of their upstream supply chains depended on a pigment produced by only one factory in the world, near Fukushima. Automakers could have hedged their supply chain risks if they had a full understanding of how their networks of lower-tier suppliers (lower-level systems) integrated with networks that include higher-tier suppliers (higher-level systems). The current framework for MFA works well at helping researchers identify opportunities for optimizing systems at a single system level but is not well suited for optimizing material flows across nested systems interacting with one another. One idea to address this limitation is to approach MFA using the holarchy framework. The holarchy concept aims to examine systems holistically by acknowledging the systems nature of the modern material-based society.
The holarchy framework was proposed by Koestler [1] as an alternative to hierarchy in recognizing the semi-autonomous characteristic of components of biological and social systems, including organizations, organisms, and cells. Each of these entities is considered a holon since each is a complex system with operational and managerial independence wherein each system is seeking to optimize objectives at its respective holarchic level [2]. As such, a holon is simultaneously a part and a whole in itself and arises from the collaboration of its complex sub-systems and super-systems. This framework has been commonly applied to information systems of intelligent manufacturing systems [3,4,5] and of supply chain management systems [6,7,8] and, more recently, to energy systems such as microgrids [9]. Holarchy has also been used to analyze the means for improving the resilience of social-ecological systems [10,11], including how to alleviate congestion, ineffective distribution of resources, and environmental pollution in cities [12]. Holarchy was introduced to industrial ecology by the works of Kay [13] and Spiegelman [14] to study socio-economic systems as self-organizing, holarchic, open (SOHO) systems.
It is widely recognized that quantifying the material flows into and from a jurisdictional region such as a city or country is not a simple matter. The challenge is one of data availability, which could result from (1) a simple lack of effort in data collection, (2) data collected but in insufficient detail for the intended purpose, or (3) the difficulty of monitoring flows across porous jurisdictional boundaries. In principle, a promising way of addressing the data challenge is by focusing on islands, which have clearly defined physical boundaries and, often, a small number of locations (ports, airports) where material flows need to be monitored [15]. The methodological utility of island boundaries was, of course, recognized by Darwin in his studies of finches in the Galapagos Archipelago. A nice summary of his work is given by Grant and Estes [16]. Examples of island-based MFAs that demonstrate this efficacy include those of Singh et al. [17], Lenzen [18], Krausmann et al. [19], Nielsen and Jørgensen [20], and Cecchin [21].
Anthropogenic activities on islands become segments of economies larger and smaller. In this vein, the sum of human activities on Planet Earth related to material flows represents the sum of flows into and from Earth’s regions. The regional flows are those related to cities, industries, and other activities, extending down to smaller entities. Nonetheless, it is not easy to demonstrate the features of a modern, multi-level material system. Islands may provide a potential end-run around this challenge because island archipelagoes are themselves generally self-contained and are also connected with their individual islands (a lower level) and with flows to and from continental and global systems (higher levels).
An archipelago and its connections form an example of a holarchy, or what engineers call a system of systems [2] and ecologists call a panarchy [22,23]. In such a system, a higher-level holon is, in part, a result of activities of holons below it in the hierarchy. Similarly, an upper-level holon may constrain the behaviors of lower-level holons. One can, therefore, picture a material flow holarchy ranging from the lowest level holon to the highest level holon defined in this paper as (1) an industrial activity on an island by one or more enterprises, (2) a city on the island that contains that industrial activity, (3) the island itself, (4) the archipelago of which the island is part, and (5) the planet that contains the archipelago. The holarchy framework can also be applied to conceptualize non-island socio-economic systems.
In practice, a holarchic study in industrial ecology would consist of the collective examination of material flow accounts of a particular holon and its lower- and higher-level holons which form a holarchy (Figure 1). This article synthesizes research by faculty and graduate students from the Yale School of Forestry and Environmental Studies and explores some of the benefits and challenges of examining material flows for Hawaii using the holarchy framework. The material flow accounts presented in this study were not compiled with the idea of holons in mind, but it subsequently occurred to us that the islands were part of a holarchic system. Our previous objective had been to compare material flows on islands that were each a political unit (typically a county) of the same state, Hawaii, thereby allowing us to examine variations in metabolism while controlling for differences in the regulatory system. Because of limitations in scope and data availability, the results are indicative rather than comprehensive, revealing some of the challenges and achievements of applying the holarchic perspective within industrial ecology. The value of the activity is that it demonstrates the potential of a holarchic approach to MFA, and thereby encourages further research based on that perspective.
2. Materials and Methods
The Hawaiian Island Archipelago consists of six principal islands (Figure 2) and a number of smaller, largely uninhabited islands. During the years 2006–2013, faculty and graduate students from the Yale School of Forestry and Environmental Studies conducted projects related to quantifying and analyzing flows of materials through the islands, organized by authors of the present study. MFAs, energy analyses, and targeted studies of various kinds were conducted for a selection of industries, cities, and islands in the archipelago [24,25,26,27,28,29,30,31,32,33,34,35,36,37,38,39,40,41,42,43,44,45,46,47]. These activities were pursued with diverse analytic aims in mind, with the result that the individual studies were interesting and useful, but the sum of the studies did not comprise a fully integrated specification of the interlinked material flows related to the Hawaiian Archipelago. Nonetheless, the results provide examples of metabolism at the different holarchic levels, thereby enabling us to demonstrate the potential value of a complete holarchic evaluation centered on anthropogenic flows of materials.
The analysis in the present work is directed at the five-level holarchy shown in Figure 3. As the holarchy framework views each holon as a semi-autonomous system, our study treats each holon as an individual system of analysis, effectively constructing a tiered system of MFAs consisting of multiple levels connected by material input and output flows. We present the multi-layer analysis of material flows by providing examples of standalone MFAs for holons drawing on our previous works (see the Supplementary Materials for additional examples of such MFAs). The compiled material flows are compared across individual holons to yield insights that are not apparent when examining each holon in isolation.
The material flow accounts at each holarchic level were compiled based on Eurostat’s methodology for economy-wide material flow accounts (EW-MFA; see the Supplementary Materials for the compiled material flow data) [48]. Imports and exports for each holon were calculated using data on inbound and outbound ocean shipments by port from the U.S. Army Corps of Engineers Waterborne Commerce Statistics Center [49]. The accounts for domestic extraction drew primarily on state-level harvest and mining data from the U.S. Department of Agriculture’s National Agricultural Statistics Service [50] and the U.S. Geological Survey’s National Minerals Information Center [51]. State-level material accounts were disaggregated to the island and municipality levels based on information including the distributions of crop area, retail sales, population, and man-hours worked in mines, provided by the State of Hawaii Databook [52], a publication of the State of Hawaii’s Department of Business, Economic Development and Tourism (DBEDT), the U.S. Census Bureau’s Economic Census [53], and the U.S. Department of Labor’s Mine Safety and Health Administration [54], among others. For analyses of island and industry-level holons, data from these sources were enhanced by in-person interviews conducted in Hawaii by Yale graduate students and by personal communication with individuals at local organizations. Apparent consumption, or formally direct material consumption, is calculated as the sum of used domestic extraction and imports, minus exports.
Material shipments by air are not accounted for in this study. Approximately 98% of imports to Hawaii were ocean deliveries [37], and this ratio was assumed to be similar for exports. Therefore, values for ocean shipments were treated as all shipments in the calculations. Furthermore, the terms “import” and “export” are used in this document to describe inbound and outbound material flows for a defined system as used by Eurostat [48] and do not strictly indicate international flows. Imports and exports for the entire State of Hawaii can be calculated from port-level data because all ocean shipments to and from the Hawaiian Islands pass through Oahu [37]. Our analysis does not include unused extraction, indirect flows, or sectoral disaggregation of material flows. We present the results of MFAs for individual holons by holarchic level in order of increasing spatial scale and explore their relationships.
3. Results
3.1. Holon Level 1: The Macadamia Nut Industry on the “Big Island”
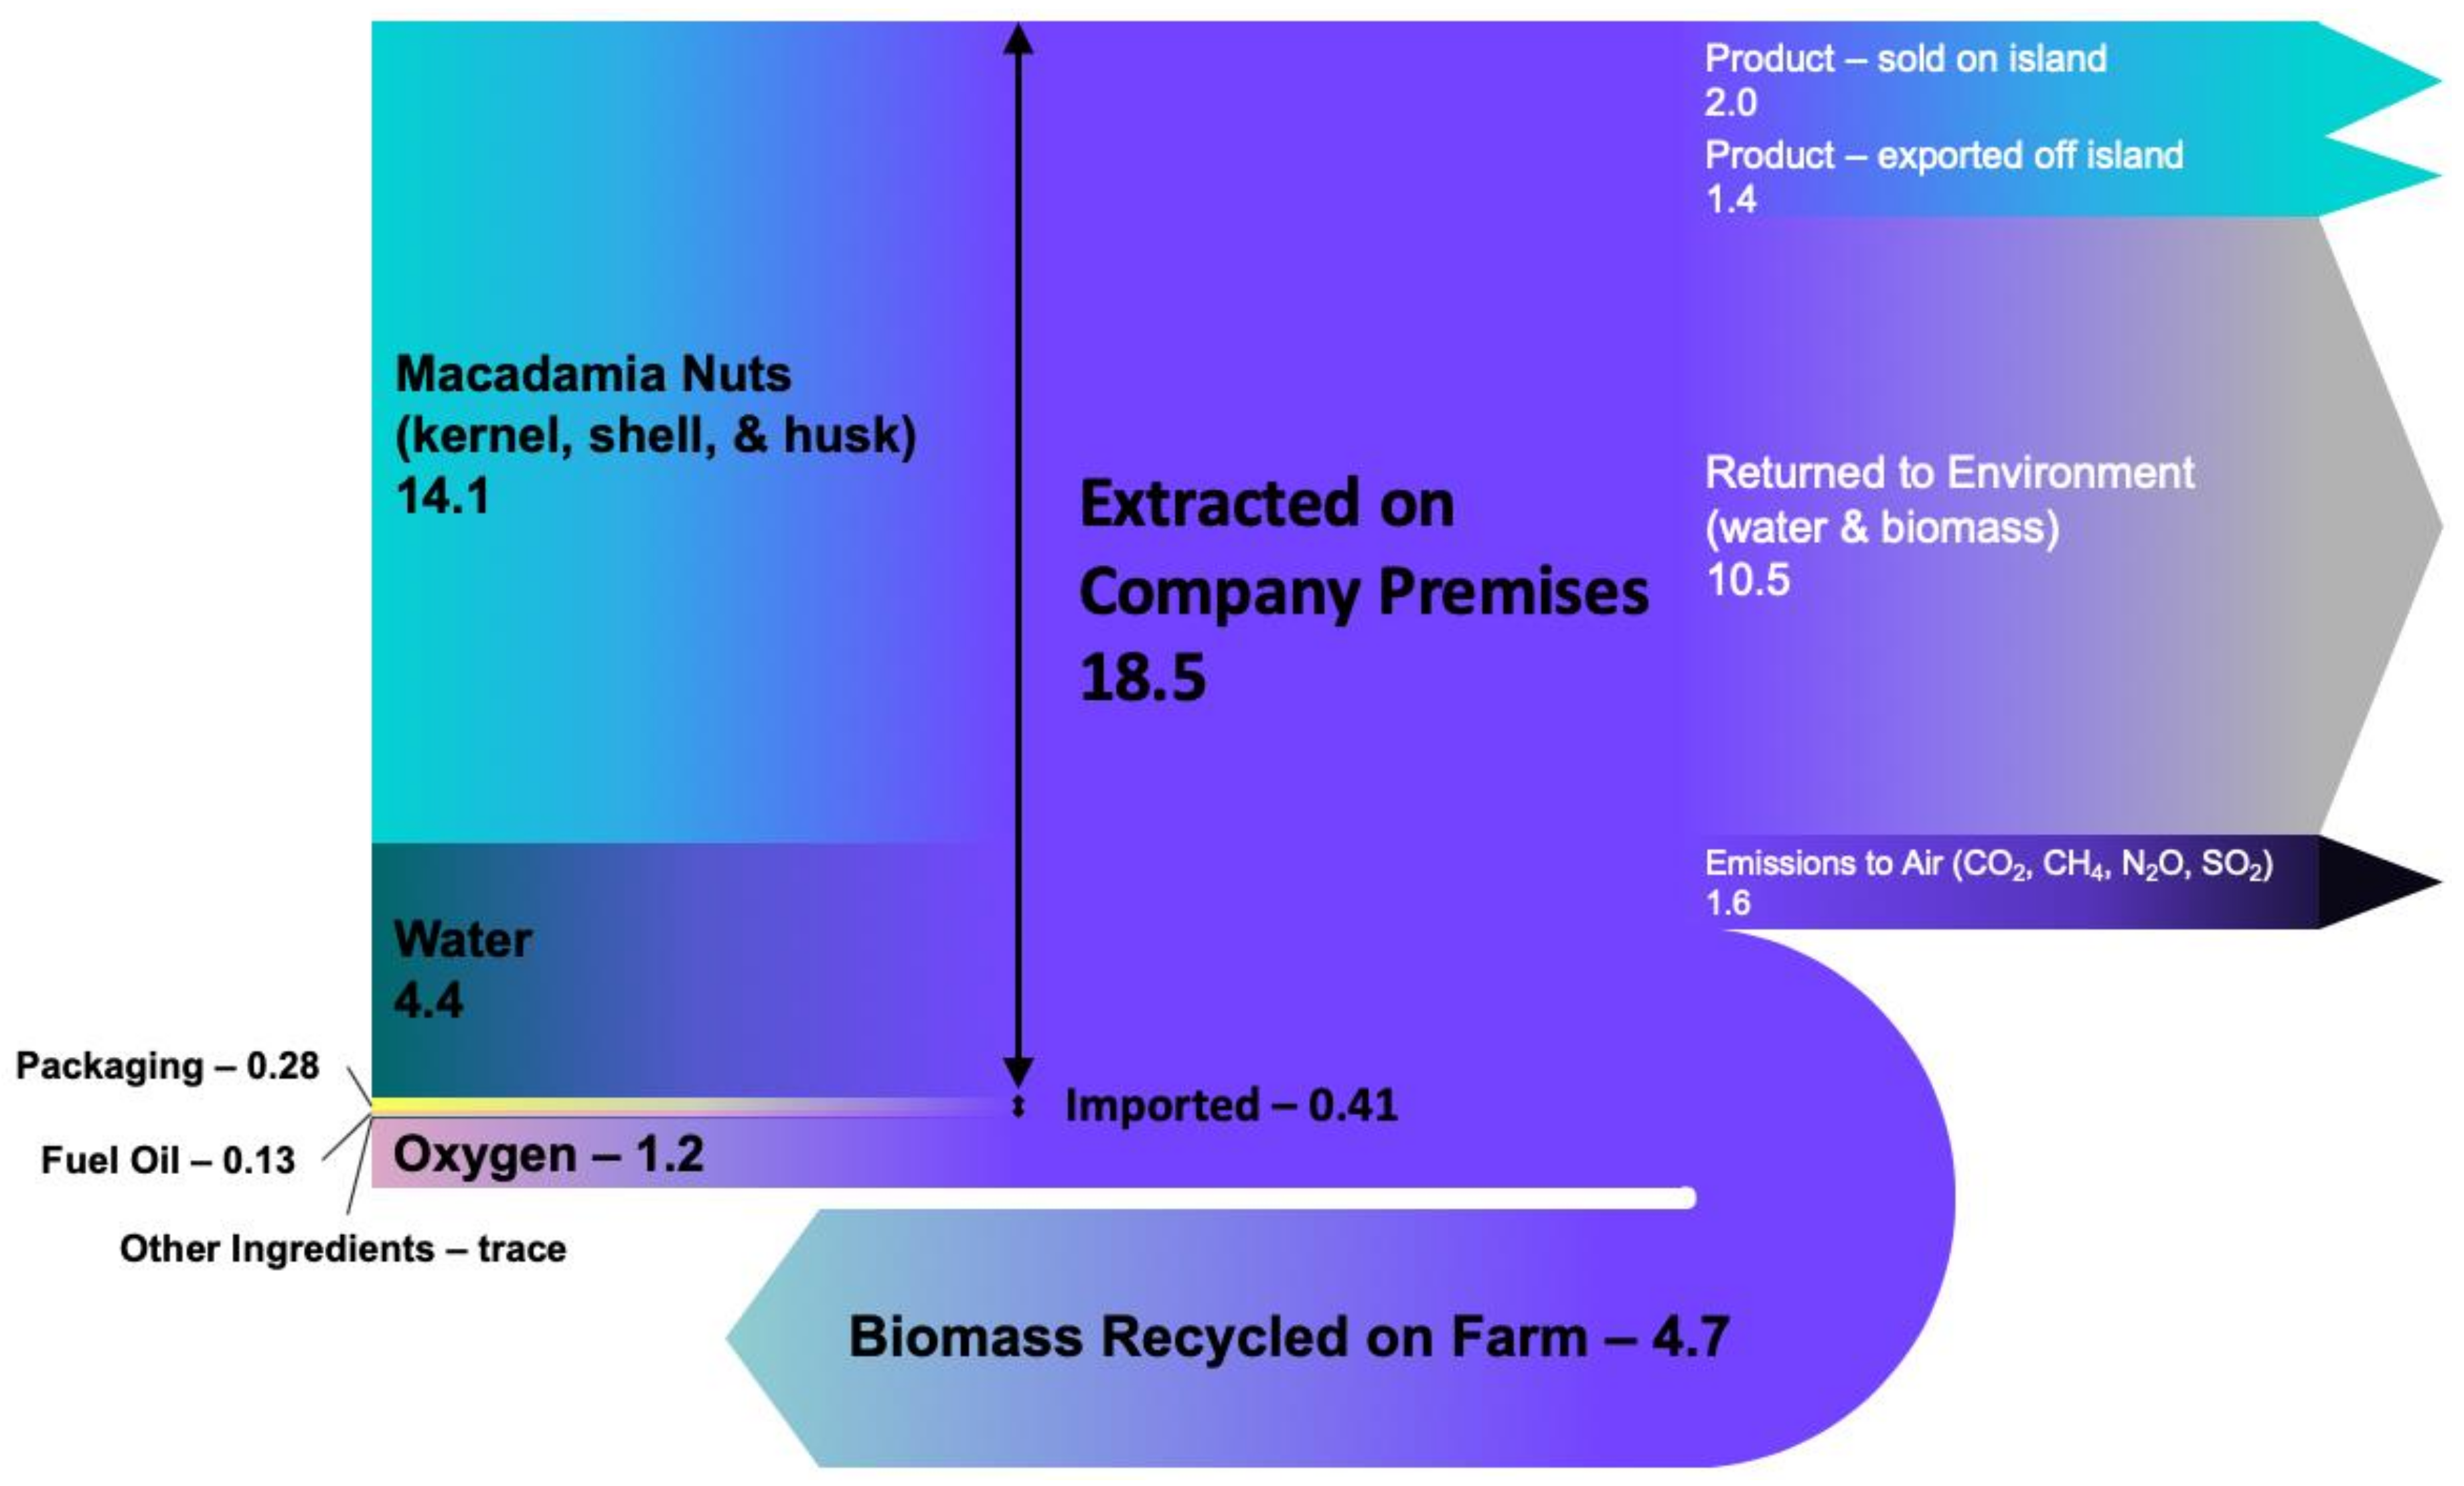
Among the significant industrial sectors in the Hawaiian Archipelago is the macadamia nut industry on Hawaii Island (hereafter termed the “Big Island” to avoid confusion). One macadamia nut factory processed 14.1 Gg of macadamia nuts in 2005 (Figure 4). The processing plant’s operations relied on very few island imports relative to its direct material inputs (island export-import ratio of 3.4 by mass). The facility derived 60% of its power from an on-site generator that burned 660 Mg of discarded macadamia nut shells and another 20% from 130 Mg of waste fuel oil. Water was extracted from two deep wells on the property, and the nuts were grown primarily in orchards adjacent to the factory, minimizing the distance for material transport. Other industries could, of course, be analyzed in the same way, depending on the availability of data and the purpose of the analysis.
The material flows for individual facilities could be effectively characterized by conventional MFAs for enterprise-level holons. However, these analyses alone do not inform how the quantified flows relate to flows for a city, an island or county, and other higher-level holons. Whole island data show that 25.6 Gg of macadamia nuts were harvested on the Big Island in 2005, so the factory processed over half of all macadamia nuts collected on the island in that year. Such a comparison for a single material may be simple and interesting, but much more data are required to make robust assessments about the overall relationships between material flows for an individual enterprise (or industry) and aggregate flows for higher-level holons. For example, the relative contributions of the factory’s material flows to the total flows for the State of Hawaii remain unaddressed. This knowledge gap may be filled, however, by utilizing results from other holarchic levels, as shown in the following sections.
3.2. Holon Level 2: Municipalities on the Big Island: Hilo and Kona
The example holon for level 2 is a municipality. As part of our study, the students conducted MFAs to examine the social metabolism of Hilo and Kona, the two principal urban centers on the Big Island. In this study, Hilo’s spatial extent is defined as the Hilo Census Designated Place (CDP), and Kona’s extent is defined as the collection of Kailua, Kahaluu-Keauhou, Kalaoa, Holualoa, and Honalo CDPs, based on extensive consultation with geographers and the County of Hawaii planning departments (Although Kona and Hilo are known as the largest municipalities on the Big Island, neither has municipal boundaries per se. It is typical in Hawaii that the more populous islands are designated as counties and are unincorporated. With no official boundaries, a geographical carving out of CDPs had to be created for both Hilo and Kona to conduct the comparison properly, specifically in connection with National Science Foundation grant #0948781 ULTRA-Ex Award. “Human-Nature Interactions in an Urbanized Island Setting: Hilo and Kailua-Kona, Hawai‘i as Model Socio-Ecological Systems.”). The macadamia nut factory lies outside of our system boundaries for Hilo and Kona. Because more than one example of a municipality holon was addressed, it was possible to compare the two results, as shown in Figure 5.
Significant differences are seen across Hilo and Kona in imports, exports, and domestic extraction. The resident population of Hilo was approximately 20% greater than that of Kona in 2009 [52], but the direct material input to Hilo was 43% greater than that of Kona. One reason for this disparity was Hilo’s fossil fuel imports, which were 87% greater than that of Kona. On the other hand, there were several materials that had larger flows for Kona than those for Hilo. Notably, Kona imported, locally extracted, and consumed a larger amount of biomass, for grazing and for food and agricultural products. The larger imports and domestic consumption of biomass may partially be explained by Kona’s greater focus on the tourism industry. Interestingly, Kona extracted more biomass, even though Hilo had 13 times more water than the dry, tourism-oriented Kona [26]. Construction minerals accounted for 44% of direct inputs to each municipality, and almost all were used within the cities. Together, the two municipalities consumed 350 Gg of fossil fuels and utilized 1,350 Gg of construction minerals. While separate MFAs for holons at the same holarchic level allow for some comparisons, no claims with respect to higher-level holons could be made without MFA results for higher-level holons, as was the case with the macadamia nut factory.
3.3. Holon Level 3: The Big Island
The example holon for level 3 is an island. An MFA that was completed for the Big Island is shown in Figure 6. The economy of the island was evenly dependent on imports and local extraction in 2009, with the direct material input equaling 5,080 Gg. Fossil fuel imports amounted to 580 Gg, of which 99% was consumed on the island. Construction minerals were the largest material flow, equaling 40% of direct inputs. Practically all non-metallic mineral inputs were consumed on the island. Approximately 72% of the direct material input, a larger ratio compared to Hilo and Kona, was consumed on the Big Island as a whole. This difference is mainly a result of the large local extraction of biomass for grazing on the island.
A comparison of material flows for Hilo and Kona with that of the entire island reveals that while almost half of the island’s population resided in Hilo and Kona [52], the two municipalities together accounted for the use of 61% of fossil fuels and 66% of construction minerals consumed on the entire island. Furthermore, the quantity of biomass extracted in the two municipalities combined was practically insignificant for the island overall (0.9% of local extraction and 0.4% of the direct material input to the Big Island).
Thus, comparing the metabolism of Hilo and Kona with that of the entire island illustrates that much of the island exhibited characteristics of a more rural economy. With MFA data for multiple holarchic levels, researchers may be able to make practical approximations of material flows for holons with data gaps. For example, subtracting Hilo and Kona’s quantities for local extraction of food and agricultural products from the total extraction of food and agricultural products on the Big Island yields the result that the distribution of extracted food and agricultural products was 3.9 Gg in Hilo, 4.4 Gg in Kona, and 58.7 Gg across the entire rest of the island. This distribution would have been missed from solely an island-level MFA or a comparison of Hilo and Kona. The estimation technique is not directly applicable to our dataset because the flows for Hilo and Kona were derived together with those for the rest of the island by applying allocation factors to island-level flows (based on ratios of cropland area, building permits, product sales, etc.). The approach would have been practical, however, if the domestic extraction of biomass for Hilo and Kona were calculated using cropland area and granular crop yield estimates, which vary widely by section of the island. It could also be useful in cases where material flow data are documented for a higher-level holon (e.g., island or county) and only for some nested, lower-level holons (e.g., city).
With approximate data for the extraction of food and agricultural products on the rest of the Big Island, comparisons could be made with the macadamia nut factory. The quantity of macadamia nuts processed by the factory accounts for roughly a quarter of food and agricultural products extracted on the island, excluding Hilo and Kona, and a fifth of all food and agricultural products extracted on the island overall. This comparison also shows, however, that even an enterprise such as the macadamia nut factory contributed less than 1% of the total domestic extraction and the direct material input for the Big Island.
3.4. Holon Level 4: The Hawaiian Archipelago
The example holon for level 4 consists of the six most populous islands of the Hawaiian Archipelago, which account for the vast majority of material flows for the State of Hawaii. Figure 7 illustrates the overall material flows for the state, revealing the archipelago holon’s metabolic profile to be very different from that of the Big Island holon. The State of Hawaii had a direct material input of 24.8 Tg in 2007, split evenly between domestic extraction and imports, similar to the Big Island. Unlike the Big Island, however, 94% of the direct material input to the state was consumed within the archipelago system.
Construction minerals were the most prominent materials for domestic extraction and apparent consumption for the archipelago holon. The flows of fossil fuels for the entire state were much larger than for the Big Island holon in absolute terms and in relation to other materials for imports, exports, and apparent consumption. Further analyses of material flows for island-level holons revealed that over two-thirds of all fossil fuel imports are consumed on Oahu. The distribution of fossil fuel consumption among the islands was in line with the population distribution, although there also appeared to be a decrease in consumption per capita with islands with higher population densities. This trend was similar for other material flows as well.
The quantities for the state’s exports may appear to be small when considering that the Big Island’s exports alone were comparable to those of the entire state. The comparison of MFAs for the archipelago-level and island-level holons revealed that 46% of all of Hawaii’s ocean shipments (sum of imports and exports) were intrastate (inter-island) shipments by mass, mostly consisting of metals. This result is in agreement with figures from a study by the Hawaii DBEDT [56]. For the archipelago holon, fossil fuel was a significant export, translating to 6% of imported fossil fuels. Much of the exported fossil fuels consisted of naphtha, a solvent and feedstock for plastics, for which no significant market exists in Hawaii [57].
3.5. Holon Level 5: Pacific Ocean Shipping
The available data for material flows to and from the Hawaiian Archipelago do not permit us to fully reconstruct the material interactions between the archipelago and the planet. One particular material flow, however, can be accessed, plotted, and studied: the flows of petrochemical fuels to the Hawaiian Archipelago from the world’s major oil-producing regions (Figure 8).
As in the example of automobile paint in the introduction, conceptualizing the global supply chain for petrochemical fuels as a holon could help understand the dependence of lower-level holons on the holarchic system. As we have noted, petrochemical fuels constitute the most significant direct material input to the State of Hawaii by mass (Figure 7). Because Hawaii has no proven crude oil reserves, the use of petrochemicals on the islands has been completely dependent on imports. The total quantity of imported liquid fuels remained around 50 million barrels per year between 1992 and 2009 (Figure 8). While almost half of the liquid fuel imported to Hawaii in 1992 was from the continental U.S. (i.e., Alaska), that ratio was reduced to 2% by 2009. The energy system at the heart of Hawaiian society has thus become significantly more reliant on material flows from foreign nations than was the case a half-century ago.
If the material flows for the State of Hawaii were studied as a single-level system without examining their connections to the global economy, these supply chain relationships and associated political and economic dynamics would be overlooked. Studying these relationships is vital to understanding how material flows may change in the future, such as could occur with supply chain disruptions due to economic sanctions. These insights are also important for understanding how decisions made at lower-level holons could shape material flows at higher-level holons. This is especially important now that the Hawaiian state legislature has adopted the goal of generating 100% of its electricity from renewable energy resources by 2045 [59,60].
4. Discussion
4.1. Data Challenges and Benefits of Performing an Industrial Ecology Holarchic Analysis
The results of analyses presented in this study illustrate how a holarchic investigation of material flows could benefit researchers in at least two ways. First, characterizing materials flows for multiple holarchic levels could provide frames of reference for understanding a holon’s relative contributions to material flows at higher- and lower-level holons. For example, we found that Hilo and Kona together consumed 61% of all fossil fuels consumed on the Big Island, and the Big Island’s fossil fuel consumption accounted for 6.5% of all fossil fuels consumed in the State of Hawaii. It follows that Hilo and Kona consumed approximately 4% of all fossil fuels consumed in the state. While appearing to be simple, these comparisons spanning more than two system levels will be difficult to make with conventional MFAs, which conceptualize material flows at a single system level. A holarchic MFA would allow for analysis similar to examining a contribution tree for environmental impacts in life cycle assessment [61]. Extending this analysis to higher-level holons like Hawaii’s global supply system for fossil fuels could also illuminate the dependence between holarchic levels and associated political and economic factors, as in the analysis of petroleum imports in Section 3.5 above. The results from holarchic MFAs could also help identify opportunities for recovery of material outputs from a holon by examining flows for higher-level holons and evaluating whether the systems have any displaceable inputs.
The second benefit of a holarchic analysis is that it may be useful to quantify material flows for systems that are difficult to characterize because of data scarcity or complicated system boundaries. Material data often involve some level of aggregation or assumptions. There is also the additional complexity introduced when dealing with system boundaries that span numerous administrative units. These issues may be especially important for systems that are understudied, such as rural economies. As an example of how the holarchy framework could address this issue, our Big Island results illustrated how the material flows for rural areas could be quantified by subtracting the flows for urban areas from those of the higher-level holon. The quantity for biomass extraction in the more rural areas of the Big Island can be derived from material accounts for Hilo, Kona, and the overall Big Island. Data had been derived for the next higher-level holon in our example, and material flows for urban areas were less complicated to quantify than other flows on the Big Island. These forms of analyses could, of course, also be applied to material flows in non-island systems.
Such multi-level analyses of material flows may be difficult to achieve in practice, however. While a holarchic analysis could help fill some data gaps, the gap being evaluated may be too wide to allow for any approximation. In the case of waste accounts in the U.S., most counties and states do not report material recovery and make comprehensive accounting of recycling almost impossible. More potential difficulties in conducting holarchic MFAs arise from the classification categories used to compile material accounts. Even if data are available, the same materials may be aggregated and reported under different material categories based on the classification system used by the entity responsible for accounting. Again, such an issue is highly relevant for waste accounts in the U.S. This may not be a problem for materials for which reporting is required and standardized by regulating institutions, however. One potential issue about material categories, not specific to the context of a holarchic analysis, is that the classification categories may simply be inadequate for certain analyses. In our compiled dataset for Hawaii, more than half of the exported biomass is categorized as “other” or “food products not elsewhere classified” under the Eurostat methodology. Such rough aggregations make granular comparisons of flows difficult. These challenges demonstrated the need for a better, standardized material accounting system.
4.2. The Archipelago Over Time (Temporal Holarchic Analysis)
Our analysis for holon level 5 illustrated how a holarchic analysis could help understand global material flow relationships with appropriate time-series data. In some cases, holons or holachic systems can be studied over a longer time period, enabled by historic data to start and then by continuing data acquisition and analysis. Figure 9 presents historical exports from the Hawaiian Islands (holon level 4) to the rest of the world compiled mainly from annual reports prepared by the firm Peirce and Brewer and the Honolulu Collector General’s Office (working paper by Chertow and Paul [26]). The material accounts reflected in the figure indicate the emergence and decline of several industries in the Hawaiian Kingdom.
The material flows for the Hawaiian Islands were mostly self-contained until foreign commercial ships began to arrive after Captain Cook’s “discovery” of the islands in 1778. In the following centuries, the islands’ socio-economic metabolism went through a series of dramatic transformations, shaped mostly by global economic factors. For example, the whaling trade served as the backbone of Hawaii’s economy during the mid-nineteenth century, but gradually declined as the whale populations diminished, the American Civil War reduced the whaling fleet, and whale oil faced competition from kerosene and the growing petroleum industry [62,63]. From the 1850s, investors turned to exporting agricultural products, especially sugar, an activity that was increasingly profitable owing to tariff arrangements and increasing demand from fast-growing populations in the American West [63,64].
Sugar exports were also captured in our MFA for the Hawaiian Islands. The export quantities, however, hardly resemble what was once the Hawaiian Islands’ largest industry, as agriculture became cost-ineffective and Hawaii transitioned to a service-based economy. More recently, the last sugar plantation in the State of Hawaii, located on Maui, ceased operations in December 2016. Maui’s land use, local economy, and material footprint may since have changed significantly. Analyzing material flows for a single system level certainly has its value. However, it is also important to think about the interconnections with higher- and lower-level holons, and ideally, over time, to understand fully which factors shape material flows at each holarchic level.
4.3. Comparing Holons at the Same Holarchic Level
While this study principally focuses on comparing relationships across higher- and lower-level holons, useful information is also available by comparing the metabolism of holons at the same holarchic level (as in the comparison of Hilo and Kona in Section 3.2 above) in the student work compiled and presented by Kanaoka [55] (Figure 10).
As with the case of fossil fuel consumption in a previous section, Oahu accounted for the majority of the direct material input for the State of Hawaii in 2007, followed by the Big Island, then Maui (Figure 10a). For most islands, non-metallic minerals represented the largest ratio of domestically consumed materials (Figure 10b), most of which were used in construction. The only exception was Oahu, which imported and refined crude oil for use on all of the islands. Of the non-metallic-mineral inputs to each of the islands, 84–96% by mass was extracted on-island rather than imported.
The comparison of islands also showed that material flows per capita for islands had a strong negative correlation with population density (Figure 10a). This trend was in line with findings from Eurostat’s MFA of 28 EU countries, which indicated that countries with higher population densities consumed fewer materials per capita [65]. For this reason, it was observed that the two disparately sized islands, the Big Island and Molokai, had similar material flows per capita that were significantly larger than the remaining islands. These results may illustrate the increasing effect of urbanization on resource efficiency from a materials perspective.
The quantities of waste generation and reuse per capita appeared to be comparable across the islands, but their compositions did not (Figure 10c). We found that the contrast in waste composition was mainly because of differences in the waste accounting methods employed by each county in Hawaii. There is no national standard for waste accounting in the U.S., so counties categorize the same materials under different waste categories, even within a single state. Similarly, some of the waste classification categories used by countries were not compatible with the Eurostat methodology. This issue illustrates some of the practical challenges for conducting a holarchic analysis.
4.4. Related Analyses in Industrial Ecology
The application of the holarchy framework to industrial ecology has been extremely limited, although there appears to be increased interest in recent years. One line of work develops minimization models for the environmental impacts of a product system-of-systems rather than merely individual product systems [66,67,68]. Another study proposed the holarchy framework for structuring supply chains equipped with smart technologies for improving their environmental sustainability [69]. Additionally, DeLaurentis and Ayyalasomayajula [70] explored how tools from industrial ecology could be integrated with system-of-systems models to better assess the environmental impacts of complex adaptive systems. Other applications of holarchy to material flows have mostly been qualitative, to conceptualize how socio-economic systems relate to the natural system (e.g., [71]) or how socio-economic systems include energy and material systems (e.g., [72]).
4.5. Opportunities for Further Research
The Hawaiian Islands holarchic MFA has provided a glimpse of the enhanced insight into social metabolism and material flows that the approach can potentially offer. To explore industrial ecology holarchy more generally, it will be necessary to recognize that two basic requirements exist for any material-related holon: a clearly defined spatial boundary and some way of monitoring or estimating flows across that boundary. New York City, much of which is connected by toll bridges, might form another example, with sections of Manhattan Island, the Borough of Manhattan, and New York City itself as candidate holons. More generally, some industrial ecology analyses have used multi-holonic data or data gaps to fill in missing information in systems that were not recognized as holarchic. A clear example is the zinc MFA of Meylan and Reck [73], which quantified holons at country, continent, and (though not explicitly computed) planetary levels. From that perspective, it is easy to imagine an extension of holarchic levels, this time downward, for example to Indonesia and its constituent islands, should appropriate data be available. Other examples doubtless can be devised by imaginative researchers, including those of non-island systems. It should be noted, however, that comparisons across holons without common governance structures, as seen in Hawaii, may be more difficult to achieve. Finally, as analyses of country-level imports and exports have provided much useful information on material flow and use, the extension of MFA into a variety of smaller-scale geographical entities is likely to offer new insight as well. We encourage industrial ecologists to explore and profit from applying the holarchic concept to a variety of multi-holonic material stocks and flows around the world.
Supplementary Materials
Supplementary materials can be accessed at https://www.mdpi.com/2071-1050/12/8/3104/s1.
Author Contributions
All authors contributed equally to this work. M.R.C. and T.E.G. contributed to research design and provided supervision. T.E.G. conceptualized the study. M.R.C. organized and managed the project. Data acquisition, analysis, and interpretation were made by K.S.K. and J.P. All authors have read and agreed to the published version of the manuscript.
Funding
This research was funded over several years by the US National Science Foundation (Grant No. 0948781), the Hawaii Community Foundation, the Japan Foundation, the field trip fund of the Yale School of Forestry and Environmental Studies, and the Center for Industrial Ecology.
Acknowledgments
We are grateful to the many students cited in the reference section whose research provided the basis for much of this study. Former PhD student Matthew Eckelman played a formative role on the Oahu study, and former research assistant Frederick Reppun collated a great deal of data. We also thank the Kohala Center, especially Matt Hamabata and Betsy Cole for our cultural education, and the Hawaii Community Foundation for the original Oahu funding. We appreciate the support of the Yale School of Forestry and Environmental Studies and offer a great “mahalo” to all of our Hawaiian Island hosts.
Conflicts of Interest
The authors declare no conflict of interest.
References
- Koestler, A. The Ghost in the Machine; Hutchinson: London, UK, 1976; ISBN 978-0-09-127130-5. [Google Scholar]
- Maier, M.W. Architecting principles for systems-of-systems. Syst. Eng. 1998, 1, 267–284. [Google Scholar] [CrossRef]
- Borangiu, T.; Gilbert, P.; Ivanescu, N.-A.; Rosu, A. An implementing framework for holonic manufacturing control with multiple robot-vision stations. Eng. Appl. Artif. Intell. 2009, 22, 505–521. [Google Scholar] [CrossRef]
- Holonic Manufacturing Systems. ANEMONA: A Mulit-Agent Methodology for Holonic Manufacturing Systems; Botti, V., Giret, A., Eds.; Springer Series in Advanced Manufacturing; Springer: London, UK, 2008; pp. 7–20. ISBN 978-1-84800-310-1. [Google Scholar]
- Colombo, A.W.; Schoop, R.; Neubert, R. An agent-based intelligent control platform for industrial holonic manufacturing systems. IEEE Trans. Ind. Electron. 2006, 53, 322–337. [Google Scholar] [CrossRef]
- Ounnar, F.; Pujo, P.; Mekaouche, L.; Giambiasi, N. Customer–supplier relationship management in an intelligent supply chain network. Prod. Plan. Control 2007, 18, 377–387. [Google Scholar] [CrossRef]
- Tuzkaya, U.R.; Önüt, S. A holonic approach based integration methodology for transportation and warehousing functions of the supply network. Comput. Ind. Eng. 2009, 56, 708–723. [Google Scholar] [CrossRef]
- Ulieru, M.; Cobzaru, M. Building holonic supply chain management systems: An e-logistics application for the telephone manufacturing industry. IEEE Trans. Ind. Inform. 2005, 1, 18–30. [Google Scholar] [CrossRef]
- Mahmoud, M.S.; Azher Hussain, S.; Abido, M.A. Modeling and control of microgrid: An overview. J. Frankl. Inst. 2014, 351, 2822–2859. [Google Scholar] [CrossRef]
- Garmestani, A.S.; Allen, C.R.; Cabezas, H. Panarchy, Adaptive Management and Governance: Policy Options for Building Resilience Resilience & Environmental Law Reform Symposium. Neb. Law Rev. 2008, 87, 1036–1054. [Google Scholar]
- Gotts, N. Resilience, Panarchy, and World-Systems Analysis. Ecol. Soc. 2007, 12, 1–24. [Google Scholar] [CrossRef] [Green Version]
- Kasai, S.; Li, N.; Fang, D. A system-of-systems approach to understanding urbanization—State of the art and prospect. Smart Sustain. Built Environ. Bingley 2015, 4, 154–171. [Google Scholar] [CrossRef]
- Kay, J.J. On complexity theory, exergy, and industrial ecology. In Construction Ecology: Nature as a Basis for Green Buildings; Kibert, C.J., Sendzimir, J., Guy, G.B., Eds.; Spon Press: New York, NY, USA, 2002; pp. 72–108. ISBN 0-415-26092-2. [Google Scholar]
- Spiegelman, J. Beyond the Food Web Connections to a Deeper Industrial Ecology. J. Ind. Ecol. 2003, 7, 17–23. [Google Scholar] [CrossRef]
- Deschenes, P.J.; Chertow, M. An island approach to industrial ecology: Towards sustainability in the island context. J. Environ. Plan. Manag. 2004, 47, 201–217. [Google Scholar] [CrossRef]
- Grant, K.T.; Estes, G.B. Darwin in Galápagos: Footsteps to a New World, 1st ed.; Princeton University Press: Princeton, NJ, USA, 2009; ISBN 978-0-691-14210-4. [Google Scholar]
- Singh, S.J.; Grünbühel, C.M.; Schandl, H.; Schulz, N. Social Metabolism and Labour in a Local Context: Changing Environmental Relations on Trinket Island. Popul. Environ. 2001, 23, 71–104. [Google Scholar] [CrossRef]
- Lenzen, M. Sustainable island businesses: A case study of Norfolk Island. J. Clean. Prod. 2008, 16, 2018–2035. [Google Scholar] [CrossRef]
- Krausmann, F.; Richter, R.; Eisenmenger, N. Resource Use in Small Island States. J. Ind. Ecol. 2014, 18, 294–305. [Google Scholar] [CrossRef] [PubMed]
- Nielsen, S.N.; Jørgensen, S.E. Sustainability analysis of a society based on exergy studies—A case study of the island of Samsø (Denmark). J. Clean. Prod. 2015, 96, 12–29. [Google Scholar] [CrossRef]
- Cecchin, A. Material flow analysis for a sustainable resource management in island ecosystems: A case study in Santa Cruz Island (Galapagos). J. Environ. Plan. Manag. 2017, 60, 1640–1659. [Google Scholar] [CrossRef]
- Allen, C.R.; Angeler, D.G.; Garmestani, A.S.; Gunderson, L.H.; Holling, C.S. Panarchy: Theory and Application. Ecosystems 2014, 17, 578–589. [Google Scholar] [CrossRef] [Green Version]
- Holling, C.S. From complex regions to complex worlds. Ecol. Soc. 2004, 9, 11. [Google Scholar] [CrossRef]
- Busch, J.; Sanz Cortes, R.; Srivastava, C. Molokai Material Flow Analysis; Yale School of Forestry & Environmental Studies: New Haven, CT, USA, 2012. [Google Scholar]
- Chertow, M.; Miyata, Y. Assessing collective firm behavior: Comparing industrial symbiosis with possible alternatives for individual companies in Oahu, HI. Bus. Strategy Environ. 2011, 20, 266–280. [Google Scholar] [CrossRef]
- Chertow, M.; Paul, A. Material Succession in Hawai’i: Using Industrial Ecology to Illuminate Environmental History. Working Paper. 2013. [Google Scholar]
- Chertow, M.R.; Seto, K. Materials flows and land use change in two urban areas of Hawai’i Island. In Proceedings of the Ecological Society of America Annual Convention, Austin, TX, USA, 7–12 August 2011. [Google Scholar]
- Davies, M.; Gagne, C.; Hausfather, Z.; Lippert, D. Analysis and Recommendations for the Hawai’i County Energy Sustainability Plan; Yale School of Forestry & Environmental Studies: New Haven, CT, USA, 2007; Available online: https://kohalacenter.org/archive/pdf/analysis_and_recommendations.pdf (accessed on 31 August 2017).
- De Sa, R.; Emmerman, D.; Veysey, D. Closing the Loop on Molokai: Livestock Production on a Rural Hawaiian Island; Yale School of Forestry & Environmental Studies: New Haven, CT, USA, 2013; Available online: http://kohalacenter.org/archive/pdf/Research_YaleMolokaiLivestockReport2013.pdf (accessed on 31 August 2017).
- De Stercke, S.; Seligman, J.; Teng, J.; Zhao, Y.; Cooke, C. Energy Efficiency in Low-Income Communities on Hawai’i Island; Yale School of Forestry & Environmental Studies: New Haven, CT, USA, 2011; Available online: http://kohalacenter.org/archive/pdf/EnergyEfficiencyinLowincomeCommunitiesonHawaiiIslandYaleCenterforIndustrialEcologyV3.pdf (accessed on 31 August 2017).
- Diao, Z.; Dorji, S.; Kavlak, G.; Zingale, A. Material Flow Analysis for the Island of Kaua’i; Yale School of Forestry & Environmental Studies: New Haven, CT, USA, 2011. [Google Scholar]
- Douglas, F.; Franceschini, L.; Mak, T.; Prasodjo, R.; Xhurxhi, S. Tire Recycling in Hawai’i; Yale School of Forestry & Environmental Studies: New Haven, CT, USA, 2013. [Google Scholar]
- Eckelman, M.; Chertow, M. Linking Waste and Material Flows on the Island of Oahu, Hawai’i: The Search for Sustainable Solutions; Yale F&ES Publication Series; Yale School of Forestry & Environmental Studies: New Haven, CT, USA, 2009; Available online: https://elischolar.library.yale.edu/fes-pubs/40/ (accessed on 16 December 2019).
- Eckelman, M.J.; Chertow, M.R. Using Material Flow Analysis to Illuminate Long-Term Waste Management Solutions in Oahu, Hawaii. J. Ind. Ecol. 2009, 13, 758–774. [Google Scholar] [CrossRef]
- Eckelman, M.J.; Chertow, M.R. Life cycle energy and environmental benefits of a US industrial symbiosis. Int. J. Life Cycle Assess. 2013, 18, 1524–1532. [Google Scholar] [CrossRef]
- Espinoza, F.; Heinemann, A.; Sima, L. Material Flow Analysis for the Island of Oahu: Military Sector; Yale School of Forestry & Environmental Studies: New Haven, CT, USA, 2008. [Google Scholar]
- Famely, J.; Gladek, E.; Ziemba, C. Materials Flows on The Island of Oahu: Imports, Exports and Resource Extraction; Yale School of Forestry & Environmental Studies: New Haven, CT, USA, 2008. [Google Scholar]
- Fugate, E. Life Cycle Energy Inventory of Hawaii Island Water Systems; Yale School of Forestry & Environmental Studies: New Haven, CT, USA, 2008. [Google Scholar]
- Fugate, E.; Iversen, J. Water, Food, and Energy on the Big Island of Hawai’i; Yale School of Forestry & Environmental Studies: New Haven, CT, USA, 2008. [Google Scholar]
- Houseknecht, M.; Kim, C.; Whitman, A. Material Flows on the Island of Hawai’i; Yale School of Forestry & Environmental Studies: New Haven, CT, USA, 2006; Available online: http://kohalacenter.org/archive/pdf/hi_mfa.pdf (accessed on 31 August 2017).
- Jenkins, M.; Pierson, N.; Pohnan, E.; Ramirez, J.S.; Wang, S. Material Flow Analysis for the Island of Maui; Yale School of Forestry & Environmental Studies: New Haven, CT, USA, 2012; Available online: http://sustainablemaui.org/wp-content/uploads/2012/05/Material-Flow-Analysis-for-the-Island-of-Maui-final.pdf (accessed on 31 August 2017).
- Johnson, J.; Chertow, M. Climate stabilization wedges in action: A systems approach to energy sustainability for Hawaii Island. Environ. Sci. Technol. 2009, 43, 2234–2240. [Google Scholar] [CrossRef] [PubMed] [Green Version]
- Johnson, J.; Leistra, D.; Opton-Himmel, J.; Smith, M. Hawaii County Baseline Energy Analysis; Yale School of Forestry & Environmental Studies: New Haven, CT, USA, 2007; Available online: http://kohalacenter.org/archive/pdf/hawaii_county_baseline_energ.pdf (accessed on 31 August 2017).
- Lan, A.; Leighton, L.; Wegmueller, S.; Yost, J. Talking Story in Ka’u: Comparative Examination of Land Uses for Diversified Agriculture and Biofuel Feedstock Production; Yale School of Forestry & Environmental Studies: New Haven, CT, USA, 2013. [Google Scholar]
- Mosher, M.; Pinheiro, T. Material Flow Analysis of Lana’i, Hawaii; Yale School of Forestry & Environmental Studies: New Haven, CT, USA, 2012. [Google Scholar]
- Oden, M.; Park, J.; Zaidel, K. Management of Opala on the Island of Oahu; Yale School of Forestry & Environmental Studies: New Haven, CT, USA, 2008. [Google Scholar]
- Parthasarathy, T.; Gilbert, H.; Arabshahi, N. Material Flows on the Island of Oahu: Private Sector; Yale School of Forestry & Environmental Studies: New Haven, CT, USA, 2008. [Google Scholar]
- European Commission. Economy-Wide Material Flow Accounts Handbook; European Commission: Luxembourg, 2018; ISBN 978-92-79-88337-8. [Google Scholar]
- U.S. Army Corps of Engineers. Manuscript Cargo and Trips Data Files, Statistics on Foreign and Domestic Waterborne Commerce Move on the United States Waters. Available online: https://usace.contentdm.oclc.org/digital/collection/p16021coll2/id/1796 (accessed on 1 December 2019).
- U.S. Department of Agriculture National Agricultural Statistics Service. On-line Reports Archive. Available online: https://www.nass.usda.gov/Statistics_by_State/Hawaii/Publications/Archive/index.php (accessed on 3 February 2019).
- U.S. Geological Survey National Minerals Information Center. The Mineral Industry of Hawaii. Available online: https://www.usgs.gov/centers/nmic/mineral-industry-hawaii (accessed on 3 February 2019).
- Hawaii Department of Business, Economic Development and Tourism. State of Hawaii Data Book. Available online: https://dbedt.hawaii.gov/economic/databook/ (accessed on 10 September 2017).
- U.S. Census Bureau. Economic Census. Available online: https://www.census.gov/prod/www/economic_census.html (accessed on 3 February 2019).
- U.S. Department of Labor Mine Safety and Health Administration. Mine Data Retrieval System. Available online: https://www.msha.gov/mine-data-retrieval-system (accessed on 3 February 2019).
- Kanaoka, K. Comparative Material Flow Analysis for the Hawaiian Islands; Duke University: Durham, NC, USA, 2018. [Google Scholar]
- Roos, J.; Borum, N.; Bak, L. Marine Cargo and Waterborne Commerce in Hawaii’s Economy: Trends and Patterns in Hawaii Marine Cargo 2001–2016; State of Hawaii Department of Business, Economic Development and Tourism: Honolulu, HI, USA, 2019. [Google Scholar]
- Finizza, A.J.; Gieskes, T.E.; Hackett, D.J.; Haggquist, G.; Monfiletto, J. Study of Fuel Prices and Legislative Initiatives for the State of Hawaii; Stillwater Associates: Irvine, CA, USA, 2003. [Google Scholar]
- Cooke, C.P.; Parsons, D.C. County of Hawai’i Energy Sustainability Program: Five Year Roadmap; Kohala Center: Kamuela, HI, USA, 2012. [Google Scholar]
- Fialka, J. As Hawaii Aims for 100% Renewable Energy, Other States Watching Closely. Available online: https://www.scientificamerican.com/article/as-hawaii-aims-for-100-renewable-energy-other-states-watching-closely/ (accessed on 1 December 2019).
- Daigneau, E. From Worst to First: Can Hawaii Eliminate Fossil Fuels? Available online: https://www.governing.com/topics/transportation-infrastructure/gov-hawaii-fossil-fuels-renewable-energy.html (accessed on 1 December 2019).
- Matthews, H.S.; Hendrickson, C.T.; Matthews, D. Life Cycle Assessment: Quantitative Approaches for Decisions that Matter. Available online: https://www.lcatextbook.com/ (accessed on 18 November 2019).
- Abdelal, R.; Kirshner, J. Strategy, economic relations, and the definition of national interests. Secur. Stud. 1999, 9, 119–156. [Google Scholar] [CrossRef]
- Kuykendall, R.S. The Hawaiian Kingdom: Twenty Critical Years, 1854–1874; University of Hawaii Press: Honolulu, HI, USA, 1953; Volume 2, pp. 137–141. ISBN 978-0-87022-432-4. [Google Scholar]
- MacLennan, C.A. Hawai’i Turns to Sugar: The Rise of the Plantation Centers, 1860–1880. Hawaii. J. His. 1997, 31, 97–125. [Google Scholar]
- Eurostat. Material Flow Accounts and Resource Productivity. Available online: http://ec.europa.eu/eurostat/statistics-explained/index.php/Material_flow_accounts_and_resource_productivity (accessed on 28 April 2018).
- Kawakami, K.; Fukushige, S.; Kobayashi, H. A Functional Approach to Life Cycle Simulation for System of Systems. Procedia CIRP 2017, 61, 110–115. [Google Scholar] [CrossRef]
- Kobayashi, H.; Matsumoto, T.; Fukushige, S. A simulation methodology for a system of product life cycle systems. Adv. Eng. Inform. 2018, 36, 101–111. [Google Scholar] [CrossRef]
- Mennenga, M.; Cerdas, F.; Thiede, S.; Herrmann, C. Exploring the Opportunities of System of Systems Engineering to Complement Sustainable Manufacturing and Life Cycle Engineering. Procedia CIRP 2019, 80, 637–642. [Google Scholar] [CrossRef]
- Martín-Gómez, A.; Aguayo-González, F.; Luque, A. A holonic framework for managing the sustainable supply chain in emerging economies with smart connected metabolism. Resour. Conserv. Recycl. 2019, 141, 219–232. [Google Scholar] [CrossRef]
- DeLaurentis, D.A.; Ayyalasomayajula, S. Exploring the Synergy Between Industrial Ecology and System of Systems to Understand Complexity. J. Ind. Ecol. 2009, 13, 247–263. [Google Scholar] [CrossRef]
- Ramaswami, A.; Weible, C.; Main, D.; Heikkila, T.; Siddiki, S.; Duvall, A.; Pattison, A.; Bernard, M. A Social-Ecological-Infrastructural Systems Framework for Interdisciplinary Study of Sustainable City Systems: An Integrative Curriculum Across Seven Major Disciplines. J. Ind. Ecol. 2012, 16, 801–813. [Google Scholar] [CrossRef] [Green Version]
- Gardner, G. The City: A System of Systems. In Can a City Be Sustainable? Island Press: Washington, DC, USA, 2016; pp. 27–44. ISBN 978-1-61091-756-8. [Google Scholar]
- Meylan, G.; Reck, B.K. The anthropogenic cycle of zinc: Status quo and perspectives. Resour. Conserv. Recycl. 2017, 123, 1–10. [Google Scholar] [CrossRef]
Figure 1.
Conceptual diagram of a holarchic system for integrated material flow analyses. The entire Earth system and each circle denote individual holons, and their borders represent system boundaries for individual material flow analyses. Holarchic levels are indicated by shades of blue. Black arrows represent flows of materials between holons in the same holarchic level, and blue arrows represent flows between holarchic levels.

Figure 2.
The Hawaiian Archipelago, picturing the six islands under study and several principal cities.
Figure 2.
The Hawaiian Archipelago, picturing the six islands under study and several principal cities.

Figure 3.
The Hawaiian Islands holarchic system. Arrows represent material flows between holarchic levels. Lower-level holons are nested within higher-level holons. Flows between higher-level holons are larger than those between lower-level holons. In addition, flows from higher to lower holons are depicted as larger than those from lower to higher holons to indicate that material stocks in Hawaii are gradually increasing over time as island infrastructure is further developed.

Figure 4.
Material flow analysis for a macadamia nut processing plant on the Big Island in 2005. The units are Gg a−1. Based on Houseknecht et al. [40].
Figure 4.
Material flow analysis for a macadamia nut processing plant on the Big Island in 2005. The units are Gg a−1. Based on Houseknecht et al. [40].

Figure 5.
Material flows (Gg a−1) for the Big Island communities of Hilo (left) and Kona (right) in 2009, excluding water. Data from Chertow and Seto [27].
Figure 5.
Material flows (Gg a−1) for the Big Island communities of Hilo (left) and Kona (right) in 2009, excluding water. Data from Chertow and Seto [27].

Figure 6.
Material flow analysis for the Big Island (Gg a−1) for year 2009, excluding water. Data from Chertow and Seto [27].
Figure 6.
Material flow analysis for the Big Island (Gg a−1) for year 2009, excluding water. Data from Chertow and Seto [27].

Figure 7.
Material flow analysis for the State of Hawaii (Tg a−1), 2007. Based on Famely et al. [37] and Kanaoka [55].

Figure 8.
The flows of petrochemical fuels to the Hawaiian Archipelago from the world’s major oil-producing regions. Adapted from Cooke and Parsons [58].
Figure 8.
The flows of petrochemical fuels to the Hawaiian Archipelago from the world’s major oil-producing regions. Adapted from Cooke and Parsons [58].

Figure 9.
Exports from the Hawaiian Archipelago, 1805–1900. Data from working paper by Chertow and Paul [26].
Figure 9.
Exports from the Hawaiian Archipelago, 1805–1900. Data from working paper by Chertow and Paul [26].

Figure 10.
(a) Direct material input and downstream material flows for five Hawaiian Islands in 2007. Left: total flows for islands, right: flows per capita de facto. (b) Direct material input and domestic material consumption by material type for five Hawaiian Islands in 2007. (c) Waste generation and reuse per capita de facto for five Hawaiian islands for various years: Oahu (2005), Maui (2006), Kauai (2005), the Island of Hawaii (2007), and Molokai (2006). Results for Lanai are not shown due to data gaps. Abbreviations: DMI: Direct material input; DMC: Domestic material consumption; EXP: Exports; Gen.: Generation. Adapted from Kanaoka [55].

© 2020 by the authors. Licensee MDPI, Basel, Switzerland. This article is an open access article distributed under the terms and conditions of the Creative Commons Attribution (CC BY) license (http://creativecommons.org/licenses/by/4.0/).
Share and Cite
MDPI and ACS Style
Chertow, M.R.; Graedel, T.E.; Kanaoka, K.S.; Park, J. The Hawaiian Islands: Conceptualizing an Industrial Ecology Holarchic System. Sustainability 2020, 12, 3104. https://doi.org/10.3390/su12083104
AMA Style
Chertow MR, Graedel TE, Kanaoka KS, Park J. The Hawaiian Islands: Conceptualizing an Industrial Ecology Holarchic System. Sustainability. 2020; 12(8):3104. https://doi.org/10.3390/su12083104
Chicago/Turabian StyleChertow, Marian R., Thomas E. Graedel, Koichi S. Kanaoka, and Jooyoung Park. 2020. "The Hawaiian Islands: Conceptualizing an Industrial Ecology Holarchic System" Sustainability 12, no. 8: 3104. https://doi.org/10.3390/su12083104
Note that from the first issue of 2016, this journal uses article numbers instead of page numbers. See further details here.