Effect of Grazing System on Grassland Plant Species Richness and Vegetation Characteristics: Comparing Horse and Cattle Grazing


1
Department of Crop Sciences, University of Göttingen, 37075 Göttingen, Germany
2
Centre of Biodiversity and Sustainable Land Use, University of Göttingen, 37077 Göttingen, Germany
*
Author to whom correspondence should be addressed.
Sustainability 2020, 12(8), 3300; https://doi.org/10.3390/su12083300
Submission received: 30 March 2020
/
Revised: 3 April 2020
/
Accepted: 10 April 2020
/
Published: 18 April 2020
(This article belongs to the Special Issue Sustainable Grazing Systems)
Abstract
:Horses are of increasing relevance in agriculturally managed grasslands across Europe. There is concern to what extent grazing with horses is a sustainable grassland management practice. The effect of longer-term horse grazing on the vegetation characteristics of grasslands has received little attention, especially in comparison to grazing cattle. Our study analyses the relative importance of grazing system (grazer species and regime) and grassland management for vegetation characteristics in grasslands as indicator for sustainable management. We monitored grassland vegetation in western central Germany and compared paddocks grazed by horses under two different regimes, continuous (HC) vs. rotational (HR), to paddocks grazed by cattle (C) under similar trophic site conditions. We observed more plant species and more High Nature Value indicator species on HC compared to C. The vegetation of C was more grazing tolerant and had higher forage value than HC. Regardless of the grazing regime, the competitive component was lower, the stress-tolerant component higher and the floristic contrast between patch-types stronger on HC and HR paddocks compared to C. Species richness was strongly influenced by the extent of the floristic contrast. Our results emphasize the potential of horse grazing for biodiversity in agriculturally managed grasslands.
1. Introduction
Grazing livestock is seen as a promising option for maintaining and promoting grassland biodiversity [1,2,3,4]. Due to the preferences of grazing animals in forage selection, their disturbance of the sward and patchy nutrient return [3,5], they increase and maintain the spatial heterogeneity of the sward structure and vegetation composition [1,6,7]. Adler et al. [5] termed this effect “patch grazing”. This heterogeneity means that plants of different strategy types and demands can coexist in close proximity, increasing plant species turnover within the paddock, i.e., β-diversity [3,7,8,9]. Differences in grazing regimes and thus vegetation between paddocks can also contribute to the landscape-scale biodiversity [10]. Hautier et al. [11] recently emphasized the importance of diverse grasslands with both species-rich local communities (α-diversity) and large compositional differences between sites (β-diversity) for the multifunctionality of ecosystems on a global scale.
Different grazer species lead to different effects on grassland vegetation due to their specific nutritional demands, jaw anatomy and grazing behaviour [2]. In Europe, cattle are the most common grazing animals in agriculturally managed grasslands. Several studies have analysed their grazing effects and management strategies for biodiversity benefits [1,2,3,6,12]. For several decades, horses have played an increasing role in grasslands and across Europe, at least six million hectares of grasslands are estimated to be managed for horses [13]. Horse keeping and grazing is widespread nowadays and has a considerable effect on the shape of agricultural landscapes [14], particularly in peri-urban regions [15,16,17]. Horse keepers often rely on grassland that had been released from intensive dairy production [14,15,18]. Compared to grasslands managed with cattle or sheep, those grazed with horses have received little scientific attention in Europe with regard to a targeted grassland utilization.
Several characteristics make horse husbandry suitable for the management of extensive grasslands. The usual basic nutrition of horses is grass. As hindgut fermenters, horses are able to utilise herbage from nutrient-poor grasslands, but herbage from intensively managed ryegrass-dominated swards pose a health risk [19,20,21]. This is why horse keepers prefer to manage nutrient-poor grasslands to protect their horses from metabolic disorders [14].
There is concern to what extent grazing with horses is a sustainable grassland management practice. Their two pairs of incisors enable them to graze more selectively and closer to the ground [19,22,23]. As selective grass feeders [24] horses increase the proportion of forbs in the swards [25,26]. Since horses actively avoid grazing where they defecate, they create distinct ungrazed tall grass latrine areas where excreta and nutrients accumulate. Repeatedly grazed short patches, on the other hand, experience nutrient export, which result in a nutrient transfer and a corresponding vegetation shift between patch types [22,26,27]. Especially phosphorous is accumulated via horse dung in latrine areas, which is known to promote competitive species and reduce species richness [28,29]. Therefore, the patch grazing effect of horses is expected to be stronger than that of cattle [8,22,25,30]. In addition, the movement behaviour of the horses can put a strain on the sward, especially when the grazing area or grazing duration are restricted. Running and trampling lead to areas with bare and compressed soil [19,24].
In temperate grasslands, the grazing regime, i.e., continuous or rotational grazing, can modify the grazer’s effect on the pasture vegetation [3,12,19,25]. Under continuous grazing, grazers have unrestricted access to a paddock during prolonged periods of the grazing season, which promotes the development of distinct short and tall grass patches [24]. In contrast, under rotational grazing the access of the grazing area is limited in time and space which leads to a more uniform grazing [19,21,31].
Apart from the grazing regime, the grazing intensity affects the pasture vegetation and its patch structure [6,8,32,33,34]. Generally, grazing effects on the vegetation increase with stocking density. Differences between livestock species are also becoming clearer [26,33]. While cattle tend to defoliate the grass sward more evenly with increasing stocking density, thereby creating a homogenous sward of grazing tolerant plants [6,7,35], horses continue to graze heterogeneously, avoid foraging on latrine areas and defoliate strongly in other areas [30].
Only few studies have been carried out in the last century that looked more closely at the grazing preferences of horses [22,30]. More recently, research has focused on free-ranging horses grazing in nature reserves to study the effects of horse grazing on grassland vegetation and sward structure [8,26,36,37,38,39], some demonstrating benefits for nature conservation [40,41]. However, these results are not directly transferrable to agricultural grassland with domesticated horses. Thus, there is currently a considerable lack of scientific knowledge on the effects of grazing by domesticated horses on vegetation in a normal agricultural context. This has consequences for the practice of horse grazing, which is often inappropriate and causes land use conflicts in peri-urban and rural landscapes [17].
Given this background, our study aimed to investigate the effect of horse compared to cattle grazing on vegetation characteristics in agricultural grassland. In addition, we investigated the effect of the grazing regime (continuous vs. rotational grazing) by horses. Target variables were the vascular plant species richness, the High-Nature-Value (HNV) plant indicator species richness, the proportion of Grime’s C-S-R-strategy types [42], the grassland utilisation indicator values [43] and the β-diversity between patch types.
We performed an observational on-farm study in the Rhenish Uplands in Germany. The methodology of the observational study has become well established in recent years to assess the medium to long-term effects of different agricultural management methods. Examples of this are the examination of the effectiveness of agri-environmental measures [44], the effectiveness of weed control in wheat cultivation [45] or the grazing effects of different cattle breeds [46]. The performance of field experiments would require many years of research. At the same time, the identification of interactions with the site conditions would require complex, multi-site field experiments. A stratified design allowed us to compare paddocks grazed by cattle or horses and to distinguish between effects of the grazing system (grazer species and grazing regime) from those of site conditions and management. More precisely we addressed the following hypotheses:
H1.
Grazing system affects species richness, HNV-species richness and vegetation characteristics (proportion of C-S-R-strategy components, utilisation indicator values);
H2.
There is a relationship between vegetation characteristics (proportion of C-S-R-strategy types, utilisation indicator values), which are affected by grazing system, and observed species richness;
H3.
Grazing system affects floristic contrast between patch types, which mediates species richness at paddock scale;
H4.
Beyond grazing system, grassland management (stocking density and fertilisation) affects species richness.
2. Materials and Methods
2.1. Study Region
The research area is located in the Rhenish uplands in North Rhine-Westphalia, Germany (50.87′ N, 7.48′ E, Figure 1) and covers a total area of approximately 400 km² (Figure 1).
The study region has a naturally low agricultural production potential. A humid climate and shallow, loamy, acidic cambisols led to grasslands being the predominant land-use system (65% to 90% of the utilised agricultural area) after forests [48]. Grasslands in the study region are mainly used for dairy production, but horses play a considerable role too. According to the local livestock numbers (Animal Health Fund, oral communication), at least 10% of grasslands in the study region are managed with horses. The grassland vegetation of the study paddocks belongs to the Molinio-Arrhenatheretea class.
2.2. Sampling Design
A total of 156 paddocks were included in the study. The paddocks were arranged in 26 triplets that covered a gradient of different site conditions and land-use intensities (Figure 1). Within each triplet six paddocks were studied, representing three grazing systems. Four paddocks were grazed with horses, two in a continuous (HC, n = 52) and two in a rotational grazing regime (HR, n = 52). The other two paddocks were grazed by cattle (C, n = 52). As we were particularly interested in the grazing effect of horses, cattle-grazed paddocks serve as a “control”, as they represent the predominant regional grazing management. The study design did not distinguish the grazing regime in cattle paddocks, which included rotational and continuous stocking. The paddocks within a triplet were located at a linear distance of no more than 2 km and were selected as having similar site factors (i.e., soil type, slope, altitude). On each paddock, three circular subplots of 12.6 m² (radius of 2 m) were established for the assessment of vascular plant species richness, composition and soil properties (Figure 1 c). Subplots were selected according to a stratified random approach. One subplot each was placed on a short, on a tall or an intermediate vegetation height patch (patch type). For this, we measured the compressed sward height within each paddock using a rising plate meter (30 cm diameter, 200 g [49]) at 50 randomly chosen points. Short patches were defined as heavily grazed areas with a mean sward height below the paddock’s average. In contrast, tall patches were mainly avoided areas with a mean sward height above the paddock’s average and intermediate patches lay in between. Subplots for the vegetation analysis were established at the end of the grazing season of the preceding year when the heterogeneity of the sward height was most pronounced. Within the patch types, subplots were placed randomly within areas of similar local conditions in altitude and inclination and within a minimum distance of 5 meters from the field boundary to avoid boundary effects. Additionally, a diagonal transects (2 m × 50 m) was established on each paddock. The geographic position of each subplot was recorded (Figure 1 c).
2.3. Site Conditions
In general, the study sites were chosen so that the paddocks within each triplet offer the most uniform topographic site conditions possible. Paddock borders were mapped on an orthophotograph [47] and paddock size (ha) calculated using Quantum GIS [50]. A digital elevation model (DEM 50, [51]) was used to calculate altitude (meters above sea level, m.a.s.l.) and slope (%) per paddock as topography-related environmental variables.
Soil was sampled on each subplot in autumn at the end of the grazing season in order to determine the pH and the extractable soil nutrients (available plant nutrients P2O5, K2O in mg per 100 g dry matter (DM), calcium-acetate-lactate analysis). On each of the three subplots 500 ml of soil of the top layer (0–10 cm) was taken. In the statistical analysis we used the average soil nutrient concentration of three subplots (Table 1).
2.4. Grassland Management
As part of the study, data on current grassland management were collected from personal interviews with farmers using a standardised questionnaire. Only paddocks with a consistent management regime over at least the last five years were included. Most paddocks had a much longer history of grazing by the same grazer species. For cattle-grazed paddocks, the average grazing history was 53 years (SD 22 years, n = 46), for horse-grazed paddocks 23 years (SD 11.7 years, n = 52) for HC and 22 years (SD 11.8 years, n = 52) for HR. Farmers were asked whether their grasslands had been ploughed and reseeded. For 45 paddocks such information was not available, 78 paddocks had not been disturbed for at least 60 years (C: n = 22; HC: n = 30; HR: n = 26). On average, the age of the grass swards was 52 years (SD 18.4, n=111) with little variation among the grazing systems (C: 48.6 years, SD 18.7, n = 34; HC: 55.4 years, SD 15.5, n = 40; HR: 50.3 years, SD 20.6, n = 37).
For the present analysis, management data that covered a period of the preceding five years were collected. The variables were: average number of livestock per paddock, mean weight of livestock, mean grazing duration per day, mean number of rotations, and mean grazing duration per year. Live weights were converted to standard livestock units (500 kg live weight) per hectare and year to calculate stocking rate (ha−1 year−1). Stocking rate was used as a proxy for grazing intensity. Some paddocks were not only grazed but also mown for hay or haylage (C: n = 16; HC: n = 12, HR: n = 7). Mowing was included as binary variable in the analysis. The amount and type of fertilizer that was applied on the grasslands was recorded for mineral N, farmyard manure and slurry separately. The total amount of nitrogen supply (N kg ha−1 year−1) was deduced from this information (see Table 1).
2.5. Species Data
Vegetation surveys were carried out in 2013 and 2014 with 13 triplets per year. In order to obtain a full record of species, every paddock was visited twice, in spring before grazing started and in summer during the grazing season. In both surveys, the total number of vascular plant species in the three subplots per paddock were identified to species level and their individual share of biomass was visually estimated. Additionally, all species within the transects were identified. In order to analyse species diversity at the paddock scale, species richness (SR) refers to the cumulative number of plant species that were observed in 138 m² per paddock (the three subplots and the transect) in the spring and summer surveys. In addition to plant species richness, we assessed the number of High-Nature-Value (HNV) plant indicator species according to the German Federal Agency for Nature Conservation [52]. We applied the regional list of HNV indicator species for the mid-west/north-west of Germany [53]. The number of single HNV indicator species per paddock (HNV-SR) was used as a proxy for the nature conservation value of the respective grassland. For this, we used the classification system of the HNV farmland monitoring [52]: Paddocks with 4 to 5 indicator species were classified as HNV-III grassland of “moderately high-nature-value”, paddocks with 6 to 7 indicator species as HNV-II grassland of “very high-nature-value” and paddocks with 8 and more indicator species as HNV-I with “exceptionally high-nature-value”.
As described by Hunt et al. [54], plant species’ strategy types were converted to a numeric C-S-R signature (C – competitive strategy, S – stress-tolerant strategy, R – ruderal strategy). Based on the estimated proportion of biomass per species, we calculated the C-S-R signature for each of the three subplots per paddock. We then calculated an average value for each strategy type per paddock. In the same way, we assessed utilization indicator values [43], i.e., grazing tolerance, trampling tolerance and forage value.
As a measure of floristic contrast between short and tall patches within paddocks we calculated the Sørensen index [55]: Sørensen =2 c / (a + b + 2 c) for short and tall patch types, with “a” representing the number of species exclusively present in short patches, “b” exclusively in tall patches and “c” present in both.
2.6. Data Analysis
We performed linear mixed-effects models in combination with model averaging to disentangle the important drivers of vegetation for horse- and cattle-grazed pastures.
In a first step, mixed effects models with a Gaussian distribution were set up for each species response variable. Vegetation variables, i.e., SR, HNV-SR, Grime’s strategy types, utilization indicator values and Sørensen index were modelled as a function of grazing system, stocking rate, nitrogen fertilisation, mowing, trophic site conditions and soil-chemical variables. All global models were checked for multicollinearity between explanatory variables (fixed effects) using variance inflation factors (VIF). Since VIFs were below 3 in most cases [56,57] and well below 10 in all cases, all explanatory variables were considered for the statistical analyses. All global models were checked visually for normal distribution and homoscedasticity of residuals. In case of heterogeneity of variance, weights structures were applied following the protocol of Zuur et al. [57]. All explanatory variables were centralised to zero means and scaled to 0.5 standard deviations [58] before analysis, which allows a direct comparison of effects of all fixed factors. Model averaging was performed on each global model to assess parameter and error estimates that derive from weighted averages of these values across multiple models [59]. For each global model, second-order Akaike information criterion AICc [60] was calculated on every possible combination of variables. These were ranked using the ‘dredge’ function of the package ‘MuMIn’. Weighted parameter estimates were averaged over the set of models whose cumulative Akaike weight was ≤0.95, which is the 95% confidence set to the best approximating model [59,60]. Relative importance was estimated as the sum of Akaike weights over all models including the explanatory variable in the 95% confidence set. Significance of predictors was calculated from the supported models using z-statistics. Based on the model averaging, a minimum adequate model (MaM) was identified and the variable grazing system was tested for differences among the grazing systems via post hoc pairwise Tukey test.
In a second step, further linear mixed effects models were set up to analyse the relationship between vegetation characteristics (propotion of Grime’s strategy types, utilisation indicator values and floristic contrast) and SR. For this, SR was modelled as a function of grazing system and each vegetation variable, as well as their interaction. In a third step, linear mixed effects models were set up to analyse effects of grazing system and the interaction with grazing intensity as well as N-fertilisation on SR and HNV-SR.
In all models, triplet was included as random term, to account for the nesting structure of the study design, which generates a more powerful analysis by ensuring that variance due to block is taken into account and not just included in the error term.
3. Results
On 156 paddocks, we found 179 plant species in total. The average species number (SR) per paddock (referring to the sampled area of 138 m², each) was 57 (min 24, max 129). Forty -three single species were classified as HNV-indicator species. 80% of HC, 75% of HR and 55% of C paddocks could be allocated to HNV grasslands with four or more HNV indicator species. Of these, 55% of HC and 26% of C were assigned as HNV-I grasslands of exceptionally high-nature-value with more than eight HNV indicator species.
3.1. Effect of Grazing System on Species Richness and Vegetation Characteristics (H1)
According to the model averaging results, a high relative importance of the variable grazing system was obtained for the majority of the target variables. These effects were significant in the full models for SR, HNV-SR, forage indicator value and the floristic contrast between patch types (Table 2). Post-hoc testing of the minimum adequate models (MaM) confirmed significant differences among grazing systems for each vegetation variable, except for the component of ruderal strategy type, and in tendency to trampling tolerance (Table 3).
SR differed significantly between C and HC: In terms of the total number of species, on average eleven more species and three more HNV species were found on HC than on C (Figure 2). However, no significant differences in SR or HNV-SR were present between HR and C.
Considering Grime’s strategy types, a higher proportion of the competitive and stress-tolerant strategy component occurred on C than on HC and HR, but no difference was observed for the proportion of ruderal strategy component.
Cattle-grazed paddocks (C) revealed a higher forage value than HC as well as a slightly higher grazing tolerance than HR. The forage value indicator did not differ significantly between HR and C. In regard to grazing tolerance, HC was not significantly different from C or HR (Table 3).
3.2. Relationship between Vegetation Characteristics and Species Richness (H2)
SR was modelled as a function of each vegetation characteristic or grazing system and their interaction. In this approach, SR was strongly correlated with most of the vegetation variables (Figure 3). A higher proportion of the competitive component was associated with an overall decrease in SR (p < 0.001, lme) and similar, but less pronounced, a higher proportion of the ruderal component was linked with a decreasing SR (p = 0.02, lme). In contrast, species richness increased (p < 0.001, lme) with the proportion of the stress-tolerant component (Figure 3). SR was negatively correlated with all utilisation indicator values (p < 0.001 in all cases, lme), with slightly lower values for continuously grazed horse paddocks. No significant interactions of strategy type and grazing system or utilization value and grazing system were found.
3.3. Effect of Grazing System on Floristic Contrast (H3)
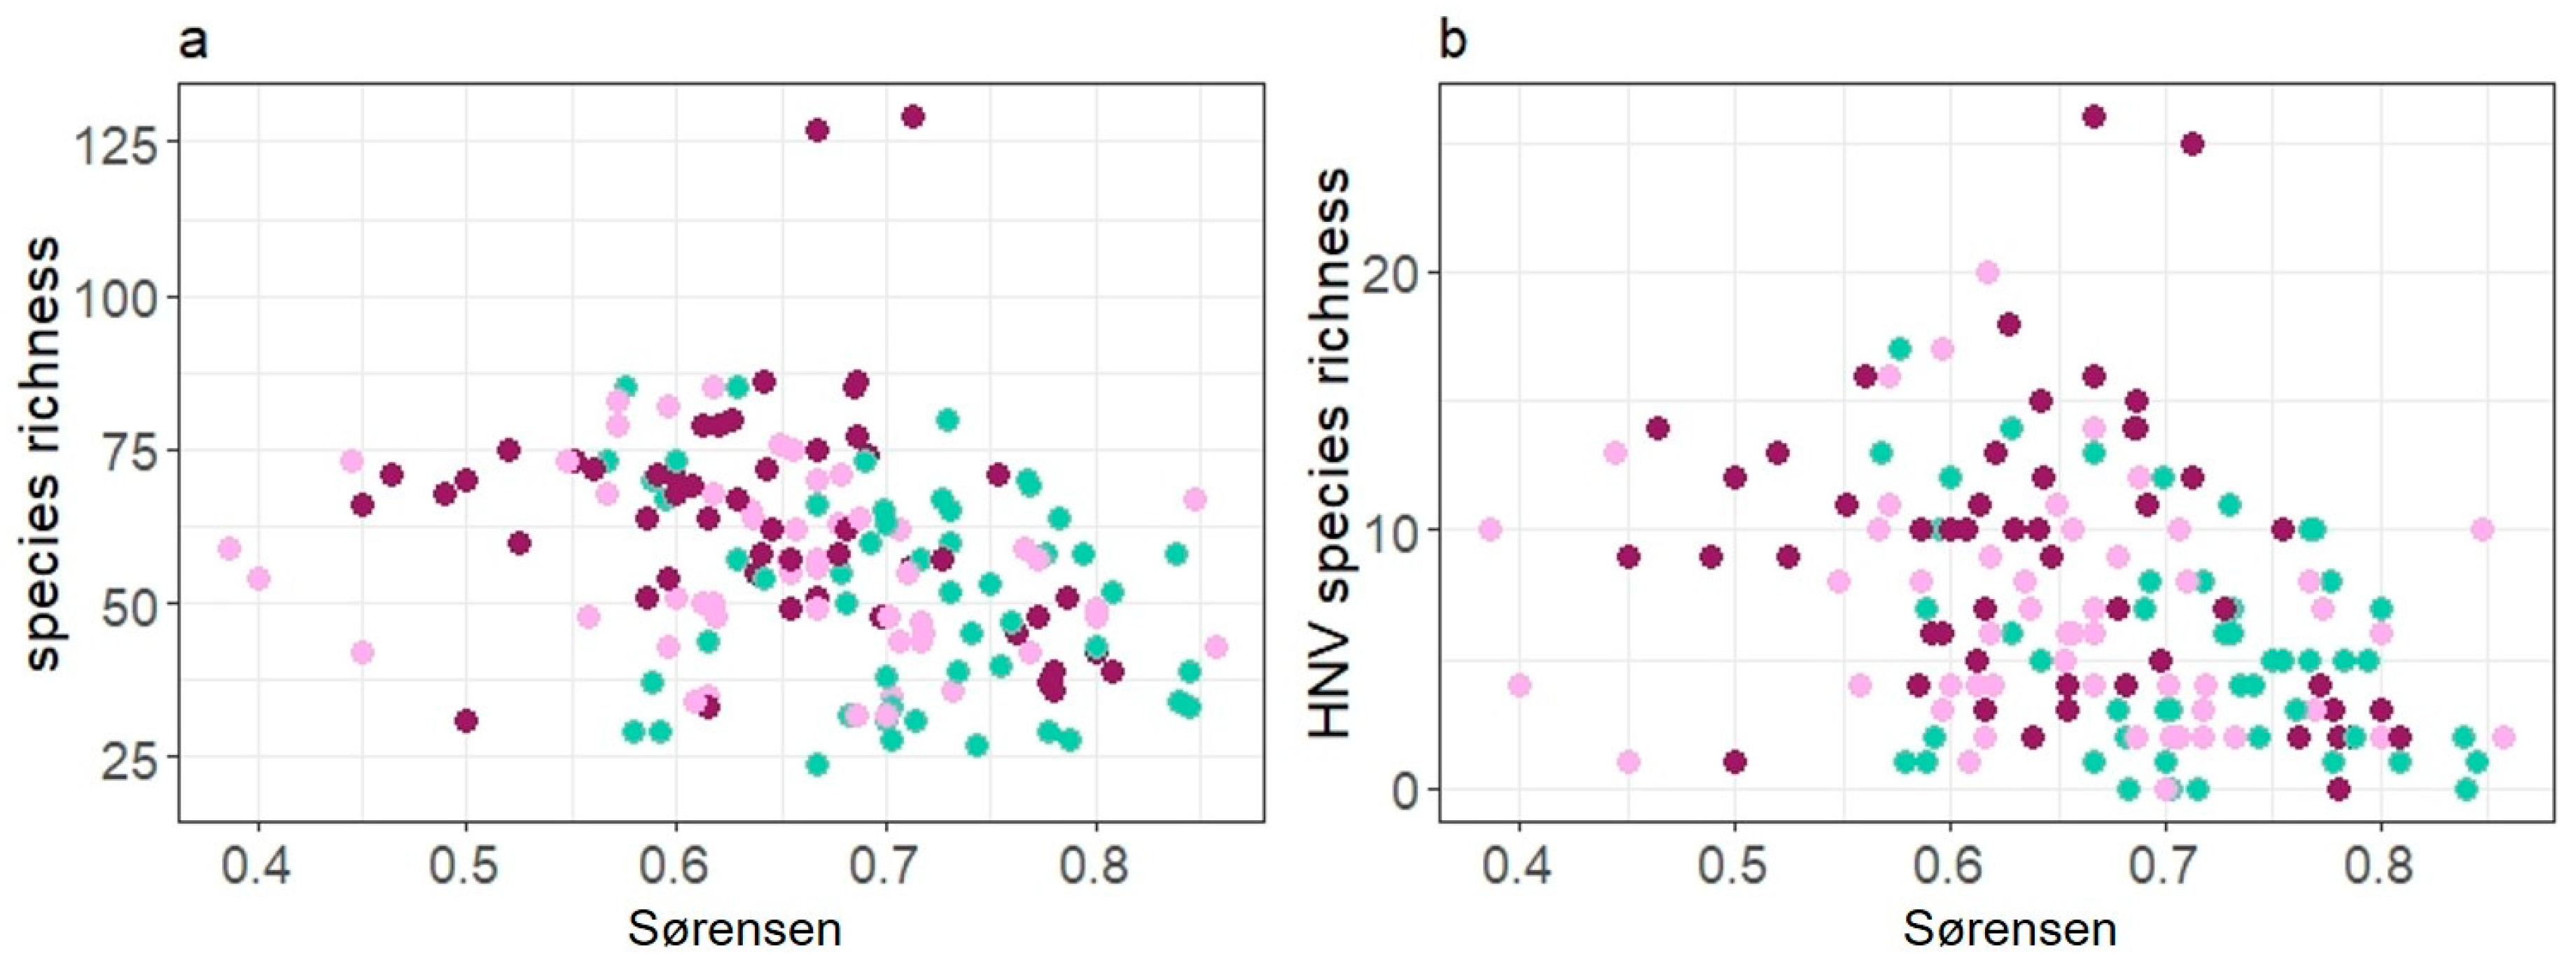
Sørensen index was used as a measure of the floristic contrast between patches. Sørensen differed between paddocks grazed by cattle or horses. Both HC and HR showed a stronger floristic contrast between short and tall patches than C (Table 3, Figure 2).
The floristic contrast significantly affected SR as well as HNV-SR on paddock scale. More species and more HNV species were observed when swards were less homogenous (Figure 4). Interactions of Sørensen and grazing system were not significant in both models.
3.4. Effect of Grassland Management on Species Richness (H4)
Both within the model averaging approach and in the MaMs, neither stocking rate nor N fertilisation was a significant predictor of SR or HNV-SR when applied equally weighted to the same model as the variable grazing system and site conditions (Table 2). However, the MaM showed a trend of decreasing SR with additional mowing for forage conservation (Table 3).
Stocking rate affected strategy types as well as utilisation indicator values. A higher stocking rate led to a lower proportion of the competitive and stress-tolerant strategy component but increased the ruderal strategy component. Higher grazing and trampling tolerance were found on paddocks with higher stocking rate. Forage value was higher on paddocks with higher N fertiliser application (Table 2 and Table 3).
SR and HNV-SR were further modelled as a function of grazing system and its interaction with stocking rate or N fertilisation in order to check for interaction effects. As indicated by model averaging, the effect of grazing system remained significant. However, no significant relationship of the grazing system with stocking rate or N fertilisation was found.
4. Discussion
To our knowledge, this is the first study systematically examining the vegetation characteristics of horse-grazed paddocks in managed temperate grasslands. Compared to experimental studies, observational studies are more challenging in data analysis as effects of land use (e.g., type of livestock, grazing regime, grazing intensity and fertilisation) are confounded with those of the site conditions [64,65]. However, this situation of variable conditions [64,66] is also of particular interest as it reflects “real-life” conditions. In this study we confirmed that the site conditions have an effect on the vegetation and that they interact with land use variables [4,65,67,68,69]. In order to cope with this situation, we employed a rigid study design with a rather large number of replications and applied a statistical approach of multi-model-inference. Thereby we could disentangle the effects of the design variables and the other variables.
Since cattle are the most frequent grazer species of in European grasslands and recommended for biodiversity-oriented management of semi-natural grassland [70,71,72] we used cattle-grazed paddocks (C) as a baseline in our study. At similar site conditions we directly compared their vegetation characteristics to those of paddocks grazed by horses. As we were particularly interested in how the grazing regime regulates the grazing effect of horses, our variable grazing system combines grazer species effects (cattle vs. horse), and effects of grazing regime (continuous (HC) vs. rotational grazing (HR)) within the horse-grazed paddocks.
4.1. Effect of Grazing System
We hypothesized that the grazing system affects species richness (SR) and further vegetation characteristics (H1). We found grazing system to be of a high relative importance for almost every measured vegetation variable when applied to the same model as variables of site conditions and grassland management. These effects were mainly driven by differences between HC and other paddocks, whereas differences between HR and C were comparatively small. Hence, an important finding of this study is that SR and botanical composition in horse-grazed paddocks is affected by the grazing regime, i.e., continuous or rotational grazing. Comparing the three grazing systems in our study, we found significantly higher SR on HC compared to C. Moreover, we found significantly higher high-nature-value species richness (HNV-SR) on HC than on C, indicating a higher nature value of horse-grazed paddocks. Using the regional classification key [53], we identified 55% of HC compared to 26% of C as high-nature-value grassland with more than eight HNV indicator species per paddock. Even considering that our monitoring transects (2 m × 50 m) are longer than those used for regular HNV-monitoring (2 m × 30 m), this is an important finding, since less than 14% of grasslands in Germany have recently been evaluated as being of high-nature-value [52]. It is well established that grazer species differ in their effect on the grassland botanical composition, i.e., community composition, diversity and heterogeneity [3,4,8,71]. While horses select for grasses, cattle prefer forbs (dicotyledonous species), which is assumed to be due to their different digestive systems [8,71]. This could explain the higher number of HNV species, most of which are forbs, on horse pastures compared to cattle pastures. Higher SR under horse grazing had been found before, but was attributed to an increase of ruderal species [69] rather than species of high nature value.
4.2. Relationship of Vegetation Characteristics and Species Richness
We assumed a relationship between vegetation characteristics (proportions of C-S-R-strategy components, utilisation indicator values) and SR, and that this relationship is mediated by the grazing system (H2). The proportion of the ruderal strategy component was high (>40%) in all treatments, but it was neither related to SR, nor were there differences between horse- and cattle-grazed paddocks. The proportion of the competitive strategy component was lower on HC and HR than on C. HNV species are mainly stress-tolerators with a low competitive strength. In contrast, highly productive grass species are competitors [42,73,74]. They benefit from nitrogen fertilisation and are related to reduced species richness [66]. Farmers often sow them to increase the productivity and forage quality. Differences in utilization values between grazing regimes in horse-grazed paddocks were not significant. Nevertheless, a tendency for higher forage quality in HR compared to HC indicates that the grazing regime might have an effect on the agronomical value of such grasslands as has also been shown in experimental approaches [19,31]. Further research is needed in the future where herbage is sampled and analysed for its nutritive value under different grazing regimes in the farming practice.
4.3. Relationship of Floristic Contrast and Species Richness
We hypothesised that the grazing system affects the floristic contrast between patch types and this contrast mediates SR on the paddock scale (H3). Our results strongly support this assumption. As expected, horse grazing led to a stronger floristic contrast between the patch types than cattle grazing. This finding confirms the presumed clear diversification effect of the sward in horse grazing. In a study on wetlands managed for nature conservation, variation in the vegetation composition between patch types was found [8]. This variation depended on the grazer species, with horses creating a larger heterogeneity than cattle. Similarly, we found more species and more HNV species on paddocks with a higher floristic contrast. A greater sward heterogeneity means that there is a greater variety of varying environmental conditions (niches) at a small spatial scale which allows a higher plant species richness on the paddock scale [3,5,8,9]. This phenomenon is generally known and has been suggested as a key driver for biodiversity in grasslands at the local and the landscape scale [1,10,11,74]. It is noteworthy that the horse paddocks showed a larger sward heterogeneity than the cattle pastures irrespective of the grazing regime (HC or HR). Usually, farmers prefer rotational over continuous grazing because rotational grazing ensures a more uniform herbage utilisation, reduces the formation of patches of different sward height, prevents overgrazing and provide herbage of a higher quality [18,19,24]. Our results on floristic contrasts, however, indicate that this approach may be less effective than assumed under horse grazing. The stronger patch-grazing effect under horse compared to cattle grazing indicates that maintaining homogenous swards with horses is much more challenging. Nevertheless, horse keepers do often not aim at maximising grassland yields and are thus able to tolerate a heterogeneous sward structure to some extent. This provides an opportunity for biodiversity in grazed grasslands.
4.4. Effects of Grassland Management on Species Richness
Beyond the effects of the grazing system, it was assumed that the intensity of grassland management (stocking density and fertilisation) influences SR (H4). This assumption was not confirmed. Neither fertilisation nor stocking rate significantly affected SR or HNV-SR. This was true for horse- and cattle-grazed paddocks. With an average nitrogen fertilisation of about 40 kg ha−1 year−1 and an average stocking rate of 1.5 ha−1 year−1 the grasslands in the present study were managed quite extensively. Although no direct effect of fertilisation on species richness was found, two indirect effects might be relevant. First, significantly higher amounts of N were applied on cattle-grazed paddocks, which had higher grassland utilisation values and lower species richness. However, when included in the same global model as grazing system and other variables on management and site condition, fertilisation was of low relative importance for most vegetation characteristics. Despite of this, forage value was significantly increased by N fertilization. Paddocks with additional mowing for forage conservation showed a slightly lower floristic contrast between patch types, which could also be linked to a trend of lower SR.
It has been shown recently that grazing creates stable structures of short and tall grass patches, whose relationship is controlled by the grazing pressure [7]. The grazing induced patchiness, particularly the proportion of short patches was found to be the main driver of plant diversity in low-input pastures, not grazing intensity [35]. For SR, the positive effect of grazing is considered to be strongest in productive grasslands [66]. In this study, we did not find evidence for effects of grazing intensity on floristic contrast and subsequently on SR. In a grazing experiment with horses in an upland region in France, Fleurance et al. [25] compared paddocks of two different stocking rates (“high” 1.8 LU ha−1 year−1 vs. “moderate” 1.1 LU ha−1 year−1) and likewise found no effects on species richness. On the other hand, van Klink et al. 2016 [33] found higher plant species richness under higher stocking rates in a grazed salt marsh system, although the stocking rate in their “intensive” grazing regime was quite low (1.1 LU ha−1 year−1) compared the range of stocking rates observed in horse husbandry [14]. We therefore conclude that horses create a patchy structure of the sward and a distinct floristic contrast irrespective of the grazing intensity.
4.5. Study Limitations
Our analyses are based on plant species data, since their presence and frequencies provide essential information on the growing conditions [43,73,74]. Beyond vegetation data, other ecosystem characteristics need to be included to provide a complete assessment of the sustainability of grassland management with horses. In spite of a relatively high average SR, some of the studied paddocks had little diversity and showed larger areas of bare soil, grazed areas with only a few species and rather high numbers of ruderal or stress-tolerant species, which is obviously a result of overgrazing. Our study was performed in a regional context of an upland region typical for Central Europe. Studies by Socher et al. (2013) [66] and Kleijn et al. (2009) [75] have demonstrated that regional conditions should be taken into consideration to address conservation issues. The results presented here should therefore be handled with care if conclusions for an appropriate conservation management in a wider spatial context are to be drawn. While grazing intensities in our study varied strongly among horse-grazed paddocks, we are aware that in the farming practice far higher stocking rates of horses, up to 10 LU ha−1 year−1, occur, especially in peri-urban regions [15,17]. Thus, our results should not be considered as valid for such conditions.
It might be argued that the horse-grazed paddocks in our study had been established on sites of initially higher species diversity and that the observed grazer species effect is therefore due to site conditions or grassland management apart from grazing. While we do not have information about the vegetation before the present grazing system was established, all studied paddocks were managed in the same way for at least five years. Most of the studied paddocks had been grazed by the same grazer species and not been renovated for decades and the vegetation can therefore be assumed to be in a state of equilibrium with the current management regime. Our study therefore demonstrates that it is possible to manage and maintain grasslands of a relatively high diversity through horse grazing, compared to grasslands managed in the context of dairy production. In direct comparison with cattle-grazed paddocks, horse paddocks did at least not perform worse regarding the nature value of those grasslands. In Germany, 15–20% of the total grassland area is managed by horse keepers, in some regions it is up to 30% [14]. These data underpin the potential role of horse husbandry for the maintenance of species-rich grasslands.
5. Conclusions
Due to their patch-grazing behaviour, horses are generally considered as a more difficult grazer species than cattle. Several authors stress that horse grazing is associated with environmental risks. Our study did not confirm increasing risks, at least not in relation to the nature value of the horse-grazed grasslands. In particular, continuous grazing with horses led to a pronounced floristic contrast within paddocks, and species richness at paddock scale was strongly related to this heterogeneity. Our study demonstrated the potential of horse grazing to maintain species richness of temperate grasslands. However, more in-depth research is required to better understand interactions of horse grazing, grazing regime and the landscape context. This will then provide a basis for a more targeted grazing management with horses for the benefit of species rich grasslands in temperate climate.
Author Contributions
Conceptualization, A.S. and J.I.; data curation, A.S.; formal analysis, A.S.; funding acquisition, A.S.; methodology, A.S. and J.I.; project administration, A.S.; Supervision, J.I.; visualization, A.S.; writing—original draft, A.S.; writing—review & editing, J.I. All authors have read and agreed to the published version of the manuscript.
Funding
Anja Schmitz’ work has been funded by the German Federal Environmental Foundation (DBU) as part of the PhD-Fellowship Programme (AZ 20012/175).
Acknowledgments
We gratefully thank the German Federal Environmental Foundation (DBU) for funding within the PhD-Fellowship Programme. We thank all farmers that participated in our studies and provided access to their land. We thank M. Komischke, A. Cymmer and C. Wißmann for their help during fieldwork, B. Tonn for her help on the manuscript and L. Sutcliffe for English language editing.
Conflicts of Interest
The authors declare no conflict of interest.
References
- Wrage, N.; Strodthoff, J.; Cuchillo, H.M.; Isselstein, J.; Kayser, M. Phytodiversity of temperate permanent grasslands: Ecosystem services for agriculture and livestock management for diversity conservation. Biodivers. Conserv. 2011, 20, 3317–3339. [Google Scholar] [CrossRef] [Green Version]
- Olff, H.; Ritchie, M.E. Effects of herbivores on grassland plant diversity. Trends Ecol. Evol. 1998, 13, 261–265. [Google Scholar] [CrossRef] [Green Version]
- Rook, A.J.; Dumont, B.; Isselstein, J.; Osoro, K.; WallisDeVries, M.F.; Parente, G.; Mills, J. Matching type of livestock to desired biodiversity outcomes in pastures—A review. Biol. Conserv. 2004, 119, 137–150. [Google Scholar] [CrossRef]
- Tälle, M.; Deák, B.; Poschlod, P.; Valkó, O.; Westerberg, L.; Milberg, P. Grazing vs. mowing: A meta-analysis of biodiversity benefits for grassland management. Agric. Ecosyst. Environ. 2016, 222, 200–212. [Google Scholar] [CrossRef]
- Adler, P.; Raff, D.; Lauenroth, W. The effect of grazing on the spatial heterogeneity of vegetation. Oecologia 2001, 128, 465–479. [Google Scholar] [CrossRef] [PubMed]
- Dumont, B.; Rossignol, N.; Loucougaray, G.; Carrère, P.; Chadoeuf, J.; Fleurance, G.; Bonis, A.; Farruggia, A.; Gaucherand, S.; Ginane, C.; et al. When does grazing generate stable vegetation patterns in temperate pastures? Agric. Ecosyst. Environ. 2012, 153, 50–56. [Google Scholar] [CrossRef]
- Tonn, B.; Raab, C.; Isselstein, J. Sward patterns created by patch grazing are stable over more than a decade. Grass Forage Sci. 2019, 74, 104–114. [Google Scholar] [CrossRef] [Green Version]
- Marion, B.; Bonis, A.; Bouzillé, J.-B. How much does grazing-induced heterogeneity impact plant diversity in wet grasslands? Écoscience 2010, 17, 229–239. [Google Scholar] [CrossRef]
- Scimone, M.; Rook, A.J.; Garel, J.P.; Sahin, N. Effects of livestock breed and grazing intensity on grazing systems: 3. Effects on diversity of vegetation. Grass Forage Sci. 2007, 62, 172–184. [Google Scholar] [CrossRef]
- Klimek, S.; Marini, L.; Hofmann, M.; Isselstein, J. Additive partitioning of plant diversity with respect to grassland management regime, fertilisation and abiotic factors. Basic Appl. Ecol. 2008, 9, 626–634. [Google Scholar] [CrossRef]
- Hautier, Y.; Isbell, F.; Borer, E.T.; Seabloom, E.W.; Harpole, W.S.; Lind, E.M.; MacDougall, A.S.; Stevens, C.J.; Adler, P.B.; Alberti, J.; et al. Local loss and spatial homogenization of plant diversity reduce ecosystem multifunctionality. Nat. Ecol. Evol. 2018, 2, 50–56. [Google Scholar] [CrossRef] [PubMed]
- Jerrentrup, J.S.; Seither, M.; Petersen, U.; Isselstein, J. Little grazer species effect on the vegetation in a rotational grazing system. Agric. Ecosyst. Environ. 2015, 202, 243–250. [Google Scholar] [CrossRef]
- European Horse Network—Environmental and Rural Impact. Available online: http://www.europeanhorsenetwork.eu/horse-industry/environmental-and-rural-impact/ (accessed on 30 December 2019).
- Schmitz, A.; Isselstein, J. Wieviel Grünland wird in Deutschland für Pferde genutzt? Berichte Über Landwirtsch. Z. Für Agrarpolit. Landwirtsch. 2018, 96, 1–32. [Google Scholar]
- Bomans, K.; Dewaelheyns, V.; Gulinck, H. Pasture for horses: An underestimated land use class in an urbanized and multifunctional area. Int. J. Sustain. Dev. Plan. 2011, 6, 195–211. [Google Scholar] [CrossRef] [Green Version]
- Elgåker, H.; Pinzke, S.; Lindholm, G.; Nilsson, C. Horse keeping in Urban and Peri-Urban Areas: New Conditions for Physical Planning in Sweden. Geogr. Tidsskr.-Dan. J. Geogr. 2010, 110, 81–98. [Google Scholar] [CrossRef]
- Zasada, I.; Berges, R.; Hilgendorf, J.; Piorr, A. Horsekeeping and the peri-urban development in the Berlin Metropolitan Region. J. Land Use Sci. 2013, 8, 199–214. [Google Scholar] [CrossRef]
- Jouven, M.; Vial, C.; Fleurance, G. Horses and rangelands: Perspectives in Europe based on a French case study. Grass Forage Sci. 2016, 71, 178–194. [Google Scholar] [CrossRef]
- Bott, R.C.; Greene, E.A.; Koch, K.; Martinson, K.L.; Siciliano, P.D.; Williams, C.; Trottier, N.L.; Burk, A.; Swinker, A. Production and Environmental Implications of Equine Grazing. J. Equine Vet. Sci. 2013, 33, 1031–1043. [Google Scholar] [CrossRef]
- Watts, K. Pasture Management to Minimize the Risk of Equine Laminitis. Vet. Clin. North Am. Equine Pract. 2010, 26, 361–369. [Google Scholar] [CrossRef]
- Williams, C.A.; Kenny, L.B.; Burk, A.O. Effects of grazing system and season on glucose and insulin dynamics of the grazing horse. J. Equine Vet. Sci. 2017, 52, 87. [Google Scholar] [CrossRef]
- Archer, M. The species preferences of grazing. Grass Forage Sci. 1973, 28, 123–128. [Google Scholar] [CrossRef]
- Hongo, A.; Akimoto, M. The role of incisors in selective grazing by cattle and horses. J. Agric. Sci. 2003, 140, 469–477. [Google Scholar] [CrossRef]
- Singer, J.W.; Bobsin, N.; Kluchinski, D.; Bamka, W.J. Equine stocking density effect on soil chemical properties, botanical composition, and species density. Commun. Soil Sci. Plant Anal. 2001, 32, 2549–2559. [Google Scholar] [CrossRef]
- Fleurance, G.; Farruggia, A.; Lanore, L.; Dumont, B. How does stocking rate influence horse behaviour, performances and pasture biodiversity in mesophile grasslands? Agric. Ecosyst. Environ. 2016, 231, 255–263. [Google Scholar] [CrossRef]
- Nolte, S.; Esselink, P.; Smit, C.; Bakker, J.P. Herbivore species and density affect vegetation-structure patchiness in salt marshes. Agric. Ecosyst. Environ. 2014, 185, 41–47. [Google Scholar] [CrossRef]
- Schmitz, A.; Isselstein, J. Effects of management on vegetation structure in horse pastures. In Proceedings of the 17th Symposium of the European Grassland Federation. The Role of Grasslands in a Green Future: Threats and Perspectives in Less Favoured Areas; Helgadóttir, Á., Hopkins, A., Eds.; Agricultural University of Iceland: Borgarnes, Iceland, 2013; pp. 394–396. [Google Scholar]
- Ceulemans, T.; Merckx, R.; Hens, M.; Honnay, O. A trait-based analysis of the role of phosphorus vs. nitrogen enrichment in plant species loss across North-west European grasslands: Trait-based analysis of the role of P vs. N enrichment. J. Appl. Ecol. 2011, 48, 1155–1163. [Google Scholar] [CrossRef]
- Critchley, C.N.R.; Chambers, B.J.; Fowbert, J.A.; Sanderson, R.A.; Bhogal, A.; Rose, S.C. Association between lowland grassland plant communities and soil properties. Biol. Conserv. 2002, 105, 199–215. [Google Scholar] [CrossRef]
- Ödberg, F.O.; Francis-Smith, K. Studies on the formation of ungrazed eliminative areas in fields used by horses. Appl. Anim. Ethol. 1977, 3, 27–34. [Google Scholar] [CrossRef]
- Kenny, L.B. The Effects of Rotational and Continuous Grazing on Horses, Pasture Condition, and Soil Properties. M.Sc. Thesis, Rutgers University, New Brunswick, NJ, USA, 2016. [Google Scholar] [CrossRef]
- Herrero-Jáuregui, C.; Oesterheld, M. Effects of grazing intensity on plant richness and diversity: A meta-analysis. Oikos 2018, 127, 757–766. [Google Scholar] [CrossRef]
- van Klink, R.; Nolte, S.; Mandema, F.S.; Lagendijk, D.D.G.; WallisDeVries, M.F.; Bakker, J.P.; Esselink, P.; Smit, C. Effects of grazing management on biodiversity across trophic levels–The importance of livestock species and stocking density in salt marshes. Agric. Ecosyst. Environ. 2016, 235, 329–339. [Google Scholar] [CrossRef] [Green Version]
- Milchunas, D.G.; Varnamkhasti, A.S.; Lauenroth, W.K.; Goetz, H. Forage quality in relation to long-term grazing history, current-year defoliation, and water resource. Oecologia 1995, 101, 366–374. [Google Scholar] [CrossRef] [PubMed]
- Tonn, B.; Densing, E.M.; Gabler, J.; Isselstein, J. Grazing-induced patchiness, not grazing intensity, drives plant diversity in European low-input pastures. J. Appl. Ecol. 2019, 56, 1624–1636. [Google Scholar] [CrossRef]
- Hennig, J.D.; Beck, J.L.; Scasta, D.J. Spatial Ecology Observations from Feral Horses Equipped With Global Positioning System Transmitters. Hum. Wildl. Interact. 2018, 12, 10. [Google Scholar]
- Henning, K.; Lorenz, A.; von Oheimb, G.; Härdtle, W.; Tischew, S. Year-round cattle and horse grazing supports the restoration of abandoned, dry sandy grassland and heathland communities by supressing Calamagrostis epigejos and enhancing species richness. J. Nat. Conserv. 2017, 40, 120–130. [Google Scholar] [CrossRef]
- Lamoot, I.; Callebaut, J.; Degezelle, T.; Demeulenaere, E.; Laquière, J.; Vandenberghe, C.; Hoffmann, M. Eliminative behaviour of free-ranging horses: Do they show latrine behaviour or do they defecate where they graze? Appl. Anim. Behav. Sci. 2004, 86, 105–121. [Google Scholar] [CrossRef]
- Rupprecht, D.; Gilhaus, K.; Hölzel, N. Effects of year-round grazing on the vegetation of nutrient-poor grass- and heathlands—Evidence from a large-scale survey. Agric. Ecosyst. Environ. 2016, 234, 16–22. [Google Scholar] [CrossRef]
- Köhler, M.; Hiller, G.; Tischew, S. Year-round horse grazing supports typical vascular plant species, orchids and rare bird communities in a dry calcareous grassland. Agric. Ecosyst. Environ. 2016, 234, 48–57. [Google Scholar] [CrossRef]
- Saastamoinen, M.; Herzon, I.; Särkijärvi, S.; Schreurs, C.; Myllymäki, M. Horse Welfare and Natural Values on Semi-Natural and Extensive Pastures in Finland: Synergies and Trade-Offs. Land 2017, 6, 69. [Google Scholar] [CrossRef] [Green Version]
- Grime, J.P. Evidence for the Existence of Three Primary Strategies in Plants and Its Relevance to Ecological and Evolutionary Theory. Am. Nat. 1977, 111, 1169–1194. [Google Scholar] [CrossRef]
- Briemle, G.; Nitsche, S.; Nitsche, L. Nutzungswertzahlen für Gefäßpflanzen des Grünlandes. Schriftenreihe Für Veg. 2002, 38, 203–225. [Google Scholar]
- Kleijn, D.; Berendse, F.; Smit, R.; Gilissen, N. Agri-environment schemes do not effectively protect biodiversity in Dutch agricultural landscapes. Nature 2001, 413, 723–725. [Google Scholar] [CrossRef] [PubMed]
- Ulber, L.; Steinmann, H.-H.; Klimek, S.; Isselstein, J. An on-farm approach to investigate the impact of diversified crop rotations on weed species richness and composition in winter wheat. Weed Res. 2009, 49, 534–543. [Google Scholar] [CrossRef]
- Pauler, C.M.; Isselstein, J.; Braunbeck, T.; Schneider, M.K. Influence of Highland and production-oriented cattle breeds on pasture vegetation: A pairwise assessment across broad environmental gradients. Agric. Ecosyst. Environ. 2019, 284, 106585. [Google Scholar] [CrossRef]
- LandNRW. Digital Orthophoto (DOP RGBI). Available online: https://www.bezreg-koeln.nrw.de/brk_internet/geobasis/luftbildinformationen/aktuell/digitale_orthophotos/index.html. (accessed on 22 December 2015).
- Landesdatenbank Nordrhein-Westfalen Bodennutzungshaupterhebung. Available online: https://www.landesdatenbank.nrw.de/ldbnrw/online/data;sid=120F53FEBB1ECAD3E7473A272AFD6B20.ldb1?operation=statistikAbruftabellen&levelindex=0&levelid=1577708904302&index=3 (accessed on 30 December 2019).
- Castle, M.E. A simple disc instrument for estimating herbage yield. Grass Forage Sci. 1976, 31, 37–40. [Google Scholar] [CrossRef]
- QGIS Entwicklungsteam. QGIS Geographisches Informationssystem. In Open Source Geospatial Foundation Projekt; Version 2.6; QGIS Entwicklungsteam: Brighton, UK, 2014. [Google Scholar]
- LandNRW. Digital elevation model (DEM50). Available online: https://www.bezreg-koeln.nrw.de/brk_internet/geobasis/hoehenmodelle/gelaendemodell/index.html, (accessed on 22 December 2015).
- Hünig, C.; und Benzler, A. Das Monitoring der Landwirtschaftsflächen mit hohem Naturwert in Deutschland; BfN Skripten 476, Bonn; 2017; Available online: https://www.bfn.de/fileadmin/BfN/service/Dokumente/skripten/Skript476.pdf (accessed on 30 December 2019).
- Bundesamt für Naturschutz (BfN). Kenntaxa für die regional differenzierte Bewertung von Grünlandflächen im Rahmen des HNV-Farmland-Indikators für Deutschland; Bonn; 2014; Available online: https://www.bfn.de/fileadmin/BfN/monitoring/Dokumente/14_02_26_Kennartenliste_HNV_barrfrei.pdf (accessed on 30 December 2019).
- Hunt, R.; Hodgson, J.G.; Thompson, K.; Bungener, P.; Dunnett, N.; Askew, A. A new practical tool for deriving a functional signature for herbaceous vegetation. Appl. Veg. Sci. 2004, 7, 163–170. [Google Scholar] [CrossRef]
- Magurran, A.E. Measuring Biological Diversity; John Wiley & Sons: New York, NY, USA, 2013. [Google Scholar]
- Dormann, C.F.; Elith, J.; Bacher, S.; Buchmann, C.; Carl, G.; Carré, G.; Marquéz, J.R.G.; Gruber, B.; Lafourcade, B.; Leitão, P.J.; et al. Collinearity: A review of methods to deal with it and a simulation study evaluating their performance. Ecography 2013, 36, 27–46. [Google Scholar] [CrossRef]
- Zuur, A.F. (Ed.) Mixed Effects Models and Extensions in Ecology with R; Statistics for biology and health; Springer Science & Business Media: New York, NY, USA, 2009. [Google Scholar]
- Grueber, C.E.; Nakagawa, S.; Laws, R.J.; Jamieson, I.G. Multimodel inference in ecology and evolution: Challenges and solutions: Multimodel inference. J. Evol. Biol. 2011, 24, 699–711. [Google Scholar] [CrossRef]
- Burnham, K.P.; Anderson, D.R. Multimodel Inference: Understanding AIC and BIC in Model Selection. Sociol. Methods Res. 2004, 33, 261–304. [Google Scholar] [CrossRef]
- Symonds, M.R.E.; Moussalli, A. A brief guide to model selection, multimodel inference and model averaging in behavioural ecology using Akaike’s information criterion. Behav. Ecol. Sociobiol. 2011, 65, 13–21. [Google Scholar] [CrossRef]
- Bartoń, K. MuMIn: Multi-Model Inference, R package version 1.43.15; 2019; Available online: https://CRAN.R-project.org/package=MuMIn (accessed on 20 January 2020).
- Pinheiro, J.; Bates, D.; DebRoy, S.; Sarkar, D.; R Core Team. nlme: Linear and Nonlinear Mixed Effects Models, R package version 3.1-137; 2018; Available online: https://CRAN.R-project.org/package=nlme> (accessed on 1 September 2018).
- Lenth, R.; Singmann, H.; Love, J.; Buerkner, P.; Herve, M. emmeans. Estimated Marginal Means, aka Least-Squares Means, R package version 1.4.3.01; 2019. Available online: https://CRAN.R-project.org/package=emmeans (accessed on 20 January 2020).
- Socher, S.A.; Prati, D.; Boch, S.; Müller, J.; Klaus, V.H.; Hölzel, N.; Fischer, M. Direct and productivity-mediated indirect effects of fertilization, mowing and grazing on grassland species richness. J. Ecol. 2012, 100, 1391–1399. [Google Scholar] [CrossRef]
- Klimek, S.; Richter gen. Kemmermann, A.; Hofmann, M.; Isselstein, J. Plant species richness and composition in managed grasslands: The relative importance of field management and environmental factors. Biol. Conserv. 2007, 134, 559–570. [Google Scholar] [CrossRef]
- Socher, S.A.; Prati, D.; Boch, S.; Müller, J.; Baumbach, H.; Gockel, S.; Hemp, A.; Schöning, I.; Wells, K.; Buscot, F.; et al. Interacting effects of fertilization, mowing and grazing on plant species diversity of 1500 grasslands in Germany differ between regions. Basic Appl. Ecol. 2013, 14, 126–136. [Google Scholar] [CrossRef]
- Basto, S.; Thompson, K.; Phoenix, G.; Sloan, V.; Leake, J.; Rees, M. Long-term nitrogen deposition depletes grassland seed banks. Nat. Commun. 2015, 6, 6185. [Google Scholar] [CrossRef] [PubMed] [Green Version]
- Valkó, O.; Tóthmérész, B.; Kelemen, A.; Simon, E.; Miglécz, T.; Lukács, B.A.; Török, P. Environmental factors driving seed bank diversity in alkali grasslands. Agric. Ecosyst. Environ. 2014, 182, 80–87. [Google Scholar] [CrossRef] [Green Version]
- Wellstein, C.; Otte, A.; Waldhardt, R. Impact of site and management on the diversity of central European mesic grassland. Agric. Ecosyst. Environ. 2007, 122, 203–210. [Google Scholar] [CrossRef]
- Pykälä, J. Plant species responses to cattle grazing in mesic semi-natural grassland. Agric. Ecosyst. Environ. 2005, 108, 109–117. [Google Scholar] [CrossRef]
- Menard, C.; Duncan, P.; Fleurance, G.; Georges, J.-Y.; Lila, M. Comparative foraging and nutrition of horses and cattle in European wetlands. J. Appl. Ecol. 2002, 39, 120–133. [Google Scholar] [CrossRef] [Green Version]
- Bonari, G.; Fajmon, K.; Malenovský, I.; Zelený, D.; Holuša, J.; Jongepierová, I.; Kočárek, P.; Konvička, O.; Uřičář, J.; Chytrý, M. Management of semi-natural grasslands benefiting both plant and insect diversity: The importance of heterogeneity and tradition. Agric. Ecosyst. Environ. 2017, 246, 243–252. [Google Scholar] [CrossRef]
- Ellenberg, H.; Weber, H.E.; Düll, R.; Wirth, V.; Werner, W. Zeigerwerte von Pflanzen in Mitteleuropa, 3rd ed.; Verlag Eric Goltze: Göttingen, Germany, 1992. [Google Scholar]
- Kleyer, M.; Bekker, R.M.; Knevel, I.C.; Bakker, J.P.; Thompson, K.; Sonnenschein, M.; Poschlod, P.; van Groenendael, J.M.; Klimeš, L.; Klimešová, J.; et al. The LEDA Traitbase: A database of life-history traits of the Northwest European flora. J. Ecol. 2008, 96, 1266–1274. [Google Scholar] [CrossRef]
- Kleijn, D.; Kohler, F.; Báldi, A.; Batáry, P.; Concepción, E.D.; Clough, Y.; Díaz, M.; Gabriel, D.; Holzschuh, A.; Knop, E.; et al. On the relationship between farmland biodiversity and land-use intensity in Europe. Proc. R. Soc. B Biol. Sci. 2009, 276, 903–909. [Google Scholar] [CrossRef]
Figure 1.
Study location in the Rhenish Uplands in North Rhine-Westphalia in Germany (a). Distribution of study paddocks (N = 156) in the study region (b). Triplet design with six paddocks at one site grazed by cattle (C) or horses (HC, HR), three subplots and one transect per paddock (c) Orthophotographs provided by LandNRW [47].

Figure 2.
The effect of the grazing system (cattle, C, or horses, HC and HR) on the target variables: (a) species richness (SR), (b) number of HNV species (HNV-SR), (c) floristic contrast (Sørensen), (d–f) proportion of Grime’s strategy type components (%C, %S, %R) and (g–i) utilisation indicator values (grazing, trampling, forage). Boxplots present median, 1st and 3rd quartile and outliers of target variables. Lower case letter indicates significant differences between grazing systems obtained within the minimum adequate models (see Table 3 for remaining variables and effect sizes) at significance level p < 0.05.

Figure 3.
Relationship of species richness and vegetation characteristics: (a) competitive strategy component (%C) and (b) stress-tolerant strategy component (S%) and (c) ruderal strategy component (%R), (d) grazing tolerance value, (e) trampling tolerance value, (f) forage value). Green dots represent paddocks grazed by cattle C, purple dots continuously grazed horse paddocks HC and pink dots rotationally grazed horse paddocks HR.
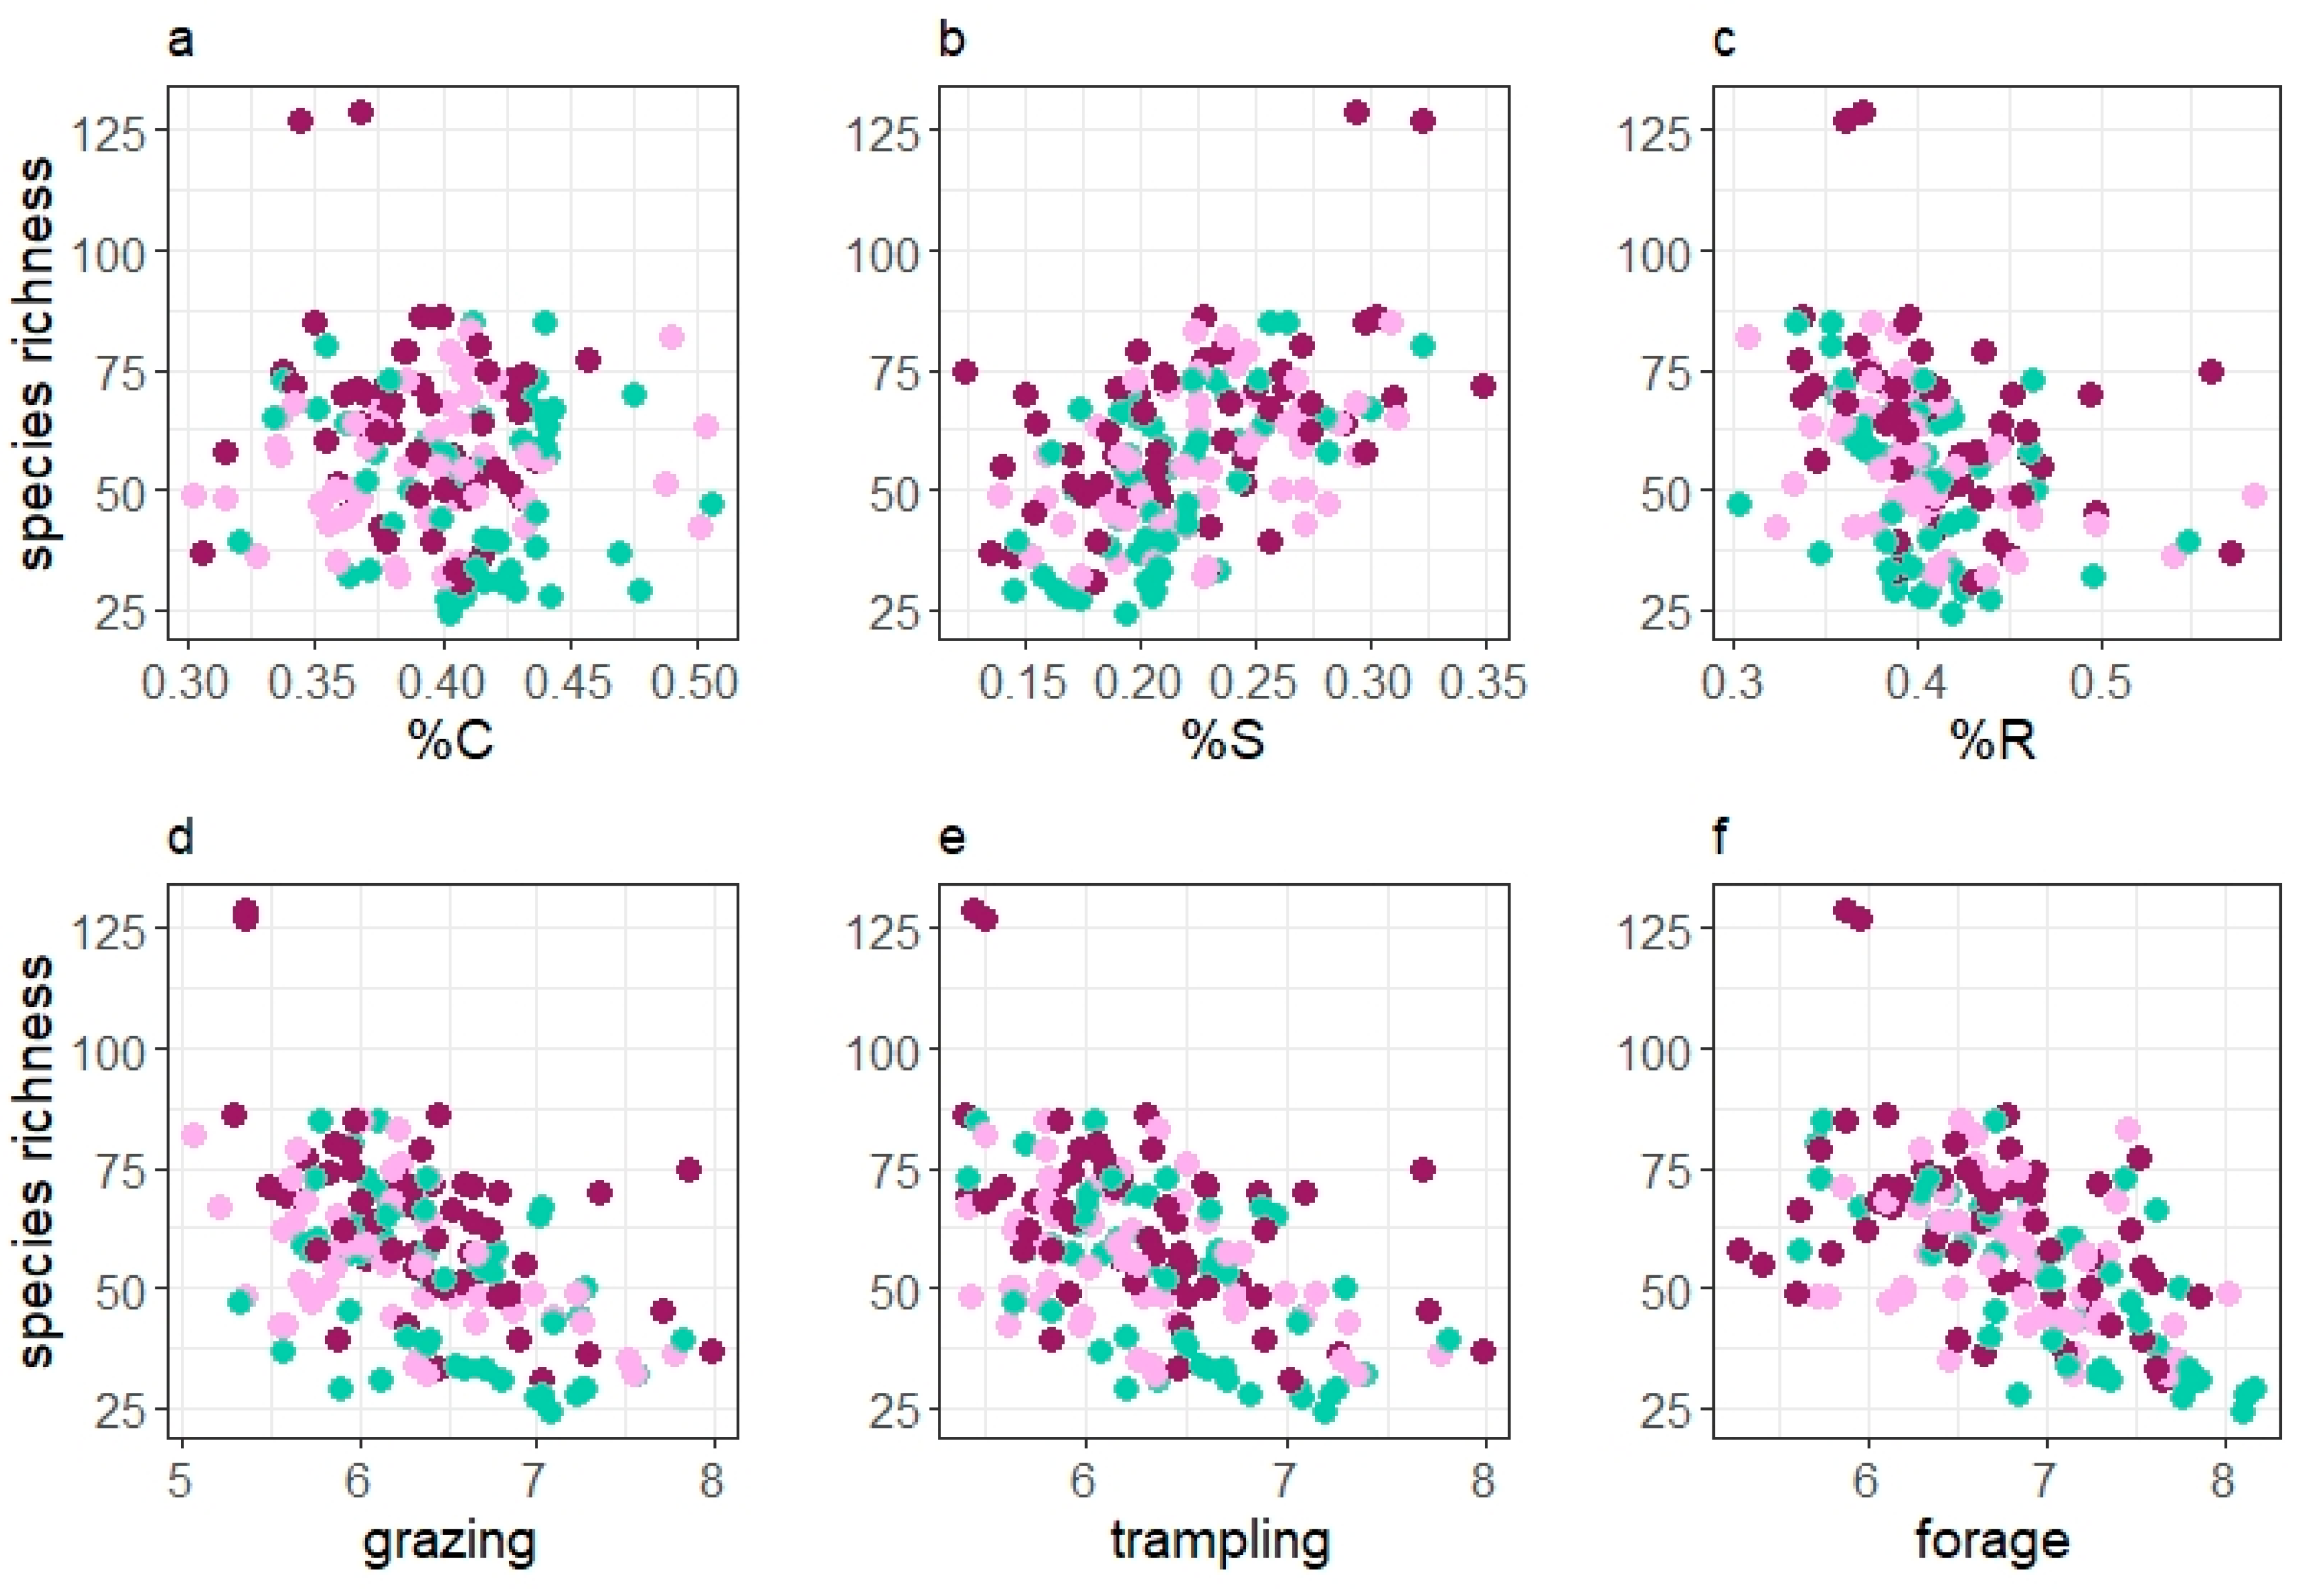
Figure 4.
Relationship of (a) species richness (SR) and (b) HNV species richness (HNV-SR) with Sørensen index as a measure for floristic contrast. Green dots represent paddocks grazed by cattle C, purple dots continuously grazed horse paddocks HC and pink dots rotationally grazed horse paddocks HR.
Figure 4.
Relationship of (a) species richness (SR) and (b) HNV species richness (HNV-SR) with Sørensen index as a measure for floristic contrast. Green dots represent paddocks grazed by cattle C, purple dots continuously grazed horse paddocks HC and pink dots rotationally grazed horse paddocks HR.

Table 1.
Descriptive statistics of site factors, grassland management and soil chemical parameters. Variables were tested for differences between grazer species (lm, Tukey). Cattle-grazed paddocks (C, n = 52) were used as a baseline. In case of significant different estimates (est.), contrasts to C are given for both horse continuously grazing (HC, n = 52) and rotationally grazing (HR, n = 52).
| TOTAL (N = 156) | C | HC | HR | ||||||
|---|---|---|---|---|---|---|---|---|---|
| Variable | Mean | sd | Min | Max | est. | Contrast | p | Contrast | p |
| Paddock size (ha) | 2.06 | 2.7 | 0.20 | 14 | 3.2 | −1.2 | * | −2.0 | *** |
| Altitude (m.a.s.l.) | 239.2 | 44.4 | 118.7 | 335 | 238.6 | −0.2 | −2.0 | ||
| Slope (%) | 9.0 | 4.9 | 1 | 26.3 | 9.5 | −0.8 | −0.5 | ||
| Fertiliser N kg ha−1 year−1 | 38 | 44 | 0 | 265 | 50.2 | −31.8 | *** | −6.2 | |
| Stocking rate ha−1 year−1 | 1.28 | 1 | 0.04 | 7.2 | 1.3 | 0.0 | −0.06 | ||
| Soil pH | 5.2 | 0.5 | 4.3 | 6.8 | 5.3 | −0.2 | * | −0.2 | |
| P2O5 mg 100 g DM−1 | 12.8 | 6.4 | 3.2 | 33.4 | 12.9 | −0.5 | −0.2 | ||
| K2O mg 100 g DM−1 | 26.5 | 13.4 | 5.9 | 76.7 | 27.0 | 0.6 | −2.3 | ||
Significant contrasts of grazing systems are indicated by their levels of significance as * p ≤ 0.05, ** p ≤ 0.01, *** p ≤ 0.001.
Table 2.
Results of the multimodel inference for the effects of grazing regime, grassland management and site factors on vegetation target variables. As target variables species richness (SR), the number of observed HNV species (HNV-SR), proportion of competitive strategy component (%C) and ruderal strategy component (%R), utilisation values and floristic contrast (Sørensen) were tested. The second column gives the intercept representing cattle grazing (C), HC gives results for continuously and HR rotationally grazed horse paddocks. Grassland management is represented by average stocking rate, nitrogen (N) fertilization and mowing, abiotic site conditions by size (ha), slope, soil pH and phosphorus concentration. Model averaged coefficients (coef) of explanatory variables remaining in the 95% confidence set of submodels are shown in the remaining columns along with relative importance values (I) and significance levels (P) obtained by z-statistics shown as * p ≤ 0.05, ** p ≤ 0.01, *** p ≤ 0.001. Variables with a relative importance of >0.6 are shown in bold.
| Grazing System | Grassland Management | Abiotic Site Conditions | |||||||||||||||||||||||||
|---|---|---|---|---|---|---|---|---|---|---|---|---|---|---|---|---|---|---|---|---|---|---|---|---|---|---|---|
| HC | HR | Stocking Rate | N Fertilisation | Mowing | Ha | Slope | pH | P2O5 | |||||||||||||||||||
| Species Variable | Inter-cept | coef | I | P | coef | P | coef | I | P | coef | I | P | coef | I | P | coef | I | P | coef | I | P | coef | I | P | coef | I | P |
| SR | 52.08 | 12.04 | 1 | *** | 4.60 | * | 0.14 | 0.26 | −0.39 | 0.29 | −1.78 | 0.52 | 0.28 | 0.27 | 11.59 | 1 | *** | −2.55 | 0.57 | −7.48 | 0.98 | ** | |||||
| HNV-SR | 5.48 | 3.34 | 1 | *** | 1.14 | 0.07 | 0.27 | −0.23 | 0.35 | −0.34 | 0.39 | 0.04 | 0.25 | 2.81 | 0.99 | *** | −1.81 | 0.87 | −1.77 | 0.90 | * | ||||||
| %C | 0.41 | −0.02 | 0.83 | . | 0.01 | −0.01 | 0.72 | 0.00 | 0.26 | 0.002 | 0.35 | 0.003 | 0.38 | −0.002 | 0.34 | 0.001 | 0.31 | 0.003 | 0.39 | ||||||||
| %S | 0.21 | 0.01 | 0.68 | 0.01 | −0.01 | 0.79 | −0.00 | 0.25 | −0.001 | 0.29 | −0.002 | 0.33 | 0.025 | 1 | *** | −0.01 | 0.49 | −0.03 | 1 | *** | |||||||
| %R | 0.40 | 0.00 | 0.34 | 0.00 | 0.002 | 1 | *** | −0.00 | 0.28 | 0.00 | 0.25 | −0.00 | 0.25 | −0.001 | 0.83 | −0.001 | 0.25 | 0.02 | 0.98 | ** | |||||||
| Grazing | 6.39 | −0.06 | 0.66 | −0.146 | 0.28 | 0.99 | *** | −0.07 | 0.48 | 0.10 | 0.55 | 0.00 | 0.26 | −0.28 | 0.96 | ** | −0.01 | 0.26 | 0.35 | 1 | *** | ||||||
| Trampling | 6.33 | −0.11 | 0.50 | −0.091 | 0.23 | 0.97 | ** | −0.02 | 0.32 | 0.13 | 0.69 | 0.01 | 0.29 | −0.30 | 0.99 | *** | 0.02 | 0.33 | 0.36 | 1 | *** | ||||||
| Forage | 6.90 | −0.27 | 0.87 | * | −0.114 | −0.08 | 0.657 | 0.11 | 0.56 | ** | 0.22 | 0.83 | 0.05 | 0.42 | −0.13 | 0.75 | ** | 0.04 | 0.37 | * | 0.3 | 0.97 | ** | ||||
| Sørensen | 0.71 | −0.063 | 1 | *** | −0.058 | *** | −0.006 | 0.39 | 0.00 | 0.27 | 0.014 | 0.54 | 0.00 | 0.25 | 0.04 | 0.96 | ** | 0.01 | 0.50 | 0.00 | 0.26 | ||||||
Table 3.
Effects of all explanatory variables remaining in minimum adequate mixed effects models on species variables. Rm2: marginal coefficient of determination.
Table 3.
Effects of all explanatory variables remaining in minimum adequate mixed effects models on species variables. Rm2: marginal coefficient of determination.
| Grassland Management | Abiotic Site Conditions | ||||||||||||||||
|---|---|---|---|---|---|---|---|---|---|---|---|---|---|---|---|---|---|
| Grazing System | Stocking Rate | N Fertilisation | Mowing | Ha | Slope | pH | P2O5 | ||||||||||
| Species Variable | F | P | F | P | F | P | F | P | F | P | F | P | F | P | F | P | Rm2 |
| SR | 17.6 | <0.001 | 3.5 | 0.06 | 26.9 | <0.001 | 14.9 | <0.001 | 0.31 | ||||||||
| HNV-SR | 14.9 | <0.001 | 20.7 | <0.001 | 5.4 | 0.02 | 13.9 | <0.001 | 0.31 | ||||||||
| %C | 4.7 | 0.01 | 5.8 | 0.02 | 0.08 | ||||||||||||
| %S | 3.5 | 0.03 | 4.0 | 0.047 | 21.1 | <0.001 | 33.2 | <0.001 | 0.31 | ||||||||
| %R | 16.2 | <0.001 | 7.6 | 0.007 | 10.28 | 0.002 | 0.19 | ||||||||||
| Grazing | 3.1 | 0.04 | 13.8 | <0.001 | 11.9 | <0.001 | 15.4 | <0.001 | 0.24 | ||||||||
| Trampling | 2.7 | 0.07 | 11.7 | <0.001 | 1.1 | 0.29 | 17.7 | <0.001 | 22.6 | <0.001 | 0.30 | ||||||
| Forage | 8.8 | <0.001 | 6.5 | 0.01 | 11.2 | 0.001 | 6.7 | 0.01 | 11.2 | 0.001 | 0.24 | ||||||
| Sørensen | 9.4 | <0.001 | 4.1 | 0.04 | 9.8 | 0.002 | 2.2 | 0.14 | 0.18 | ||||||||
© 2020 by the authors. Licensee MDPI, Basel, Switzerland. This article is an open access article distributed under the terms and conditions of the Creative Commons Attribution (CC BY) license (http://creativecommons.org/licenses/by/4.0/).
Share and Cite
MDPI and ACS Style
Schmitz, A.; Isselstein, J. Effect of Grazing System on Grassland Plant Species Richness and Vegetation Characteristics: Comparing Horse and Cattle Grazing. Sustainability 2020, 12, 3300. https://doi.org/10.3390/su12083300
AMA Style
Schmitz A, Isselstein J. Effect of Grazing System on Grassland Plant Species Richness and Vegetation Characteristics: Comparing Horse and Cattle Grazing. Sustainability. 2020; 12(8):3300. https://doi.org/10.3390/su12083300
Chicago/Turabian StyleSchmitz, Anja, and Johannes Isselstein. 2020. "Effect of Grazing System on Grassland Plant Species Richness and Vegetation Characteristics: Comparing Horse and Cattle Grazing" Sustainability 12, no. 8: 3300. https://doi.org/10.3390/su12083300
Note that from the first issue of 2016, this journal uses article numbers instead of page numbers. See further details here.