3.2. Soil Properties
Most of the soil chemical properties show stepwise feature from highest to lowest in the following order: OF, IF, and CF, except elements of Fe, Cu, and EC. Meanwhile, these elements had significant differences among different fertilizer treatments from 2009 to 2018.
Treatment had a significantly higher pH value on average and higher accumulation of organic matter, P, K, Ca, Mg, Fe, Mn, Cu, Zn, Na, and EC in OF than in CF soil. Compared with the original soil in 1988, the OF soil was more enriched in organic matter (+61%), P (+37%), K (+196%), Ca (+313%), and Mg (+313%), but CF soil was depleted in organic matter (−24%) and P (−31%) in 2018 (
Table 2).
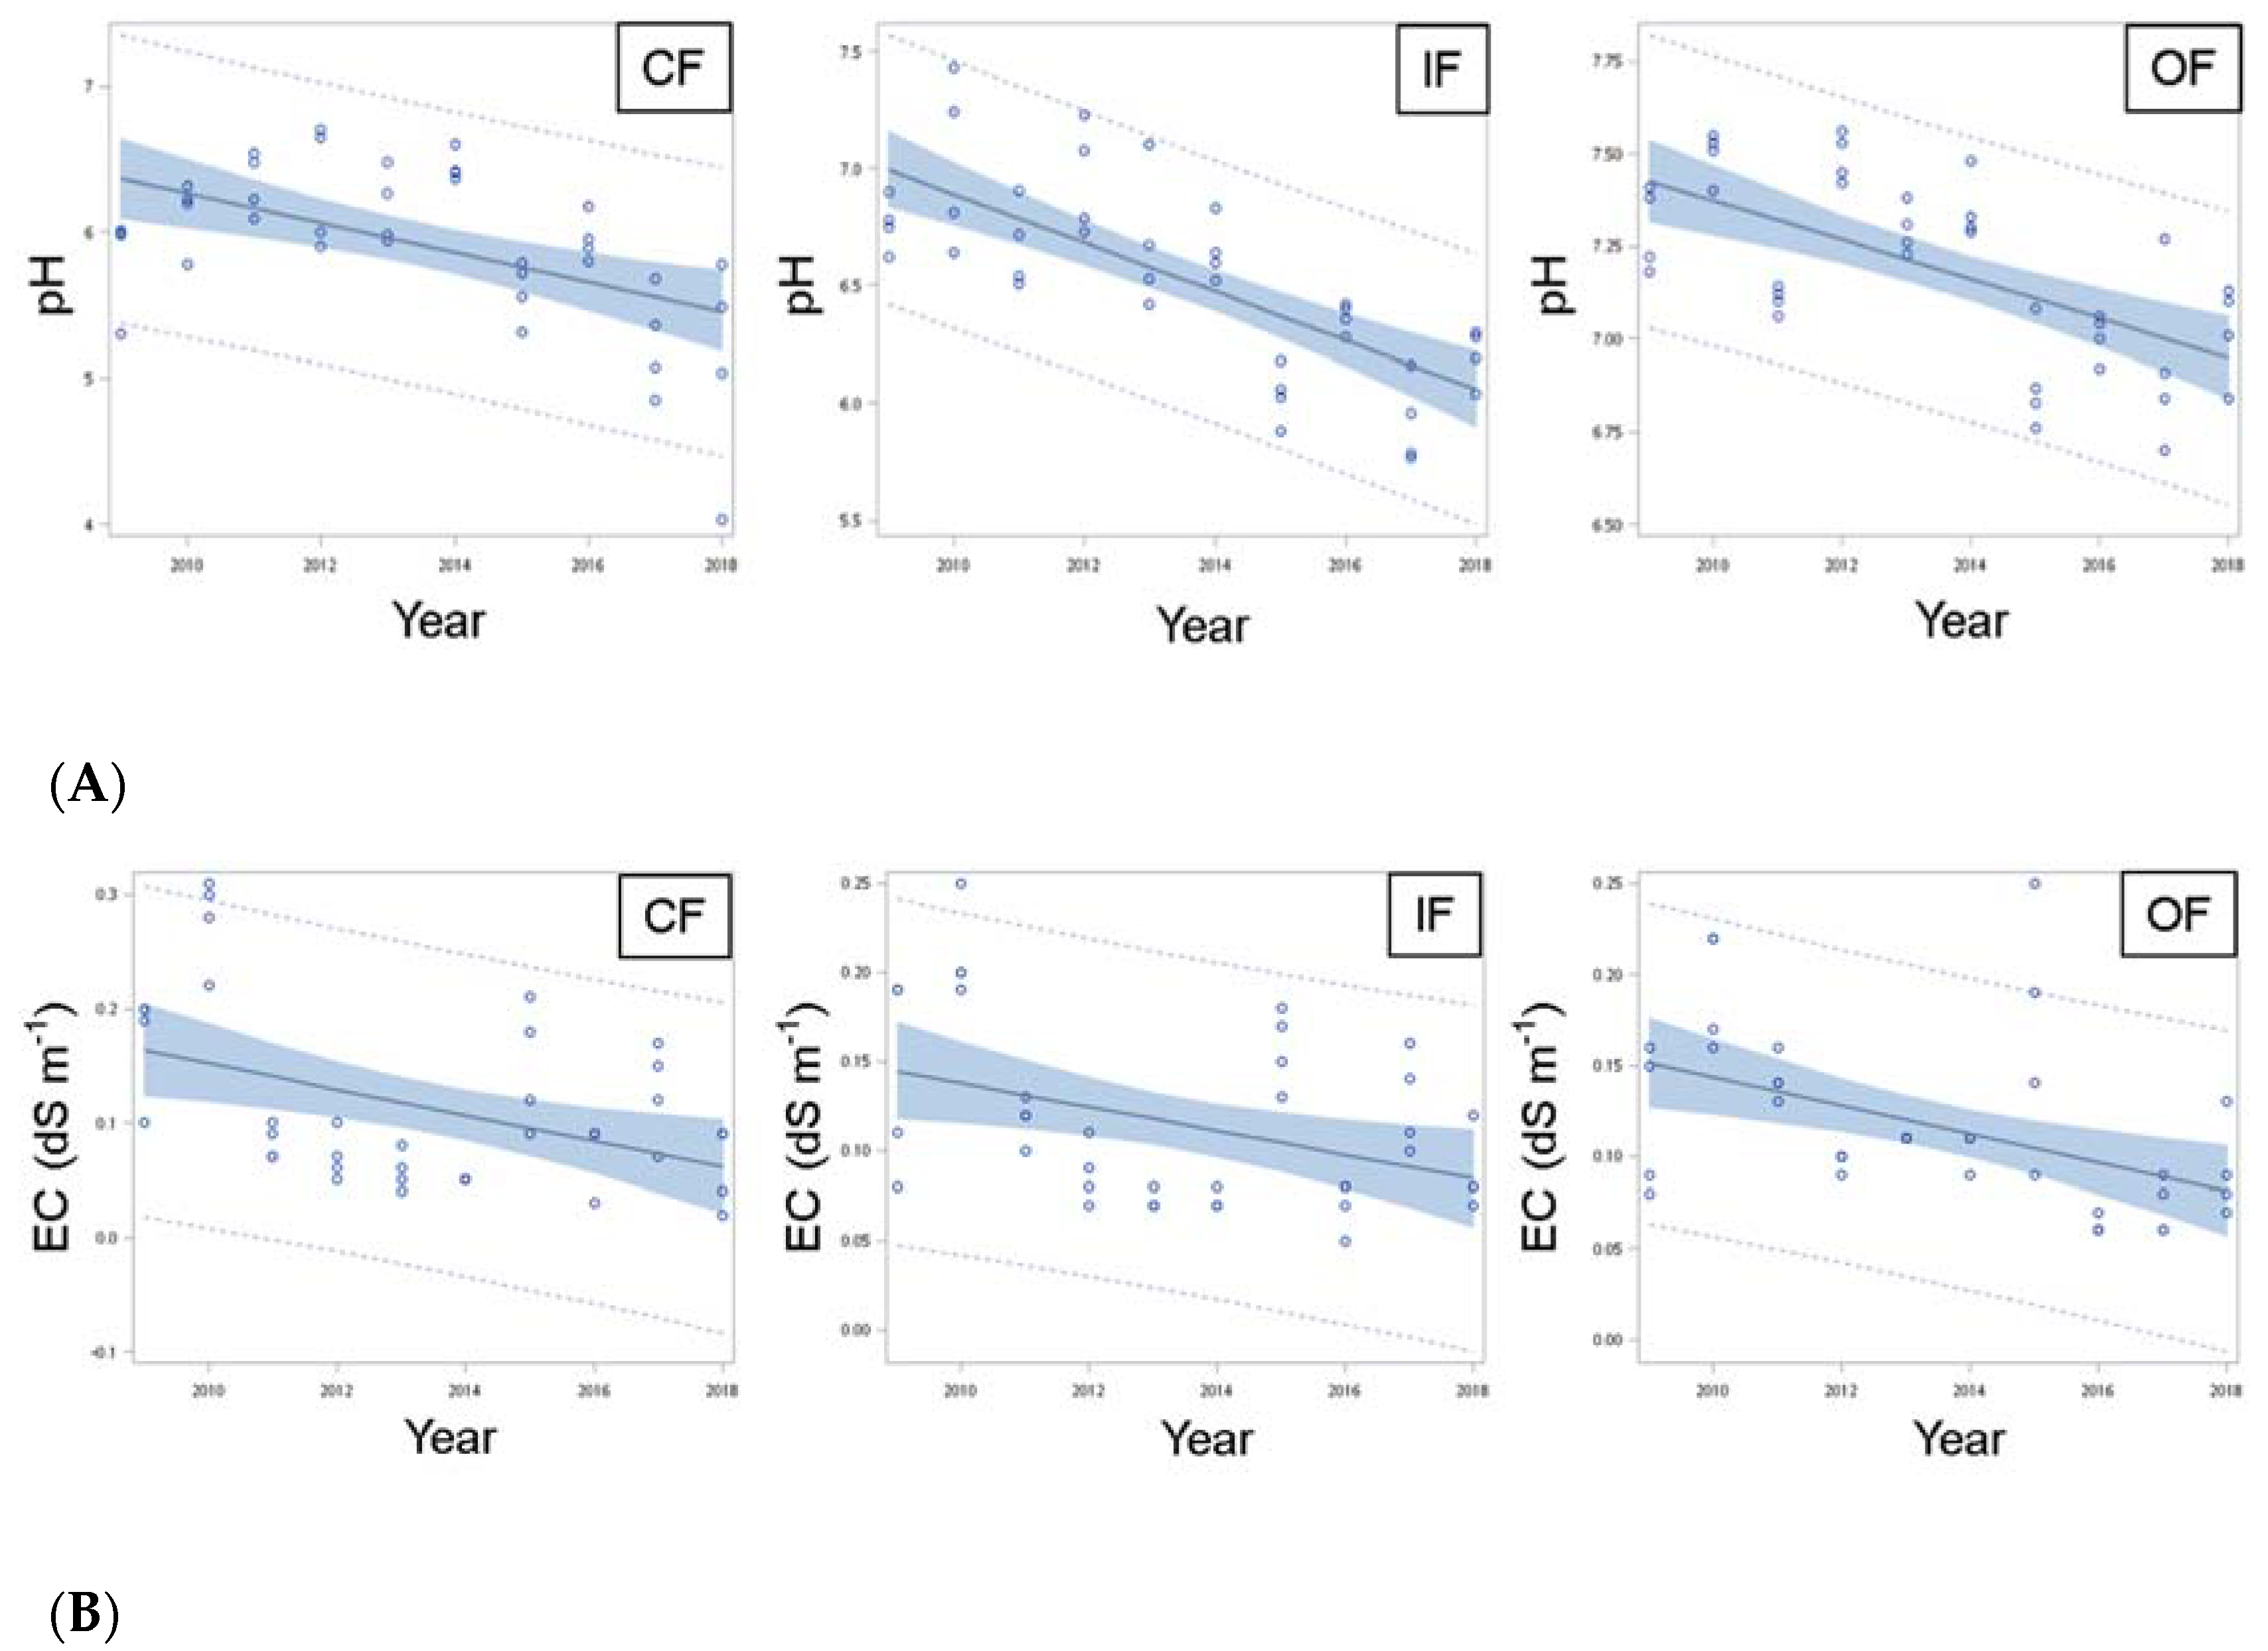
In
Figure 2, there were clear trends of decreasing pH and EC in CF, IF, and OF soils. Although natural soil is proverbially believed to be formatted by acid rain, the real causes of the decrease of soil pH values in this experiment are uncertain. Acid rain (pH < 5.0) was frequently (21% of observation days) recorded in Kaohsiung in 2018 from the EPA (Environmental Protection Administration), Taiwan, so it is a possible cause of increasing soil acidity. Even though application of chemical fertilizer has obvious effects on soil acidification [
19], it is notable that the acidification rate of the organic fertilizer treatment was the least steep among the three; OF was −0.0529 pH units per year, compared to −0.1009 pH units per year for CF (
Figure 2A). That is, the CF acidification rate was almost twice as severe as the OF rate. In addition, EC is an integral factor in soil fertility for agricultural crops. Studies’ reports indicate that extractable amounts of Na and Mg obviously affect the EC [
26], as does as the soil texture [
27]. The decreasing EC trend may be the cause of increasing relative humidity or the integrated intention of acidification of these three soil treatments. The negative correlation between EC and relative humidity is significant in all three fertilization treatment soils (Pearson correlation coefficient: −0.47743~−0.60472,
p ≤ 0.0018), which means the higher the relative humidity, the lower the EC. This point of view is somewhat of a concern to Krug, who emphasizes that, in acidification, acid rain is responsible for leaching of nutrients, release of cation [
28].
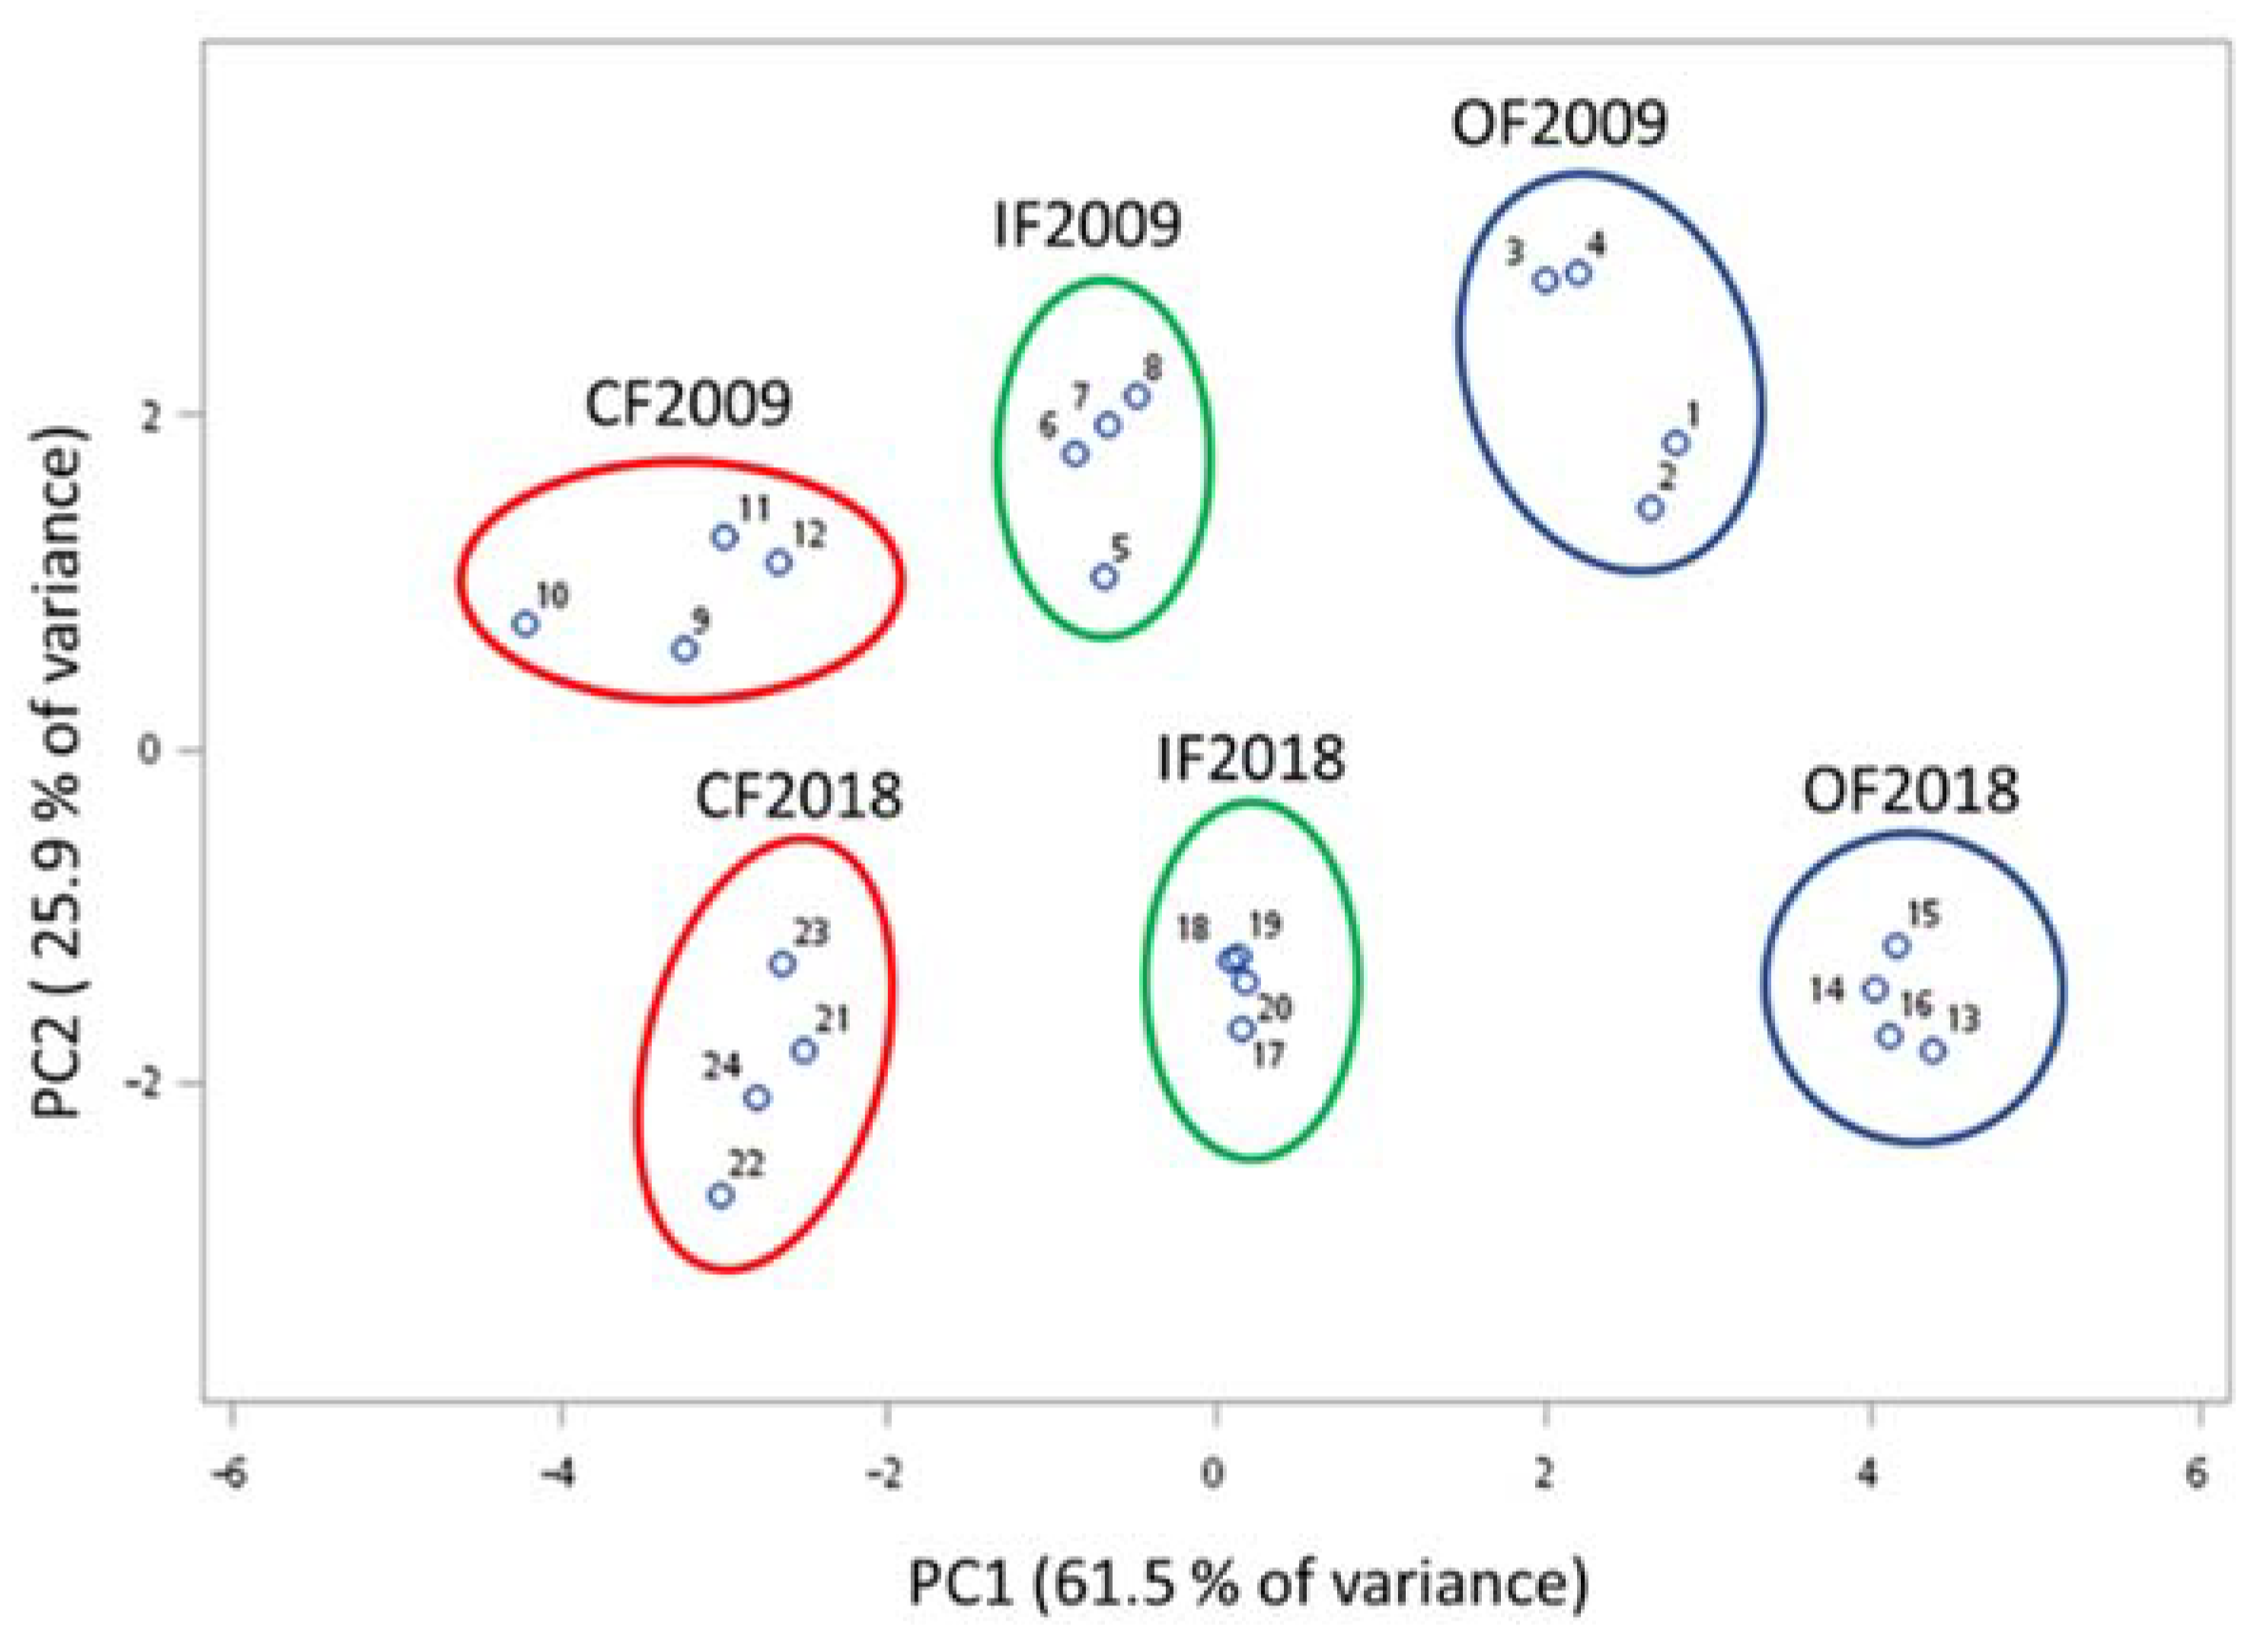
At the beginning and end of the study in 2009 and 2018, respectively, the chemical properties of the soil were keeping it steady and distinguishable from the three fertilizers’ soil via principal component analysis (
Figure 3), that is, the soil samples and sweet corn yields from different fertilizer treatments belonging to CF, IF, and OF in their representatives.
3.3. Sweet Corn Yield
There are five survey items of sweet corn yield. The marketable yield of sweet corn was composed of qualified and unqualified ear yield, which can be further separated as first ear and second ear. Although these yields were not significantly different during the period of 2009–2018, the sources of variation belong to “Years,” and “Treatments × Years” had significantly different yields among treatments (
Table 3,
Table 4).
Consequently, the yield among treatments with each year should be separately compared. Therefore, the results of yield survey showed that the year 2013 was a turning point.
Fresh marketable yield and components of sweet corn yield and weight presented significant differences in CF treatment in the 2009–2013 period, while OF treatment presented a statistical significance in 2013–2017 (
Table 5). Some anomalies and events, such as typhoons in August–December, have arisen as an inferred result of influences on maize growth in February–May of the next year of the 2013–2017 period.
A further comparison of yield trends on scatter plot among treatments was displayed in
Figure 4. The marketable yield trends of three fertilization treatments had different distribution patterns; the trend of marketable yield was significantly decreased under CF (
p = 0.0001) and IF (
p = 0.0061), but slightly increased under OF.
The yield was further evaluated by dividing marketable yield into qualified yield of first ear and second ear (
Figure 5A). Meanwhile, the distribution pattern of average ear weight of first ear and second ear is displayed in
Figure 5B.
The qualified first ear yield trends slightly declined for OF (p = 0.3884), but significantly decreased for IF (R square = 0.3094, p = 0.0002) and CF (R square = 0.4978, p < 0.0001). Comparatively, the second ear qualified yield trends notably rose in OF (R square = 0.2051, p = 0.0033), but significantly declined in CF (R square = 0.2284, p = 0.0018), and did not have clear trends in IF (R square = 0.0113, p = 0.5139). In addition, to comprehend the overview of each ear weight, we calculated the qualified yield into average ear weight for the first and second ears. Although, the trends of average ear weight from first ear and second ear had differentiable decreasing patterns among three different fertilization treatments, which was significantly decreasing in CF and IF (p < 0.001), whereas not in OF (p = 0.4884). That is, the distribution patterns of average first and second ear weight of OF were more stable than CF and IF. Therefore, we conclude that the decrease in marketable yield was caused by the drop in first and second ear weights for CF and IF, but the yield increase for OF mainly resulted from the second ear.
The results indicate that the application of chemical fertilizer (CF) was unable to maintain the sweet corn yield in the period of 2009–2018, especially for second ear yield (CF average first ear weight trend: y = −3.4461x + 321.08; average second ear weight trend: y = −7.1037x + 251.24). These results also imply that the three fertilization treatments were not adequate for the second fruit growth on CF and IF under this circumstance, but organic fertilizer may enhance soil productivity, over and above nutrient content effects, when large inputs are applied over many years [
29].
3.4. Correlation Analysis among Climate Variables, Soil Properties, and Crop Yield
To summarize, the crop yield distribution patterns were different among the three treatments, especially for second ear yield of OF. Analysis focused on the decreasing yield of CF and increasing yield of OF second ear. Unexpectedly, conspicuous correlations were found between average ear weight and both EC and relative humidity for the CF and IF treatments, but not for OF, via Pearson correlation analysis (
Table 6).
To confirm whether the yield remarkably correlated with these parameters, multiple regression analysis was performed (
Table 7). Different average ear weight regression equations were constructed for the three treatments. In the equation for average ear weight from CF, the EC and relative humidity were significant predictors of average first ear weight, while relative humidity and Tmin were predictors of average second ear weight. The ear weight equation model for CF had
p < 0.0001 and adjusted R square > 0.5722. In summary, more than 57.2% of sweet corn ear weight could be predicted under the CF treatment. This result confirms that the yield was broadly affected by relative humidity, particularly under the CF treatment. Moreover, the average first ear weight of IF was also influenced by relative humidity, but there was no extraordinary predictor in the yield (weight) regression equation under the OF treatment (adjusted R square < 0.4265). Consequently, we conclude that the increasing relative humidity had negative impacts on the sweet corn yield of CF first and second ear weight, as the same amount of chemical fertilizer was used annually (
Table 1).
We speculate that some unknown soil parameters (e.g., physical parameters or microorganisms) are possible factors involved in the sweet corn growth in OF. Hence, the next-generation sequencing from 2014 soil metagenomic data was acquired to correlate with the average second ear weight in the same year. The top 15 soil microbes negatively (r ≤ −0.6) or positively (r ≥ 0.6) correlated with the ear weight for the three treatments are arranged by total read counts in
Table 8.
The Family
Chitinophagaceae (Nos. 1, 2, 6, 10, 12) (facultative aerobic bacteria, some active even at very low pH) co-occurred in negative correlation with ear weight as an obvious indicator, whereas the Classes of
Acidobacteria (Nos. 16, 20, 21, 26) (aerobic bacteria, low pH) and
Betaproteobacteria (Nos. 25, 29) (in groundwater ecosystems) were the two differentiable dominant microbes in positive correlation with ear weight. This result suggests that microbial groups influence the decrease in ear weight in CF because microorganisms are affected by chemical components at high RH and soil moisture.
Betaproteobacteria, one of the Proteobacteria subgroups, was approved as abundant specific microbes on organic fertilizer treatment soil compared to chemical fertilizer soil [
15]. A previous study showed that a 54% yield increase of maize was conferred by microorganisms in no-till strip field [
30]. Above all, the Pearson correlation and multiple regression analyses both illustrated the same conclusion, that relative humidity was the key factor determining the yield under the CF and IF treatments, especially under the CF treatment.
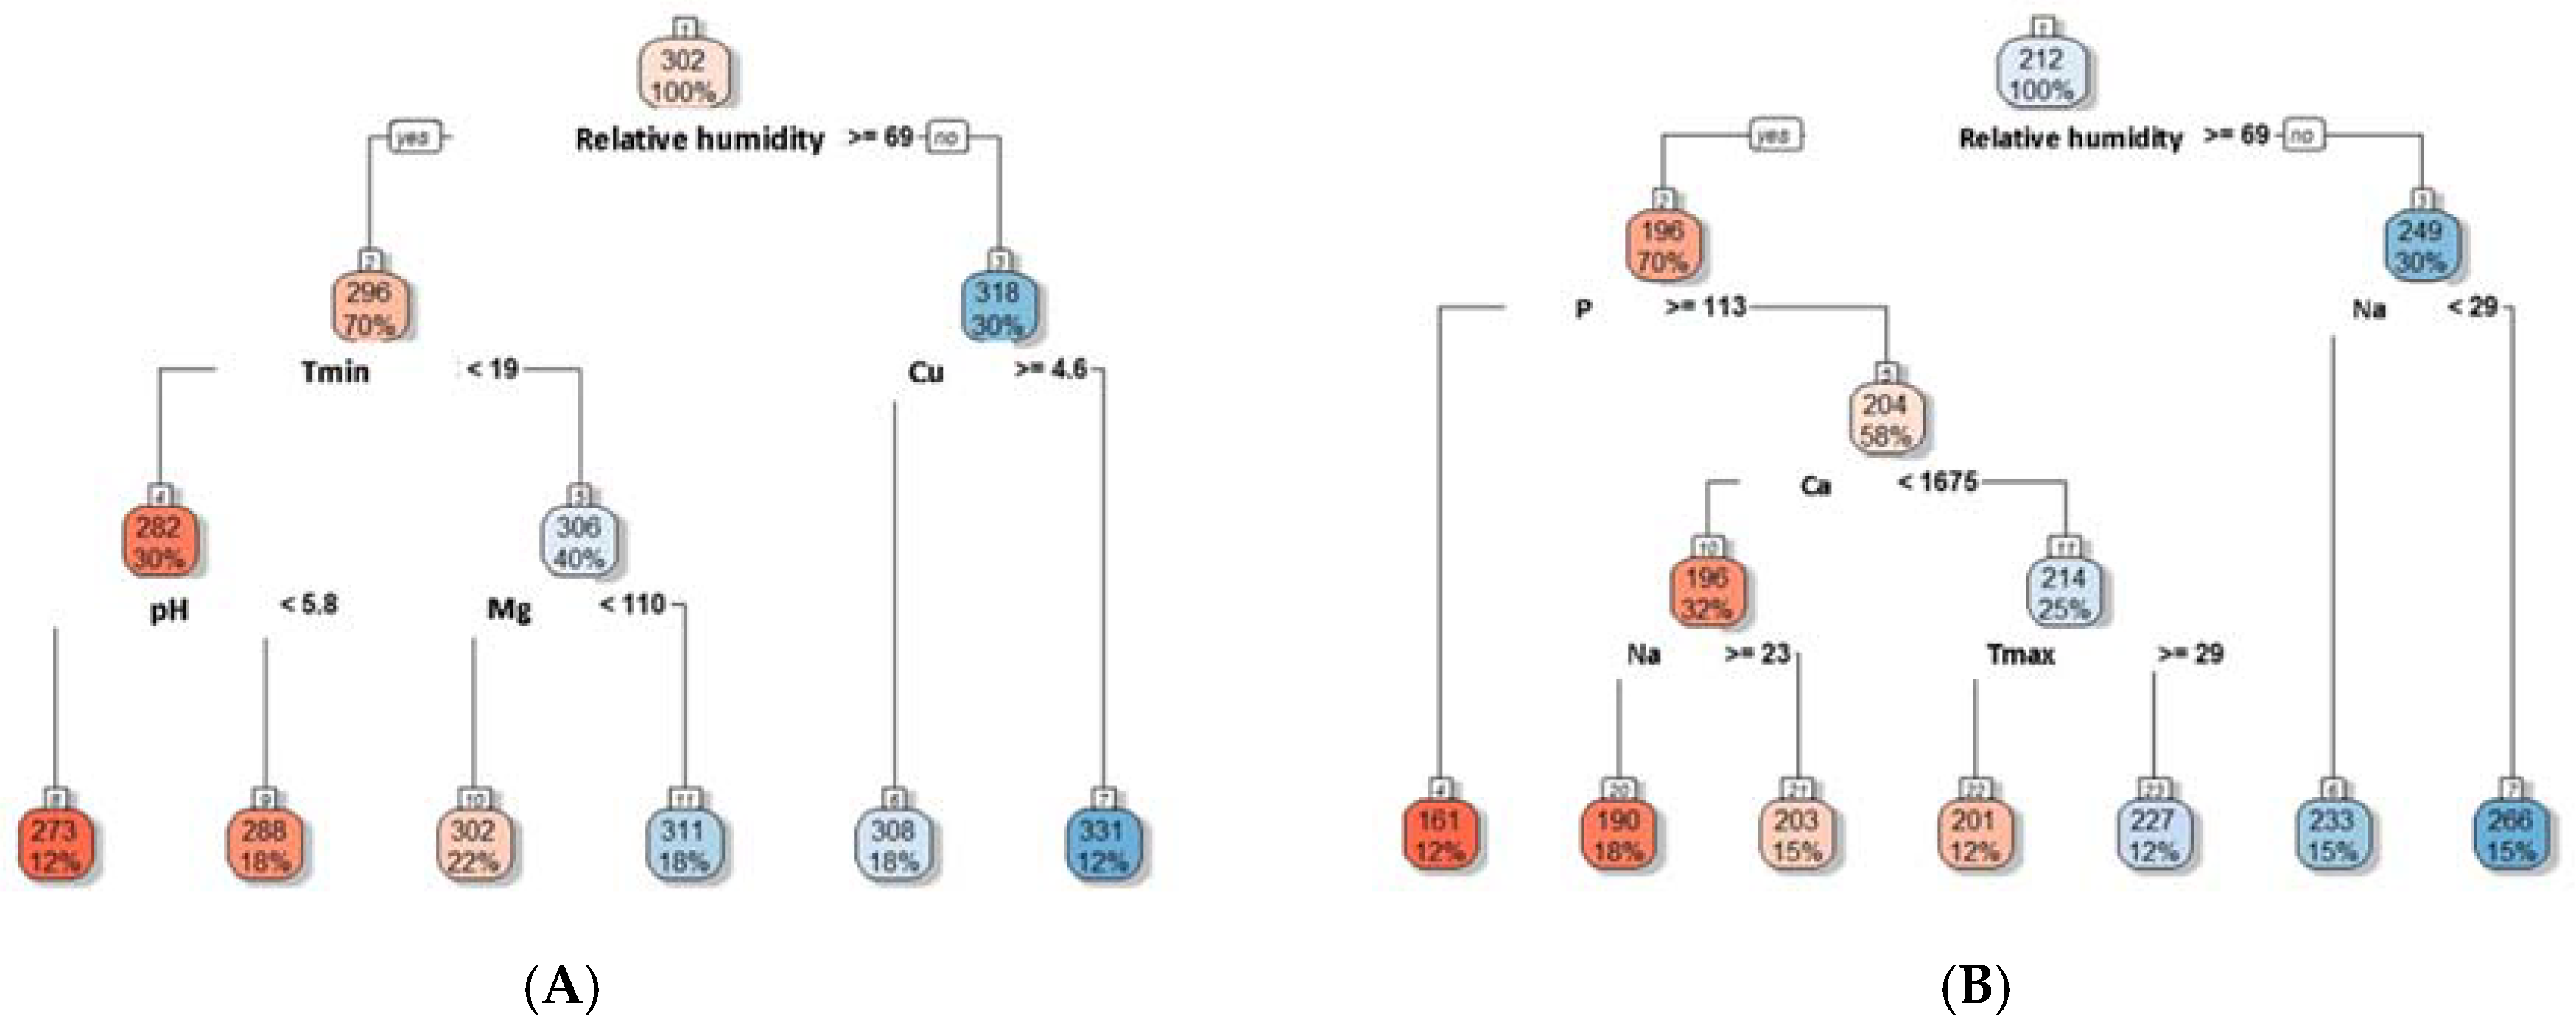
Furthermore, to confirm the effect of these factors on the yield, regression tree analysis was performed. Interestingly, the outcome also shows the major importance of relative humidity: 70% of the yield is produced under the relative humidity above 69% and the average yield is far lower than the average yield under relative humidity below 69% (30% of the yield). This is the case for both average weights of the first ear and second ear, under the CF treatment (
Figure 6).
Therefore, these results are similar to our previous ones, i.e., increase of relative humidity had a negative impact on the average ear weight of CF. Regression tree analysis also shows that, with the relative humidity below 69% and the soil Cu below 4.6 mg kg
−1, the average yield for the first ear reaches high average weight of 331 g (
Figure 6A). With the relative humidity below 69% and the soil Na above 29 mg kg
−1, the average yield for the second ear reaches high average weight of 266 g (
Figure 6B). This indicates that there are interaction effects of the climate parameters and soil properties with the average yields under CF. The maize yield is more sensitive to climate change under long-term chemical fertilizer treatment, because Southeast Asia and Taiwan have a tropical/subtropical monsoon climate with frequent typhoons and storms. CF and IF treatments gave higher yield values in 2009–2012 with climate anomalies (2013 with heavy precipitations), but the OF treatment was more sustainable in the 2009–2018 period. Through the regression tree analysis, we can find the most important variables of the climate parameters and soil properties which will promote or reduce the sweet corn average yield. Furthermore, the critical interactions of the climate parameters and soil properties to sweet corn average yield are also identified.
As the environment changes, various factors are widely known to affect the maize yield. One study determined that warming temperatures were positively correlated with maize yield at Zhengzhou [
9]. Recently, the CERES-Maize model was used to determine optimum planting dates [
31]. Lana et al. compared the yields of four maize varieties to choose the best one for coping with the impacts of climate change. They found that change simulation in increasing precipitation was beneficial to the MPA01 cultivar with higher yield stability [
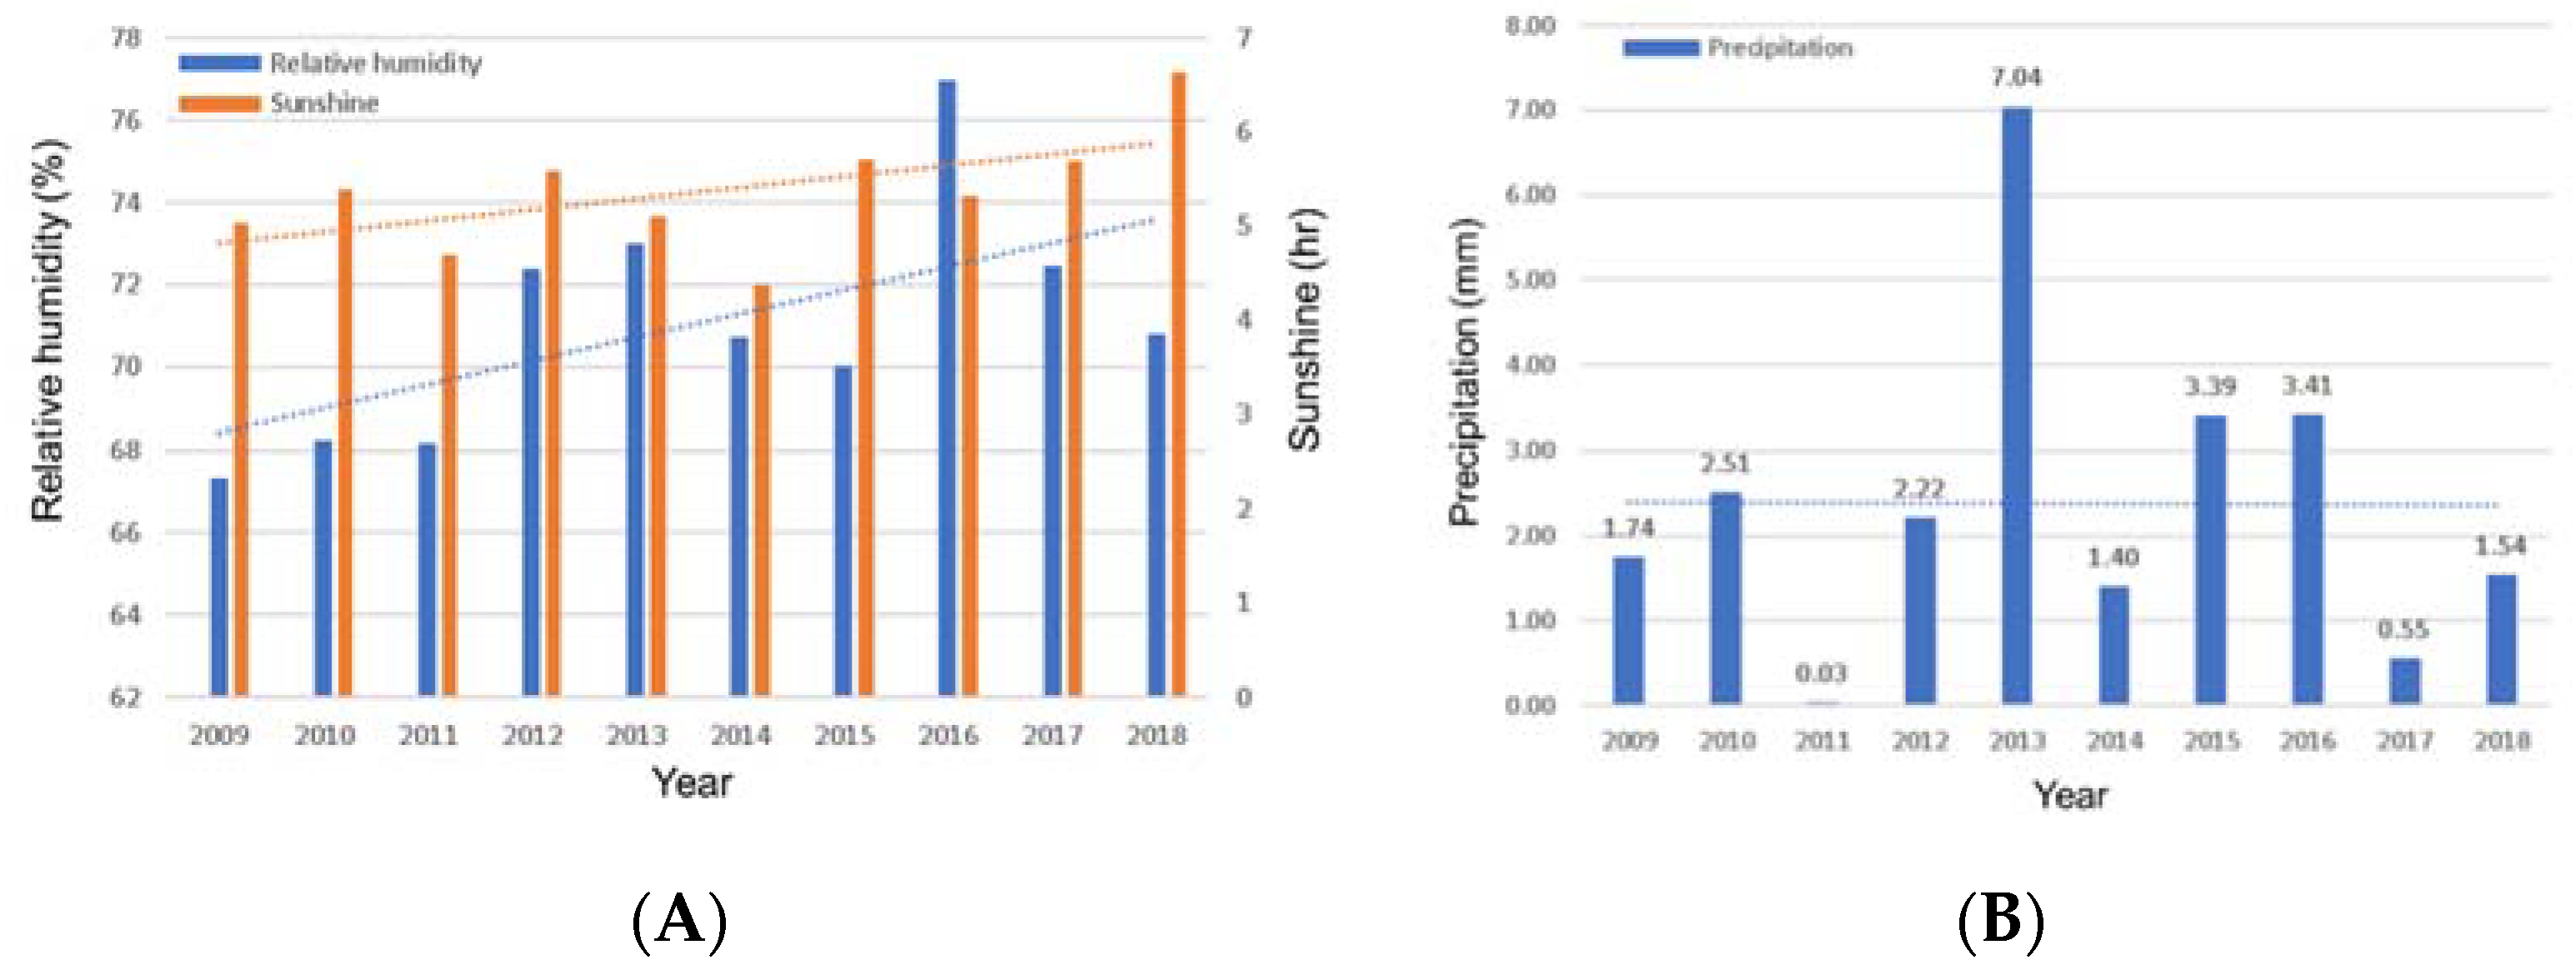
32]. This result implied that precipitation might be the limiting factor affecting yield stability. Interestingly, relative humidity had a close relationship with precipitation (Pearson correlation coefficient: 0.40917) in this study. We also noticed the lowest yield of sweet corn in CF compared with the highest yield in OF (on average, CF: 10.9 t ha
−1; IF: 12.9 t ha
−1; OF: 13.5 t ha
−1), as the heavy precipitation occurred in 2013 (
Figure 1B). Nevertheless, the effects of relative humidity on the yield of maize or sweet corn are rarely reported. One study indicated that high relative humidity facilitated reduced iron deficiency chlorosis symptoms to obtain higher plant dry weight and increasing plant height, when comparing lower (60%) and high (90%) relative humidity effects on iron deficiency chlorosis in soybean [
33]. Meanwhile, if adequate nutrition is supplied, high relative humidity also increases yield on peanut [
34]. Thus, increase of relative humidity seems beneficial to crops when adequate nutrition is applied. However, we observed decreasing yield for CF due to the decline of average weight of sweet corn, especially the second ear weight under long-term application of fertilizer. This might have resulted from the lack of nutrition supplied under the CF treatment or was due to different varieties of crop.
Alternatively, vegetable crops require an adequate and continuous supply of N for proper growth and maximum high-quality yields. As the crop grows, N is the most important of all the essential nutrients for plants. In this study, the accumulated total N in leaves during the harvest stage was measured as 3.03, 2.81, and 2.56 ppm on average for CF, IF, and OF, respectively. The leaf N accumulation was significantly different (
Table 9) and negatively correlated with the average ear weight (
Table 6).
Namely, the higher the accumulated N in leaves, the lower the ear weight. This result corresponds to a previous study, which showed that higher relative humidity produces heavier leaf fresh weight and larger leaf area [
34]. Another study showed that excising the uppermost two leaves promoted N remobilization from vegetative organs to kernels on maize [
35].
Here, we showed that although the trend of N content in the leaves was rising under both CF and OF, N accumulation was higher in CF than in OF on average (
Table 9). The immediate N supply might not be enough or as available to sweet corn in OF as in CF. In addition, due to the slow release of N components from organic matter, a decline in crop yield was observed in the initial years compared with chemical fertilizer [
36], but N affects the uptake of other nutrients, which are constituents of organic compounds [
37]. As a result, we suggest that after the long-term application of the organic fertilizer, the slow release of N and other essential elements may provide a lasting nutrition supply to the sweet corn under increasing relative humidity, compared to an instant supply using CF. These findings further support the ideas that organic farming may result in greater spatial stability of soil biotic and abiotic properties [
38]. Indeed, although the yield of sweet corn from OF was not notably higher than that from CF, the yield trend had higher resilience under OF than CF under increasing relative humidity. Therefore, organic fertilization is certainly necessary in sustainable agriculture.


