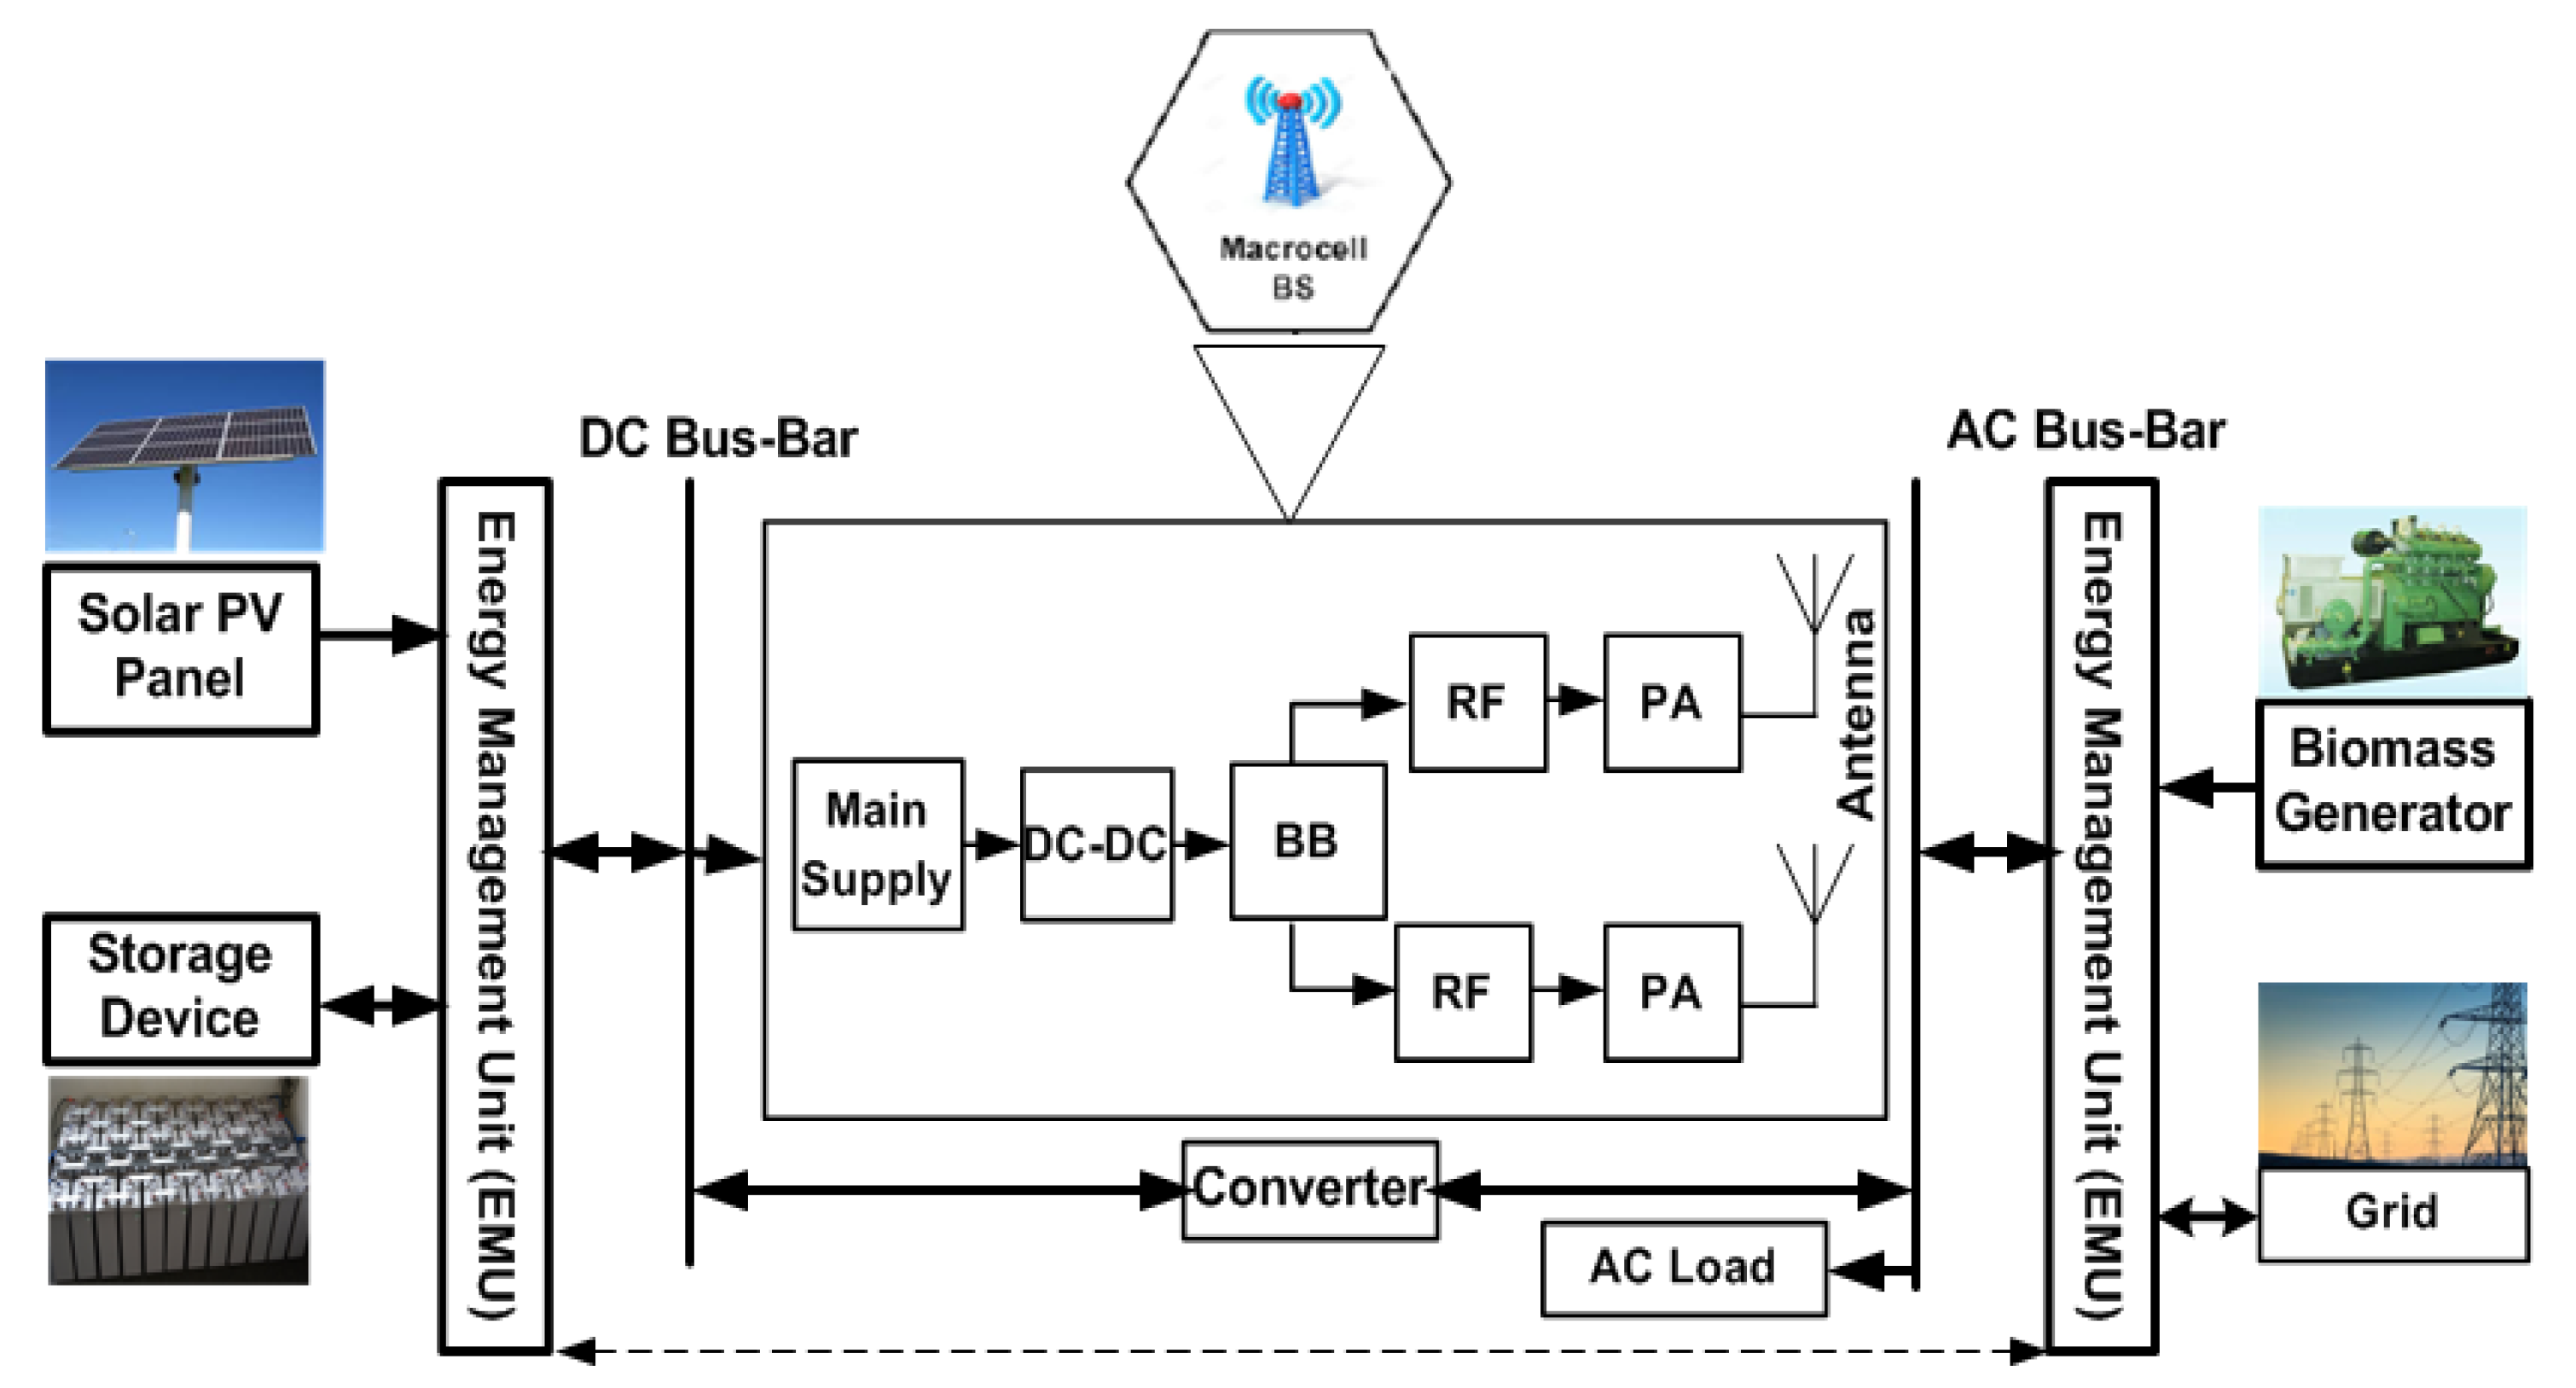
Figure 1.
Architecture of the grid-tied hybrid PV/biomass generator (BG) system for a macro-BS.
Figure 1.
Architecture of the grid-tied hybrid PV/biomass generator (BG) system for a macro-BS.
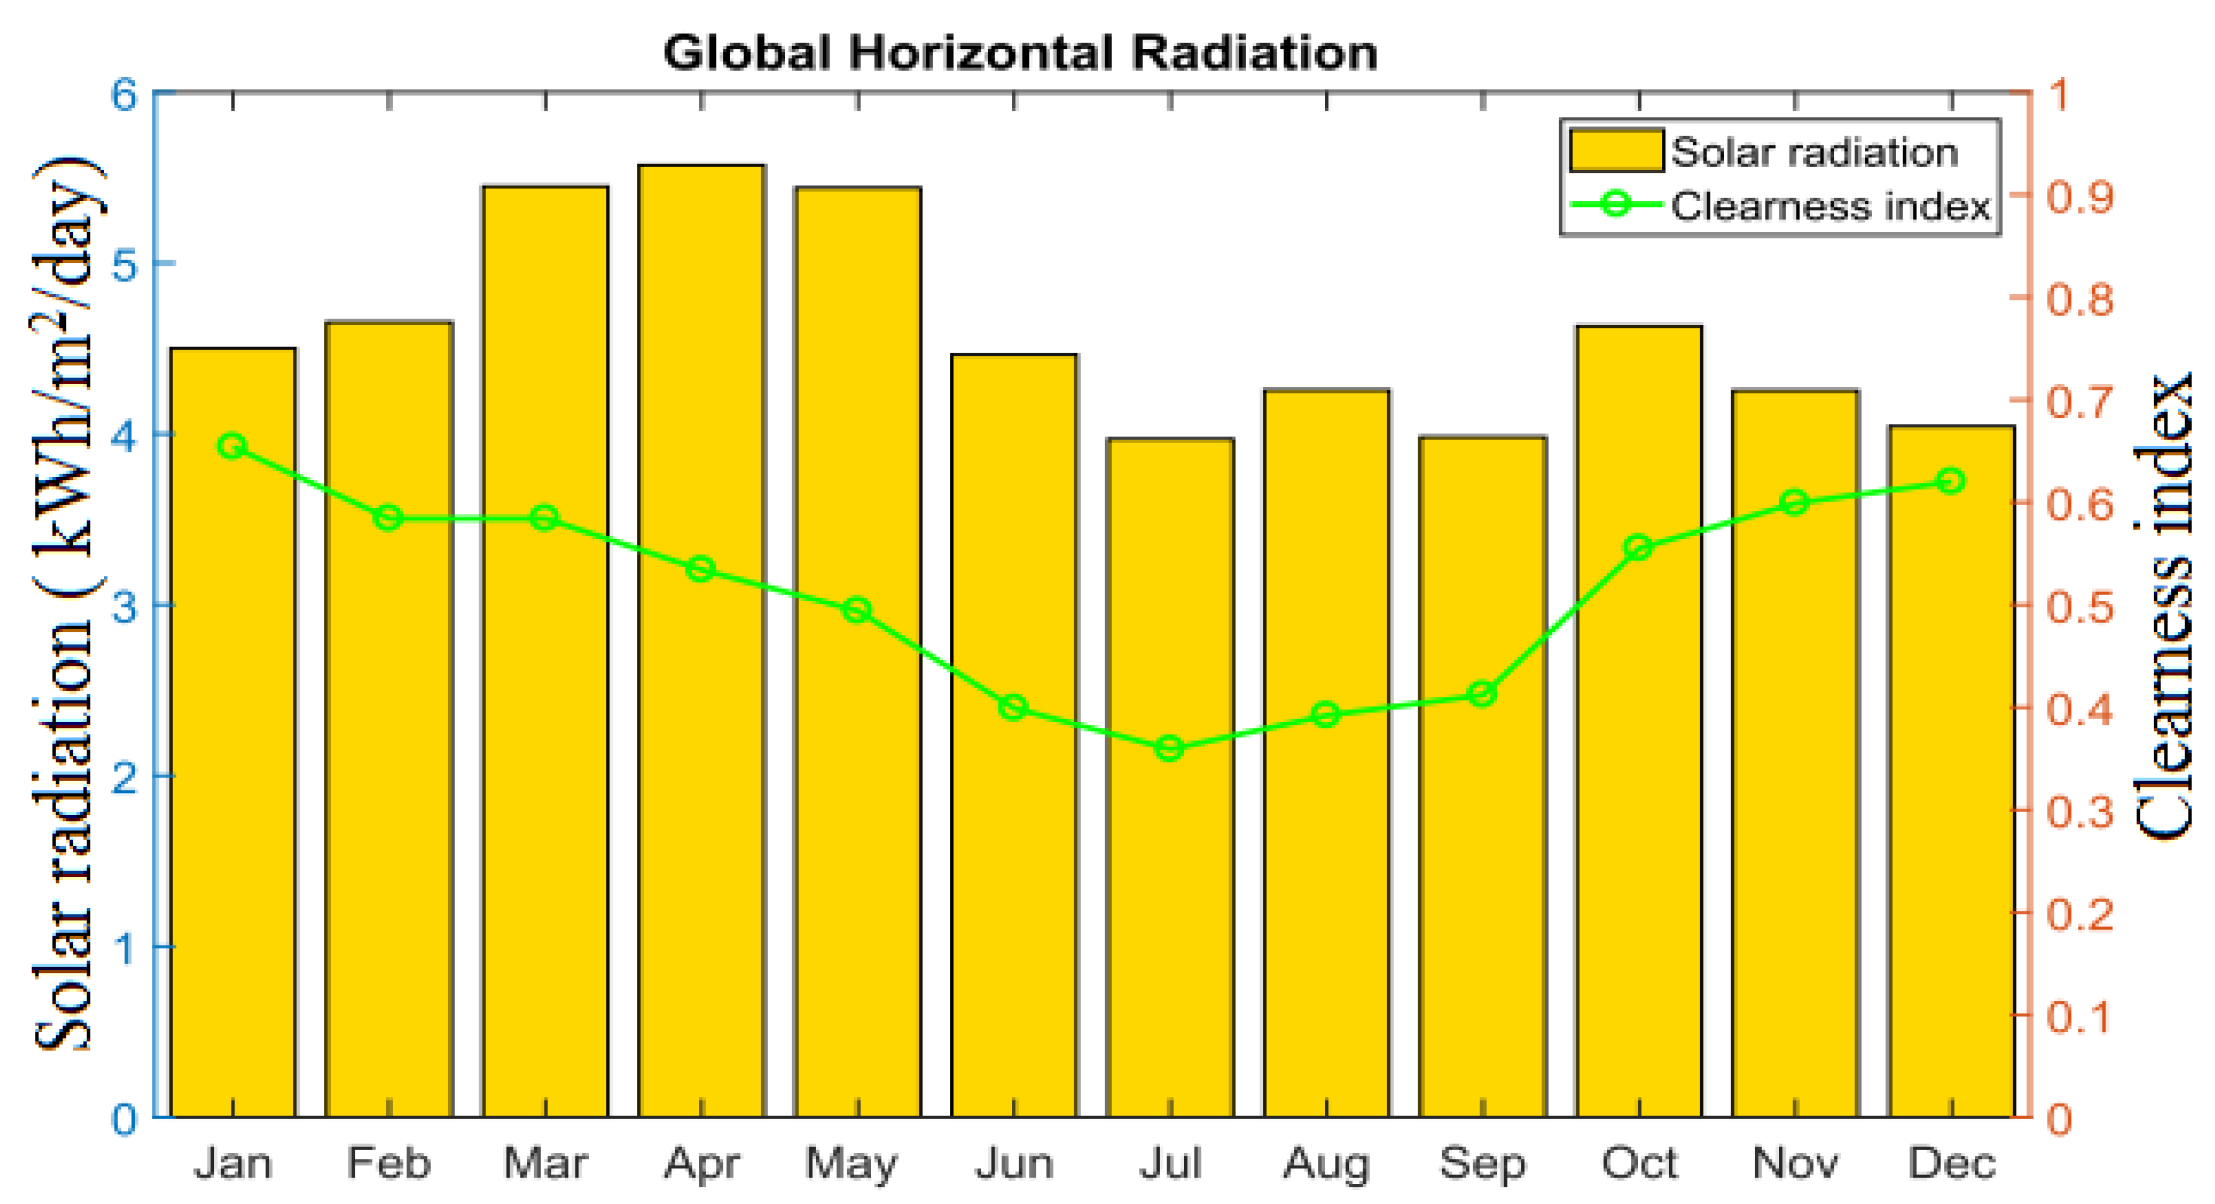
Figure 2.
Daily average solar intensity profile and clearness index of the selected area.
Figure 2.
Daily average solar intensity profile and clearness index of the selected area.
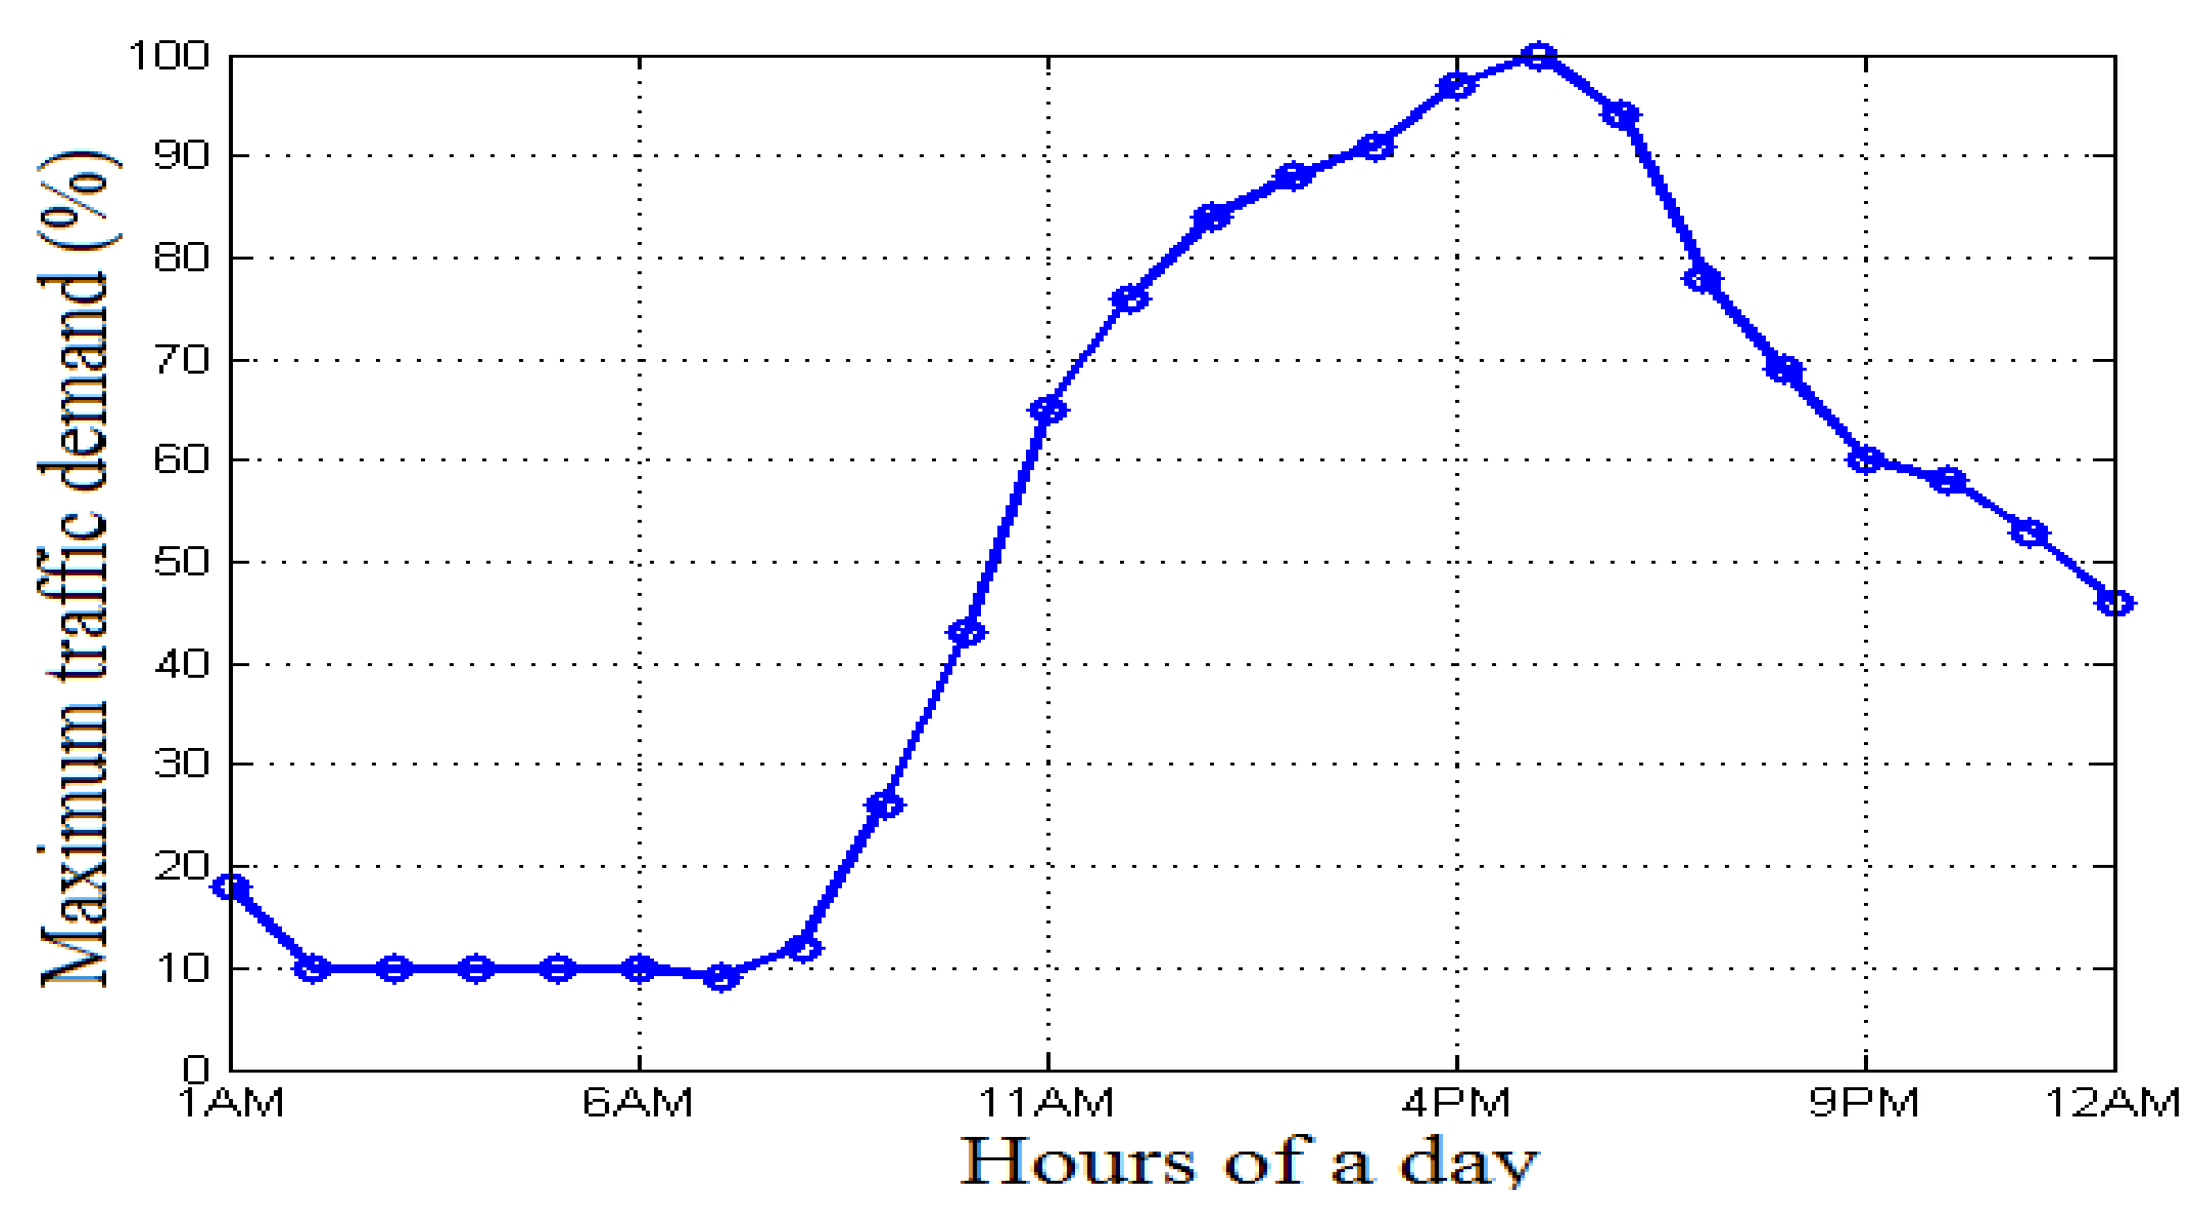
Figure 3.
Dynamic traffic profile over 24 h.
Figure 3.
Dynamic traffic profile over 24 h.
Figure 4.
Layout in HOMER for grid-tied macro-BS under = 10 MHz.
Figure 4.
Layout in HOMER for grid-tied macro-BS under = 10 MHz.
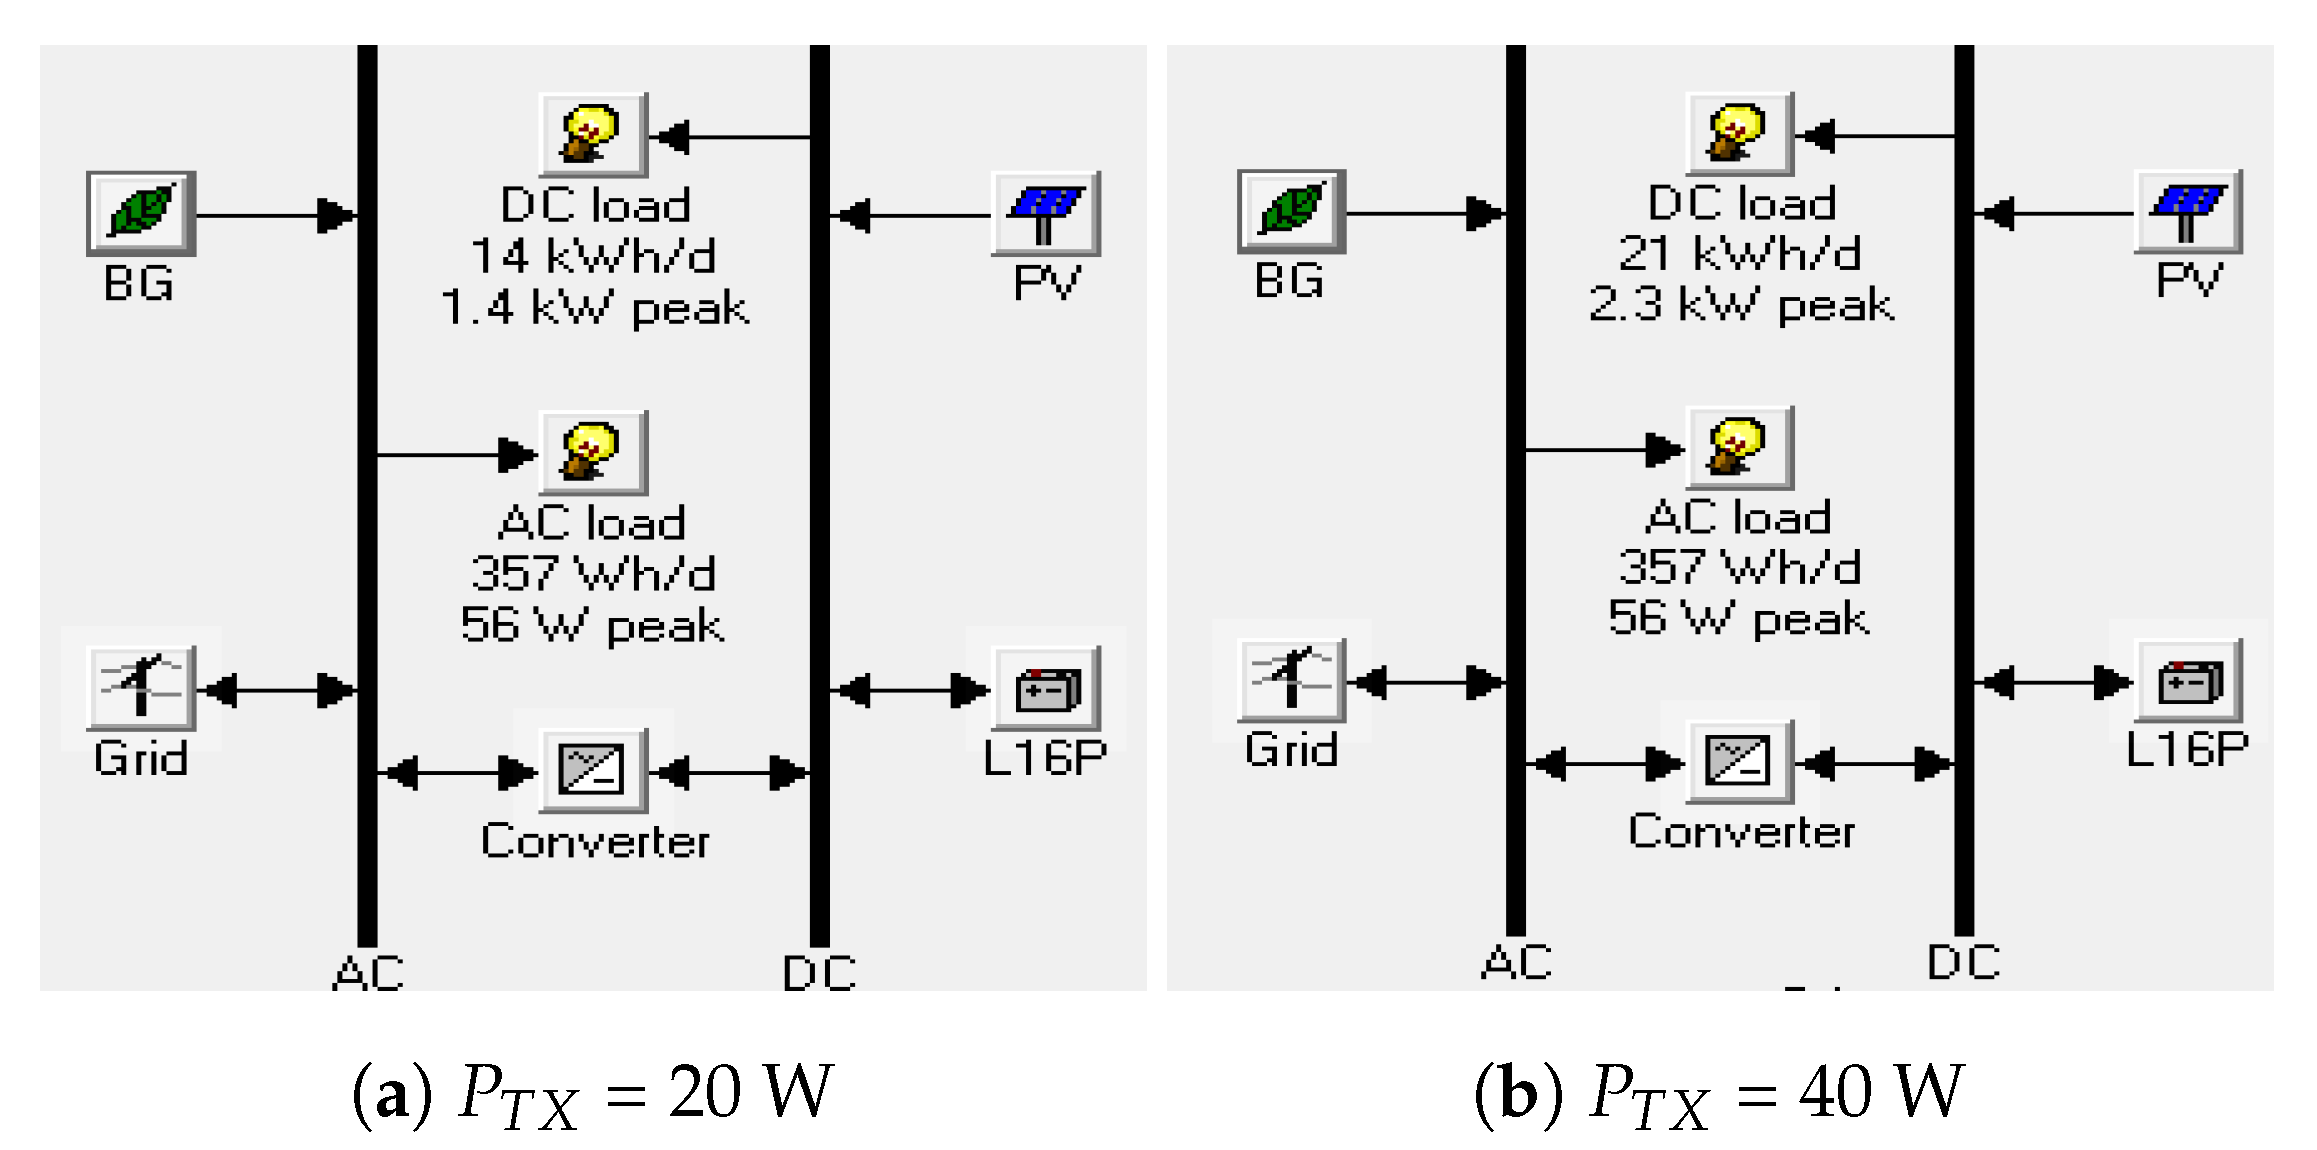
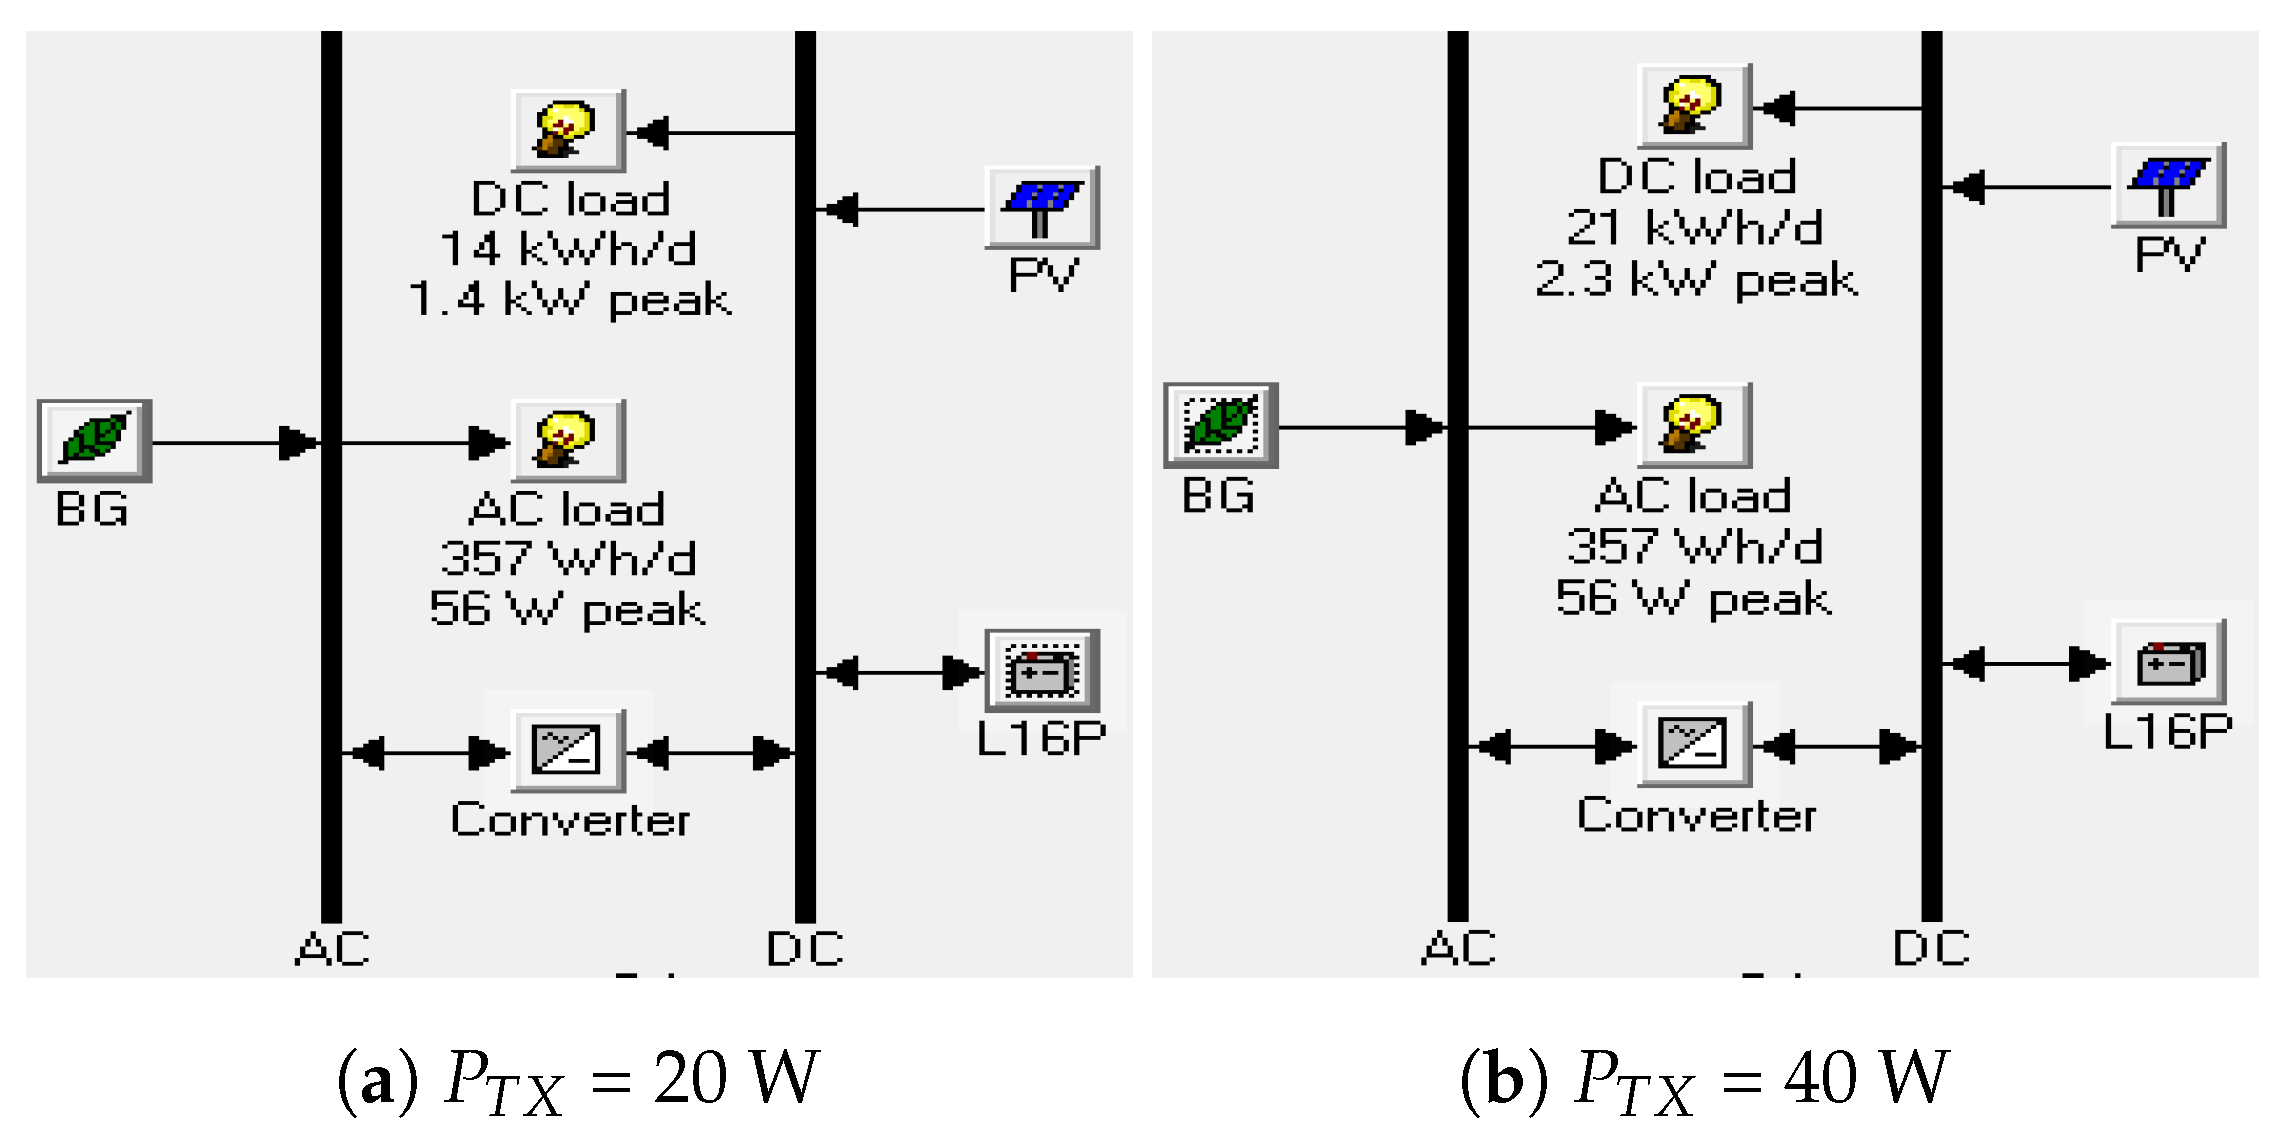
Figure 5.
Layout in HOMER for off-grid macro-BS under = 10 MHz.
Figure 5.
Layout in HOMER for off-grid macro-BS under = 10 MHz.
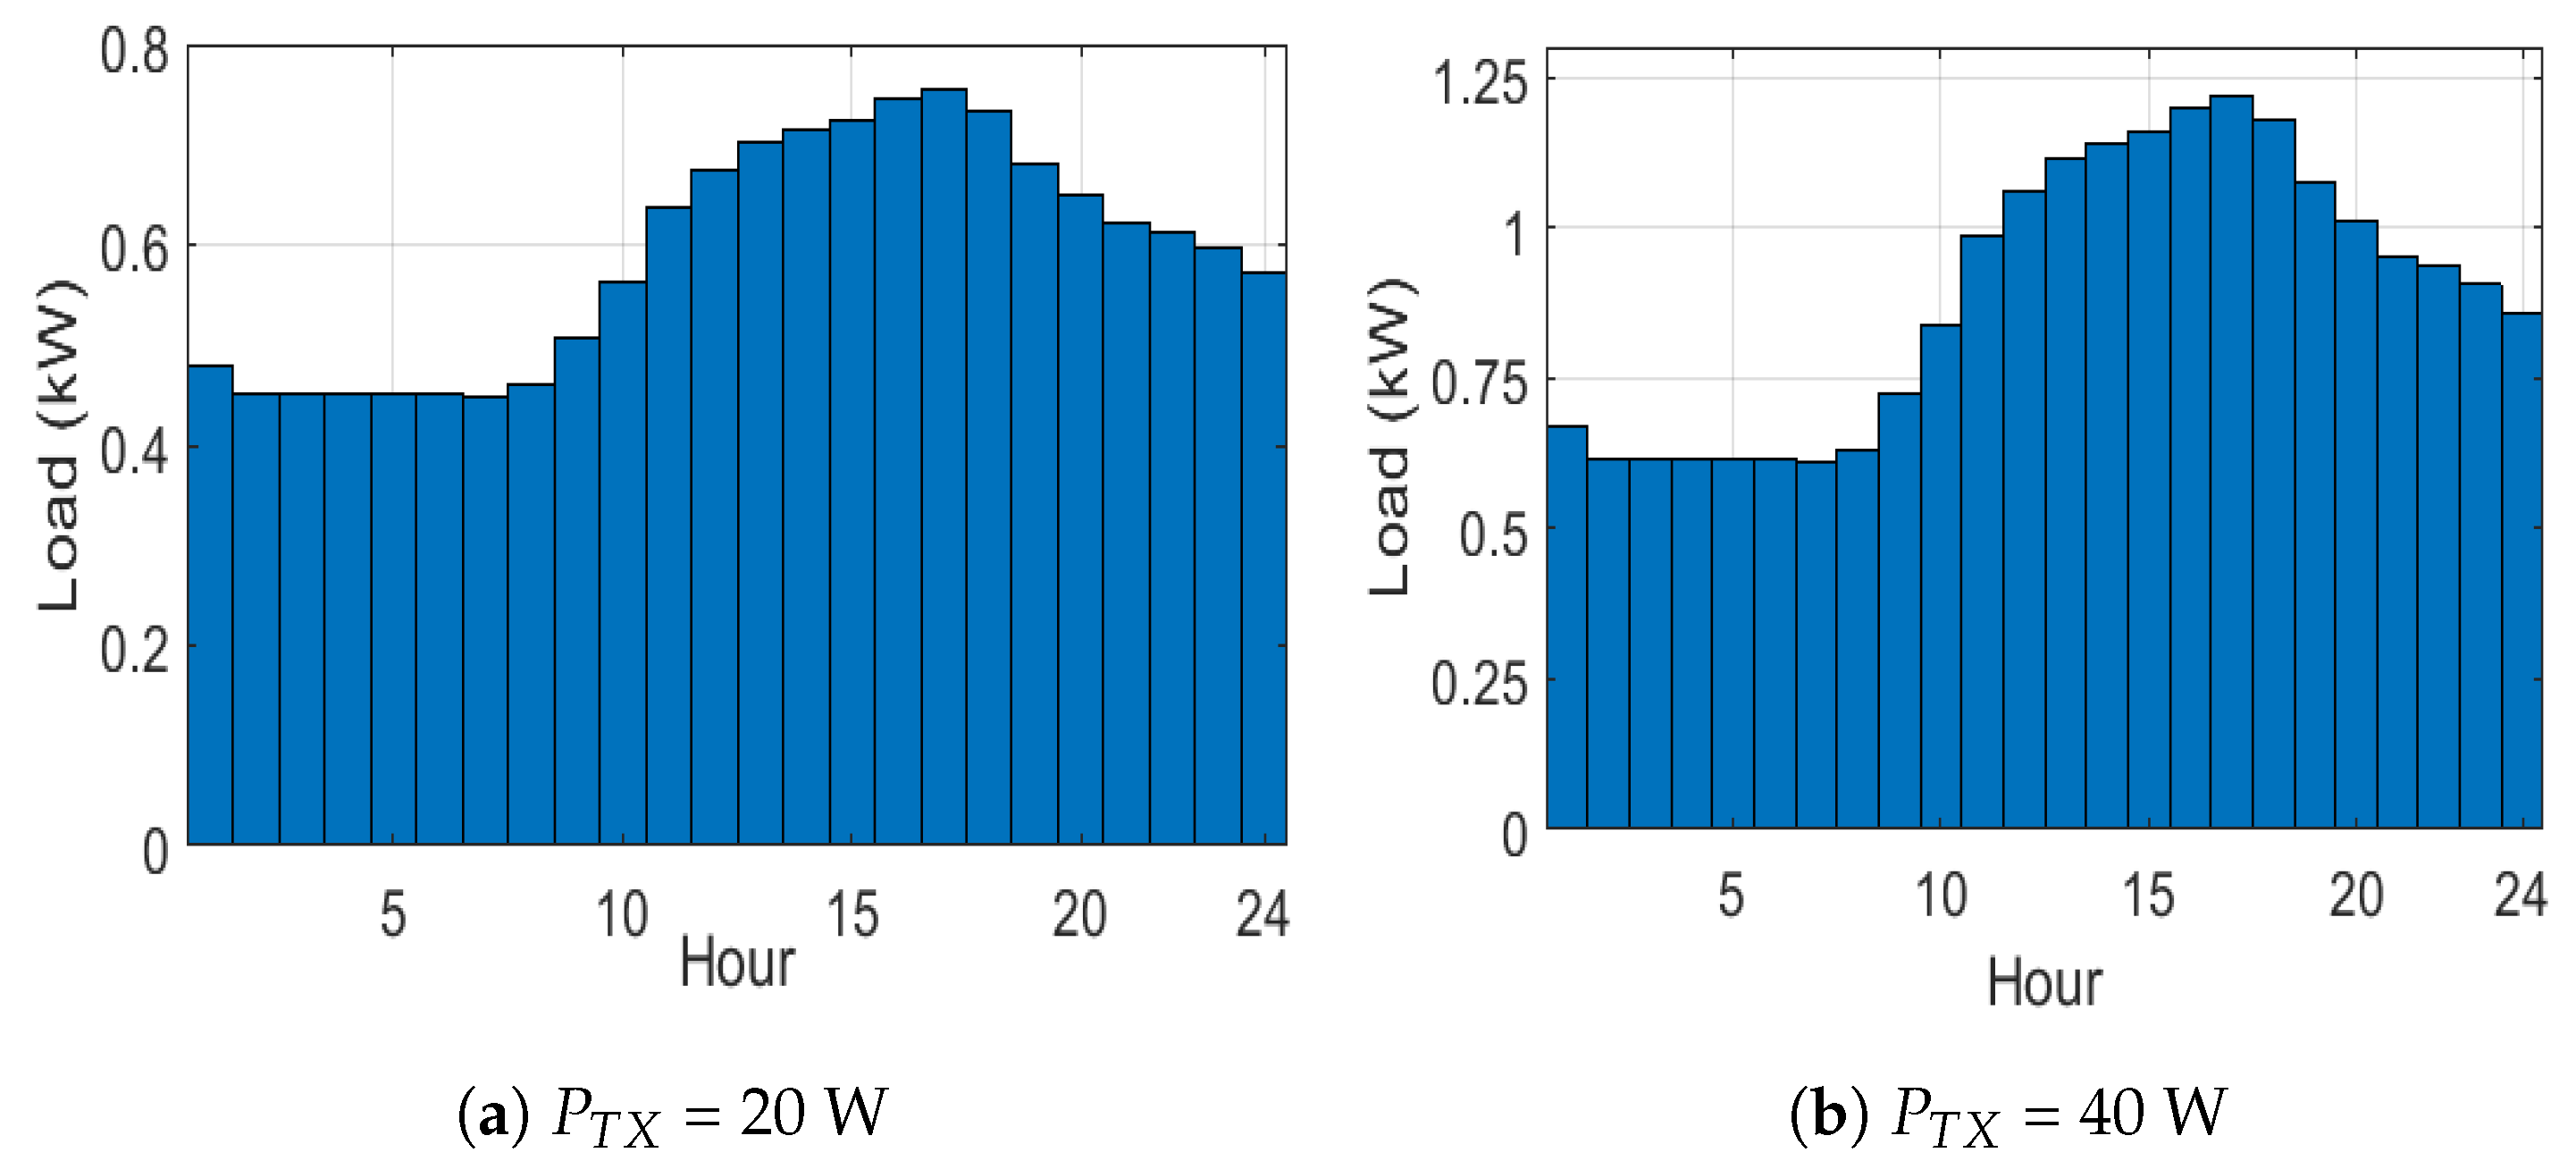
Figure 6.
DC load profile for macro-BS under = 10 MHz.
Figure 6.
DC load profile for macro-BS under = 10 MHz.
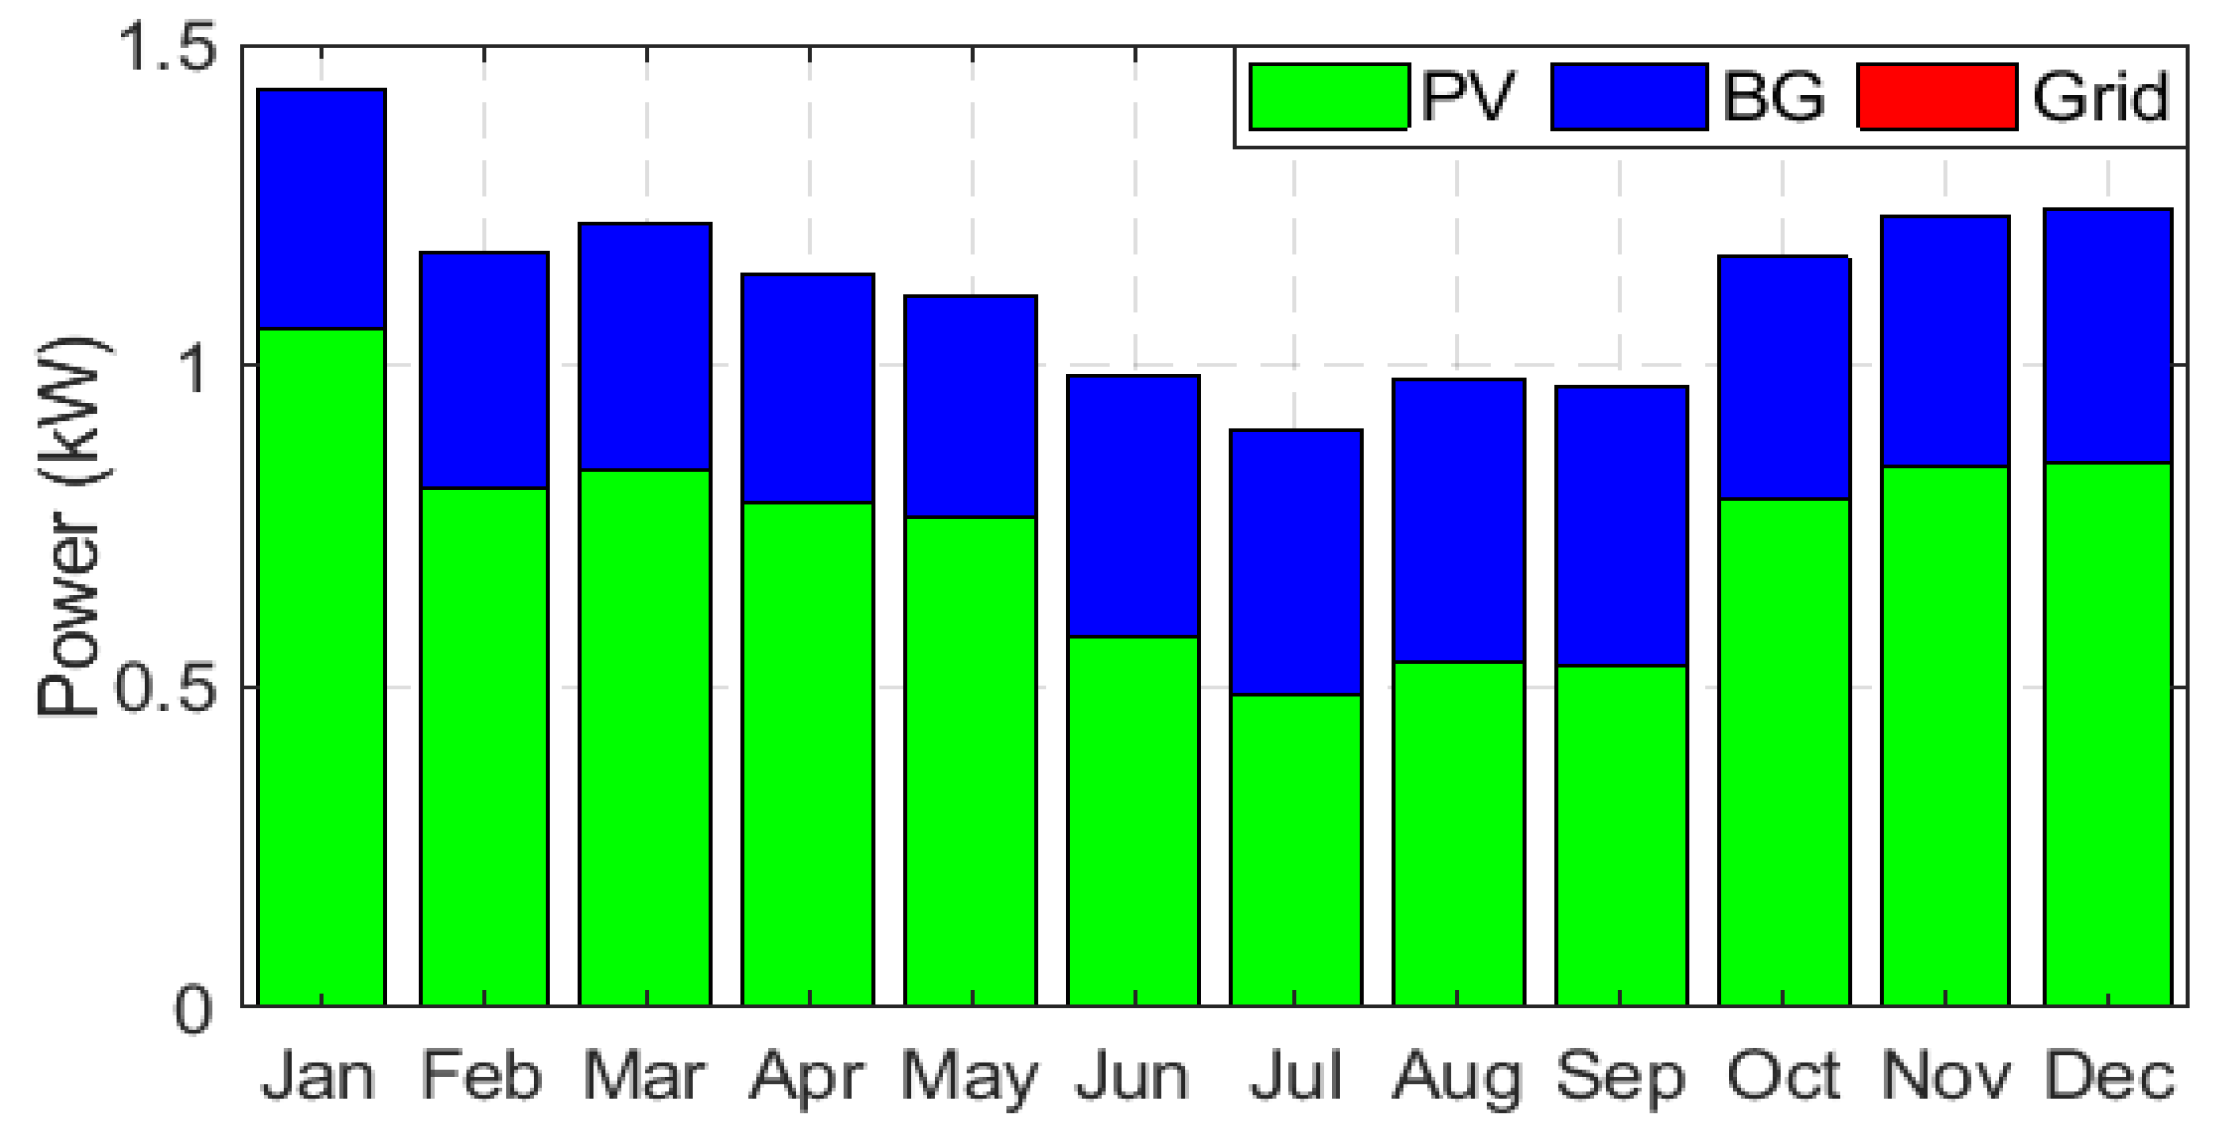
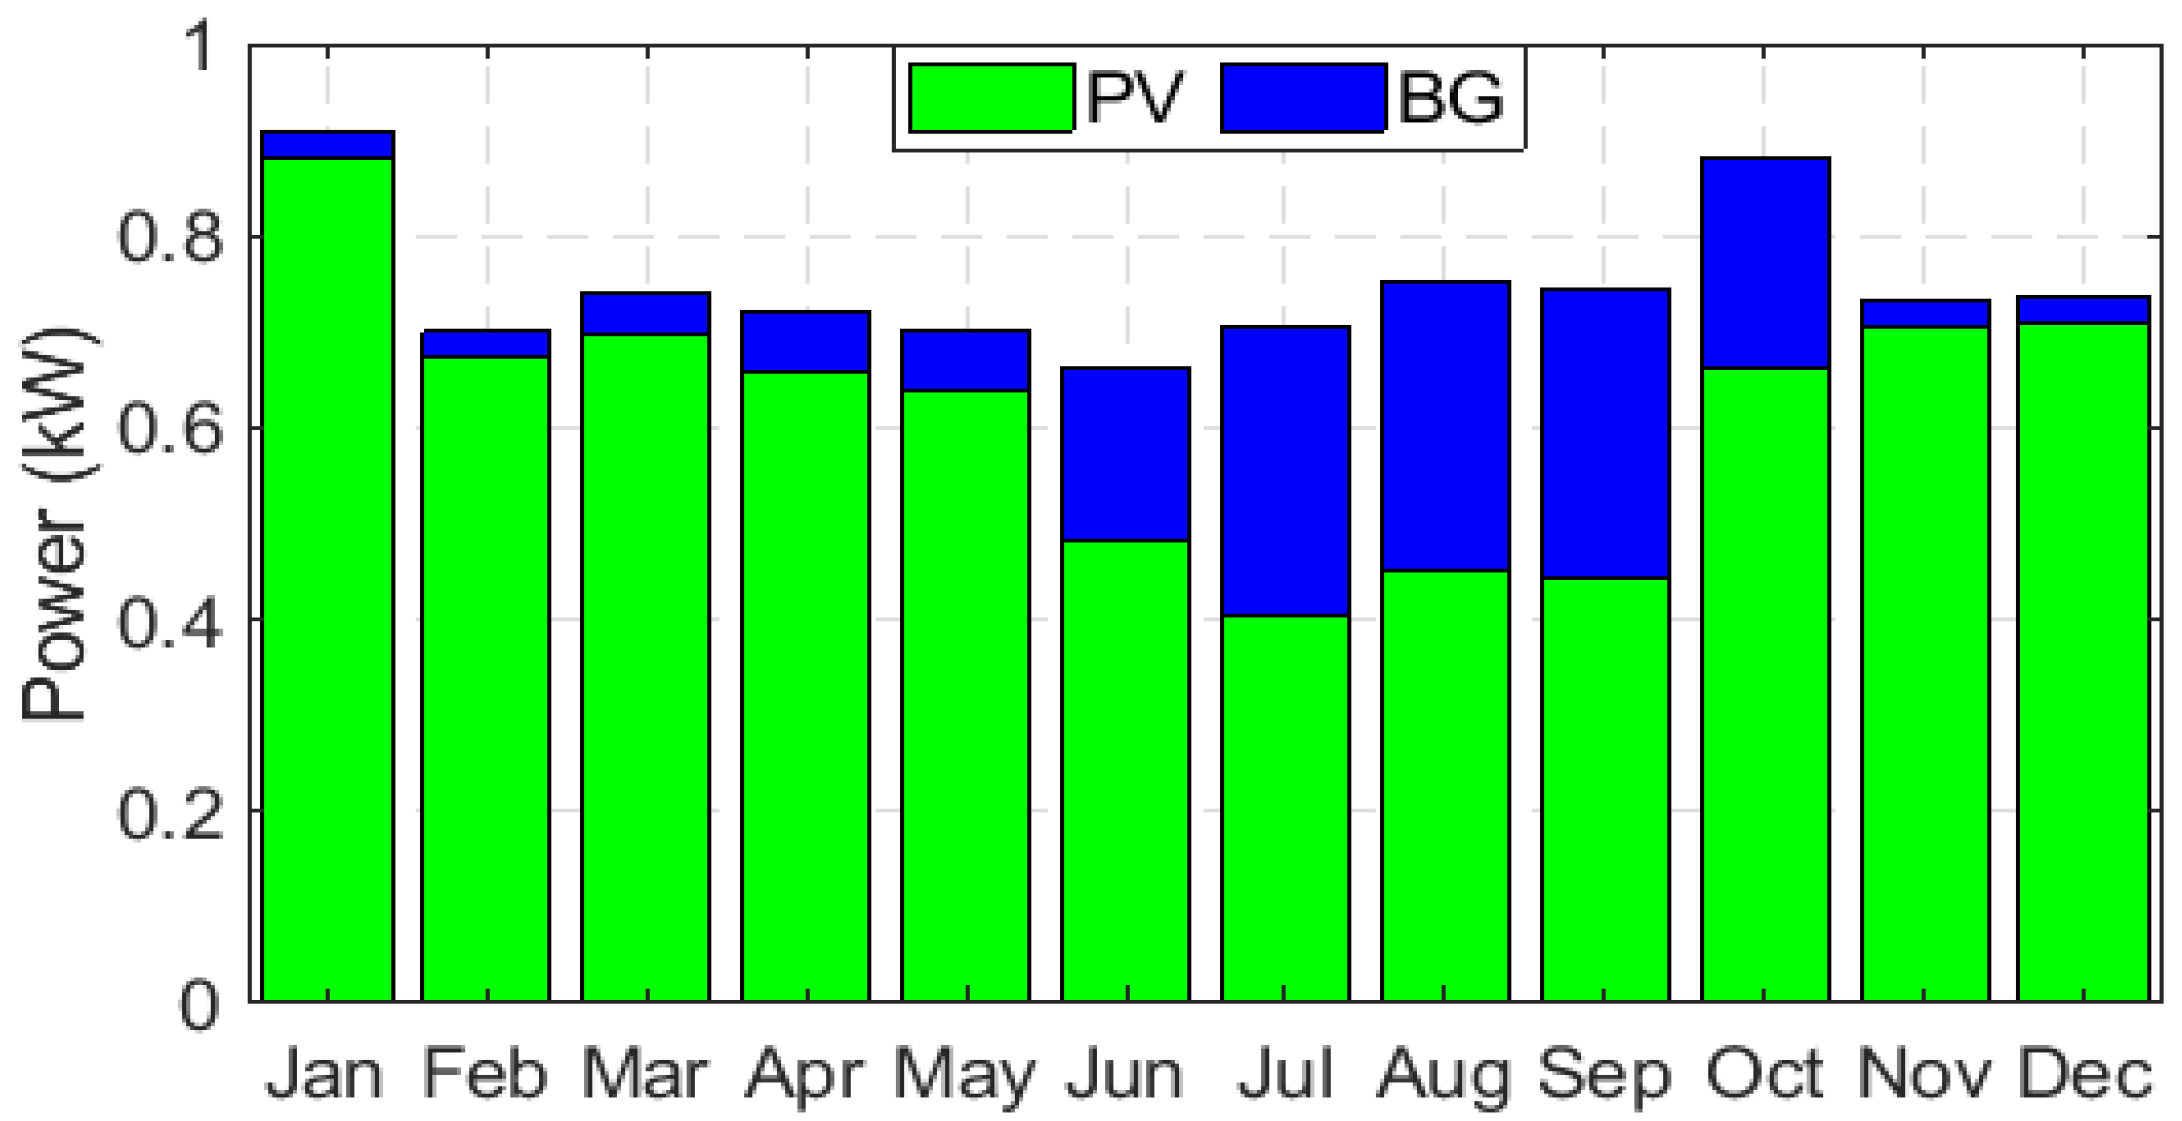
Figure 7.
Monthly data of power contribution by on-grid hybrid PV/BG for = 20 W and BW = 10 MHz.
Figure 7.
Monthly data of power contribution by on-grid hybrid PV/BG for = 20 W and BW = 10 MHz.
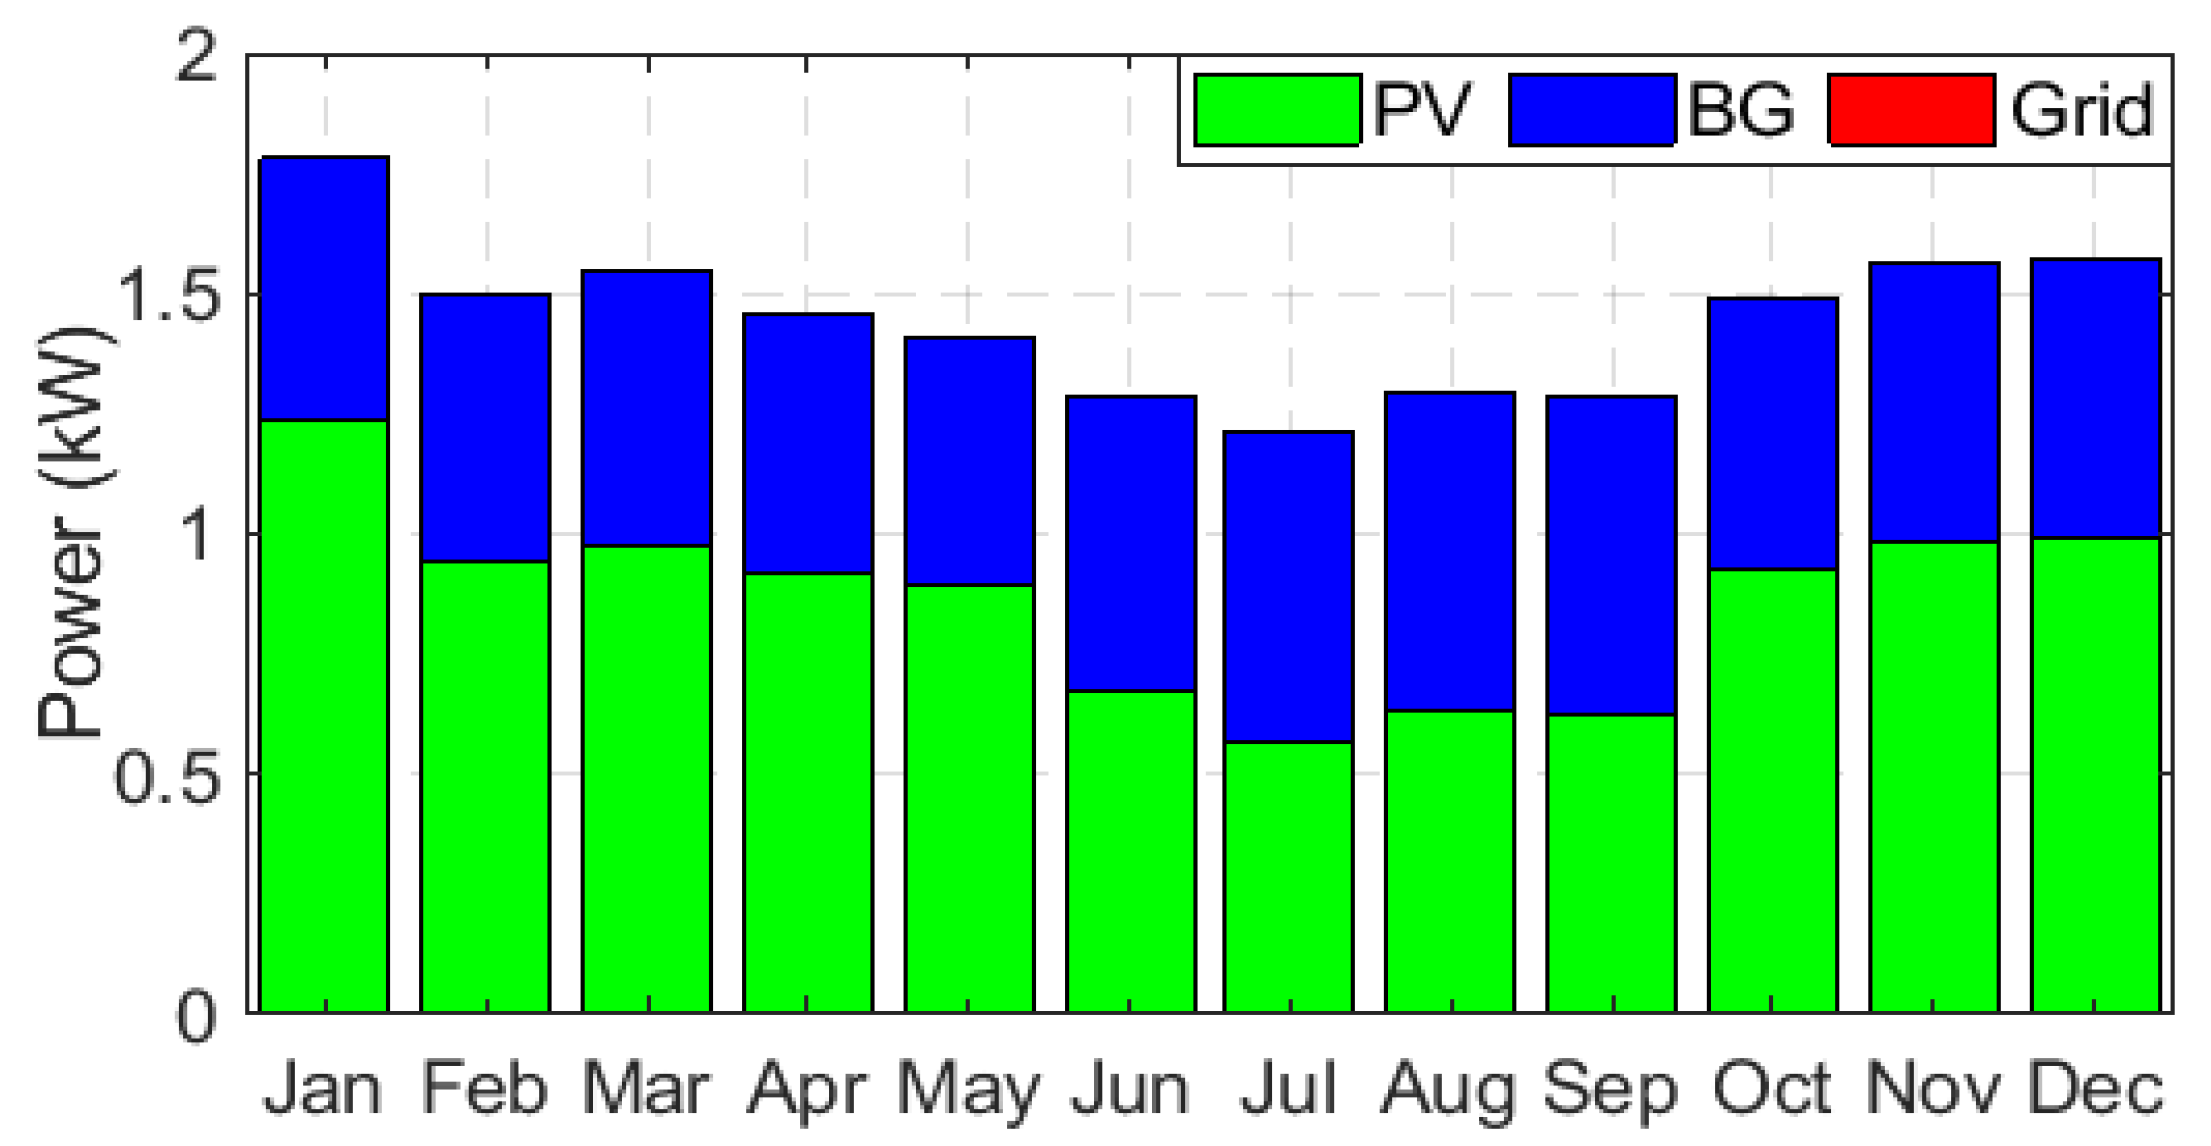
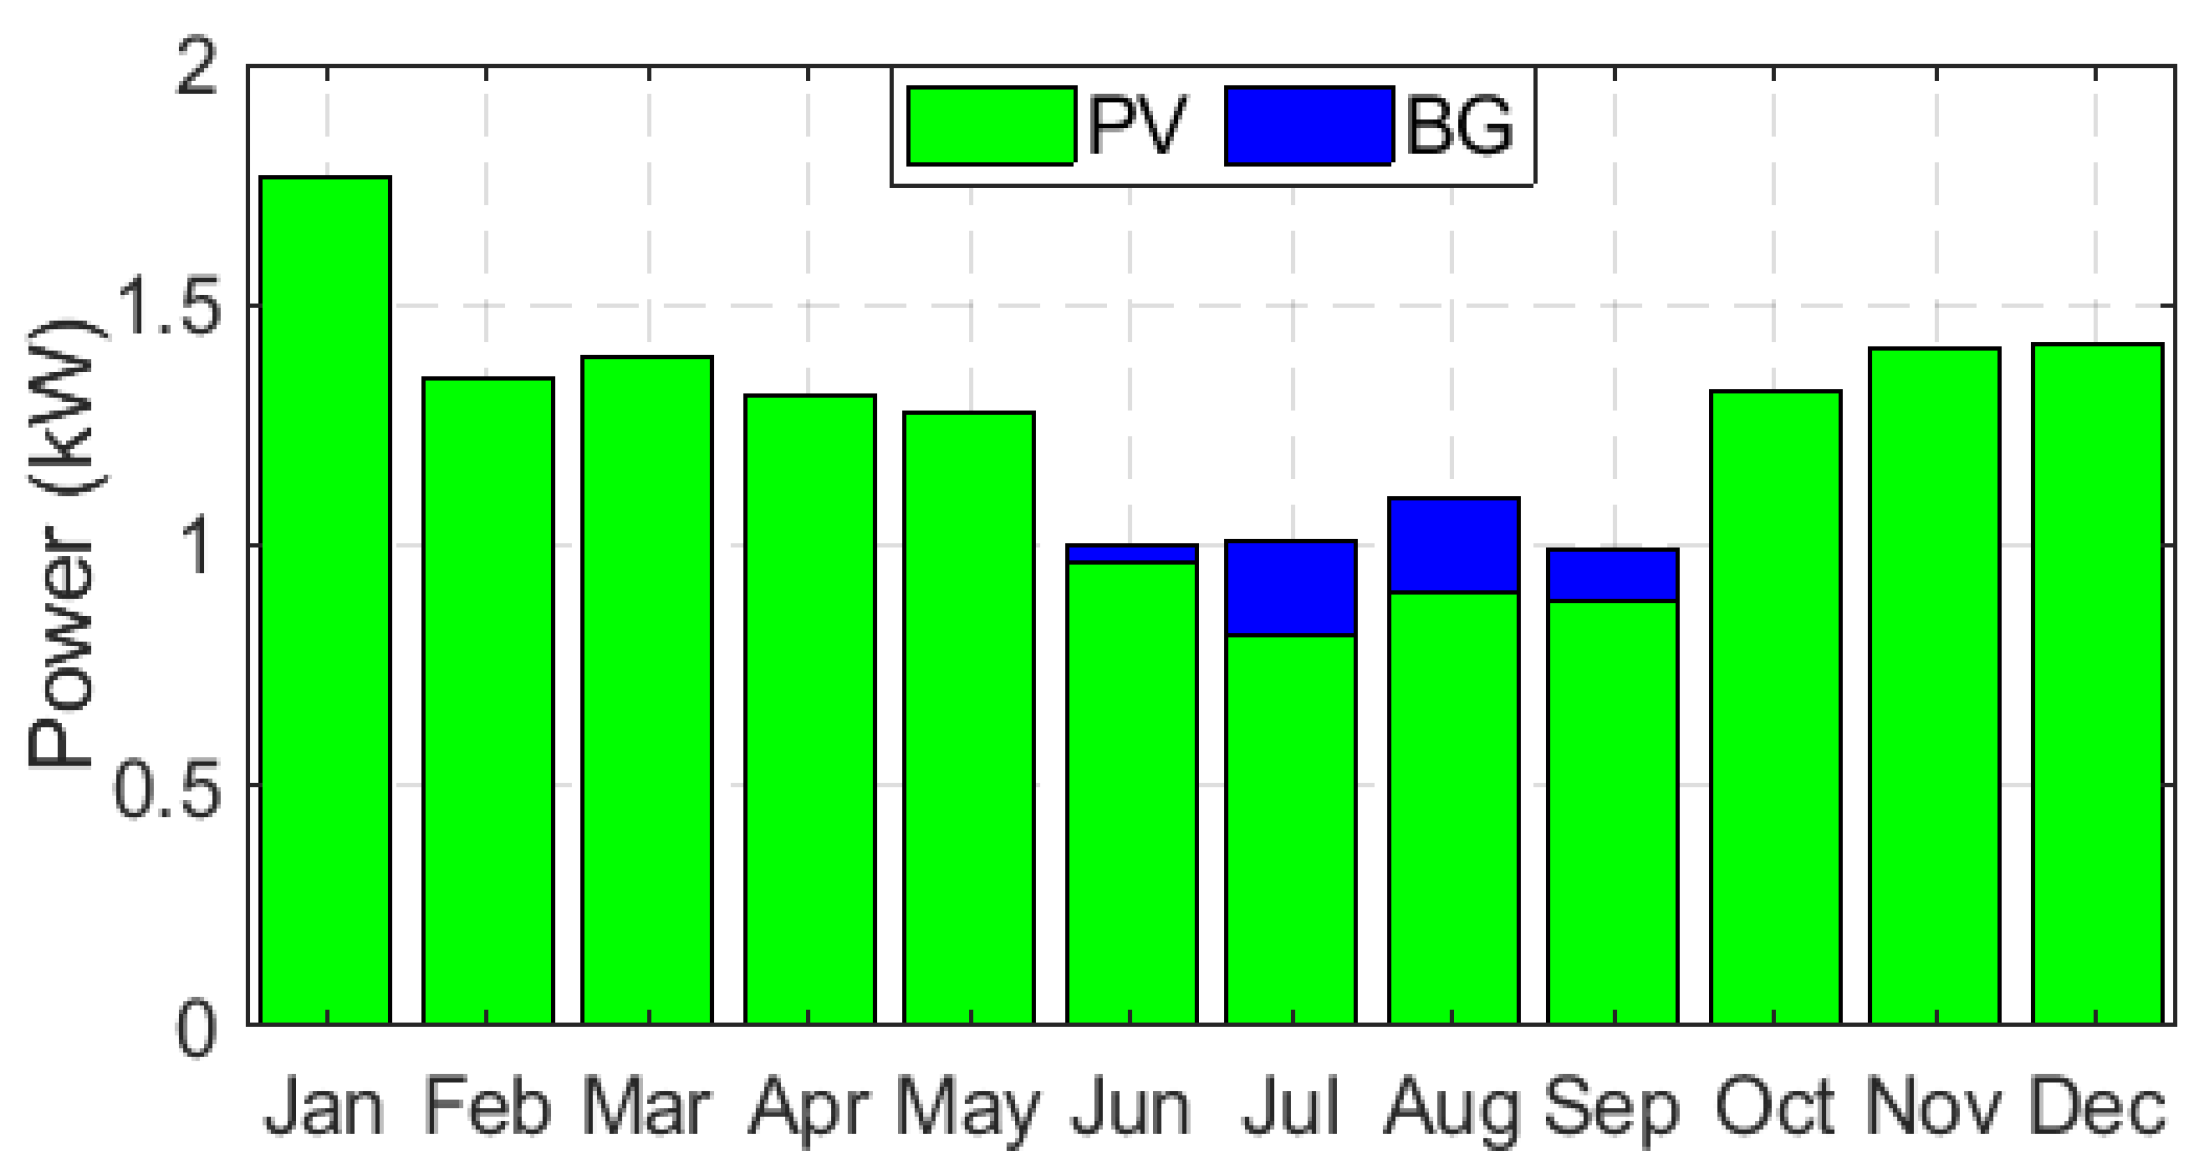
Figure 8.
Monthly data of power contribution by on-grid hybrid PV/BG for = 40 W and BW = 10 MHz.
Figure 8.
Monthly data of power contribution by on-grid hybrid PV/BG for = 40 W and BW = 10 MHz.
Figure 9.
Monthly data of power contribution by off-grid hybrid PV/BG for = 20 W and BW = 10 MHz.
Figure 9.
Monthly data of power contribution by off-grid hybrid PV/BG for = 20 W and BW = 10 MHz.
Figure 10.
Monthly data of power contribution by off-grid hybrid PV/BG for = 40 W and BW = 10 MHz.
Figure 10.
Monthly data of power contribution by off-grid hybrid PV/BG for = 40 W and BW = 10 MHz.
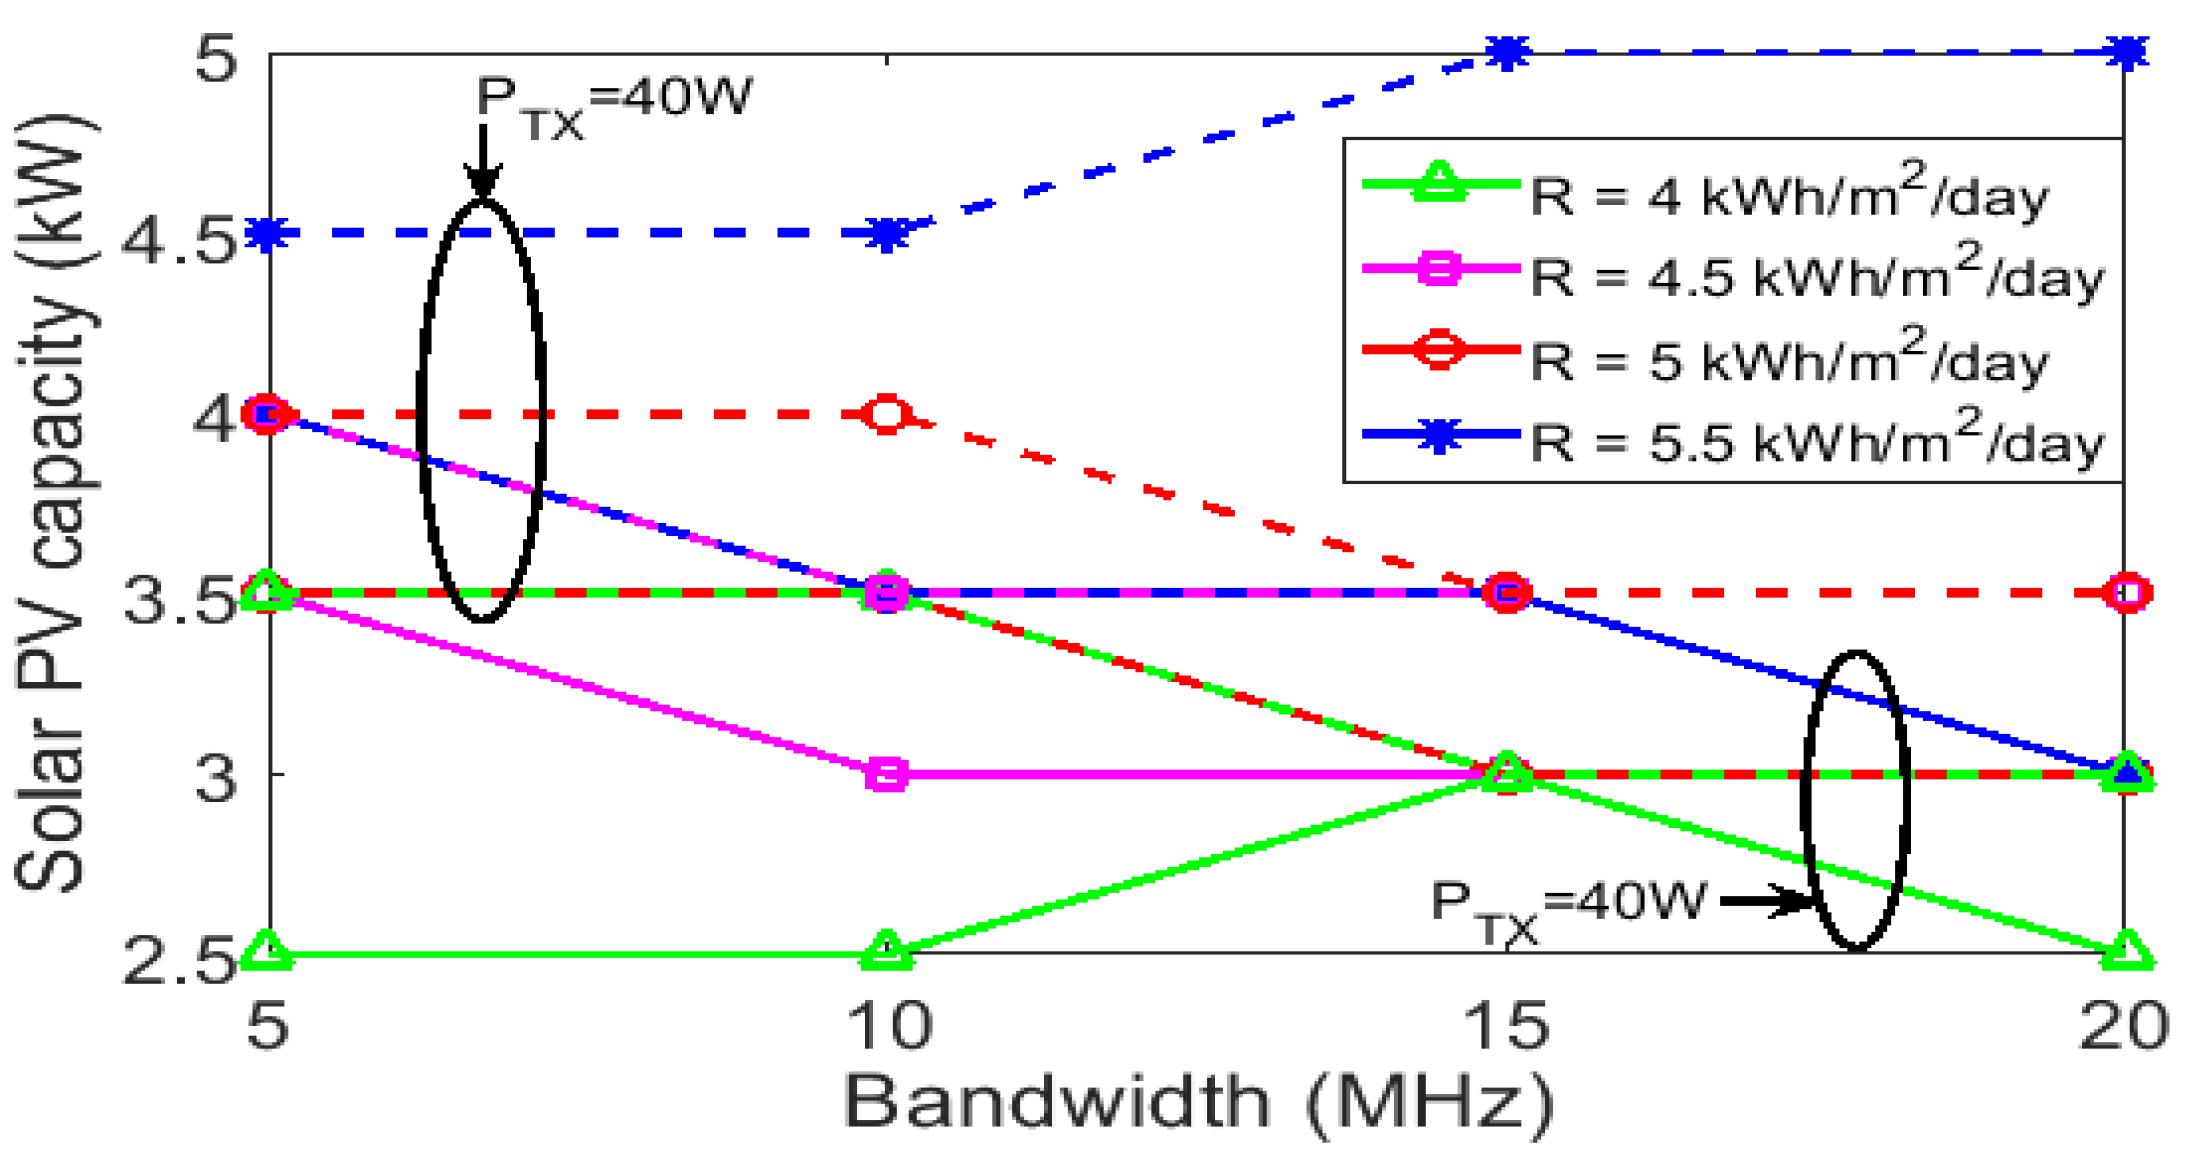
Figure 11.
Solar PV panel capacity for the grid-tied hybrid PV/BG system under different solar intensity.
Figure 11.
Solar PV panel capacity for the grid-tied hybrid PV/BG system under different solar intensity.
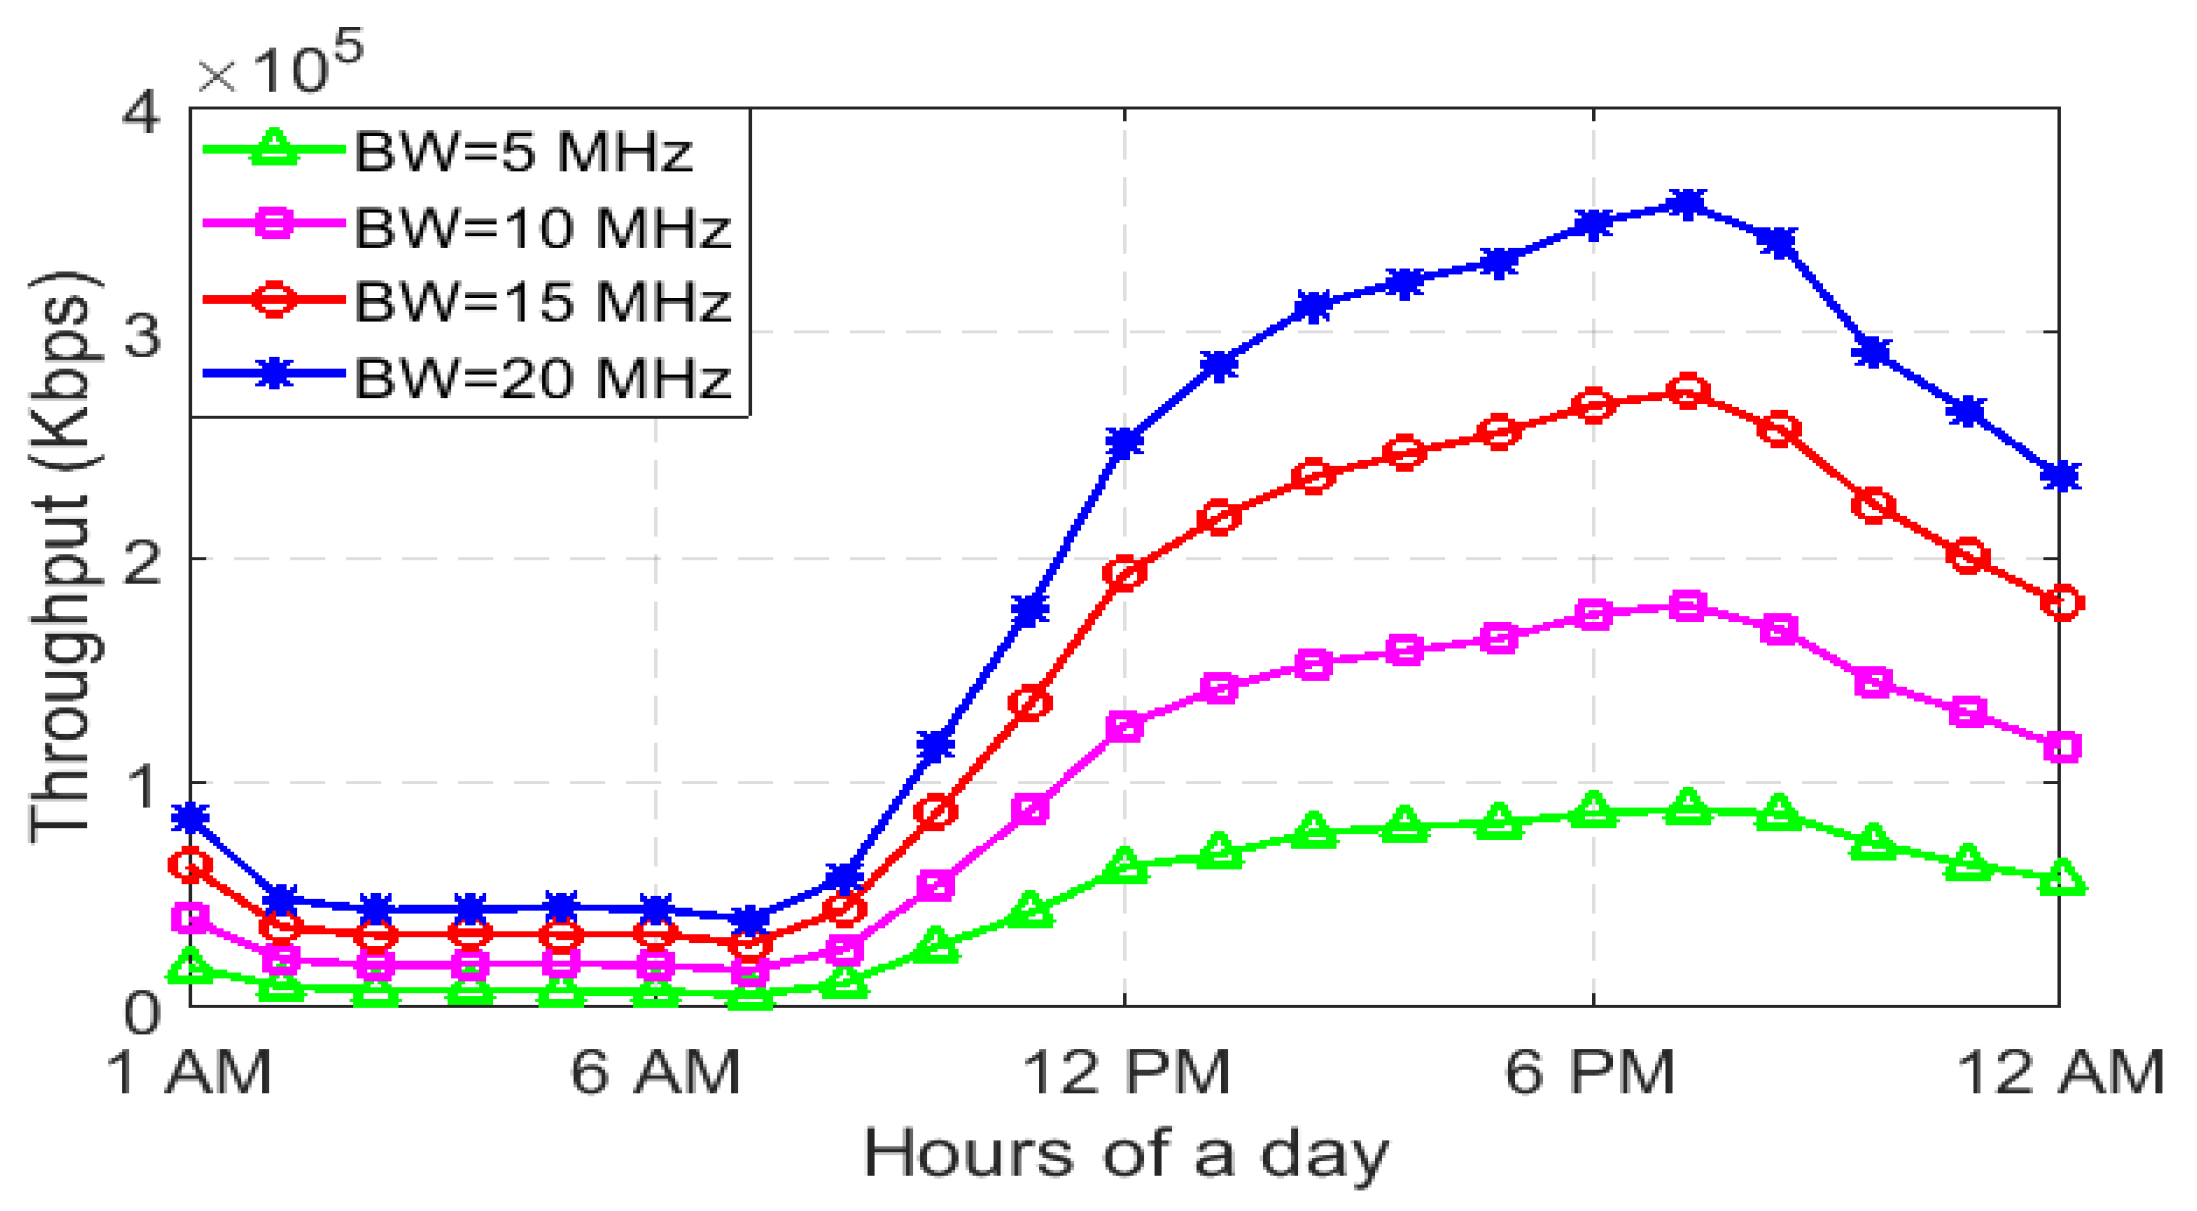
Figure 12.
A quantitative comparison of throughput performance under different system bandwidth.
Figure 12.
A quantitative comparison of throughput performance under different system bandwidth.
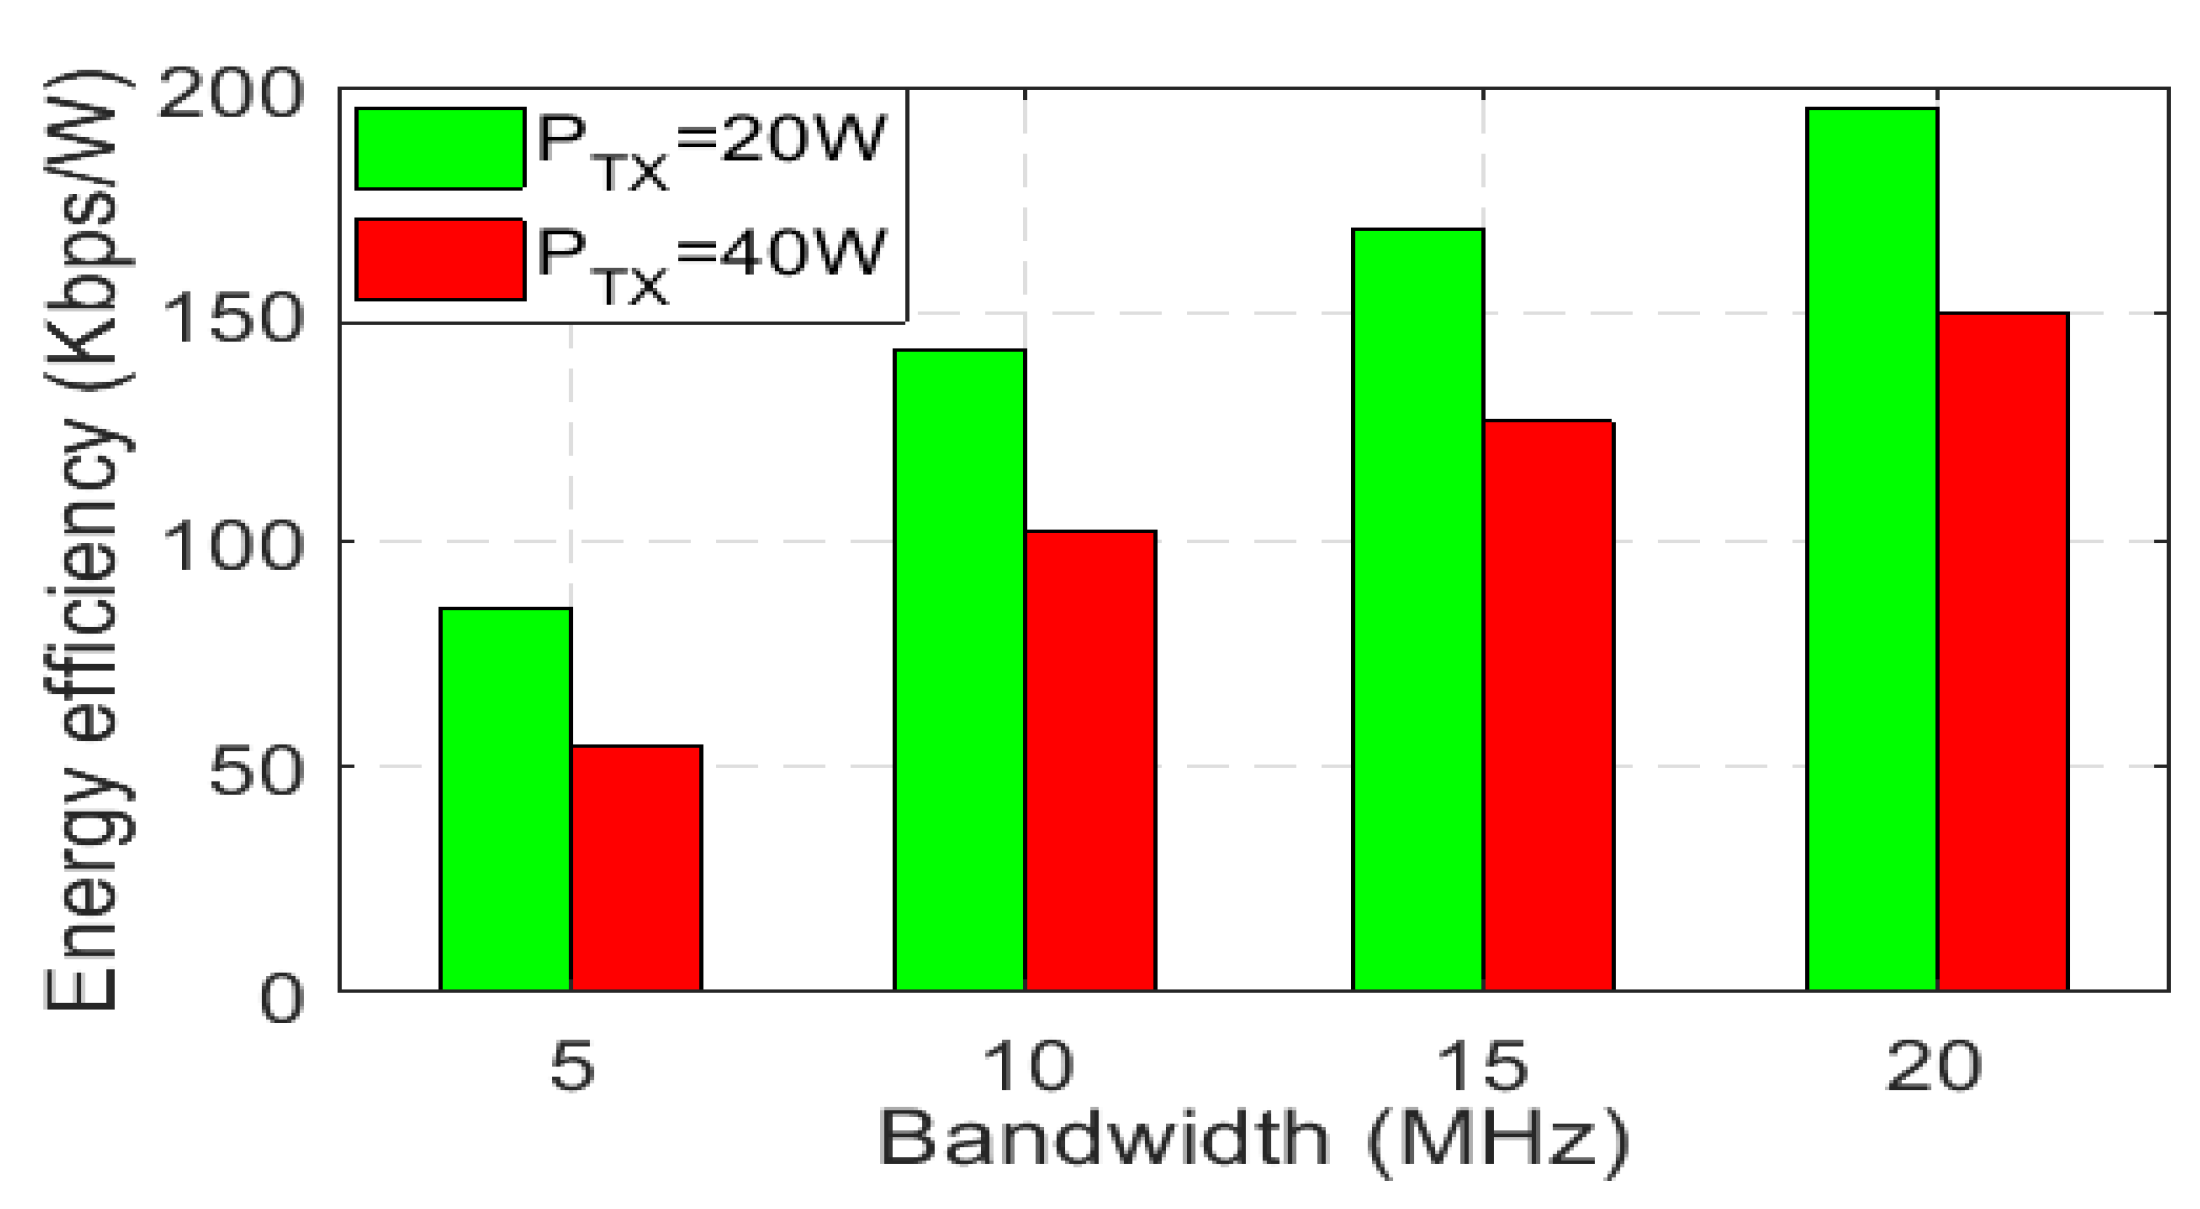
Figure 13.
A quantitative comparison of EE performance under different system bandwidth.
Figure 13.
A quantitative comparison of EE performance under different system bandwidth.
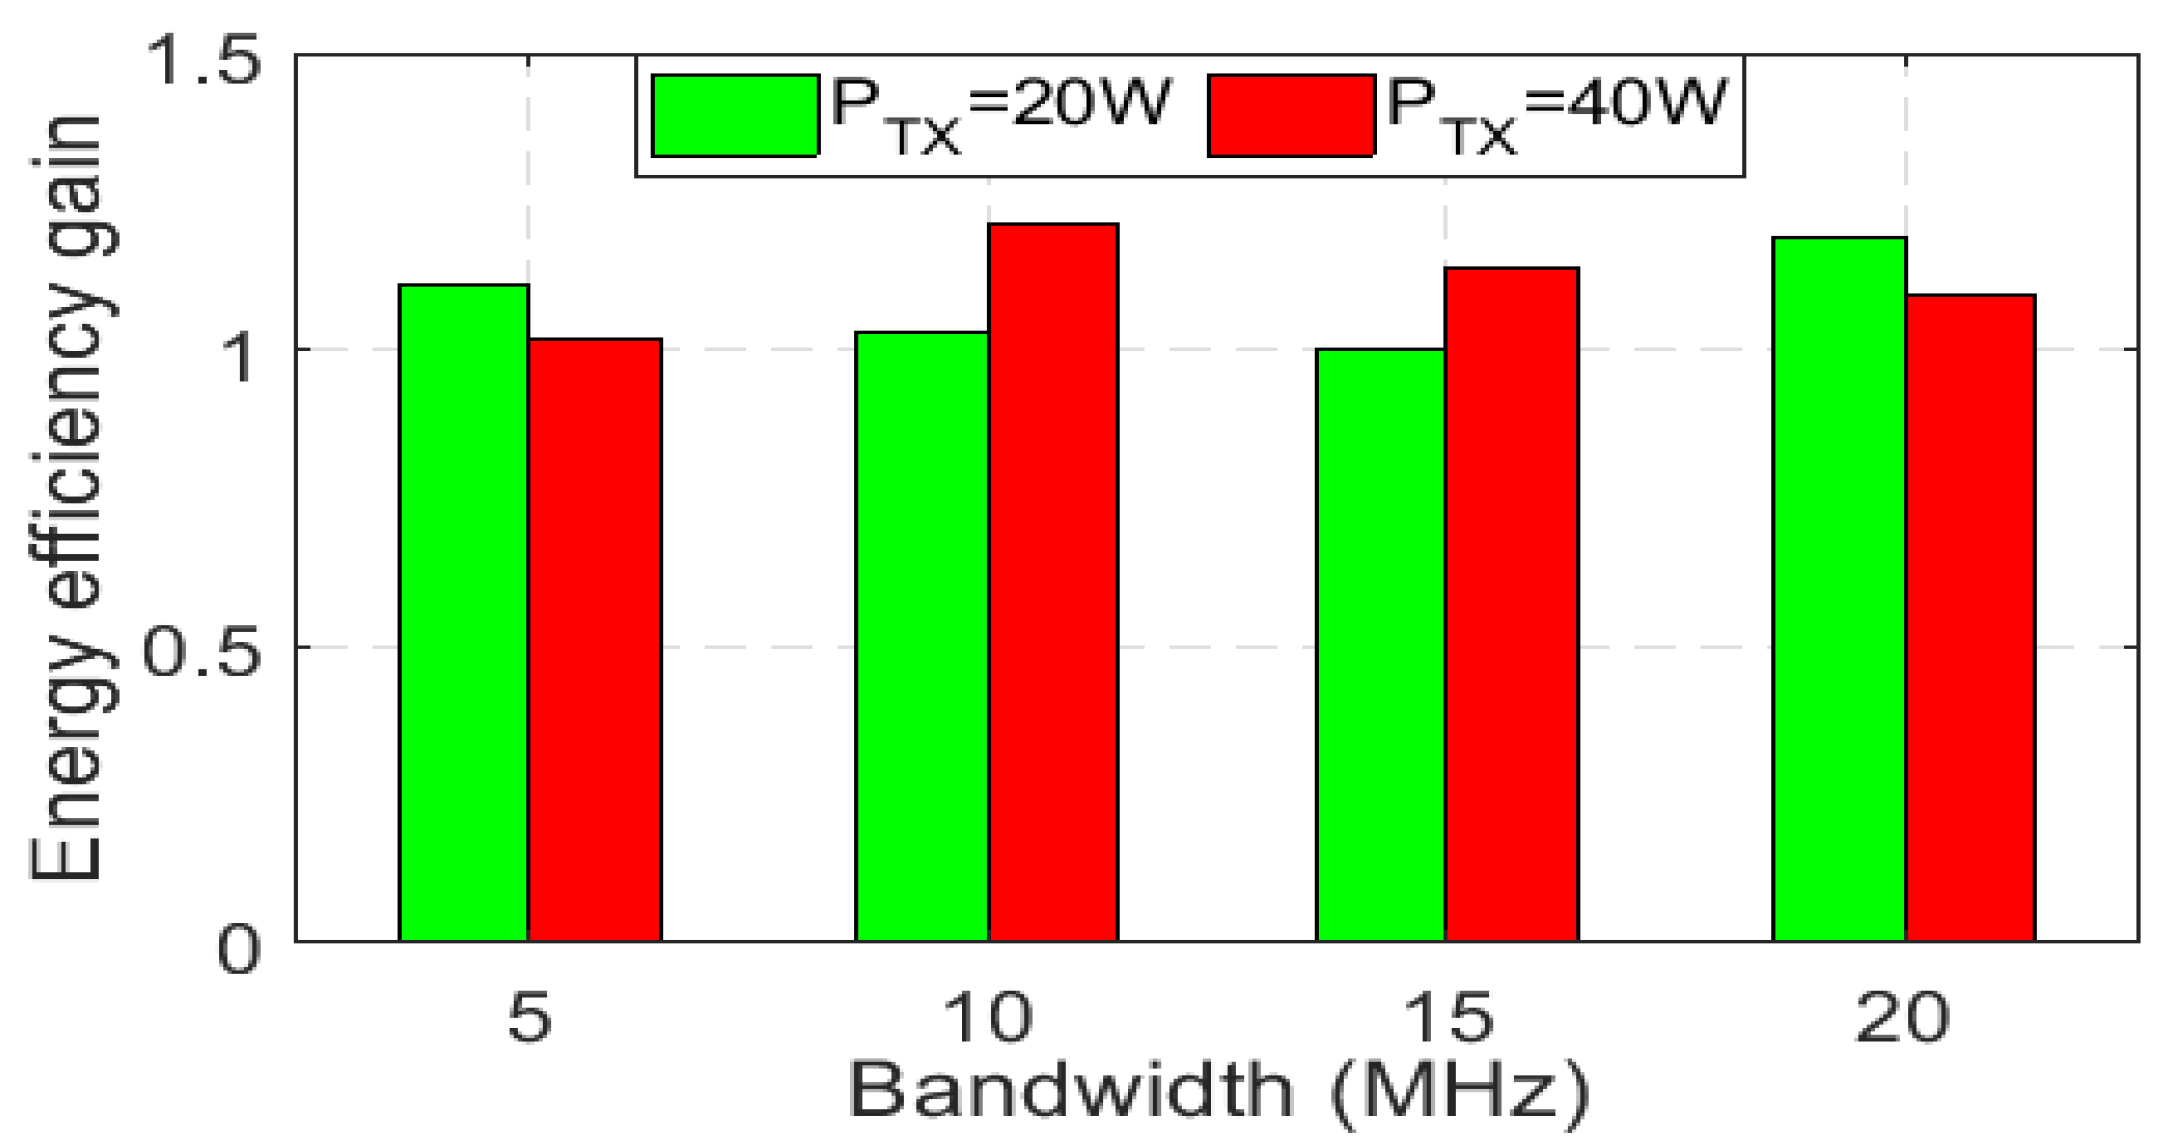
Figure 14.
A quantitative comparison of EE gain performance under different system bandwidth.
Figure 14.
A quantitative comparison of EE gain performance under different system bandwidth.
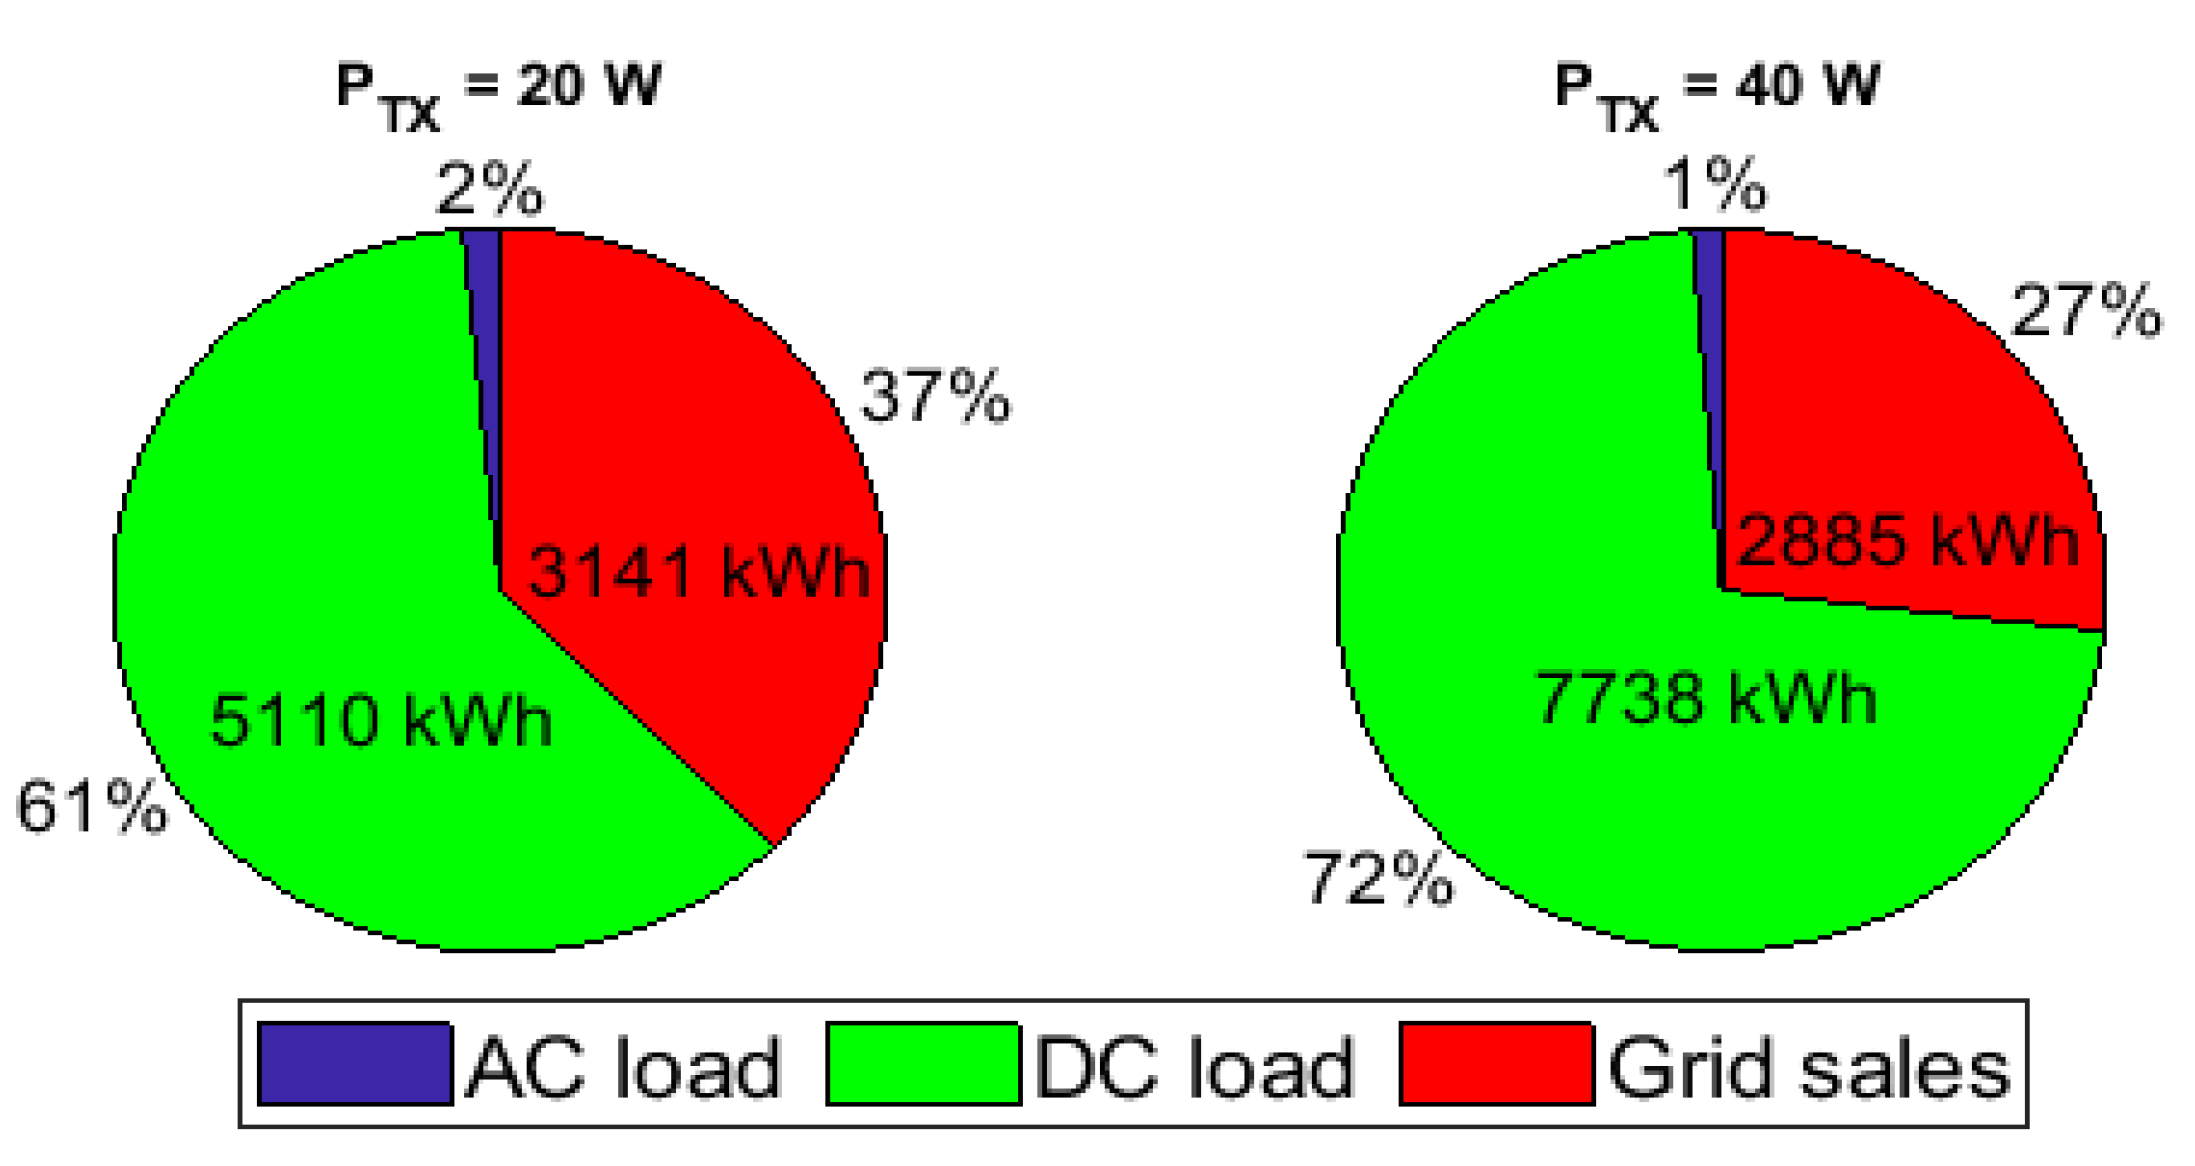
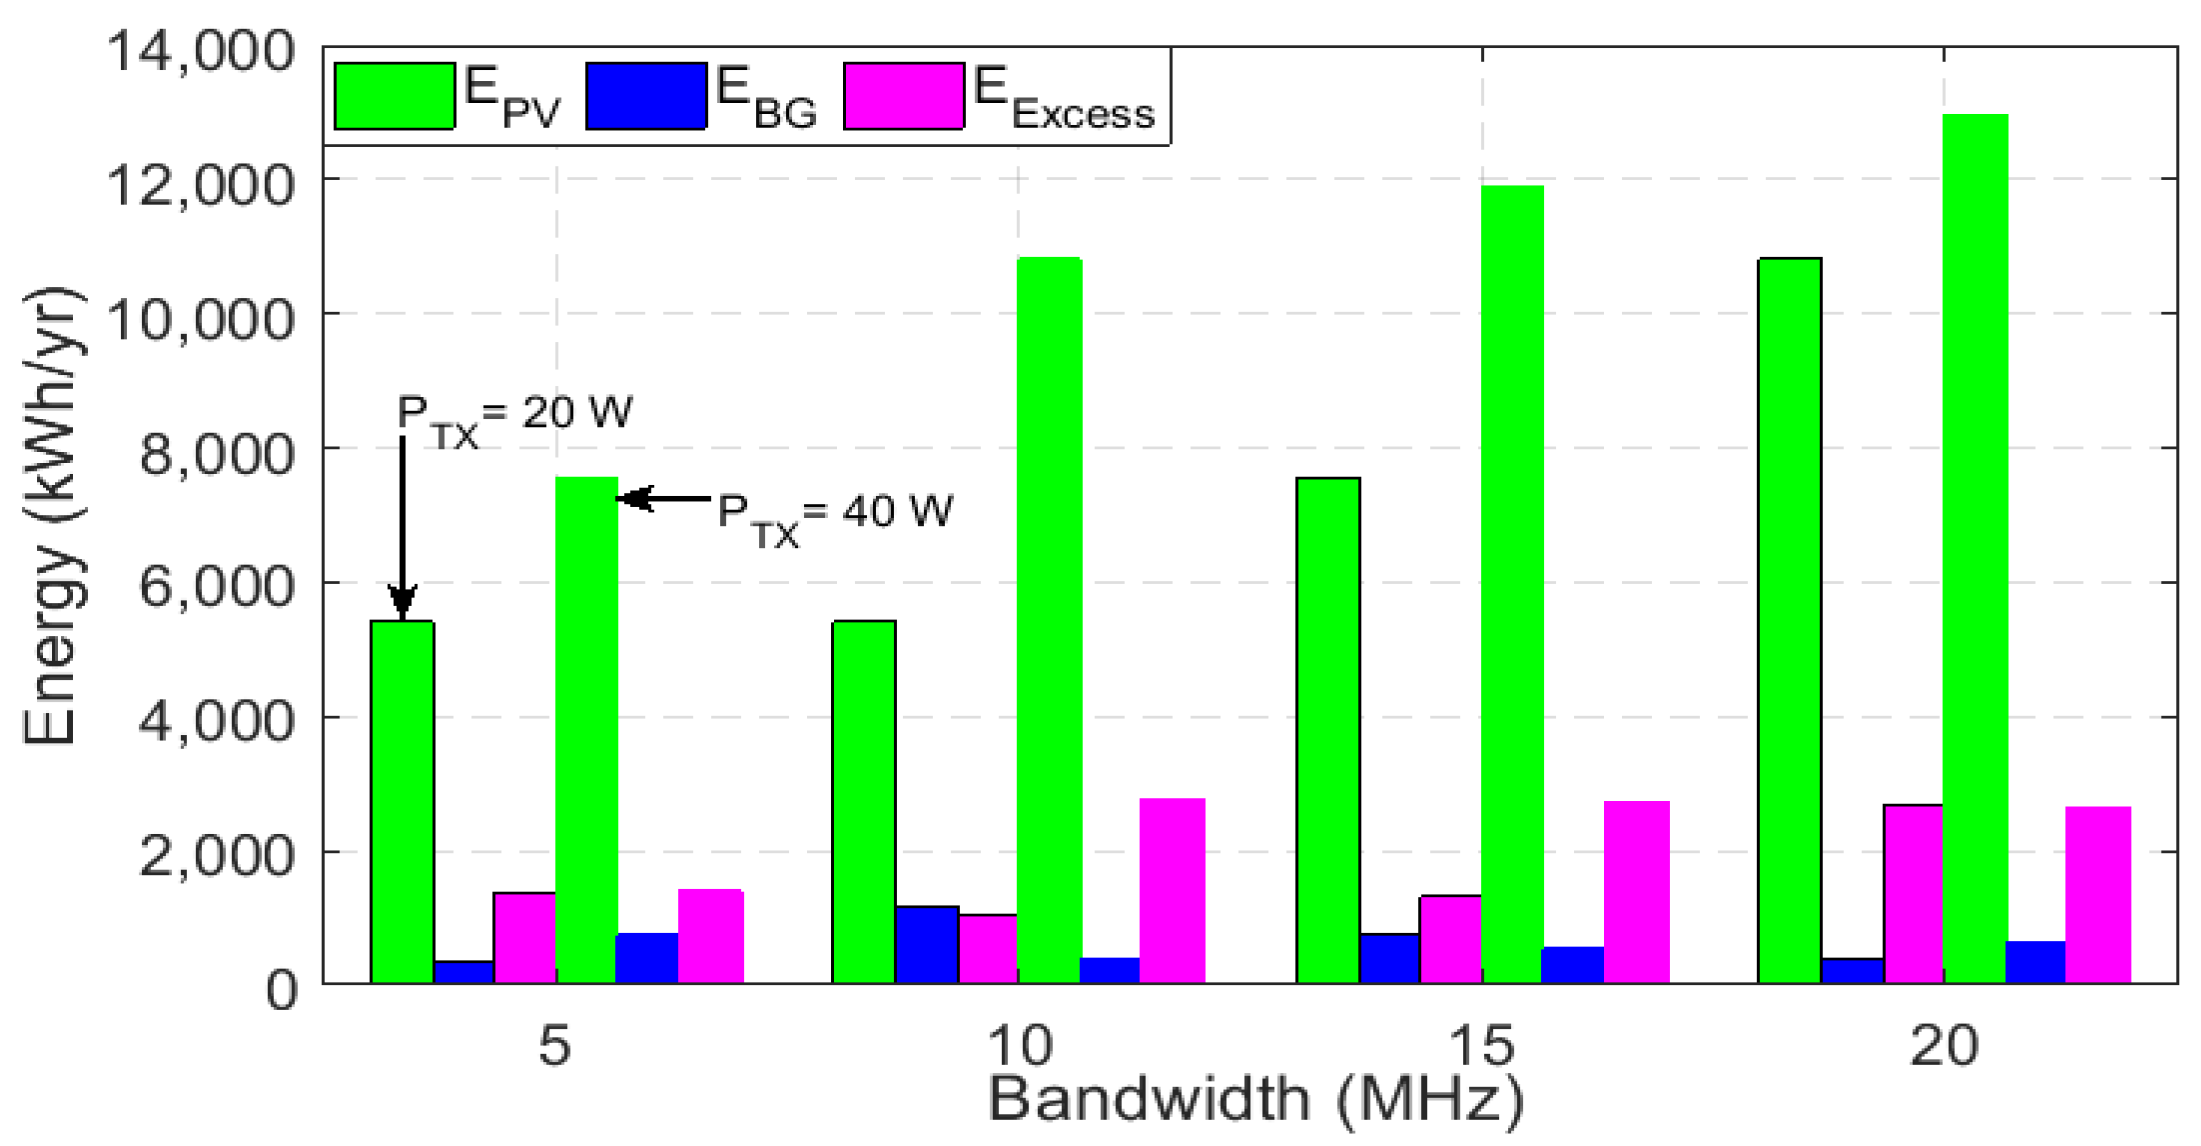
Figure 15.
Energy breakdown for the grid-tied hybrid PV/BG system under BW = 10 MHz.
Figure 15.
Energy breakdown for the grid-tied hybrid PV/BG system under BW = 10 MHz.
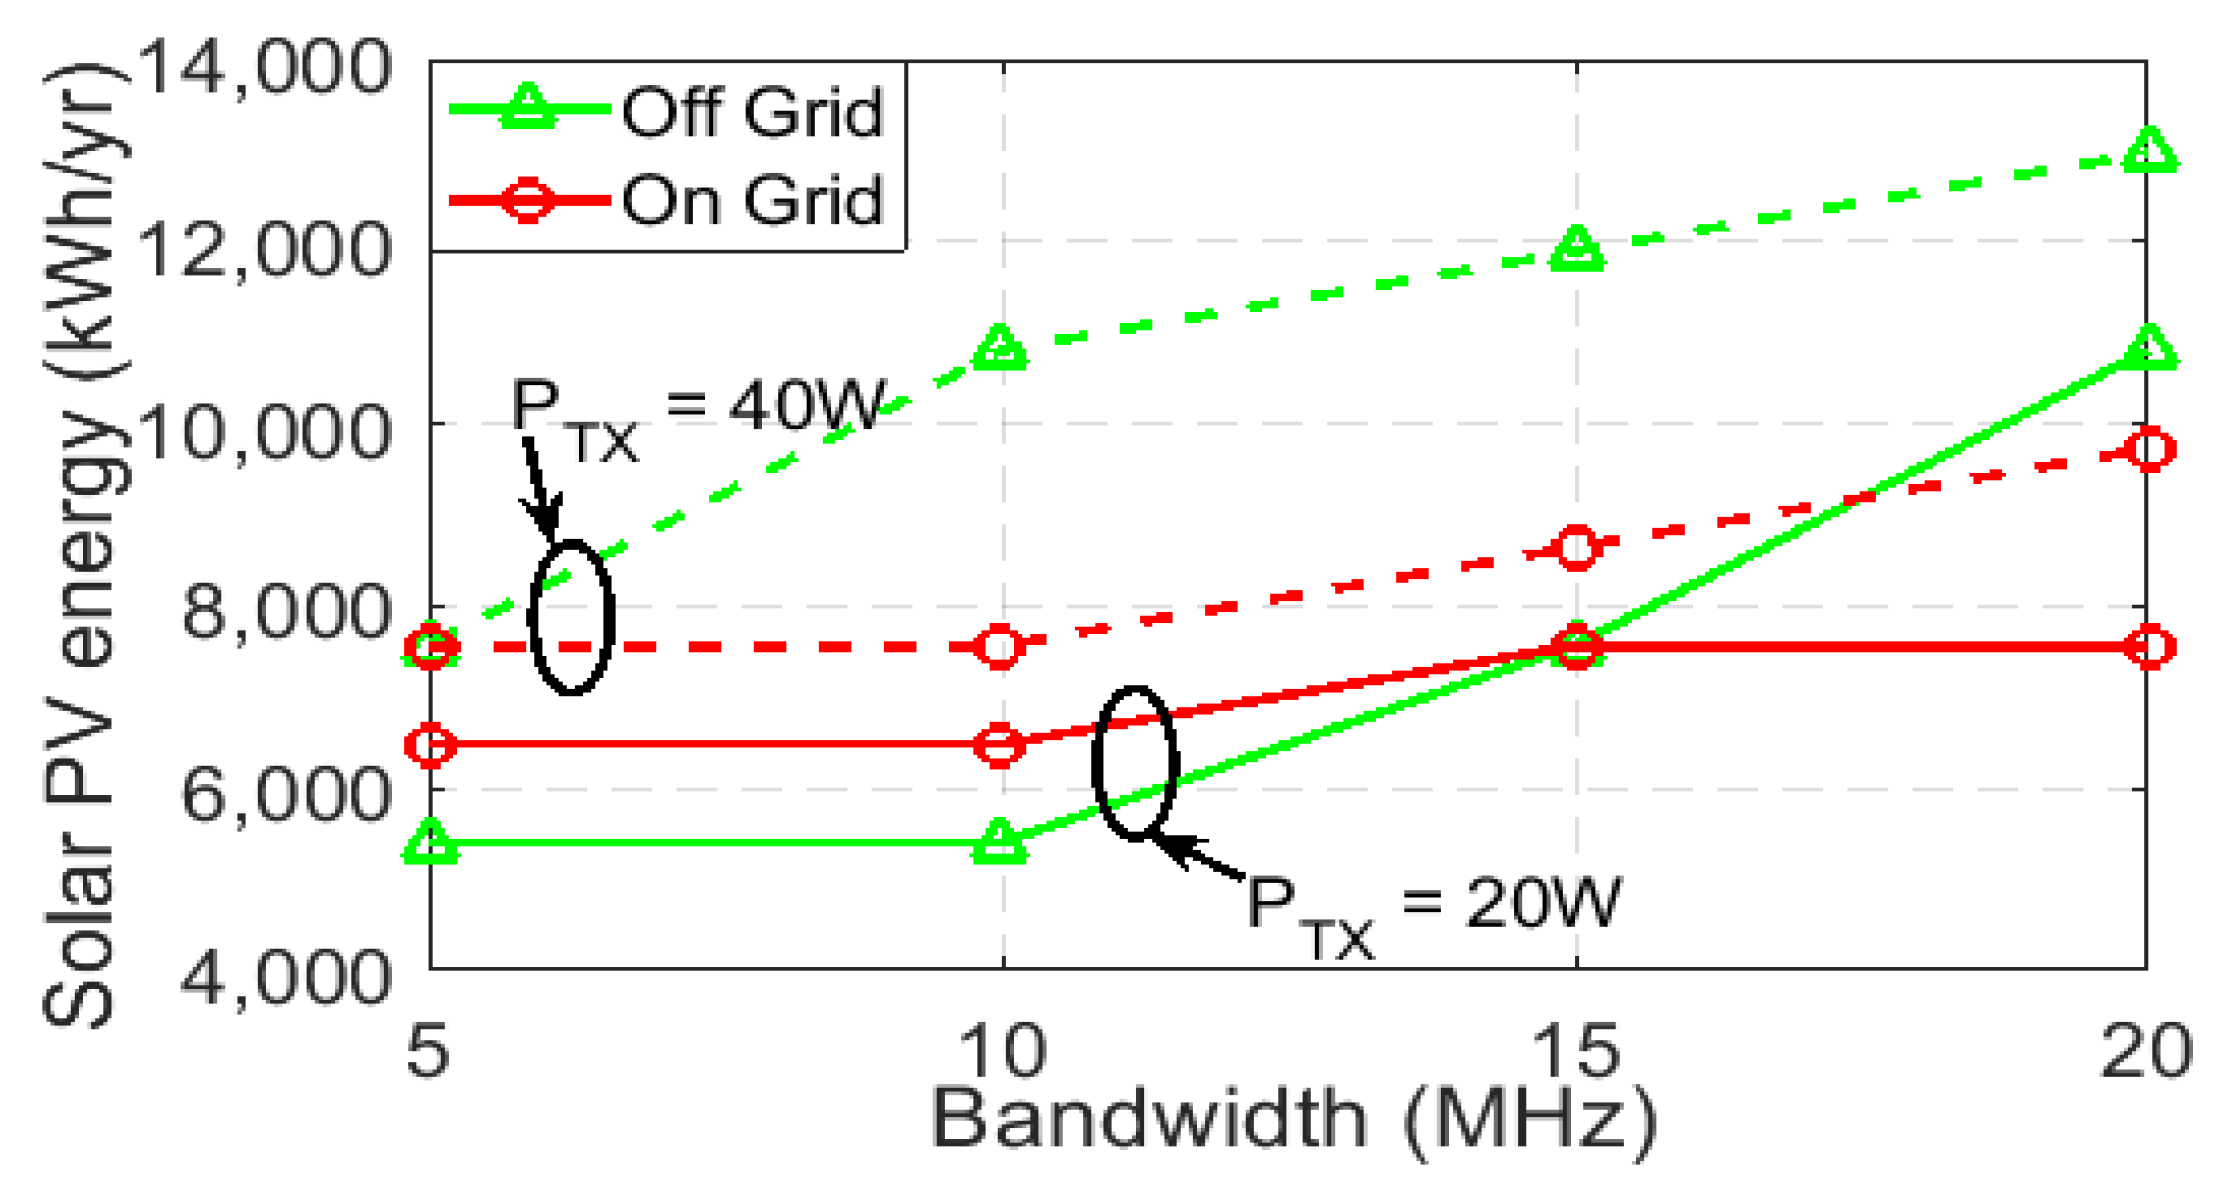
Figure 16.
Solar energy generation for the proposed system under different bandwidth.
Figure 16.
Solar energy generation for the proposed system under different bandwidth.
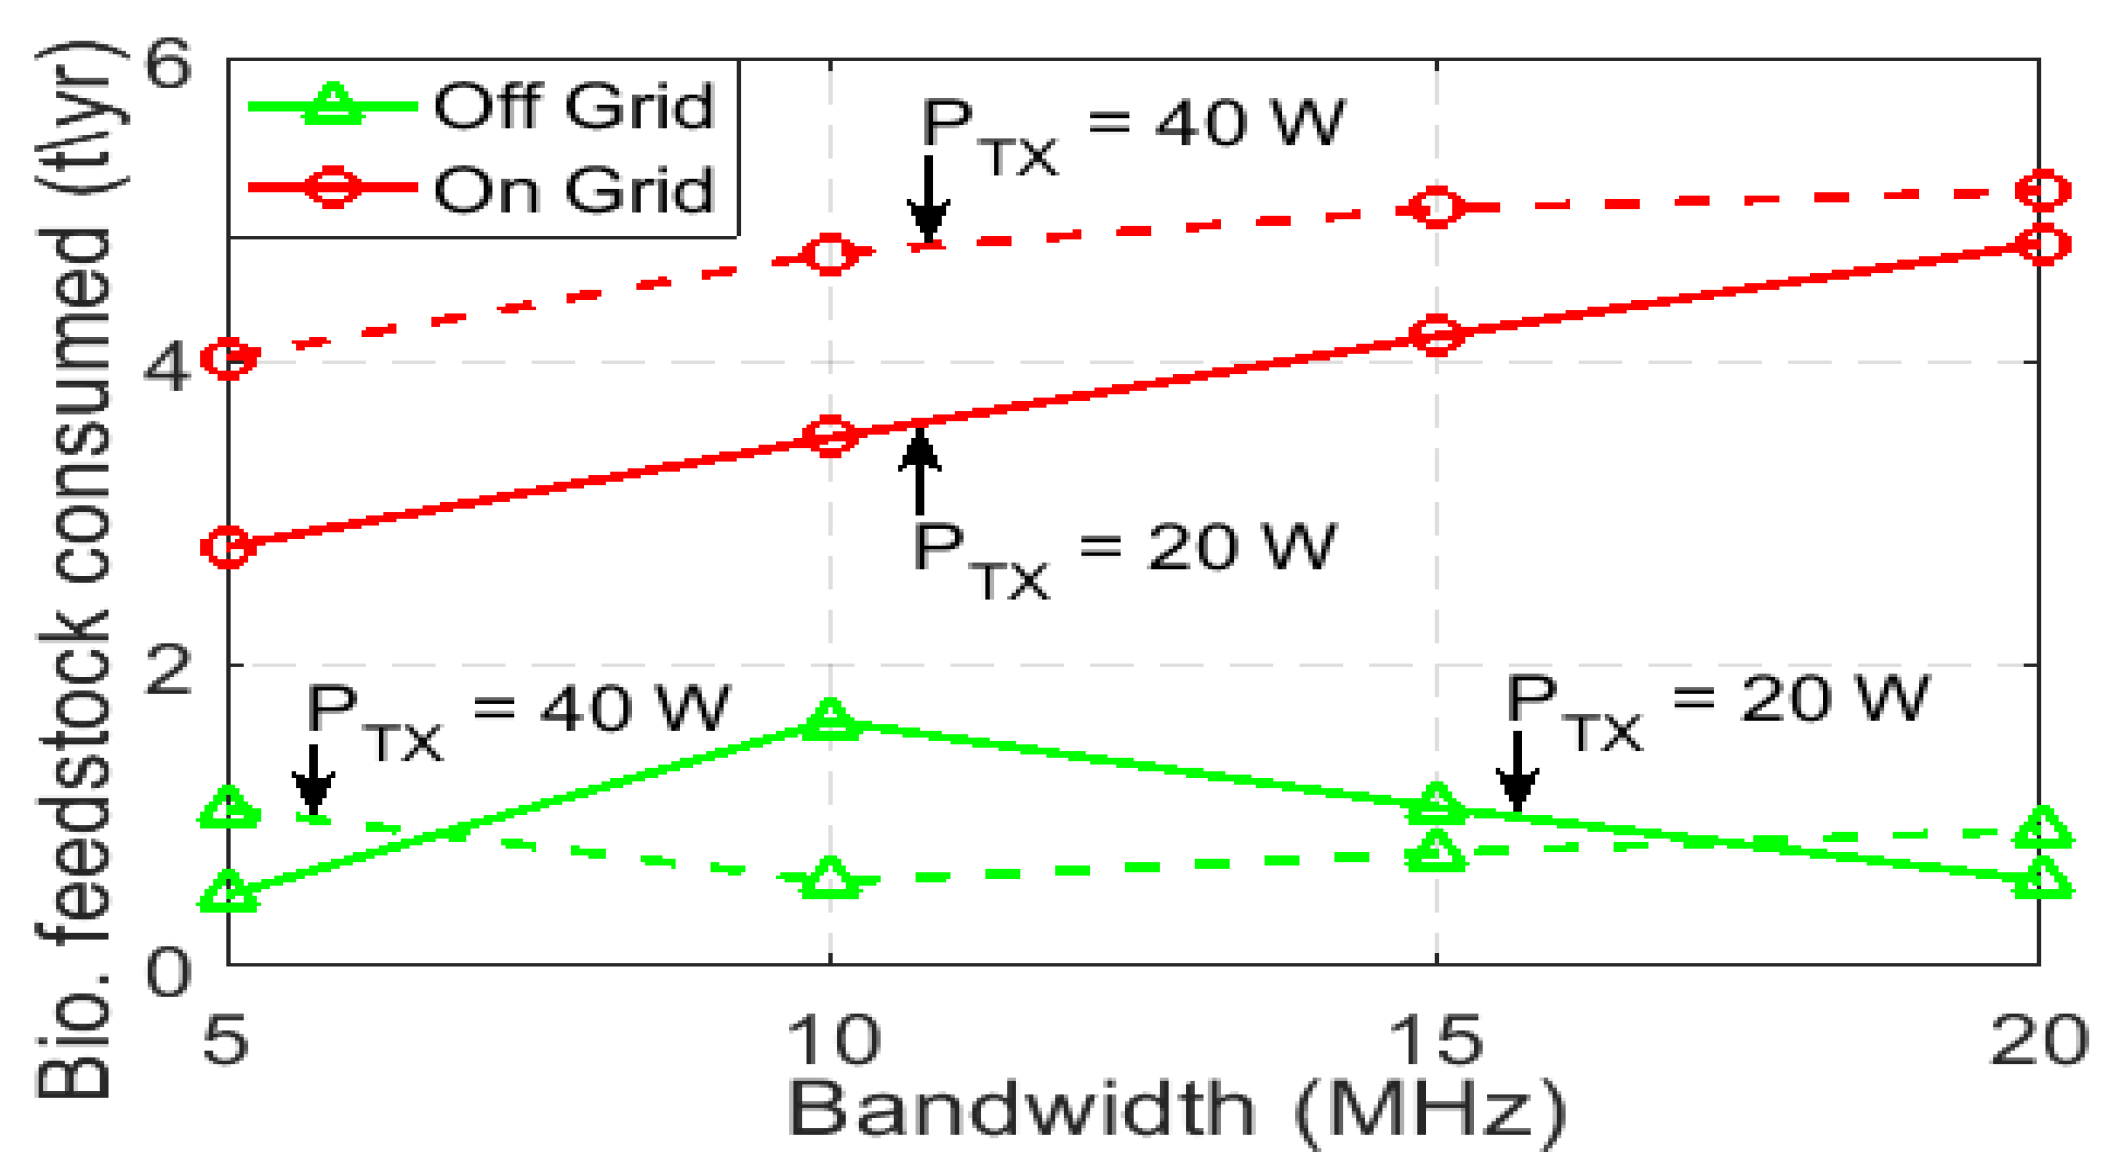
Figure 17.
Bio-feedstock consumed for the proposed system under different bandwidth.
Figure 17.
Bio-feedstock consumed for the proposed system under different bandwidth.
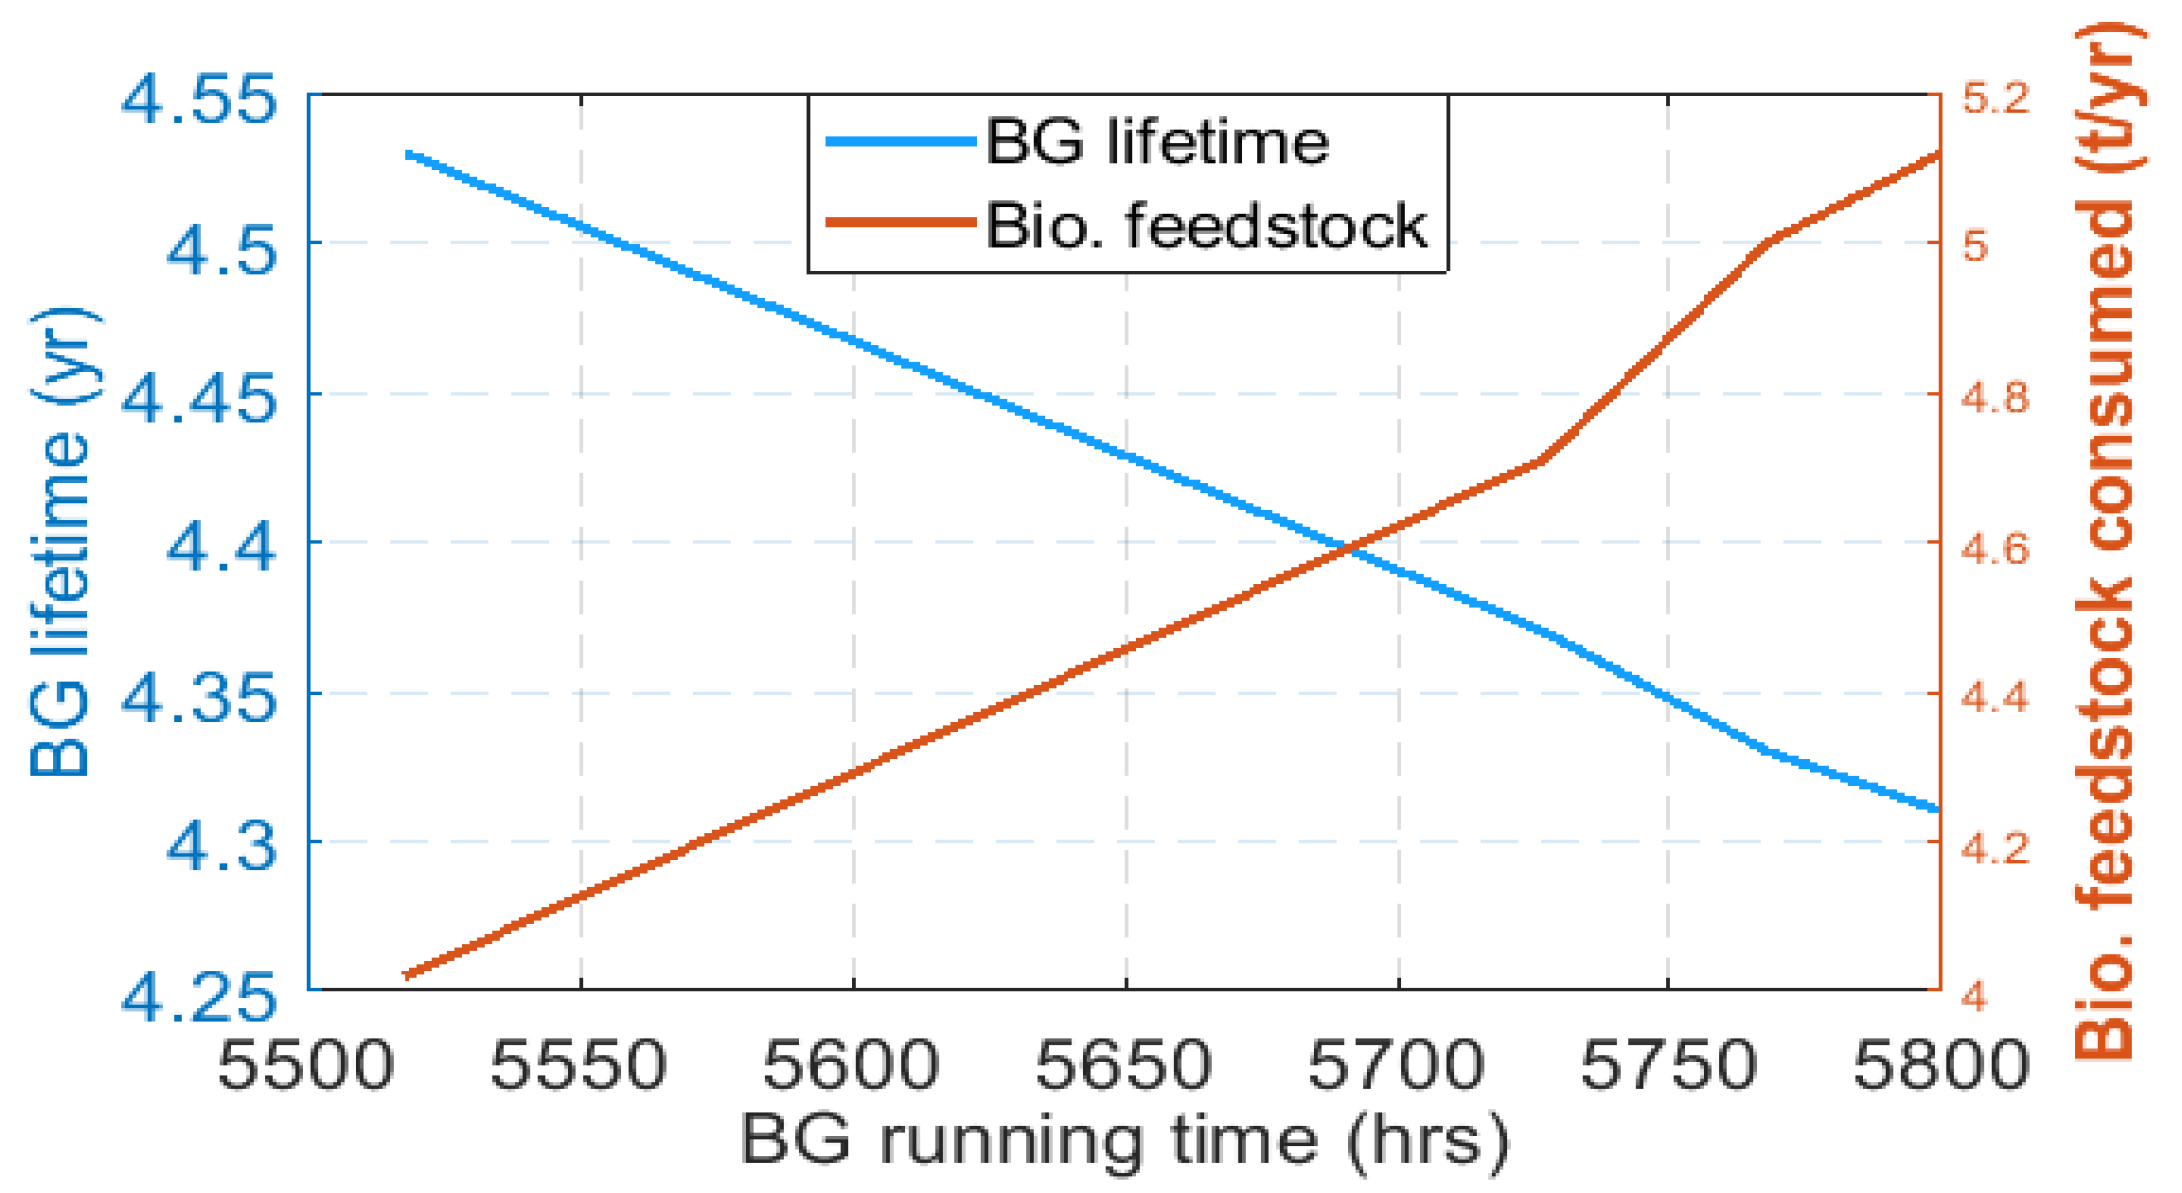
Figure 18.
BG life and Bio-feedstock consumed for the proposed system with BG operating hours.
Figure 18.
BG life and Bio-feedstock consumed for the proposed system with BG operating hours.
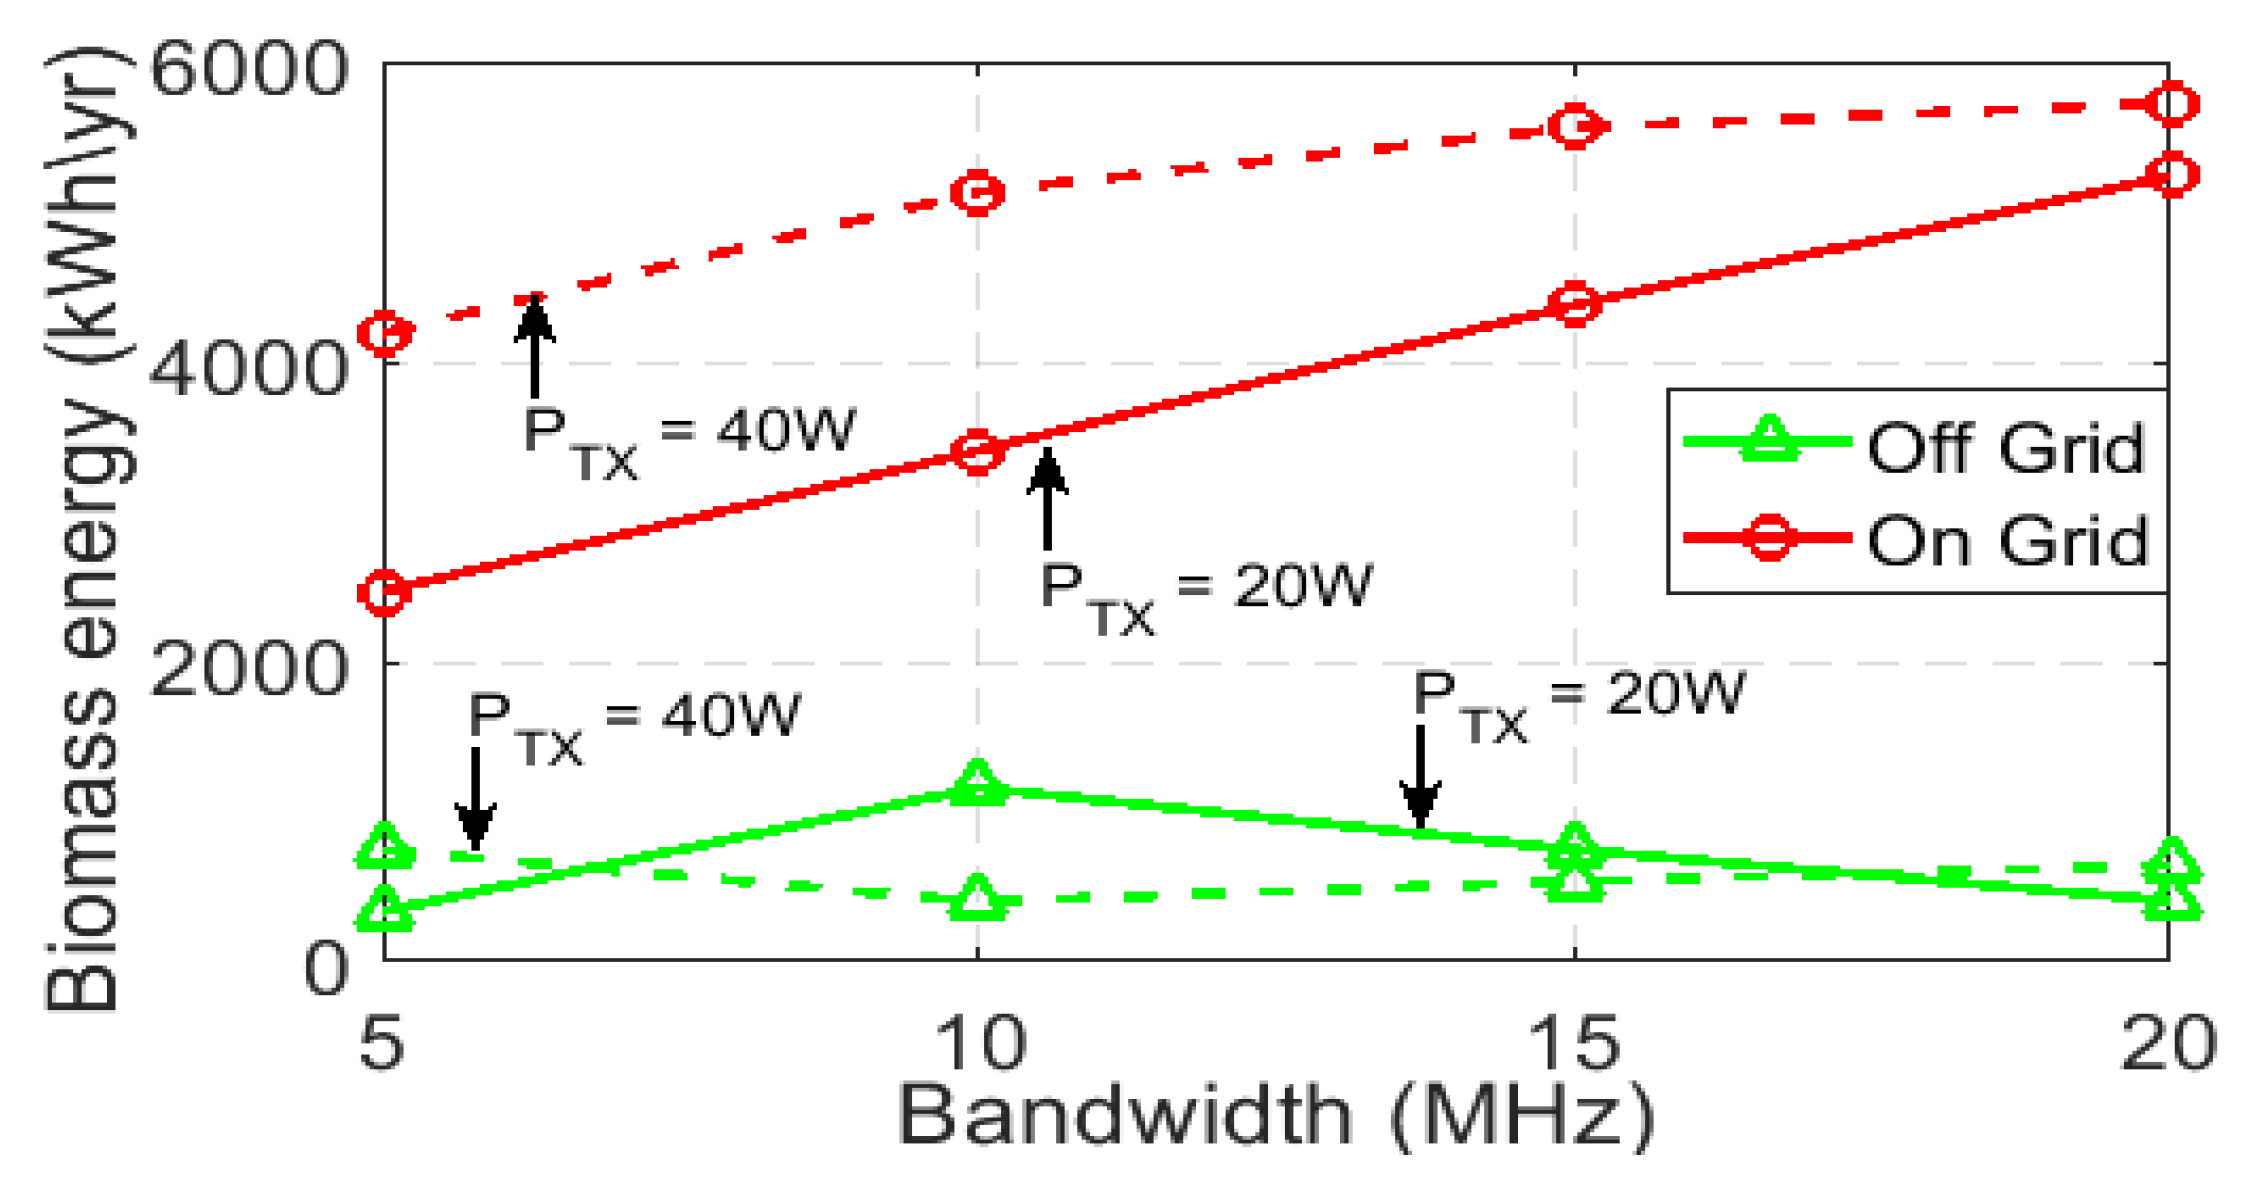
Figure 19.
Energy generated by the BG for the proposed system under different bandwidth.
Figure 19.
Energy generated by the BG for the proposed system under different bandwidth.
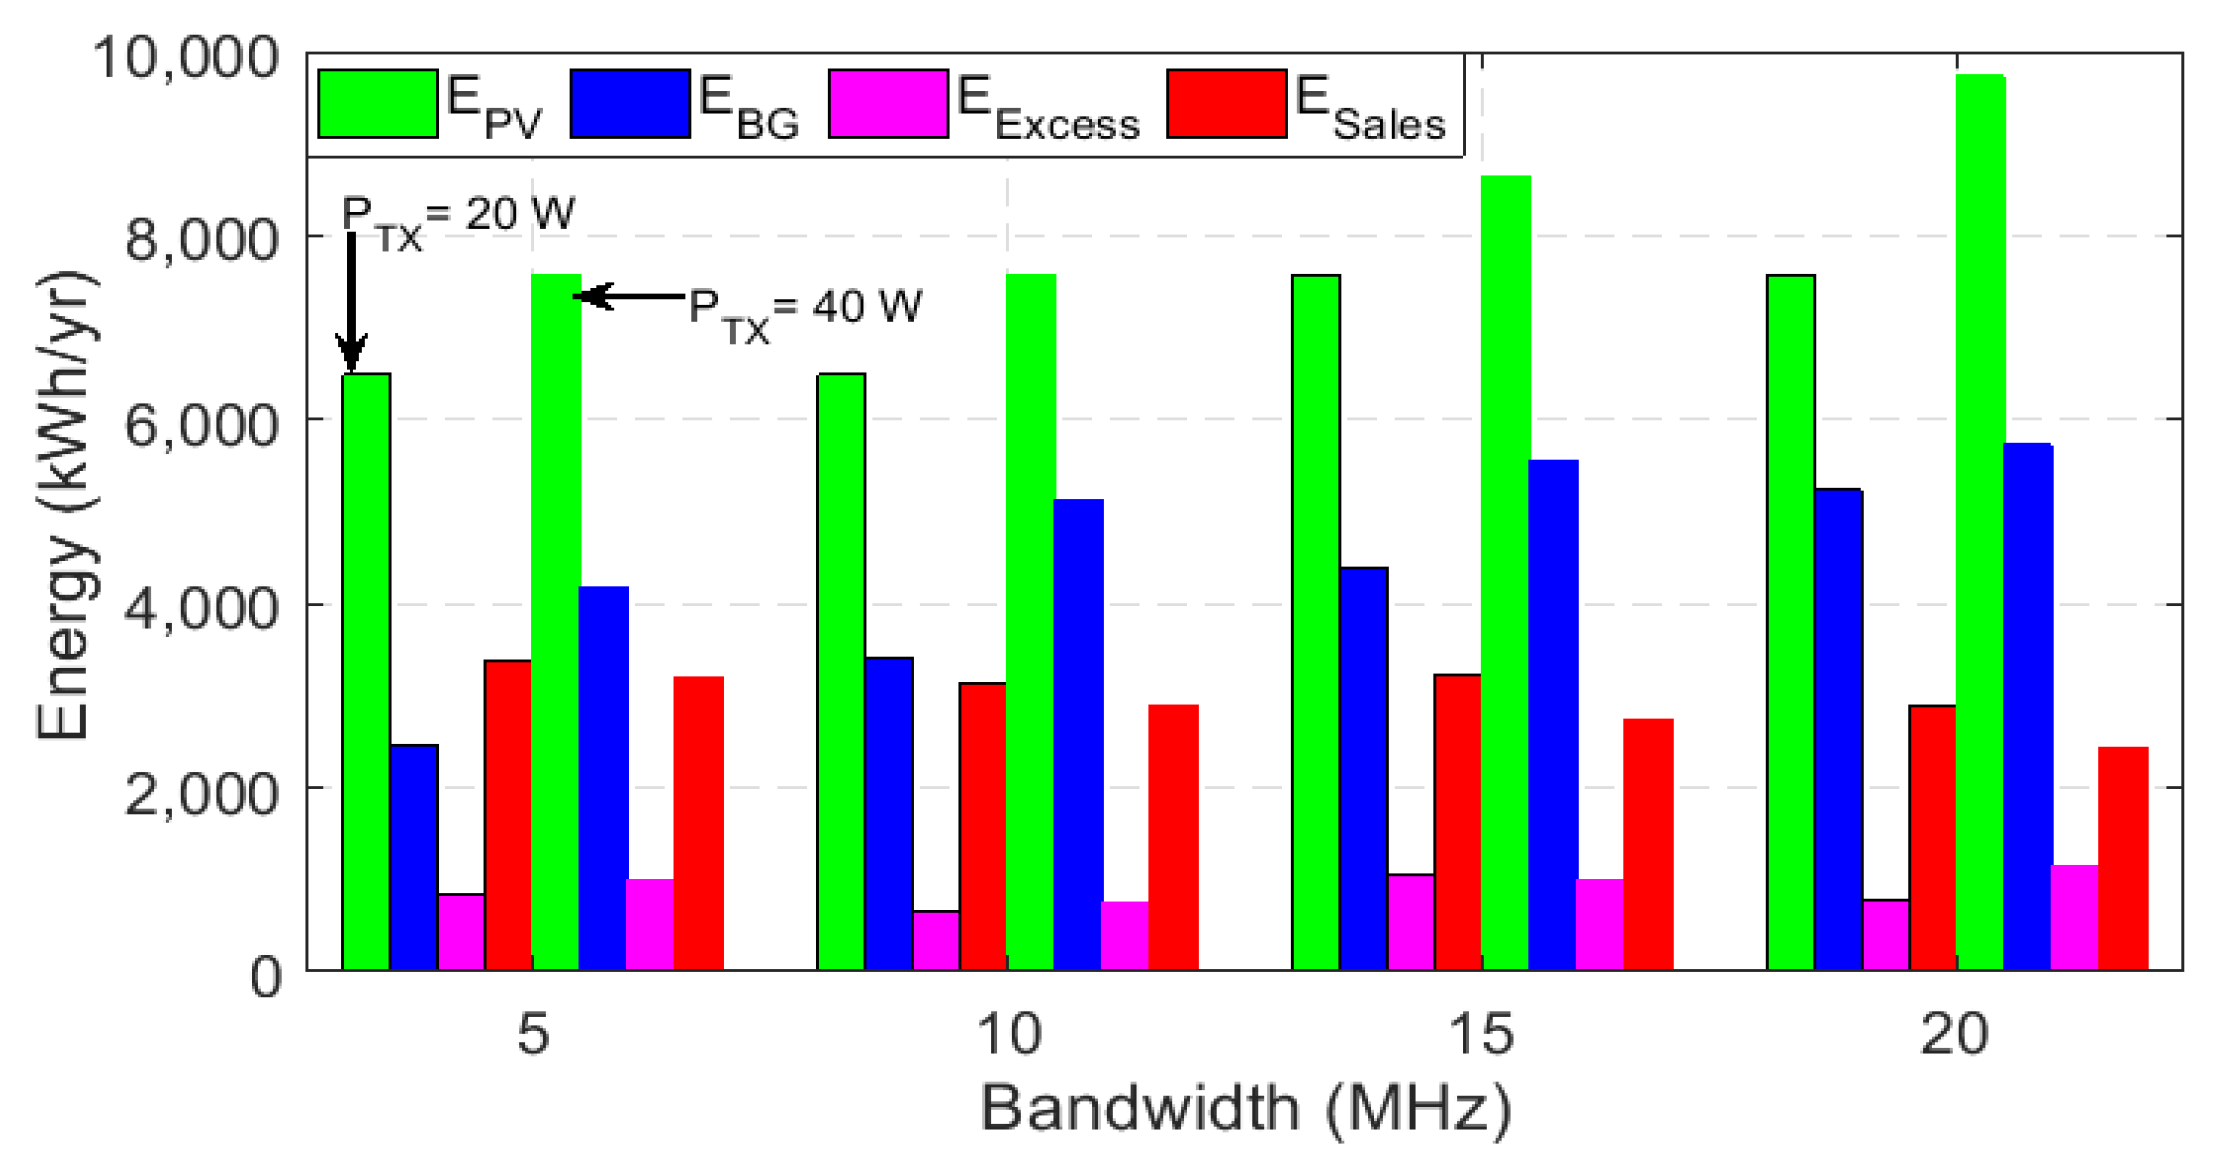
Figure 20.
Annual energy breakdown for the grid-tied hybrid PV/BG system.
Figure 20.
Annual energy breakdown for the grid-tied hybrid PV/BG system.
Figure 21.
Annual energy breakdown for the off-grid hybrid PV/BG system.
Figure 21.
Annual energy breakdown for the off-grid hybrid PV/BG system.
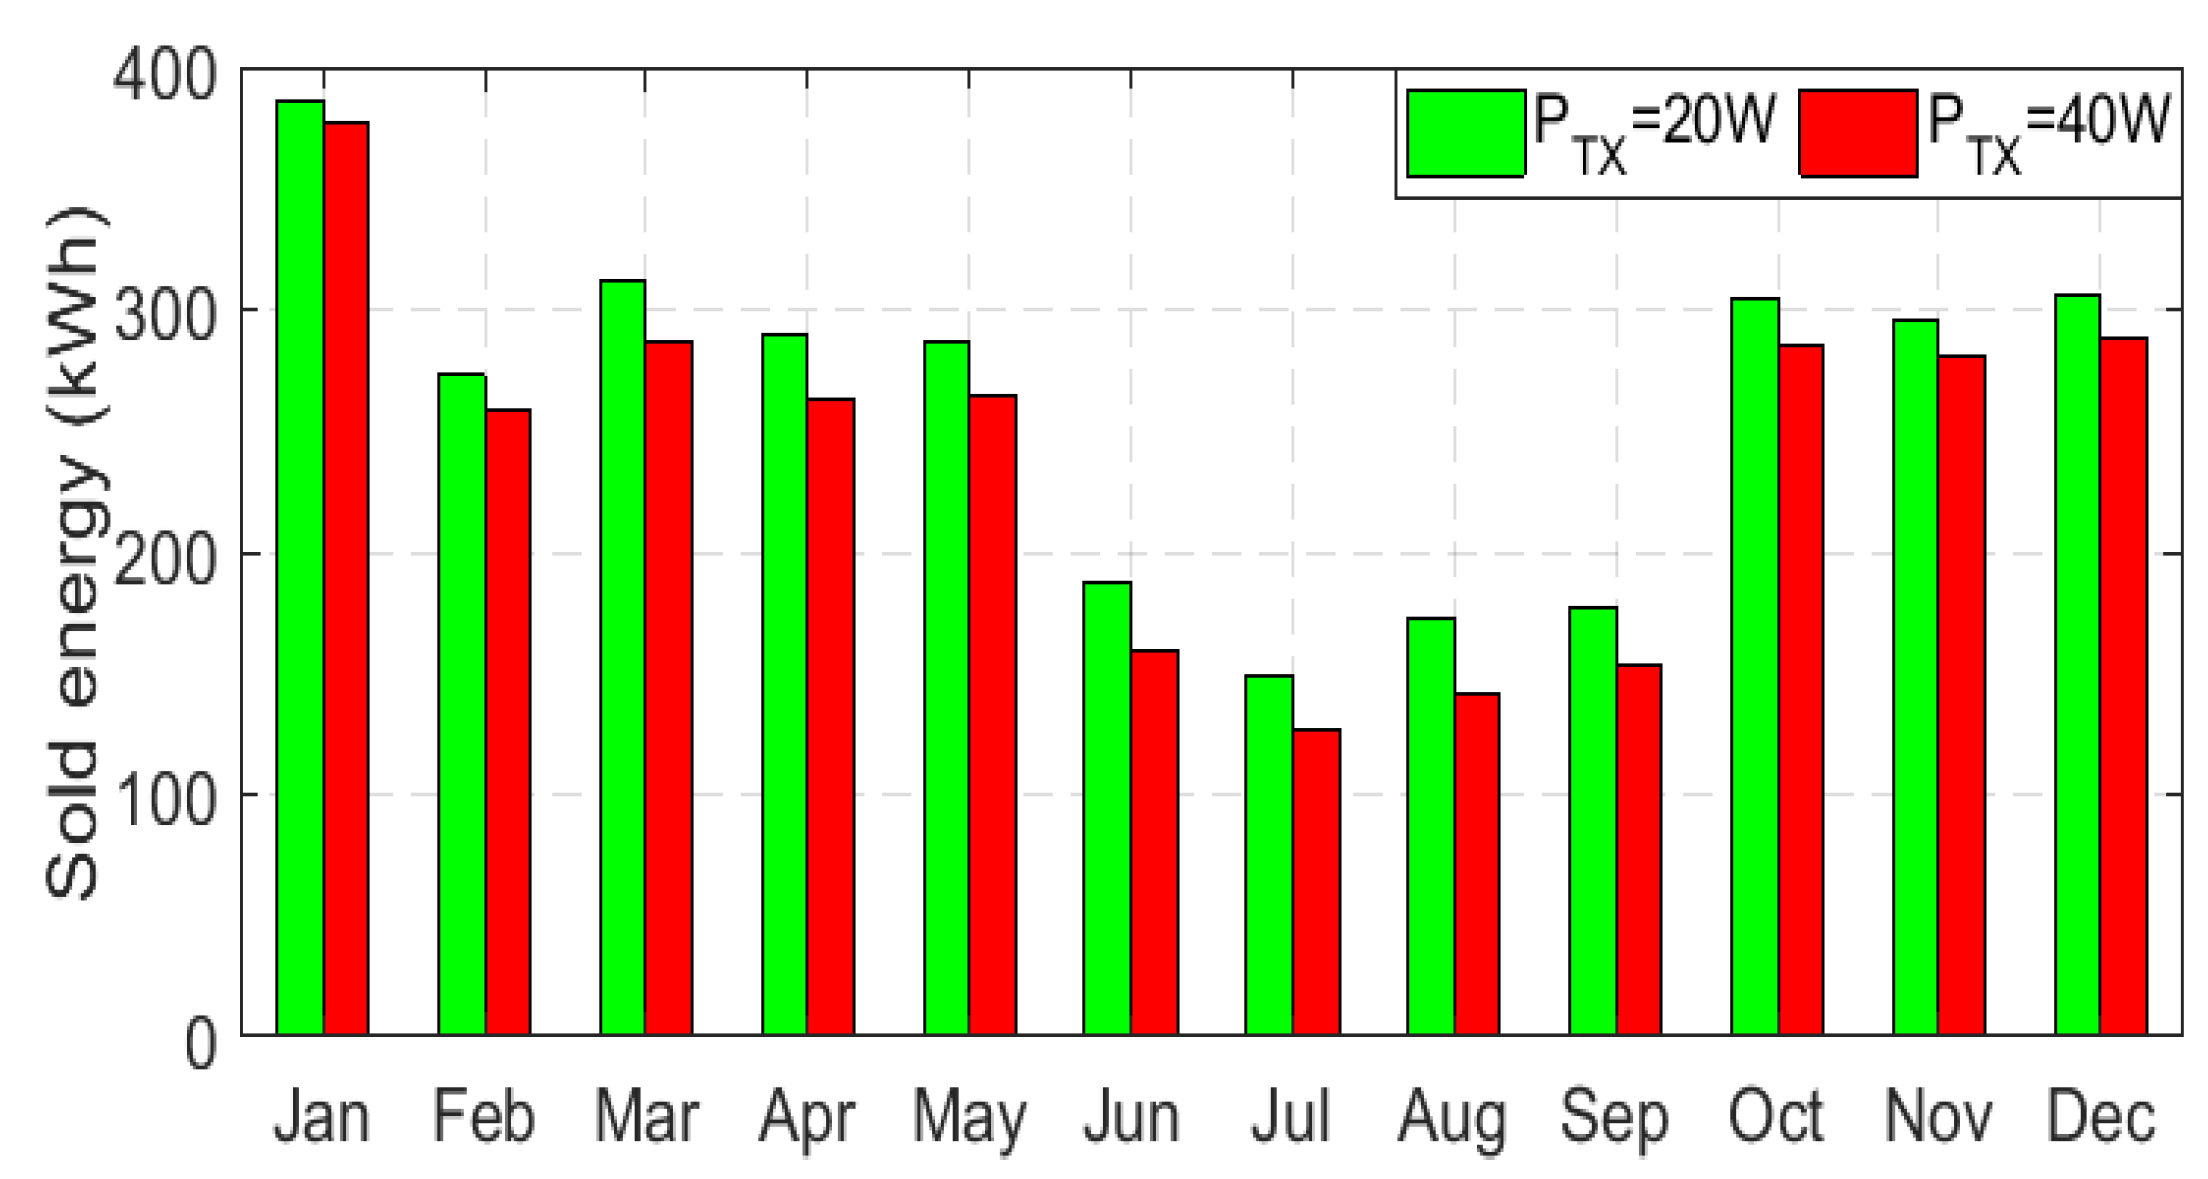
Figure 22.
Monthly sold energy for the grid-tied hybrid PV/BG system.
Figure 22.
Monthly sold energy for the grid-tied hybrid PV/BG system.
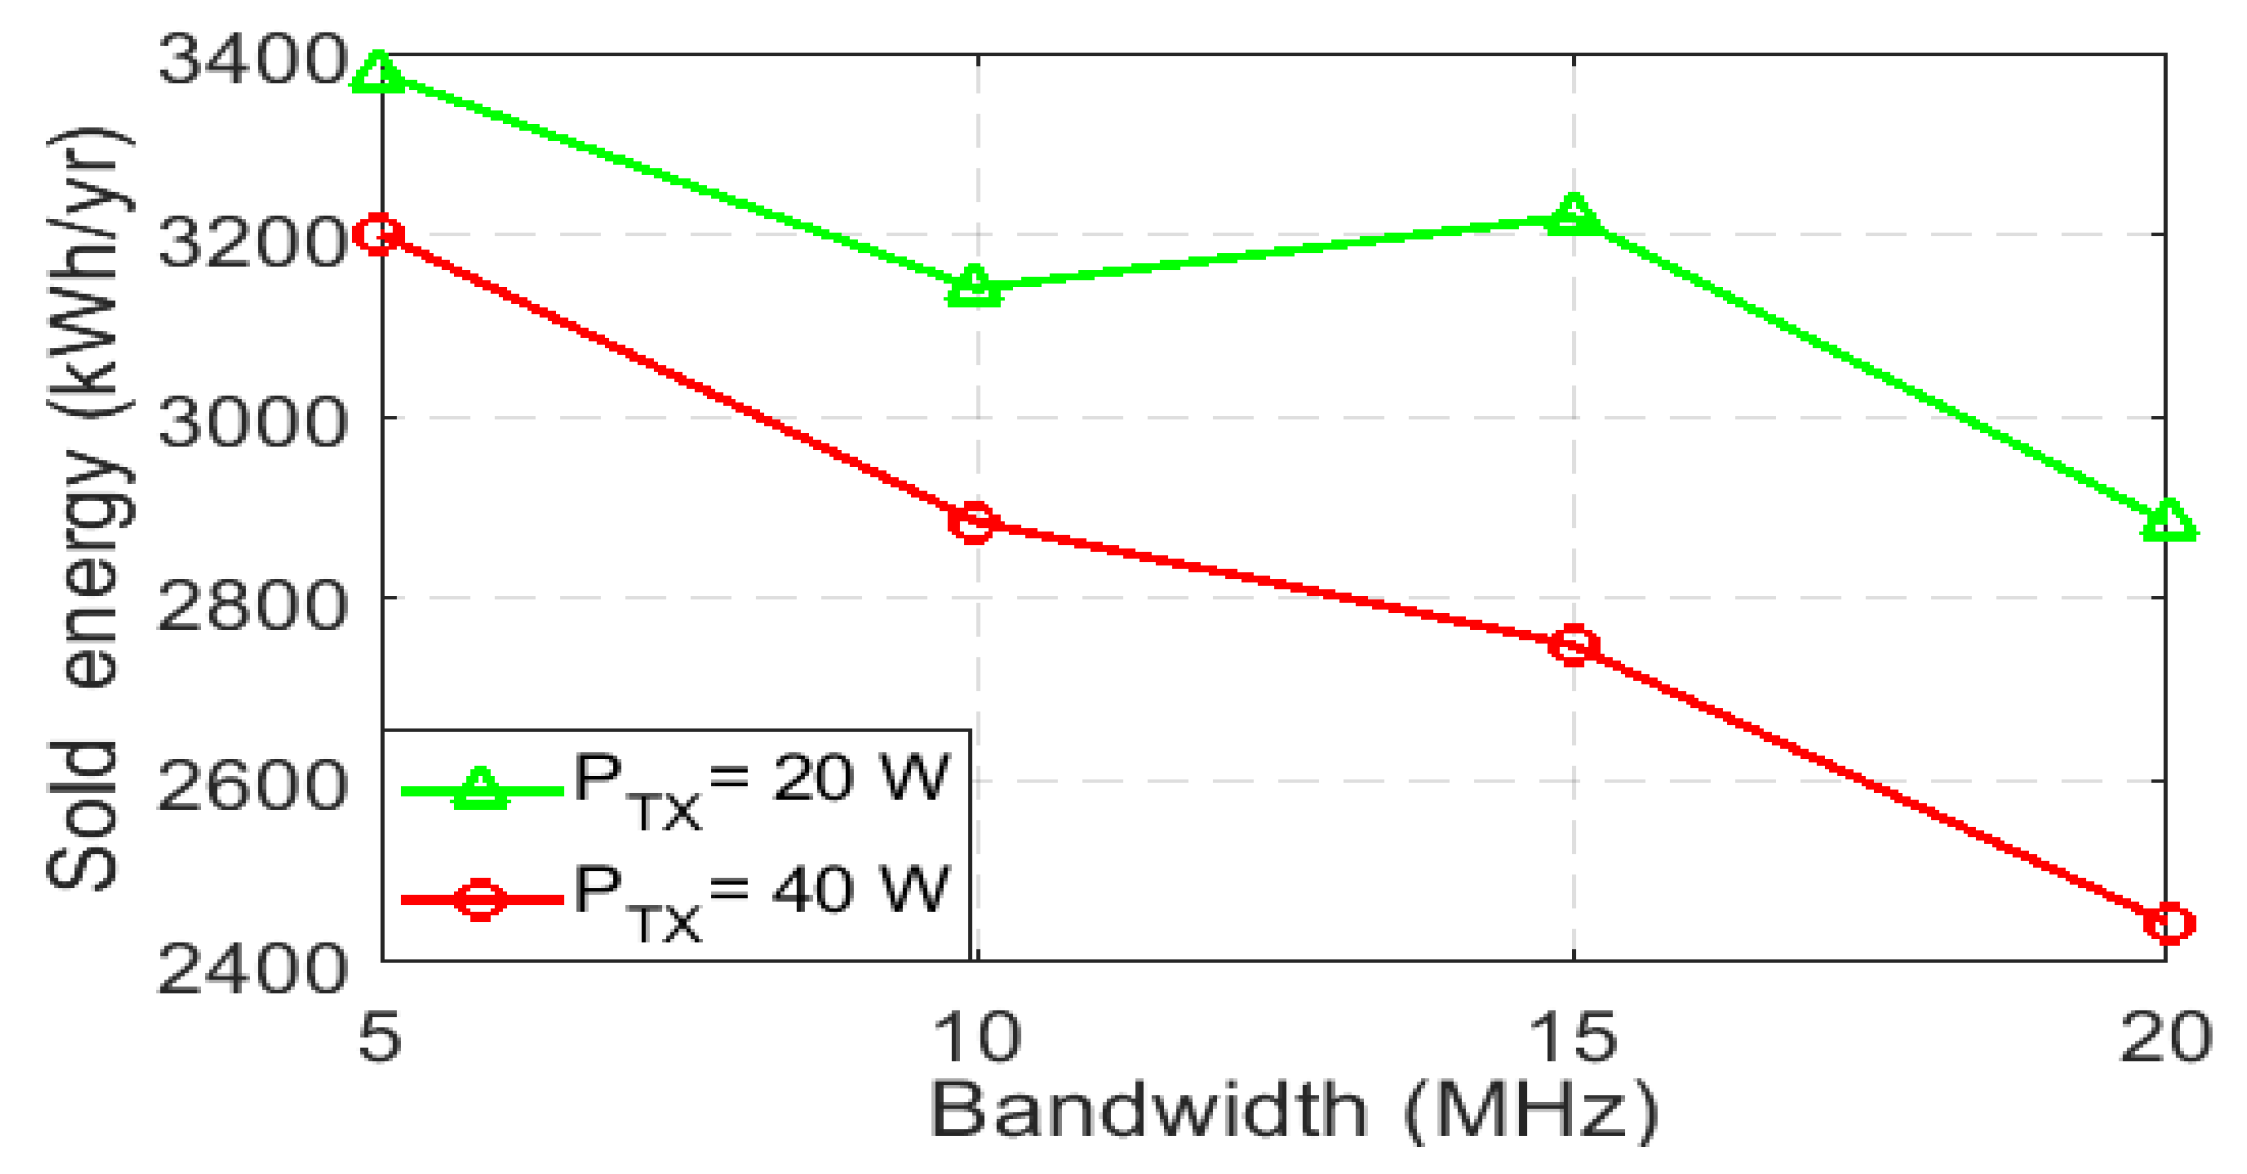
Figure 23.
Sold energy for the grid-tied hybrid PV/BG system under different BW.
Figure 23.
Sold energy for the grid-tied hybrid PV/BG system under different BW.
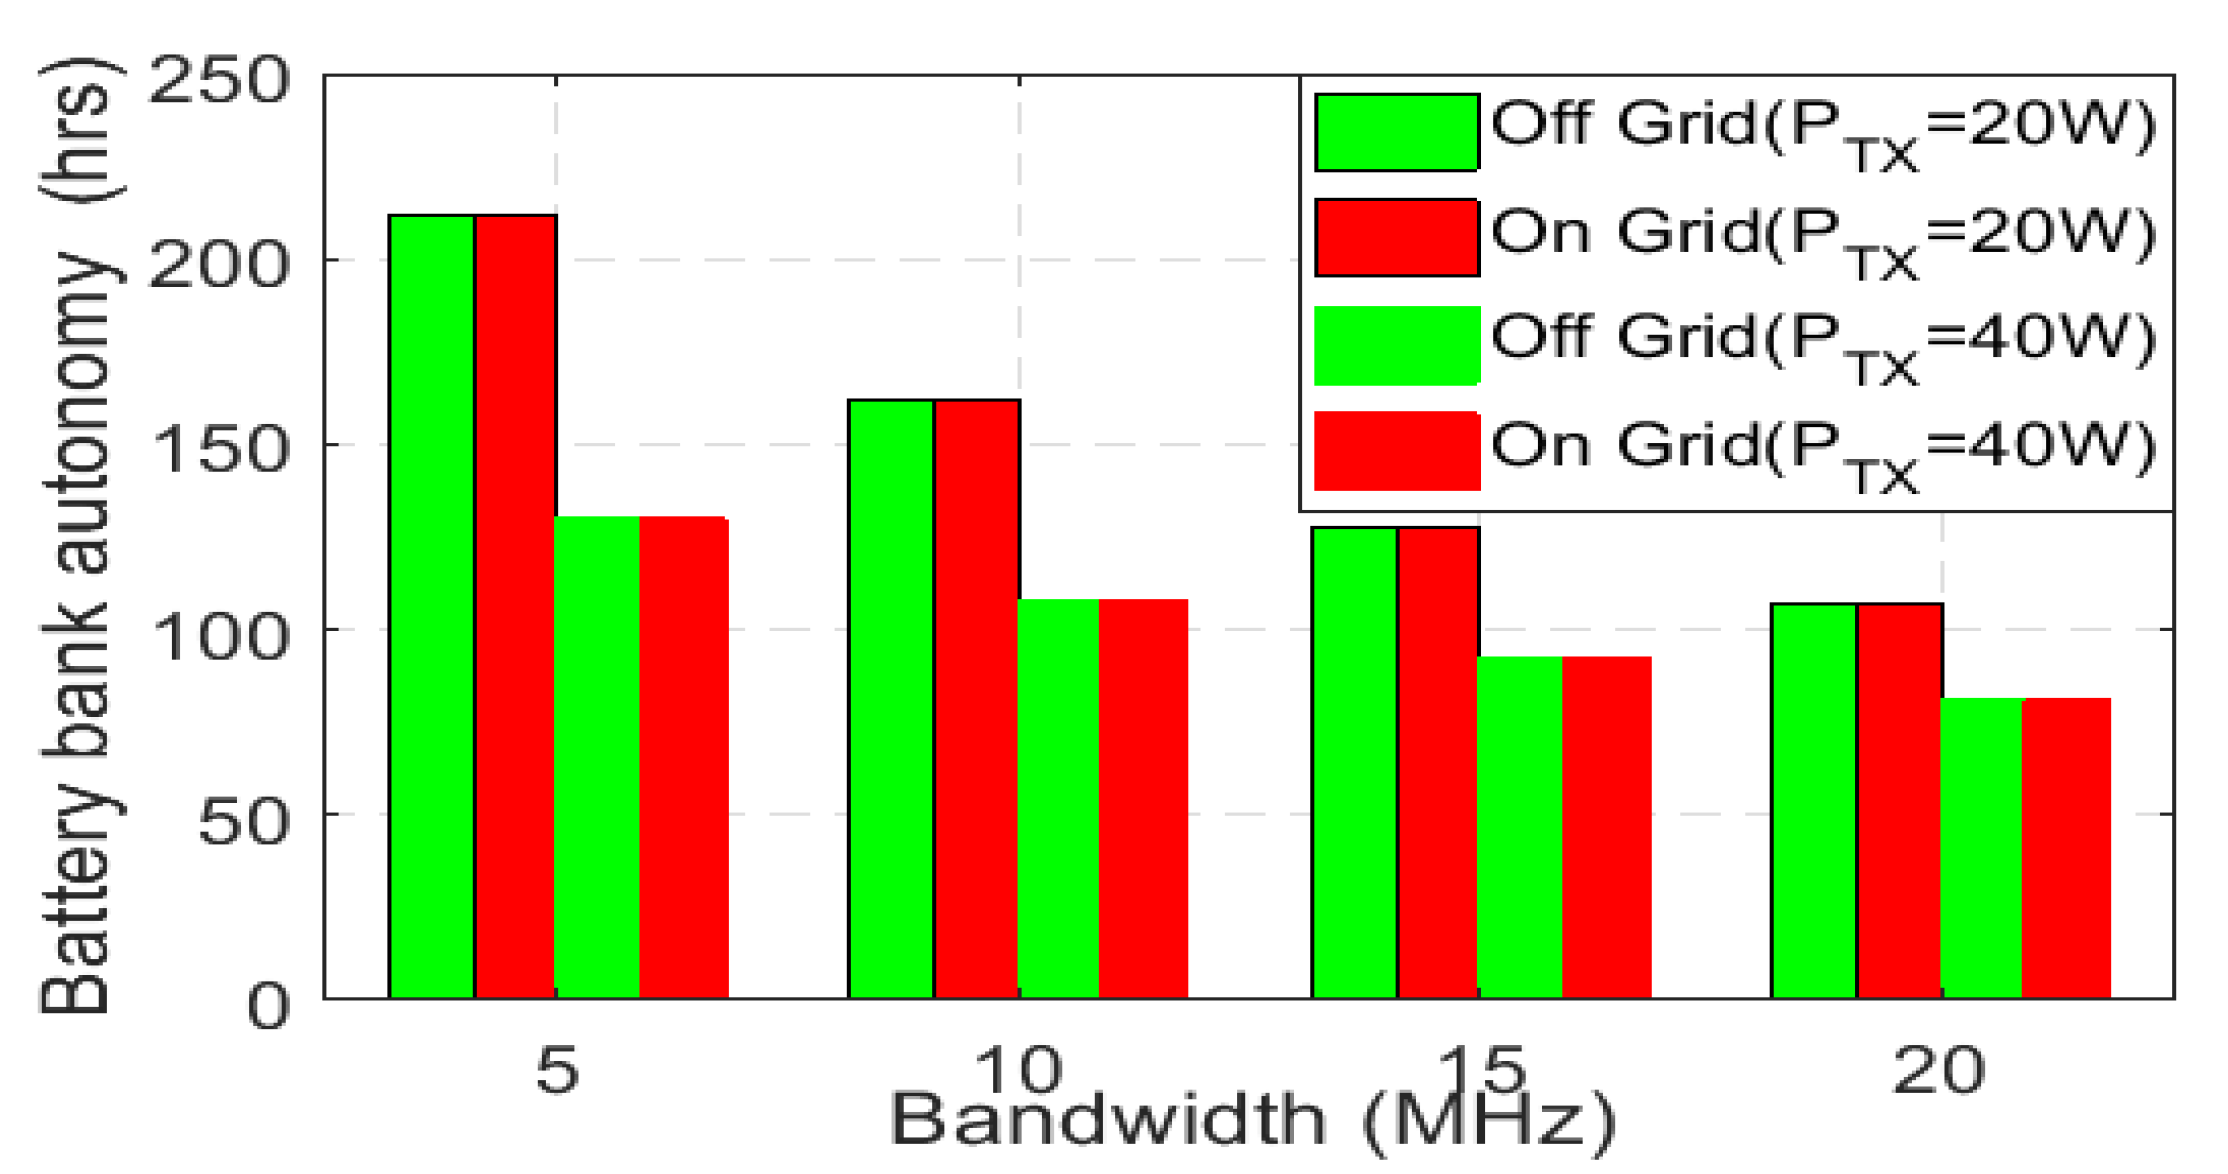
Figure 24.
Battery bank autonomy vs. bandwidth.
Figure 24.
Battery bank autonomy vs. bandwidth.
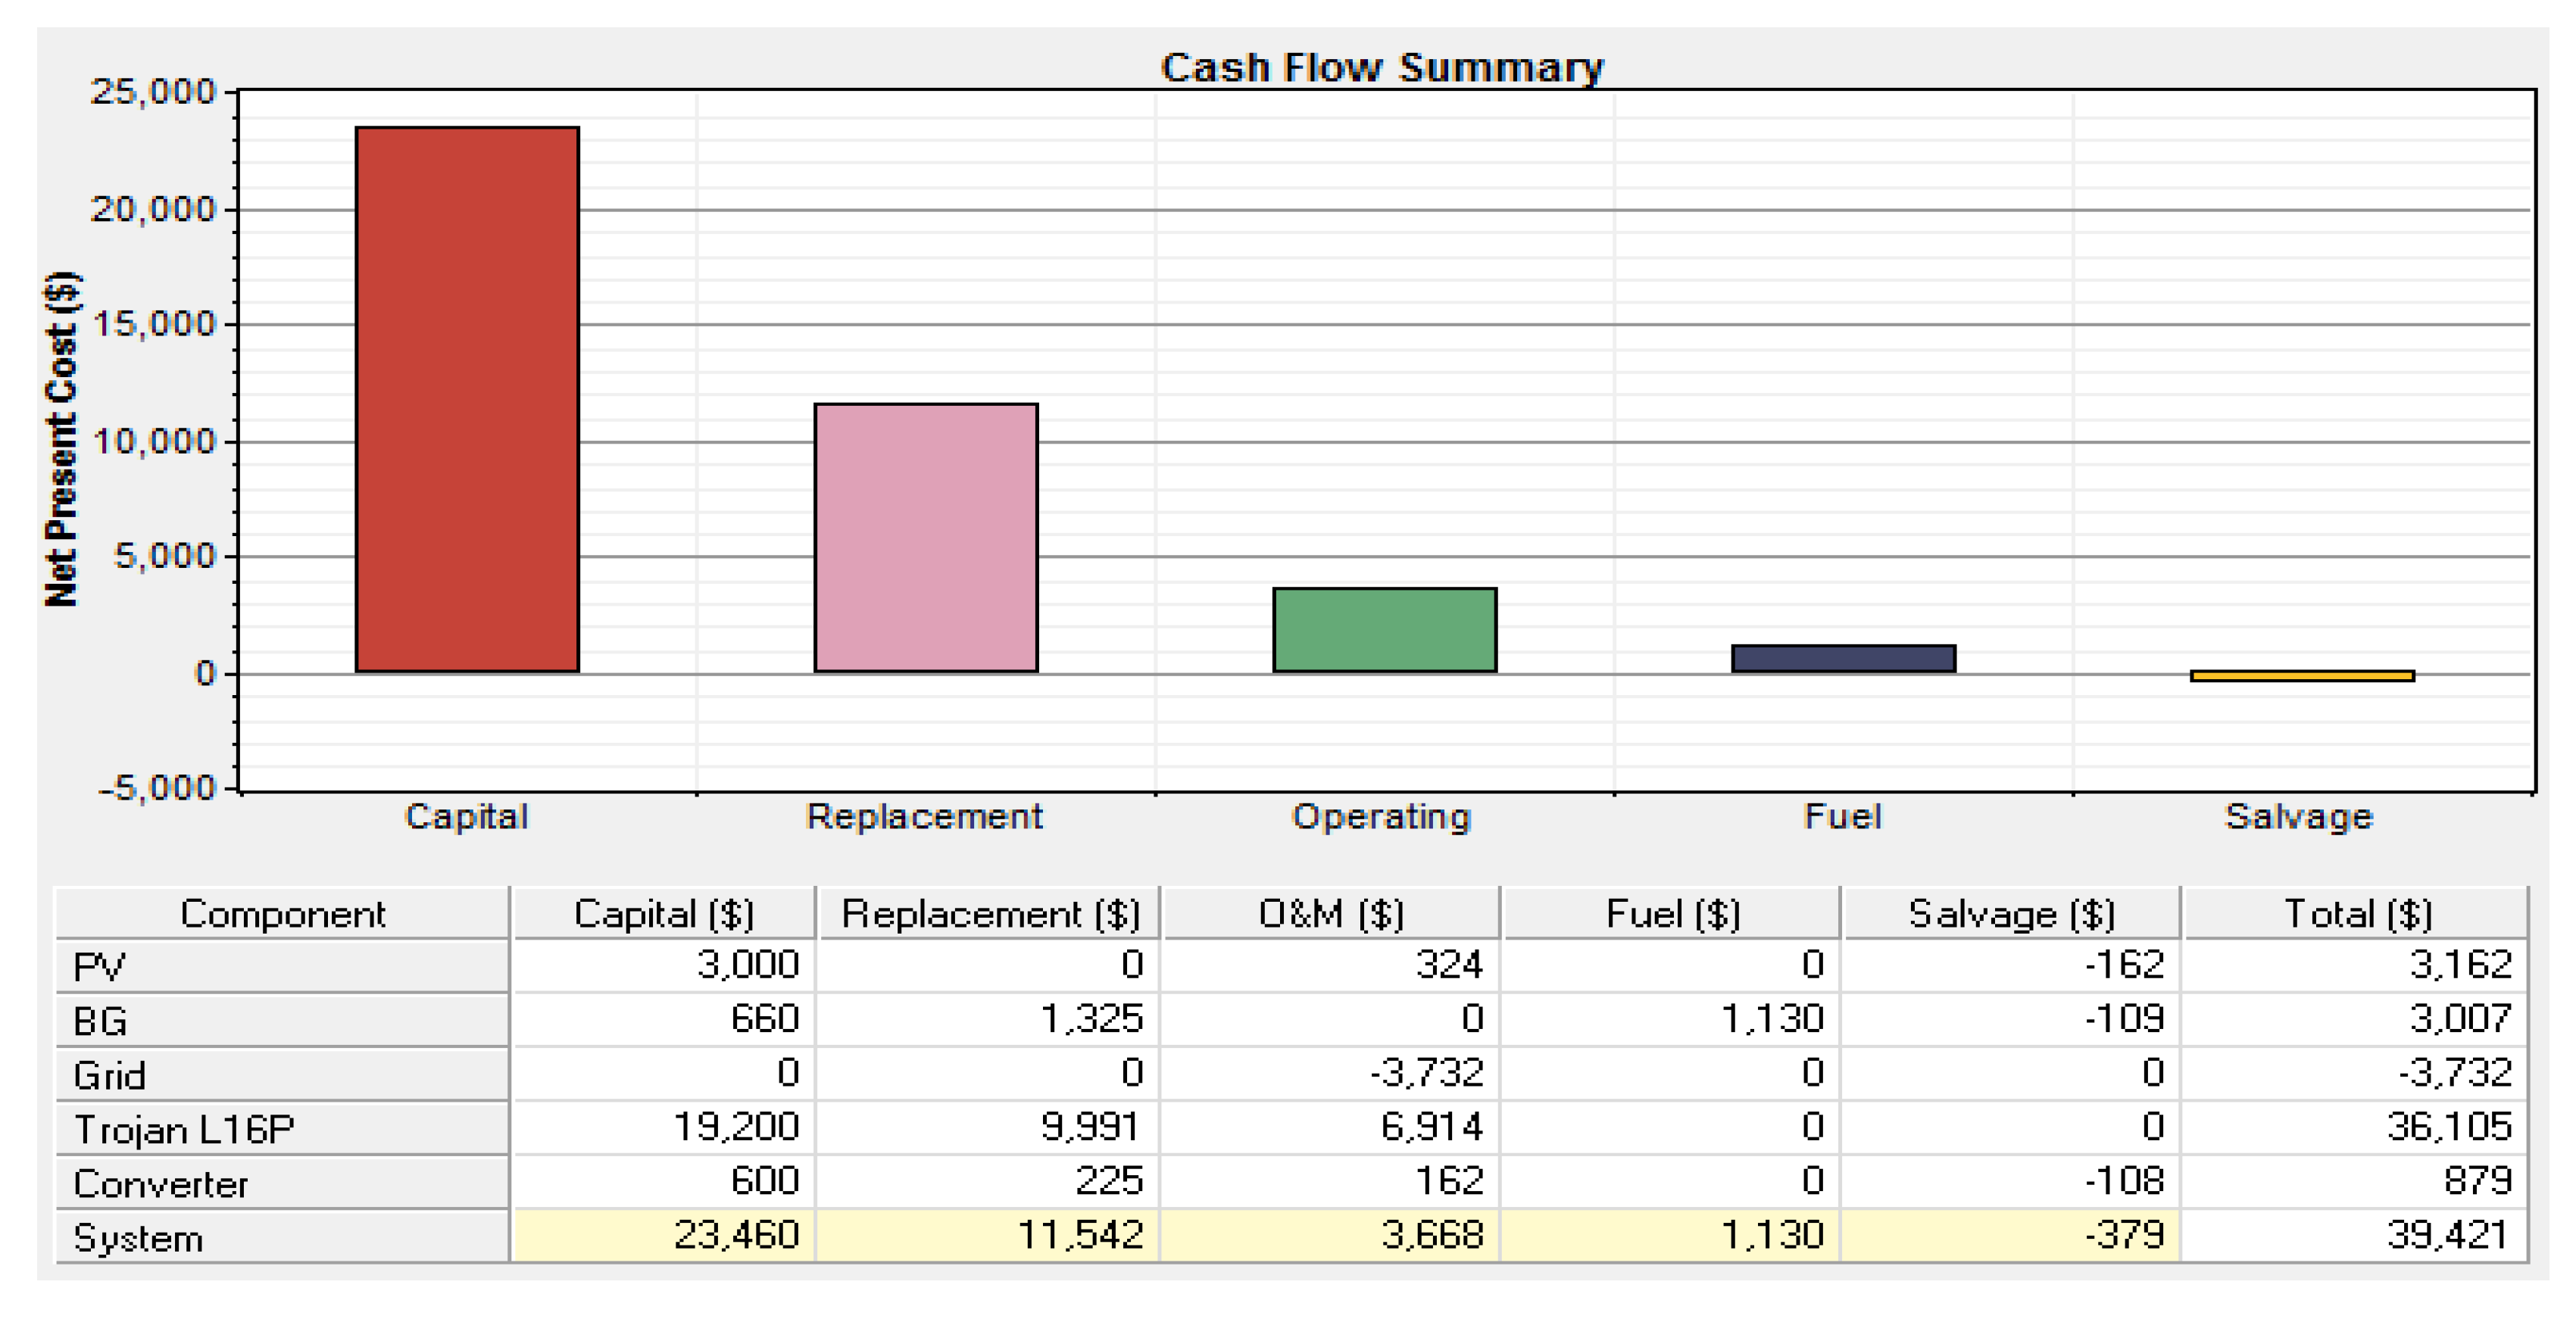
Figure 25.
Cash flow summary for the grid-tied hybrid PV/BG system under 10 MHz bandwidth.
Figure 25.
Cash flow summary for the grid-tied hybrid PV/BG system under 10 MHz bandwidth.
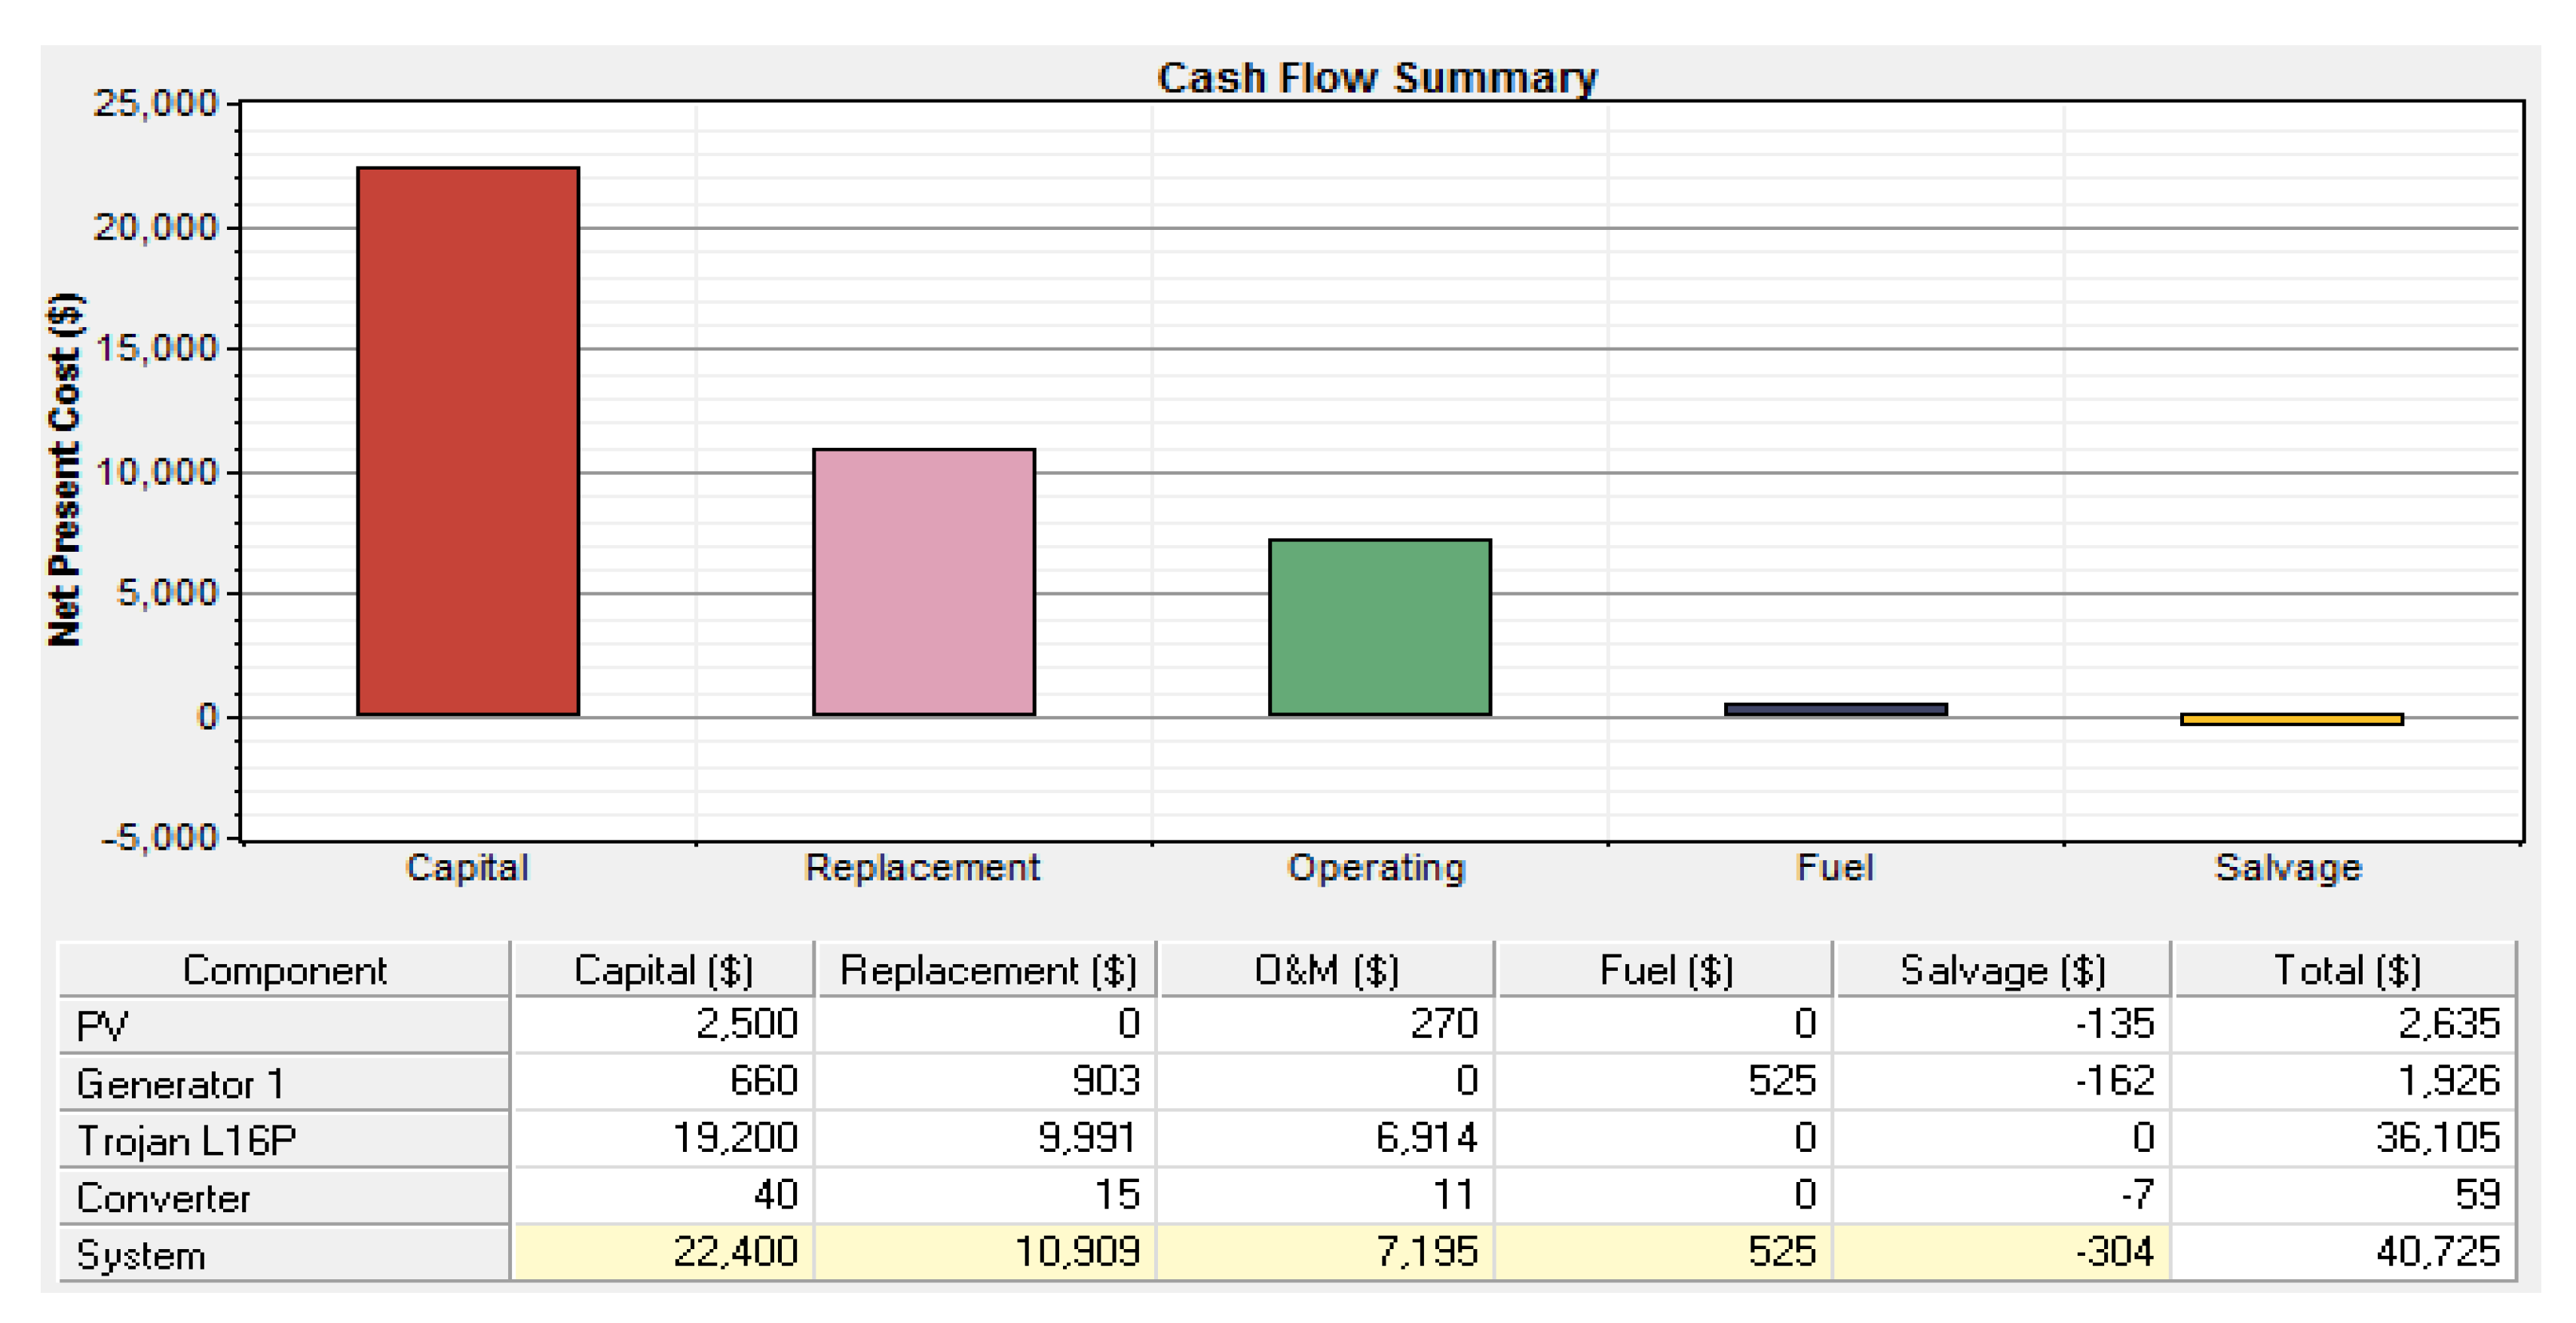
Figure 26.
Cash flow summary for the off-grid hybrid PV/BG system under 10 MHz bandwidth.
Figure 26.
Cash flow summary for the off-grid hybrid PV/BG system under 10 MHz bandwidth.
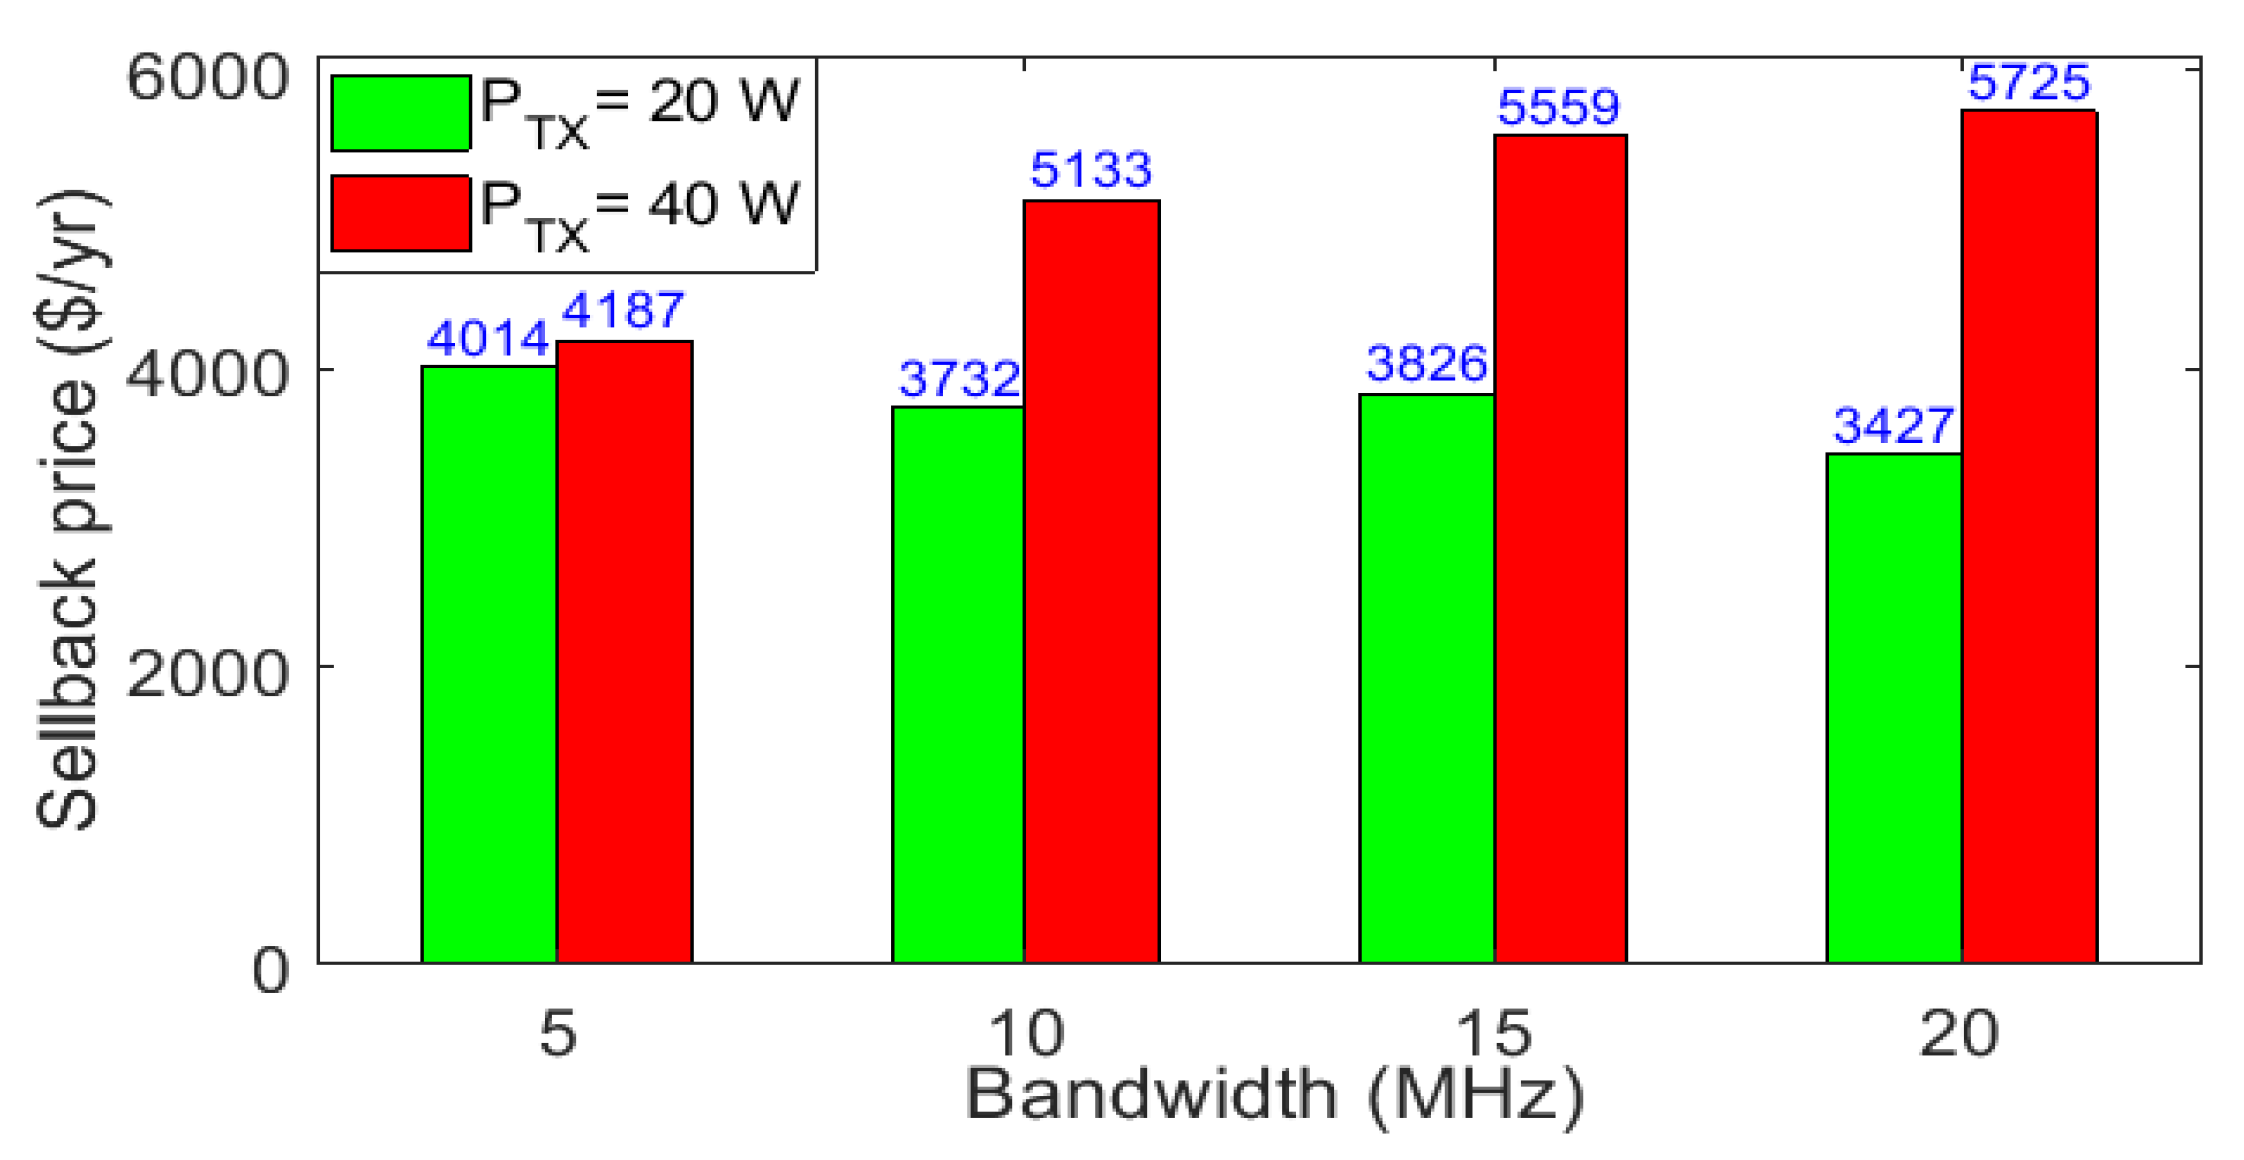
Figure 27.
Sellback price for the grid-tied hybrid PV/BG system under different BW.
Figure 27.
Sellback price for the grid-tied hybrid PV/BG system under different BW.
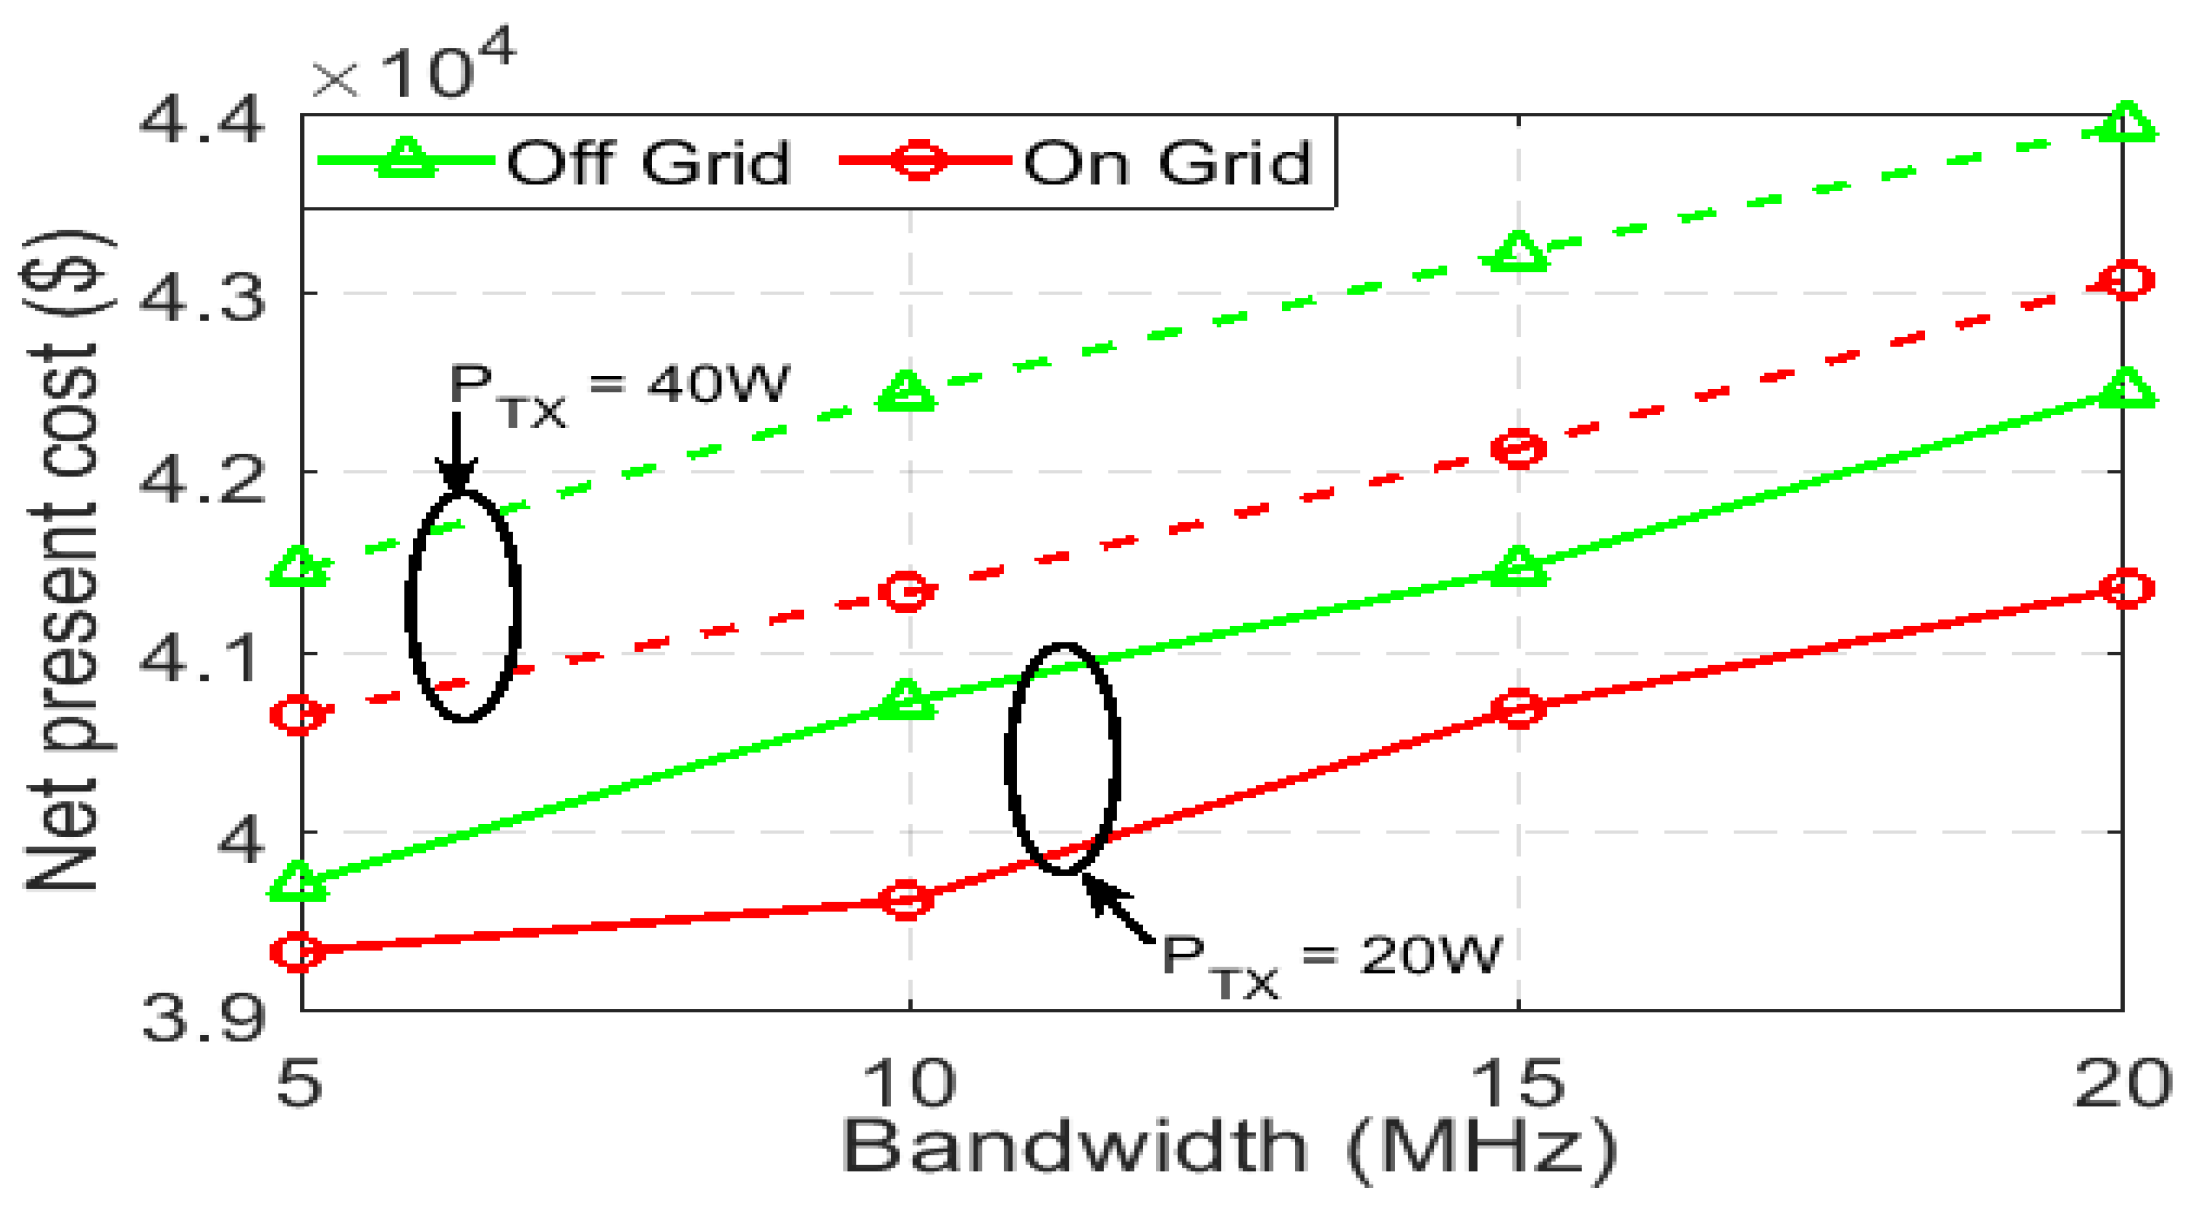
Figure 28.
Net present cost vs. bandwidth for the proposed system.
Figure 28.
Net present cost vs. bandwidth for the proposed system.
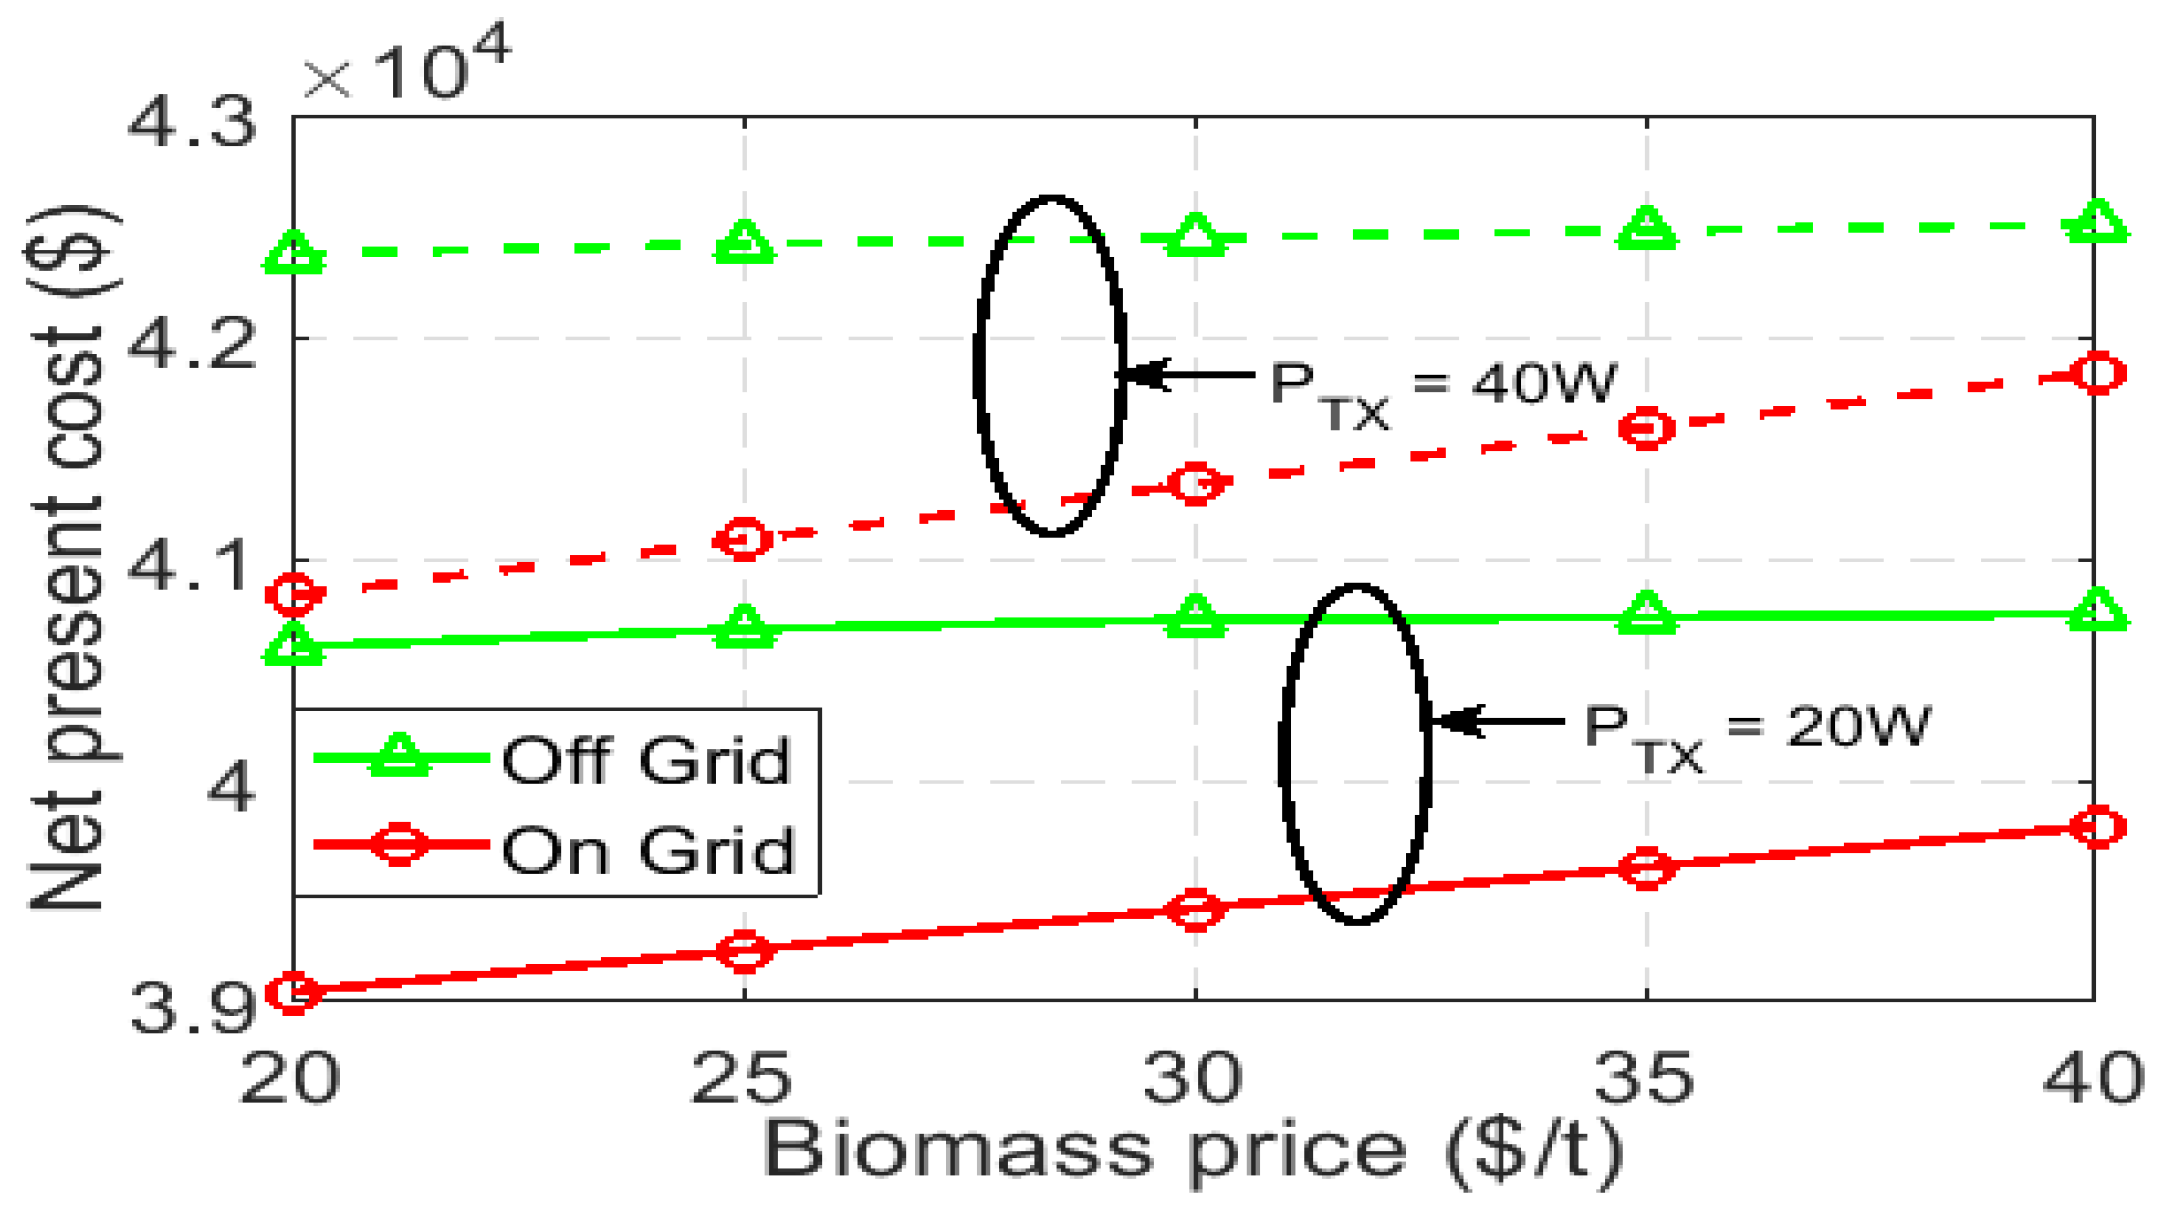
Figure 29.
Net present cost vs. biomass price for the proposed system.
Figure 29.
Net present cost vs. biomass price for the proposed system.
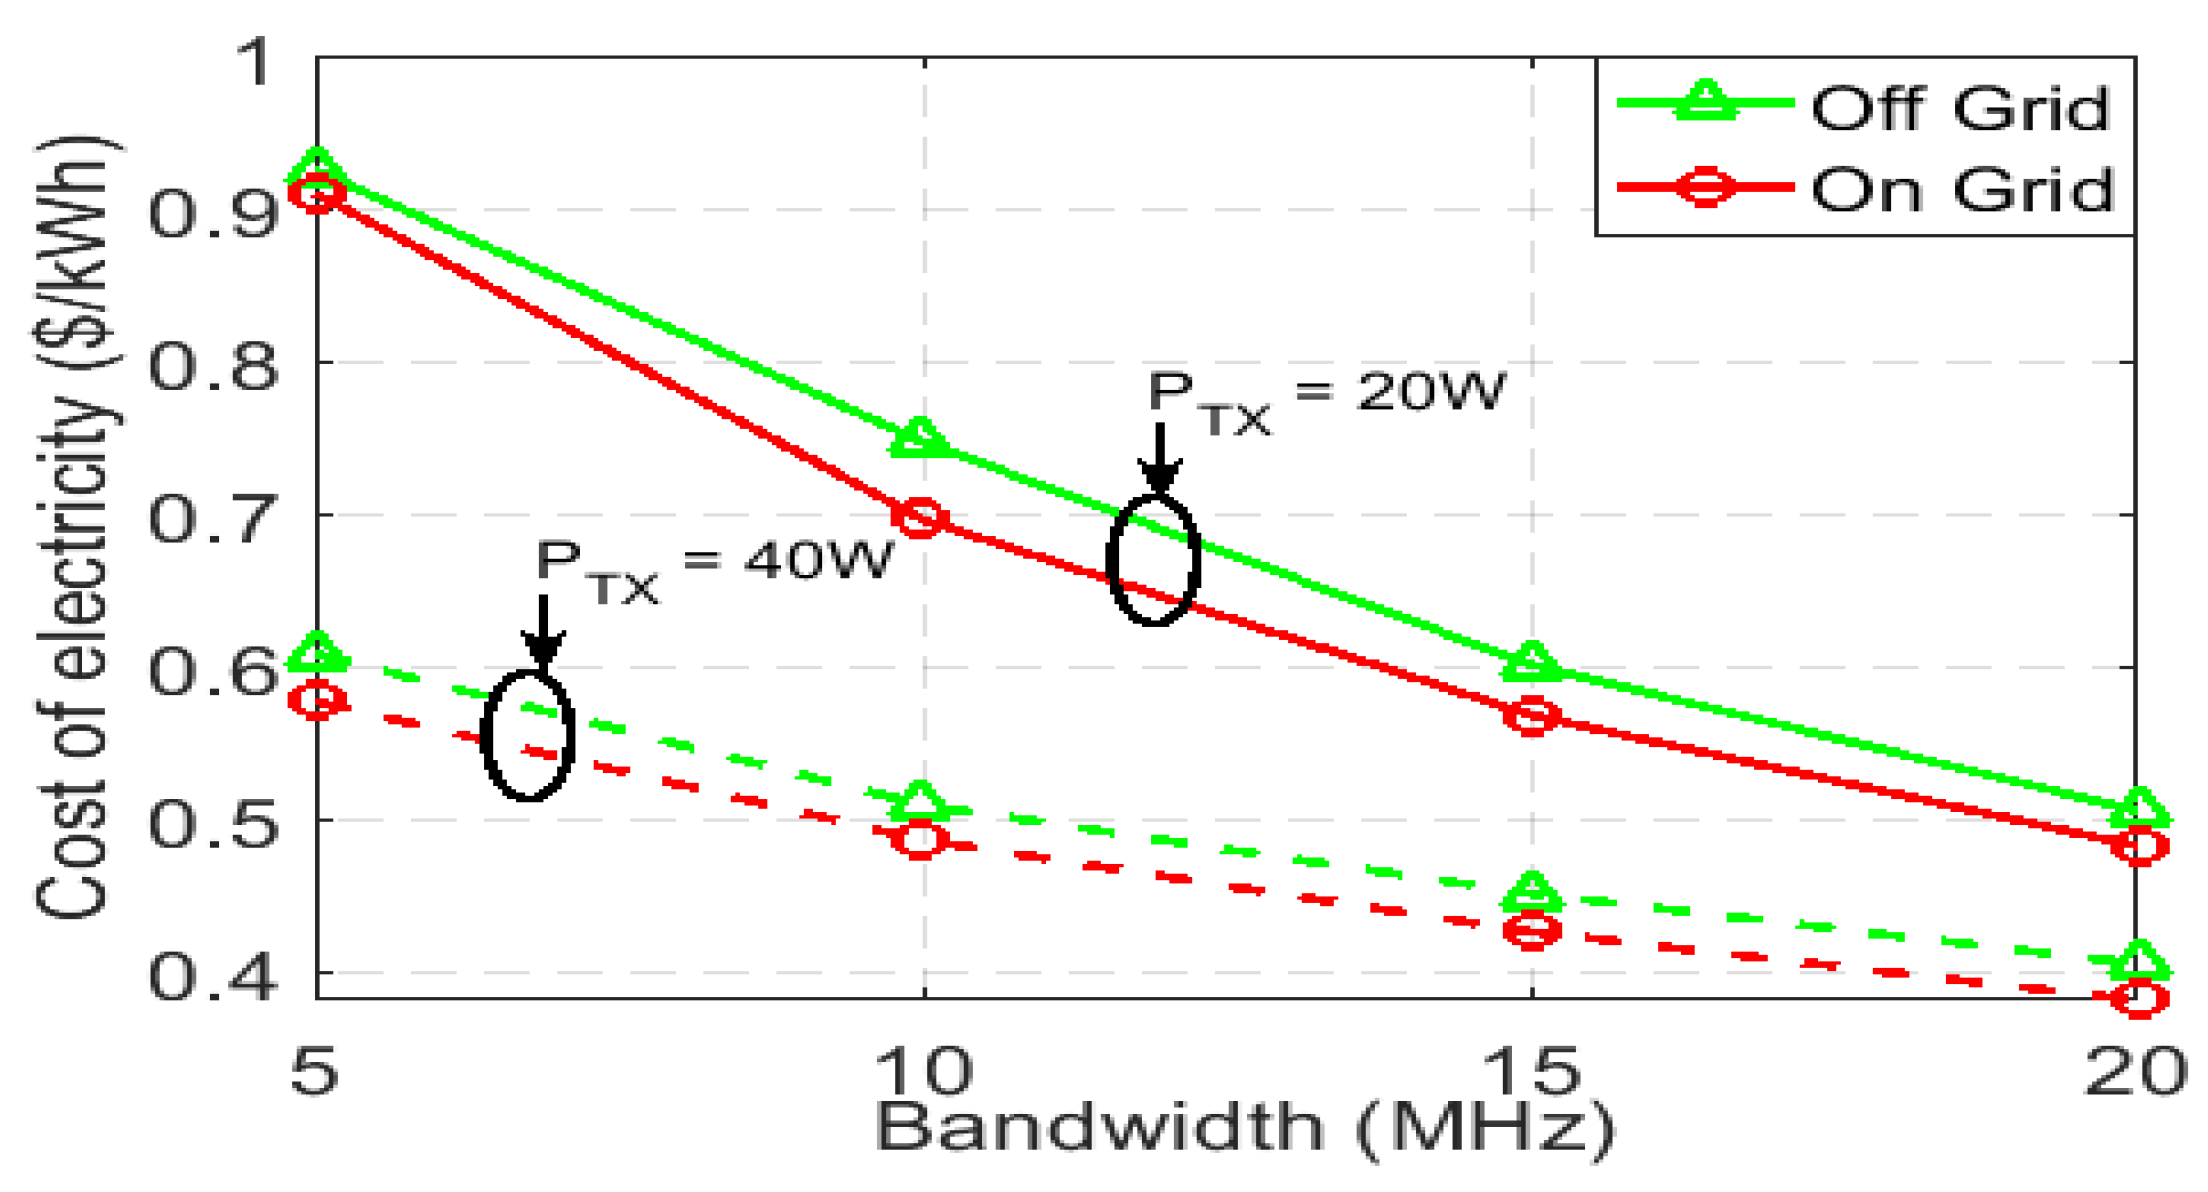
Figure 30.
Cost of electricity vs. bandwidth for the proposed system.
Figure 30.
Cost of electricity vs. bandwidth for the proposed system.
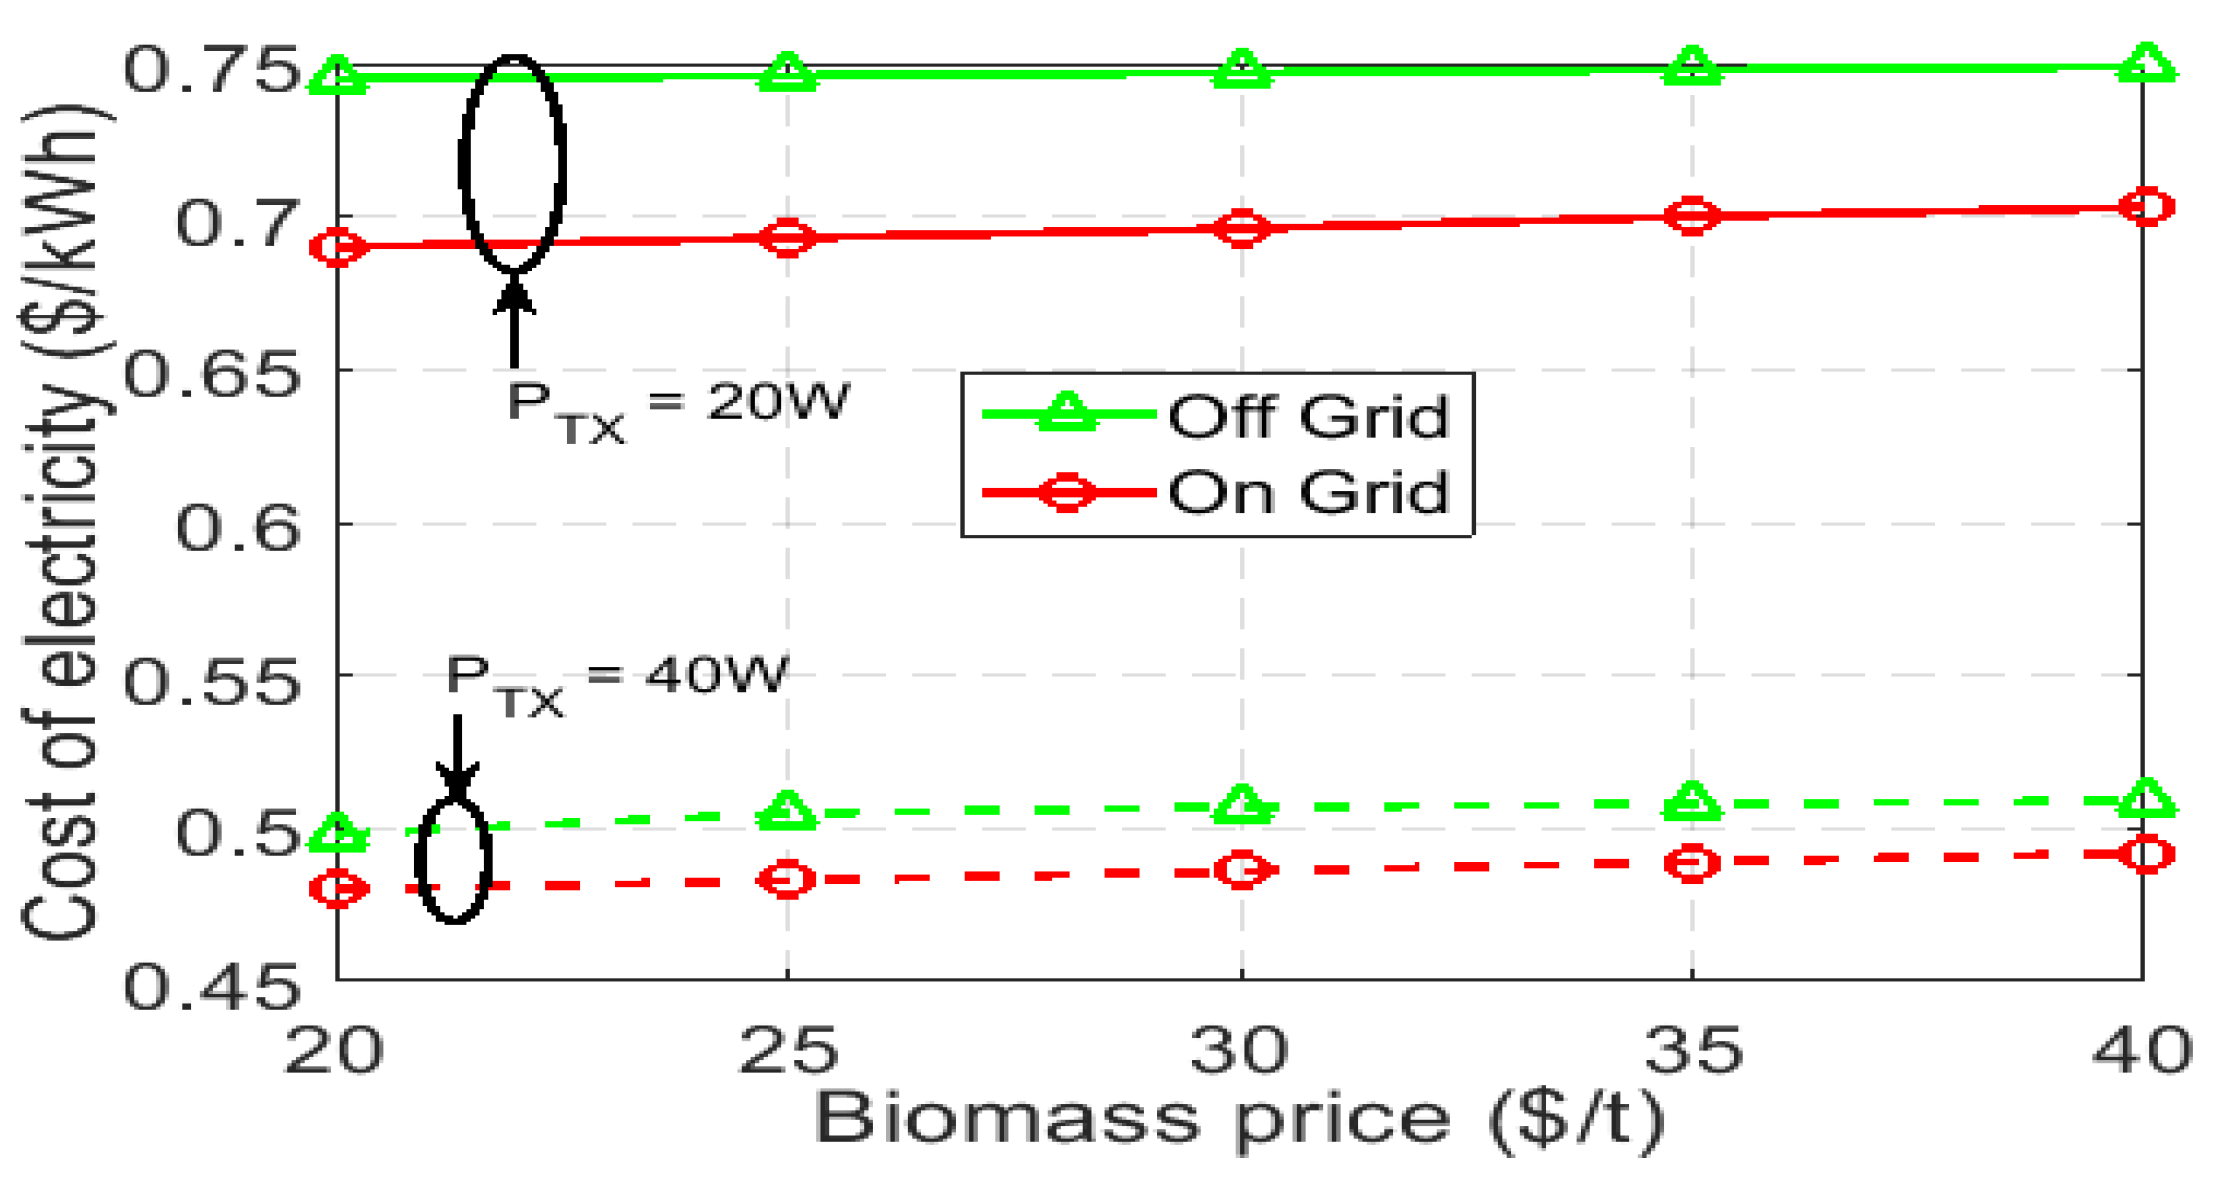
Figure 31.
Cost of electricity vs. biomass price for the proposed system.
Figure 31.
Cost of electricity vs. biomass price for the proposed system.
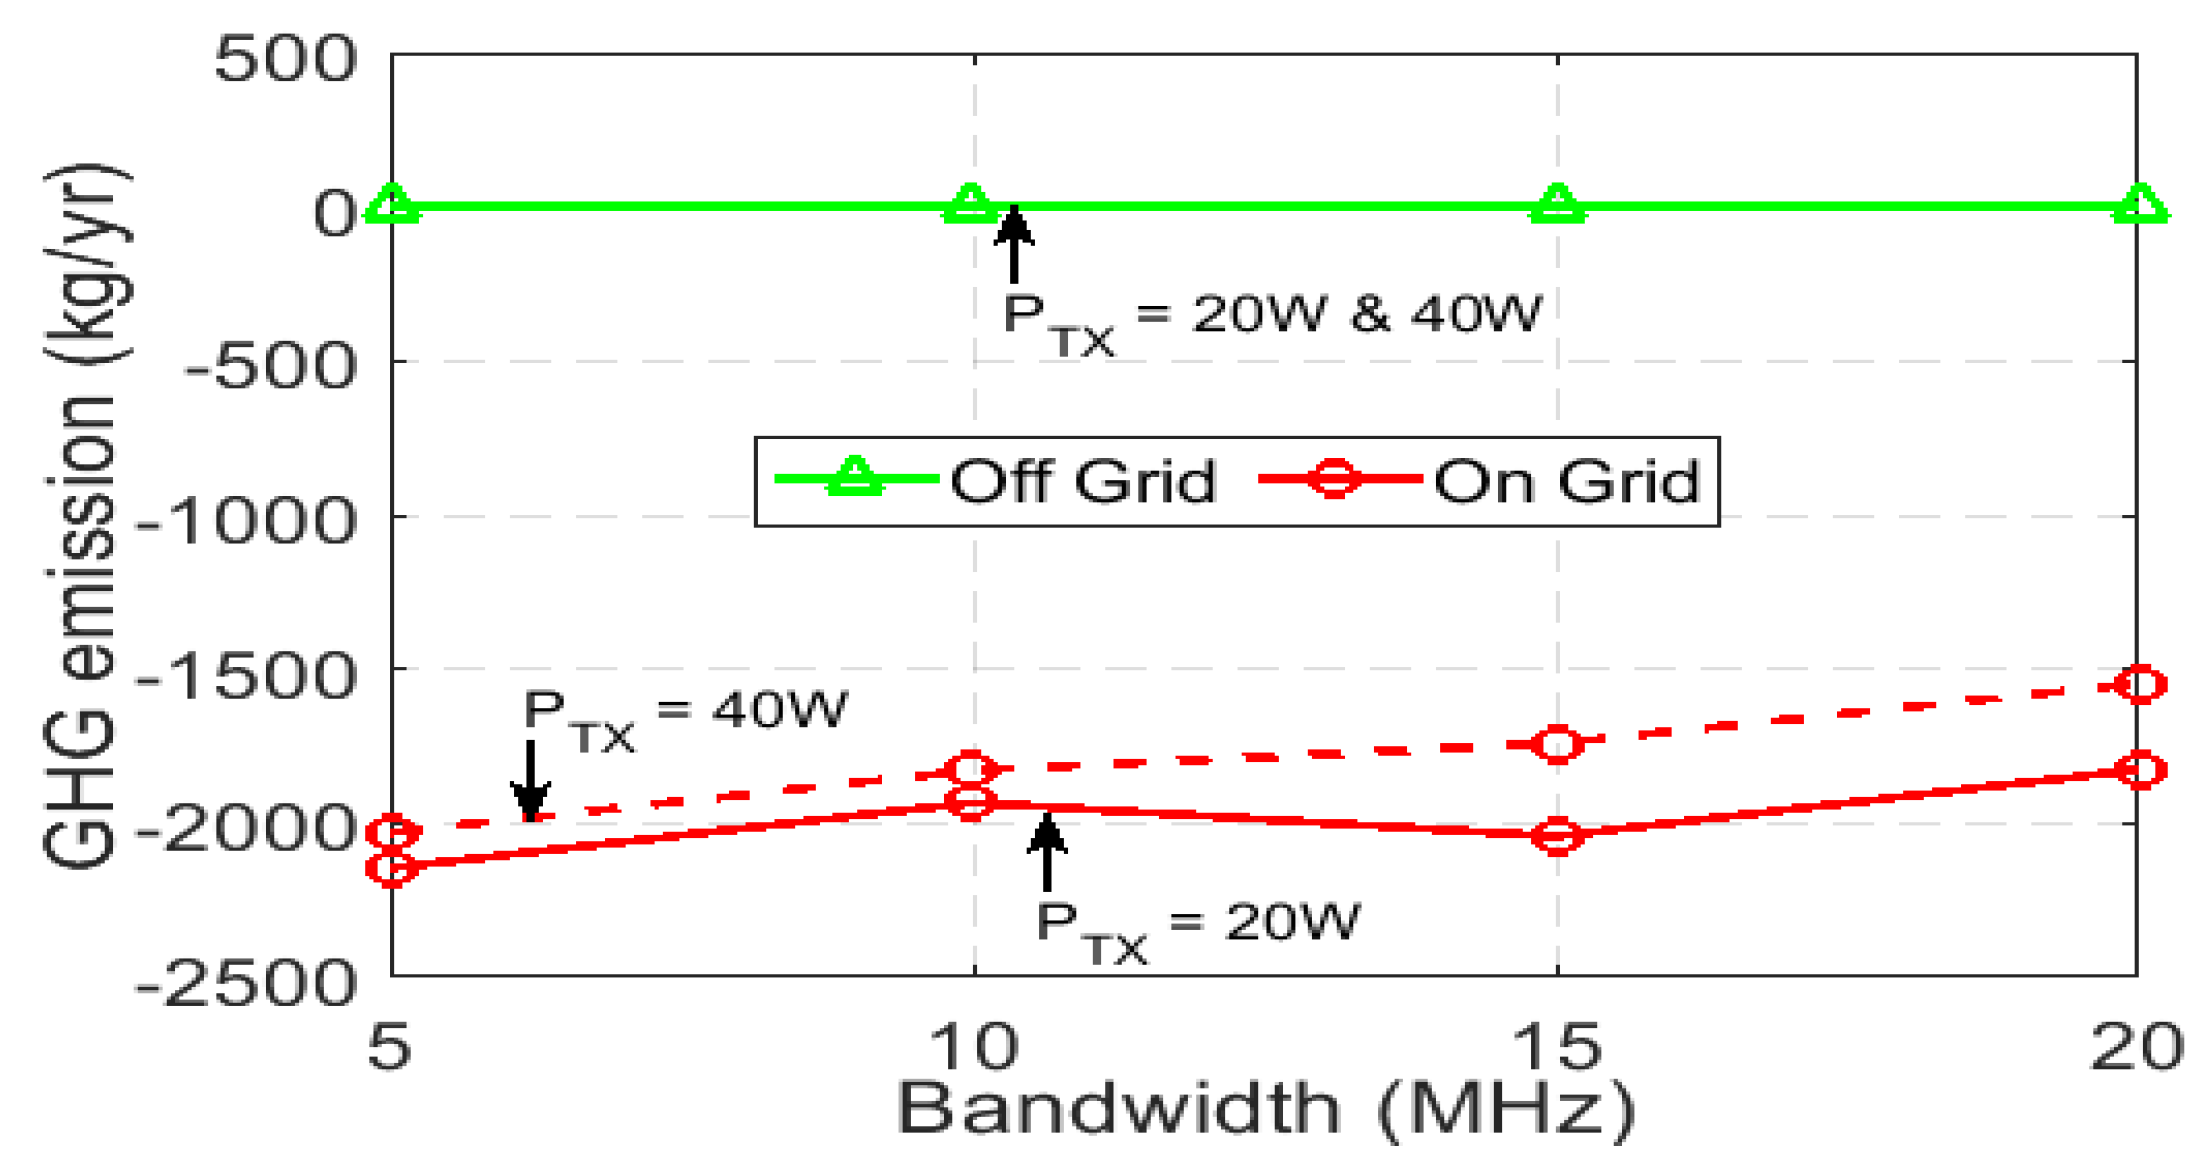
Figure 32.
Greenhouse gas emissions vs. biomass price for the proposed system.
Figure 32.
Greenhouse gas emissions vs. biomass price for the proposed system.
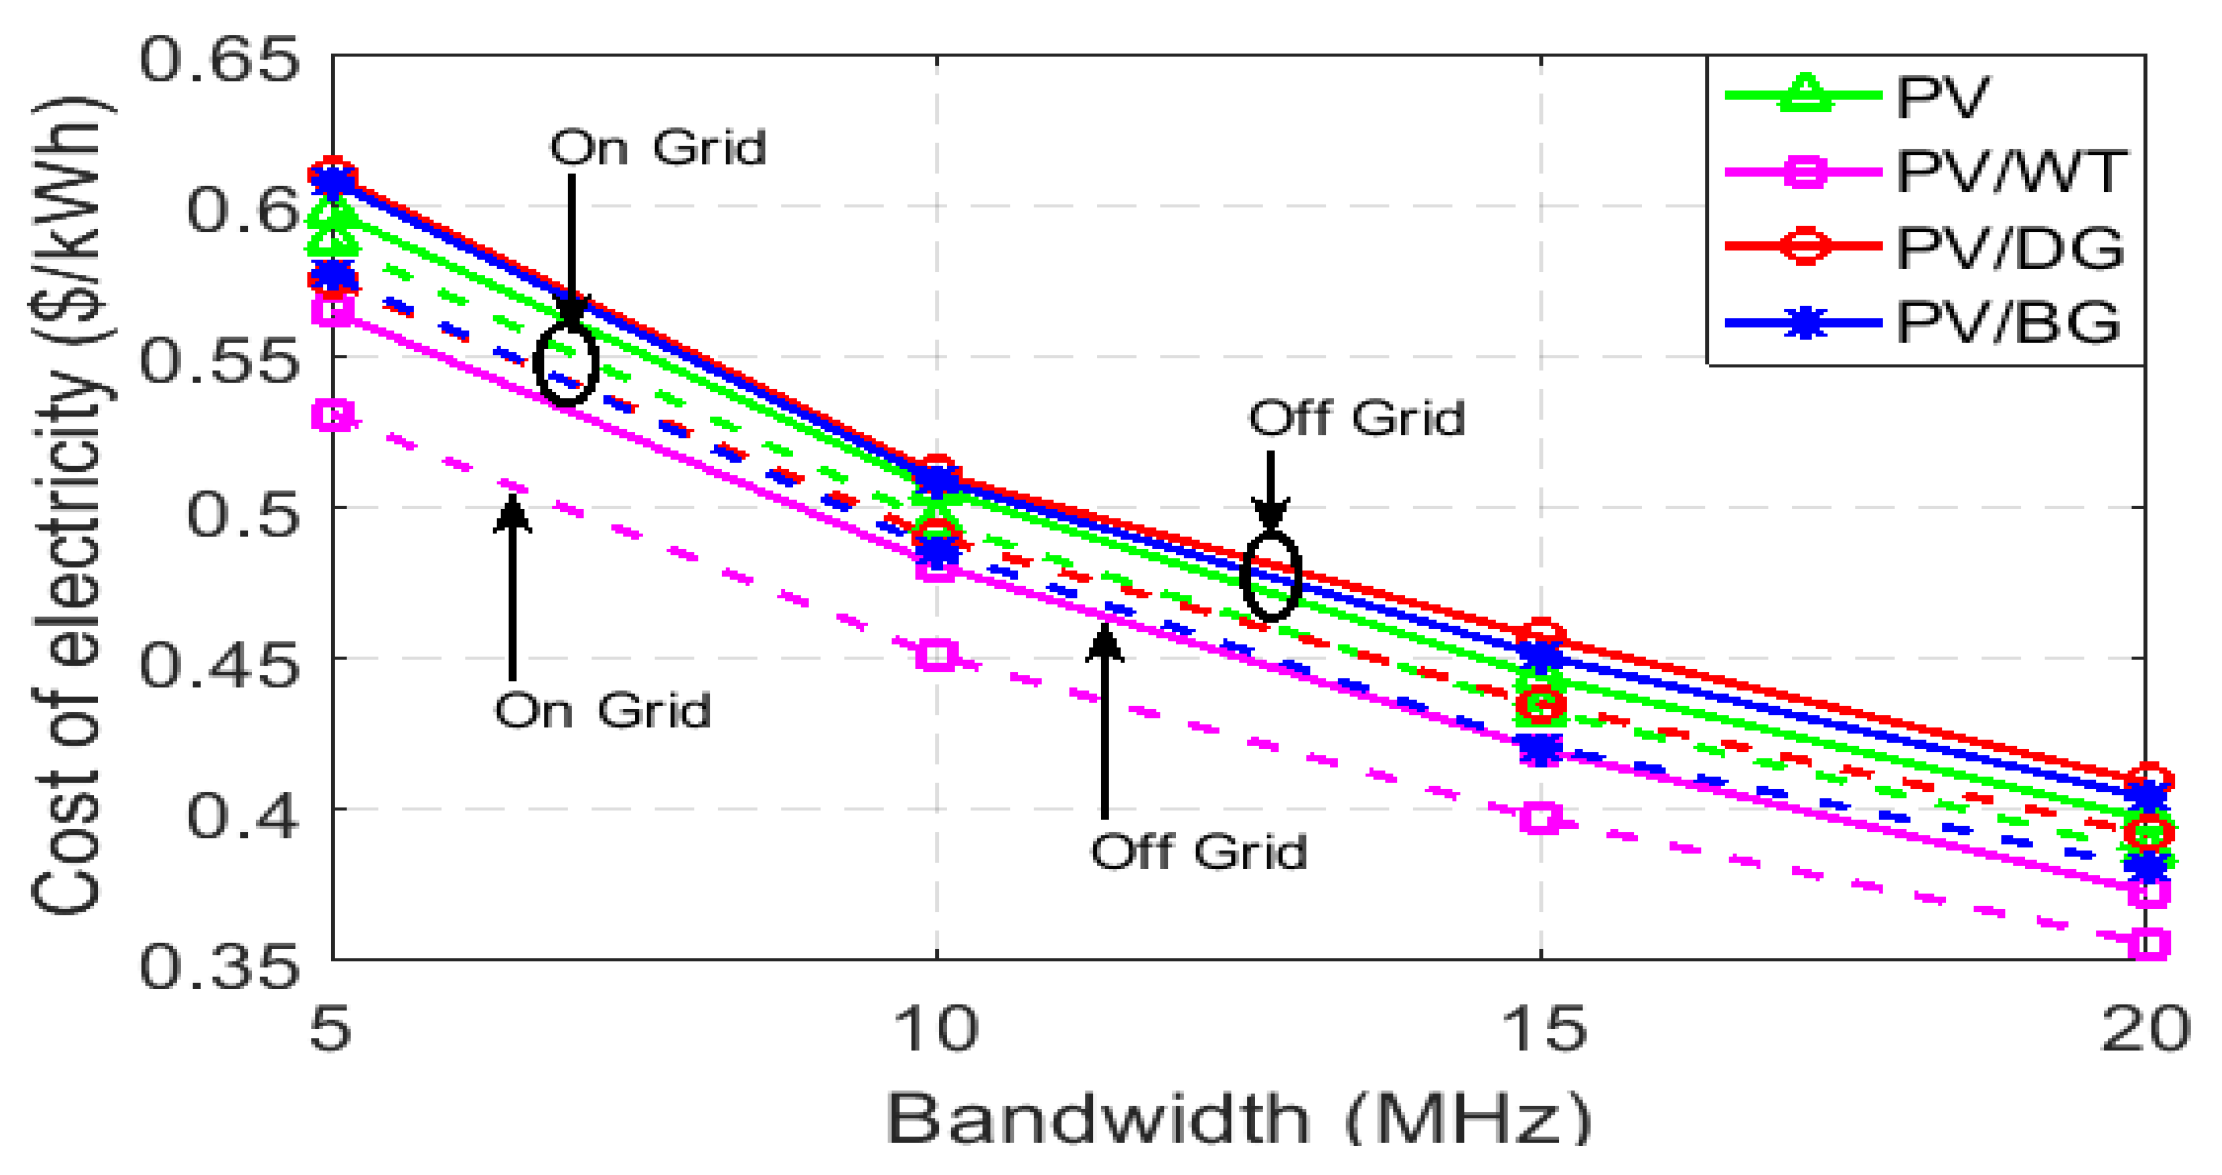
Figure 33.
Comparison of COE between on-grid and off-grid under different system BW.
Figure 33.
Comparison of COE between on-grid and off-grid under different system BW.
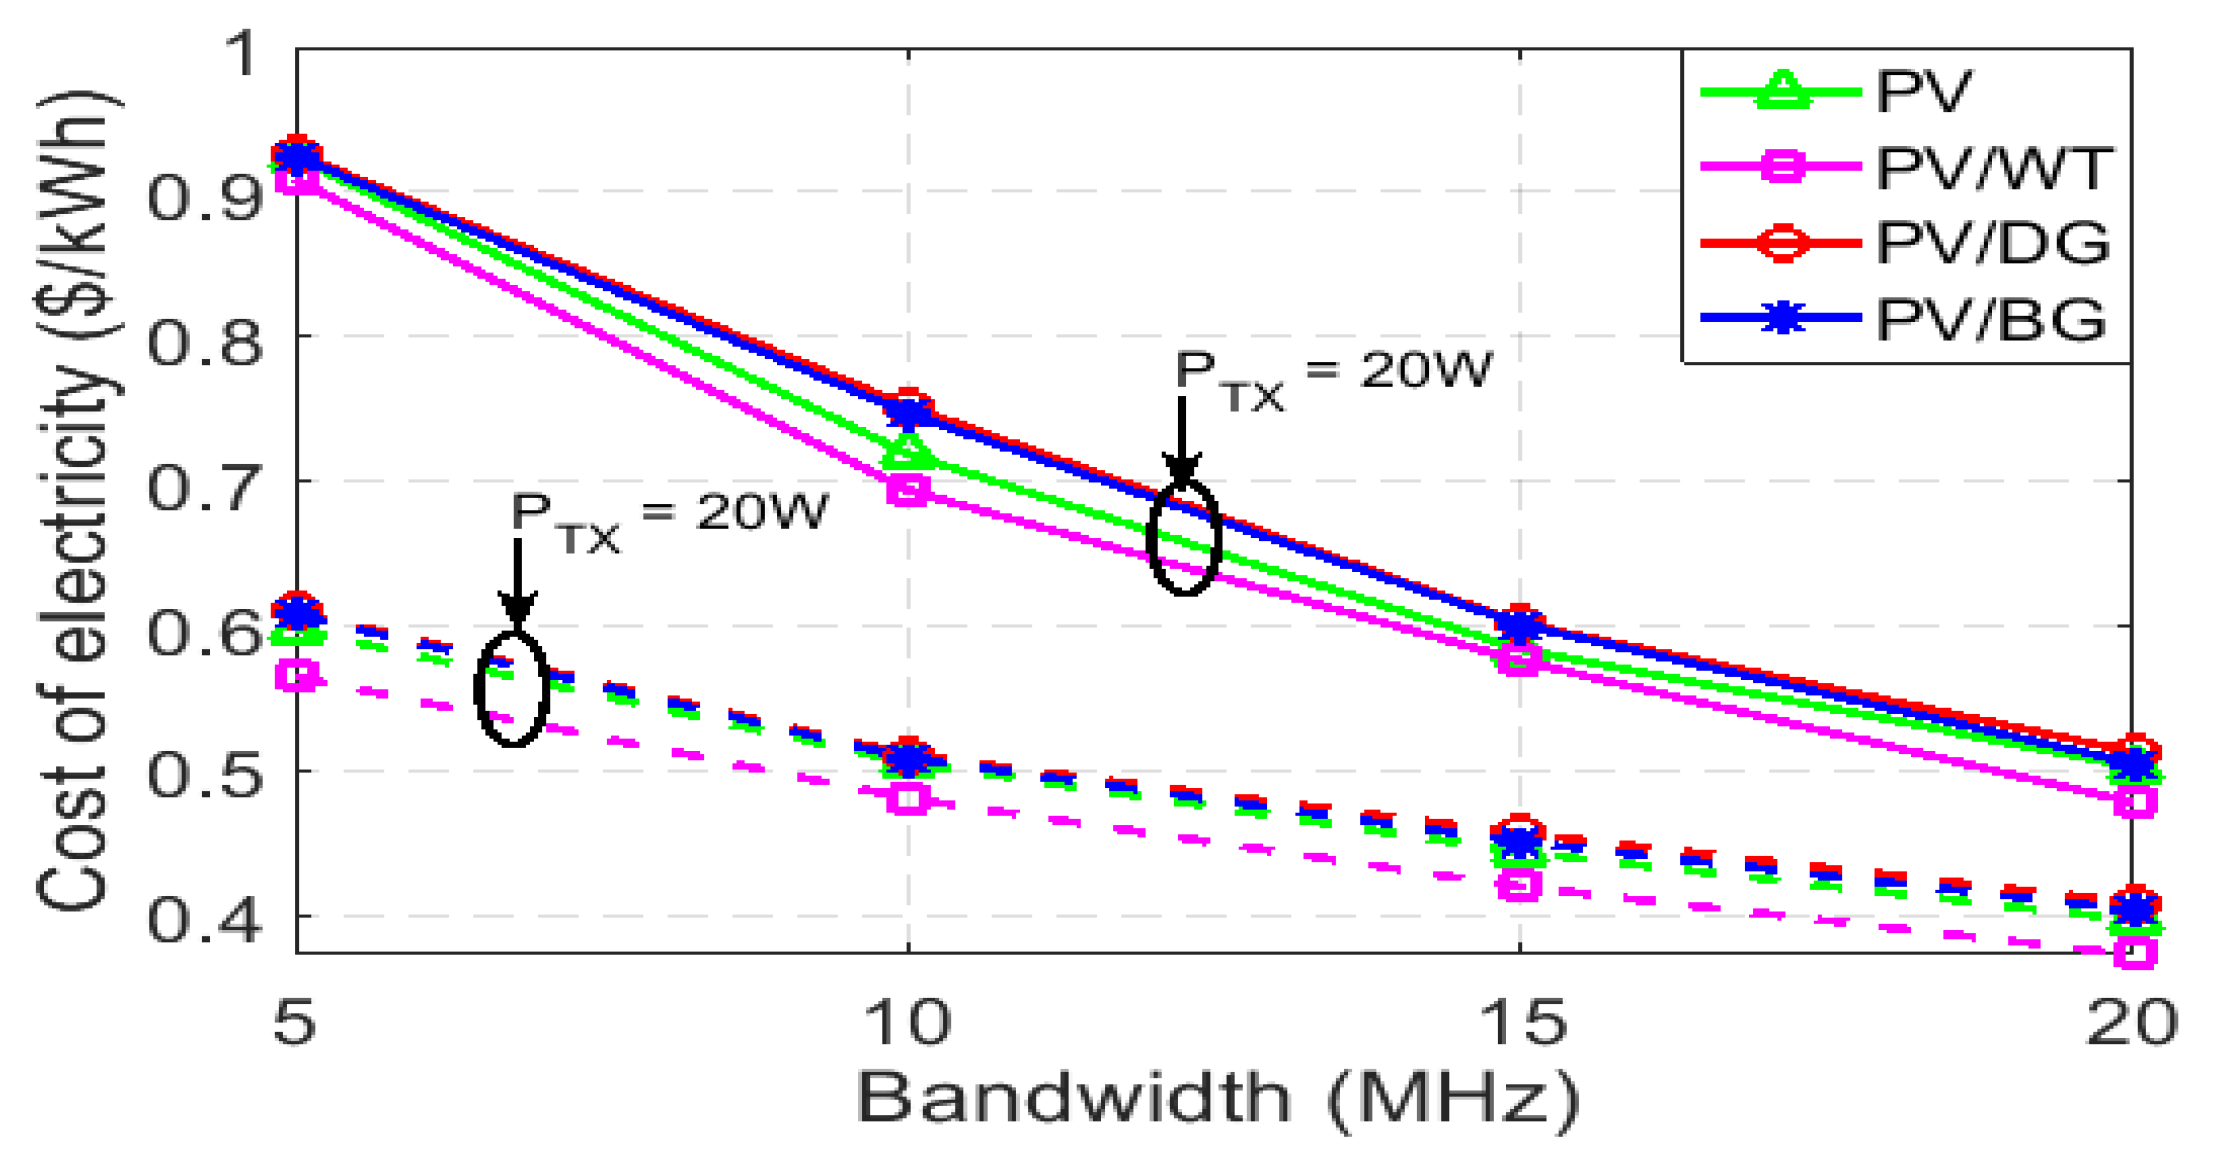
Figure 34.
Comparison of COE under different transmission power.
Figure 34.
Comparison of COE under different transmission power.
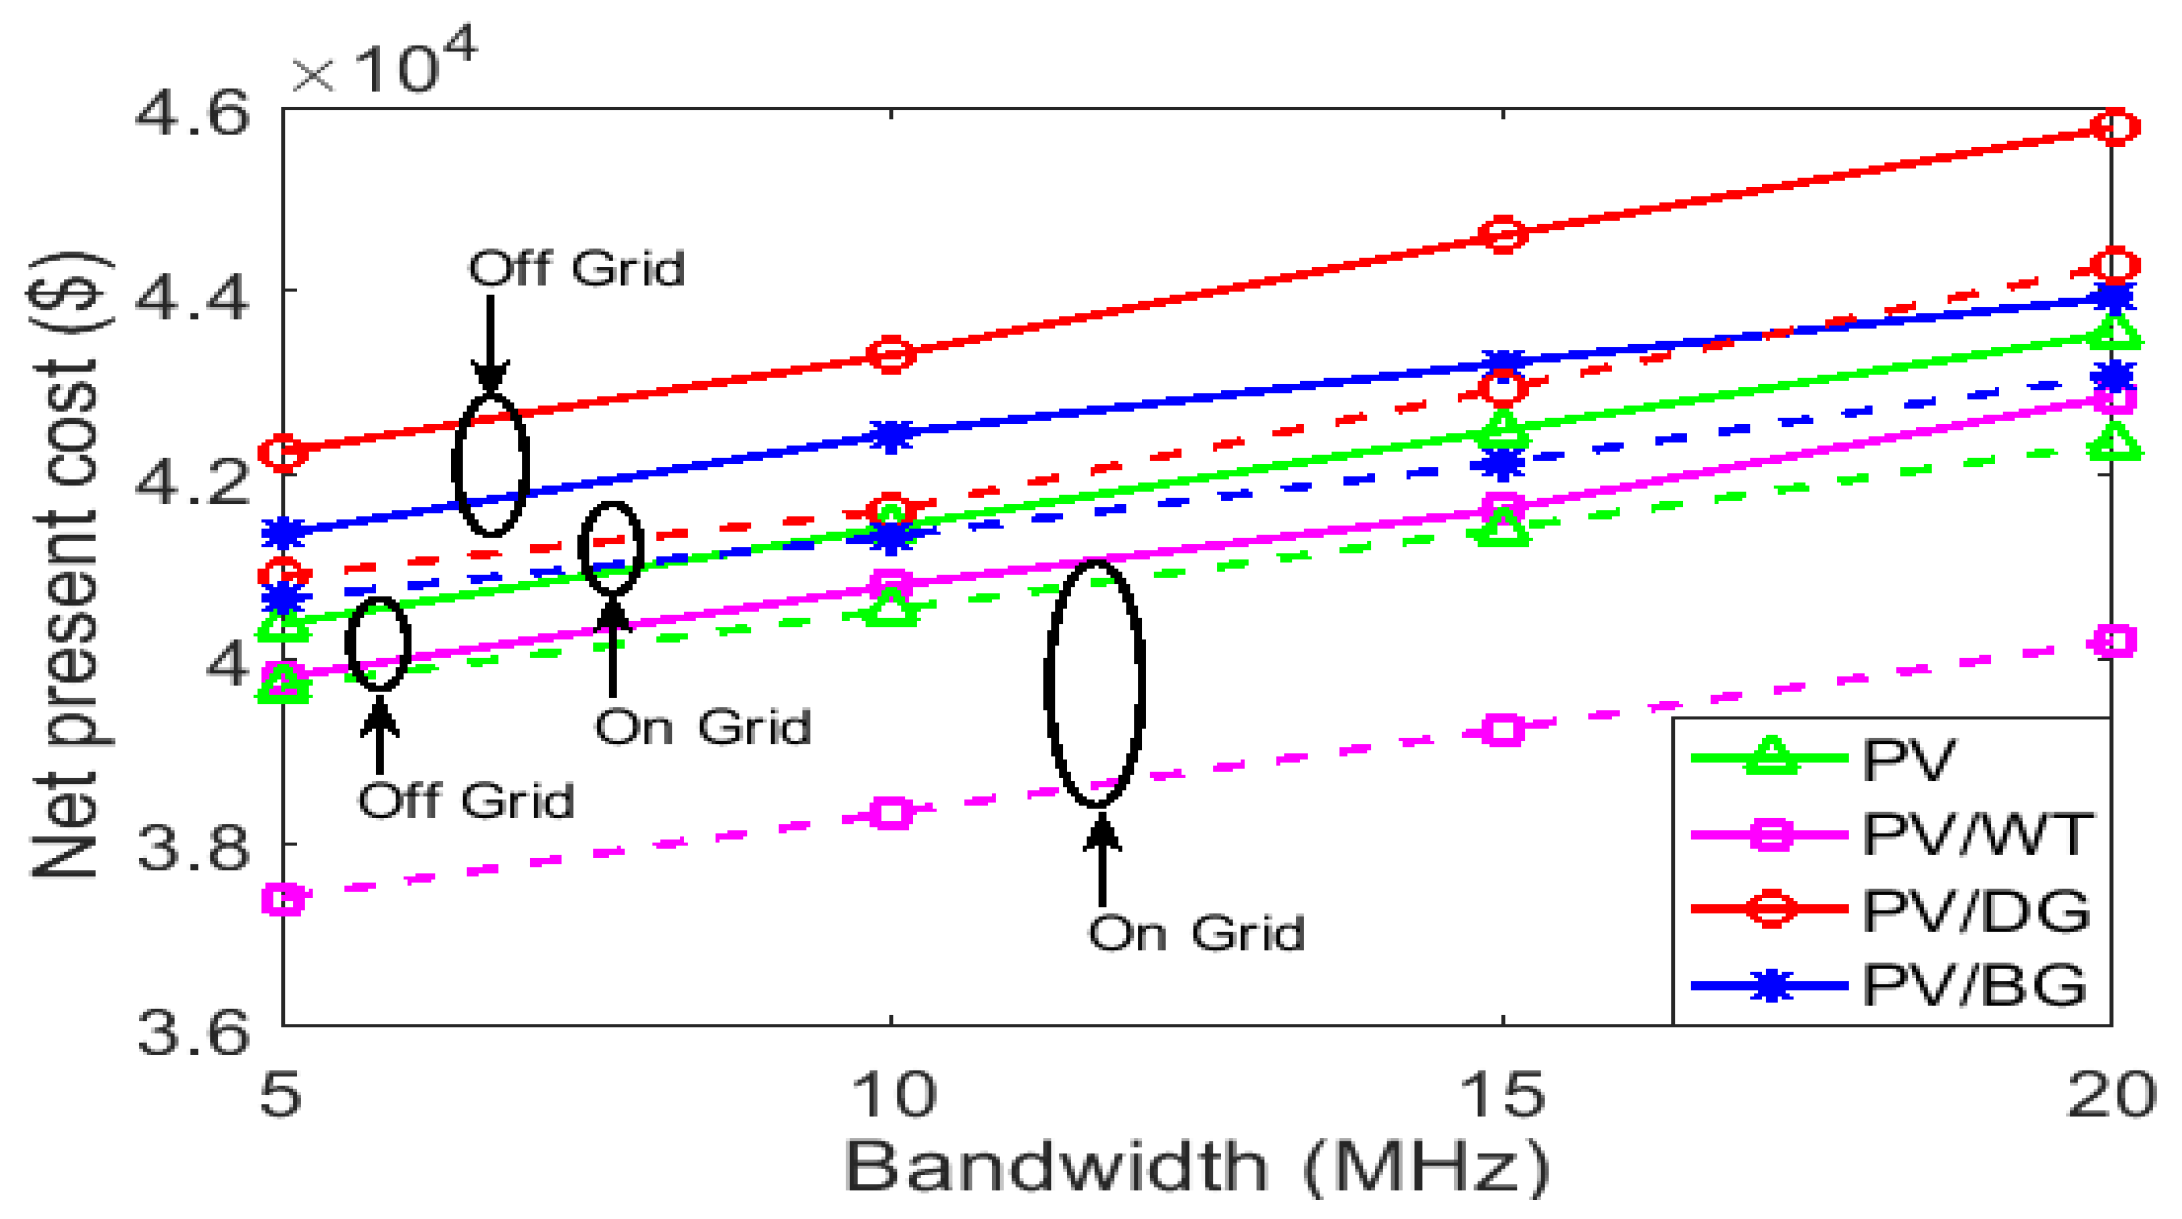
Figure 35.
Comparison of NPC between on-grid and off-grid under different system BW.
Figure 35.
Comparison of NPC between on-grid and off-grid under different system BW.
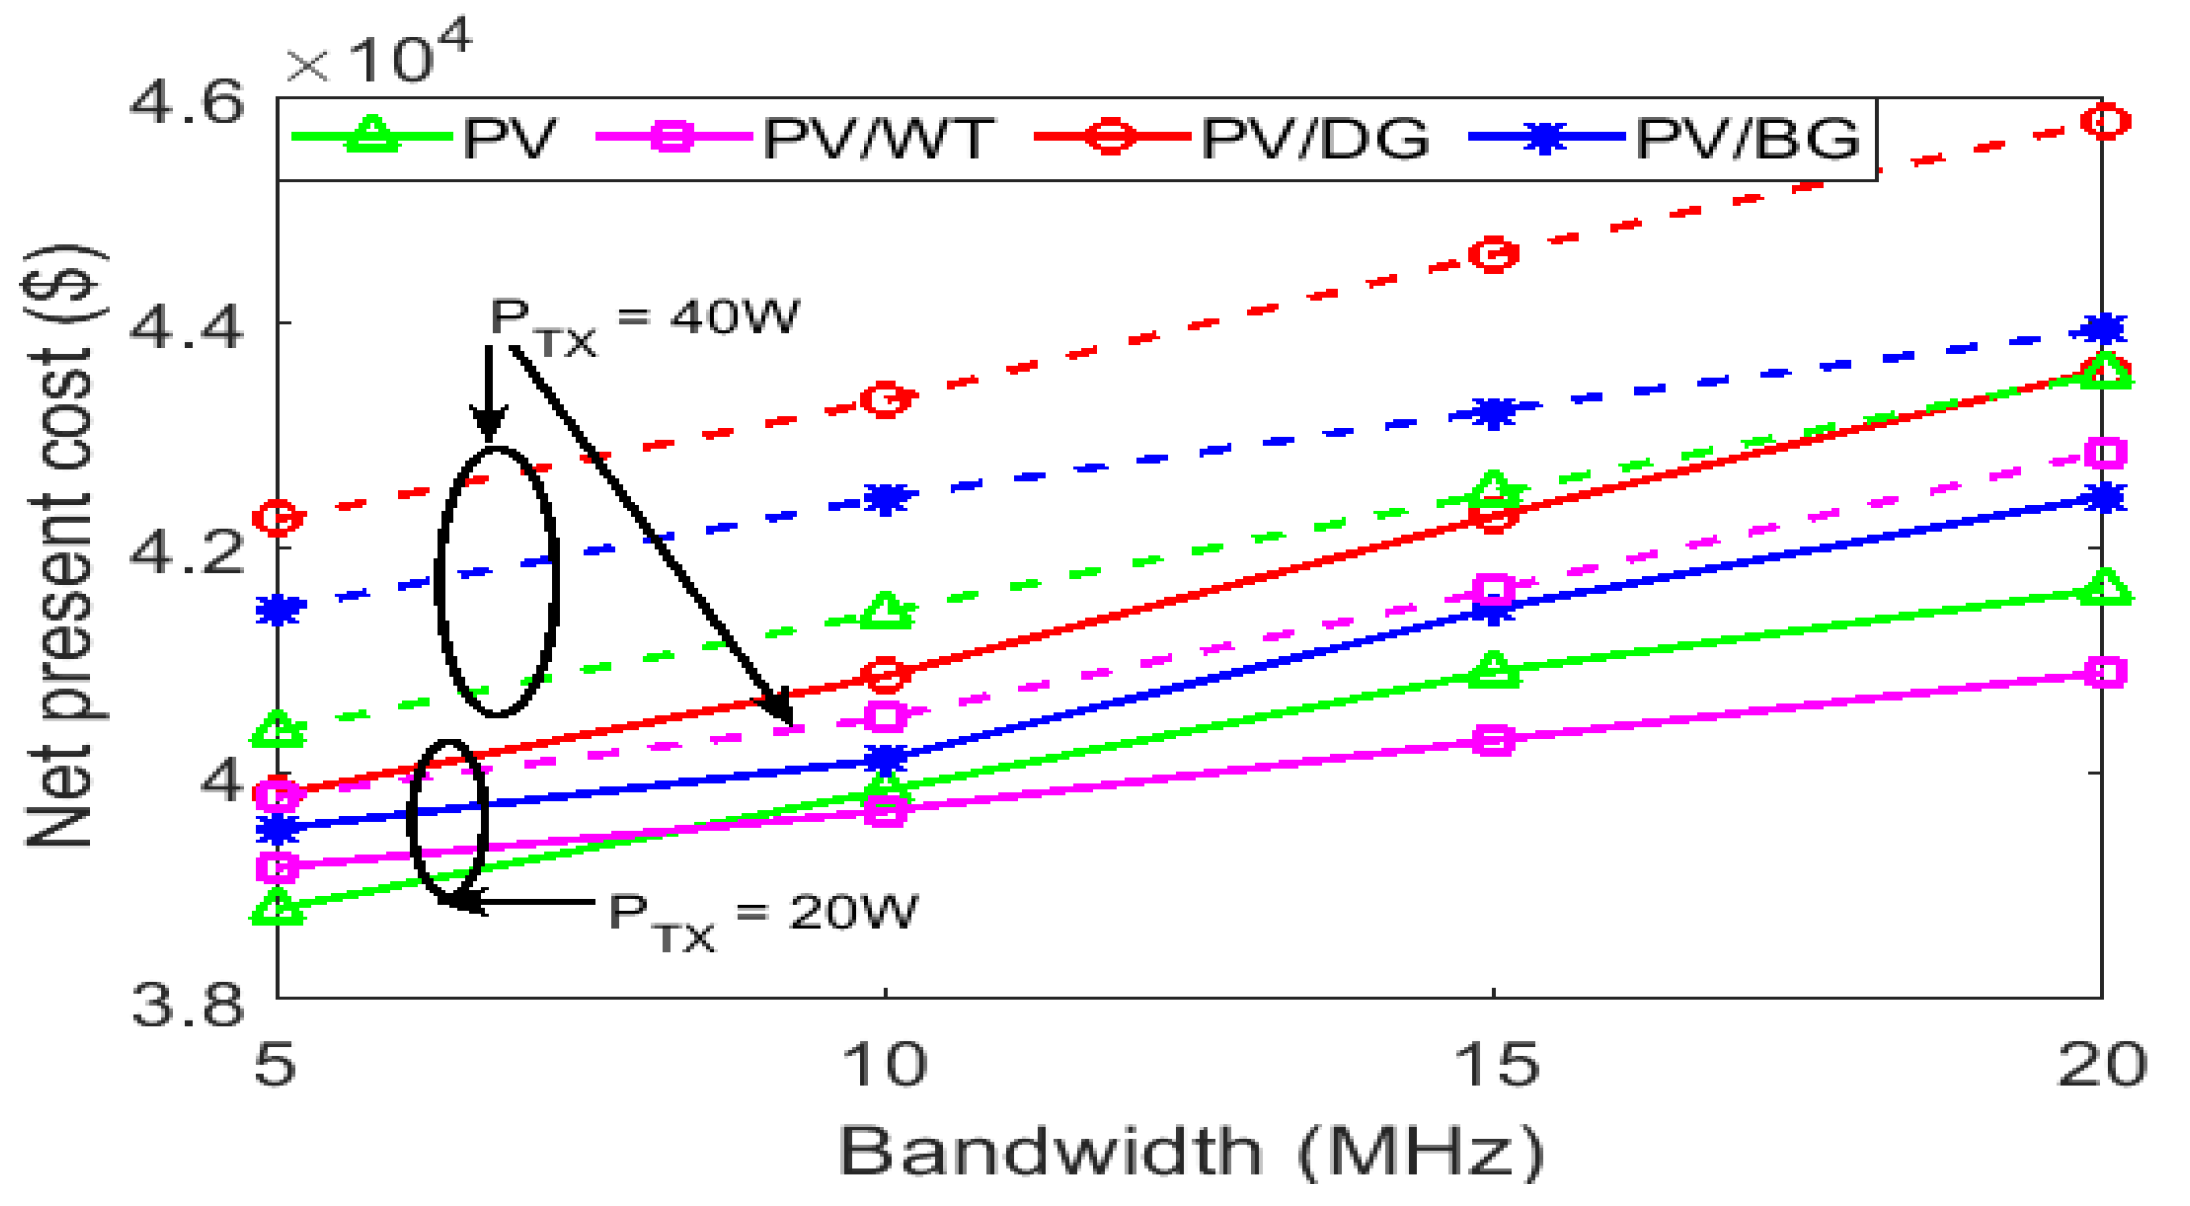
Figure 36.
Comparison of NPC under different transmission power.
Figure 36.
Comparison of NPC under different transmission power.
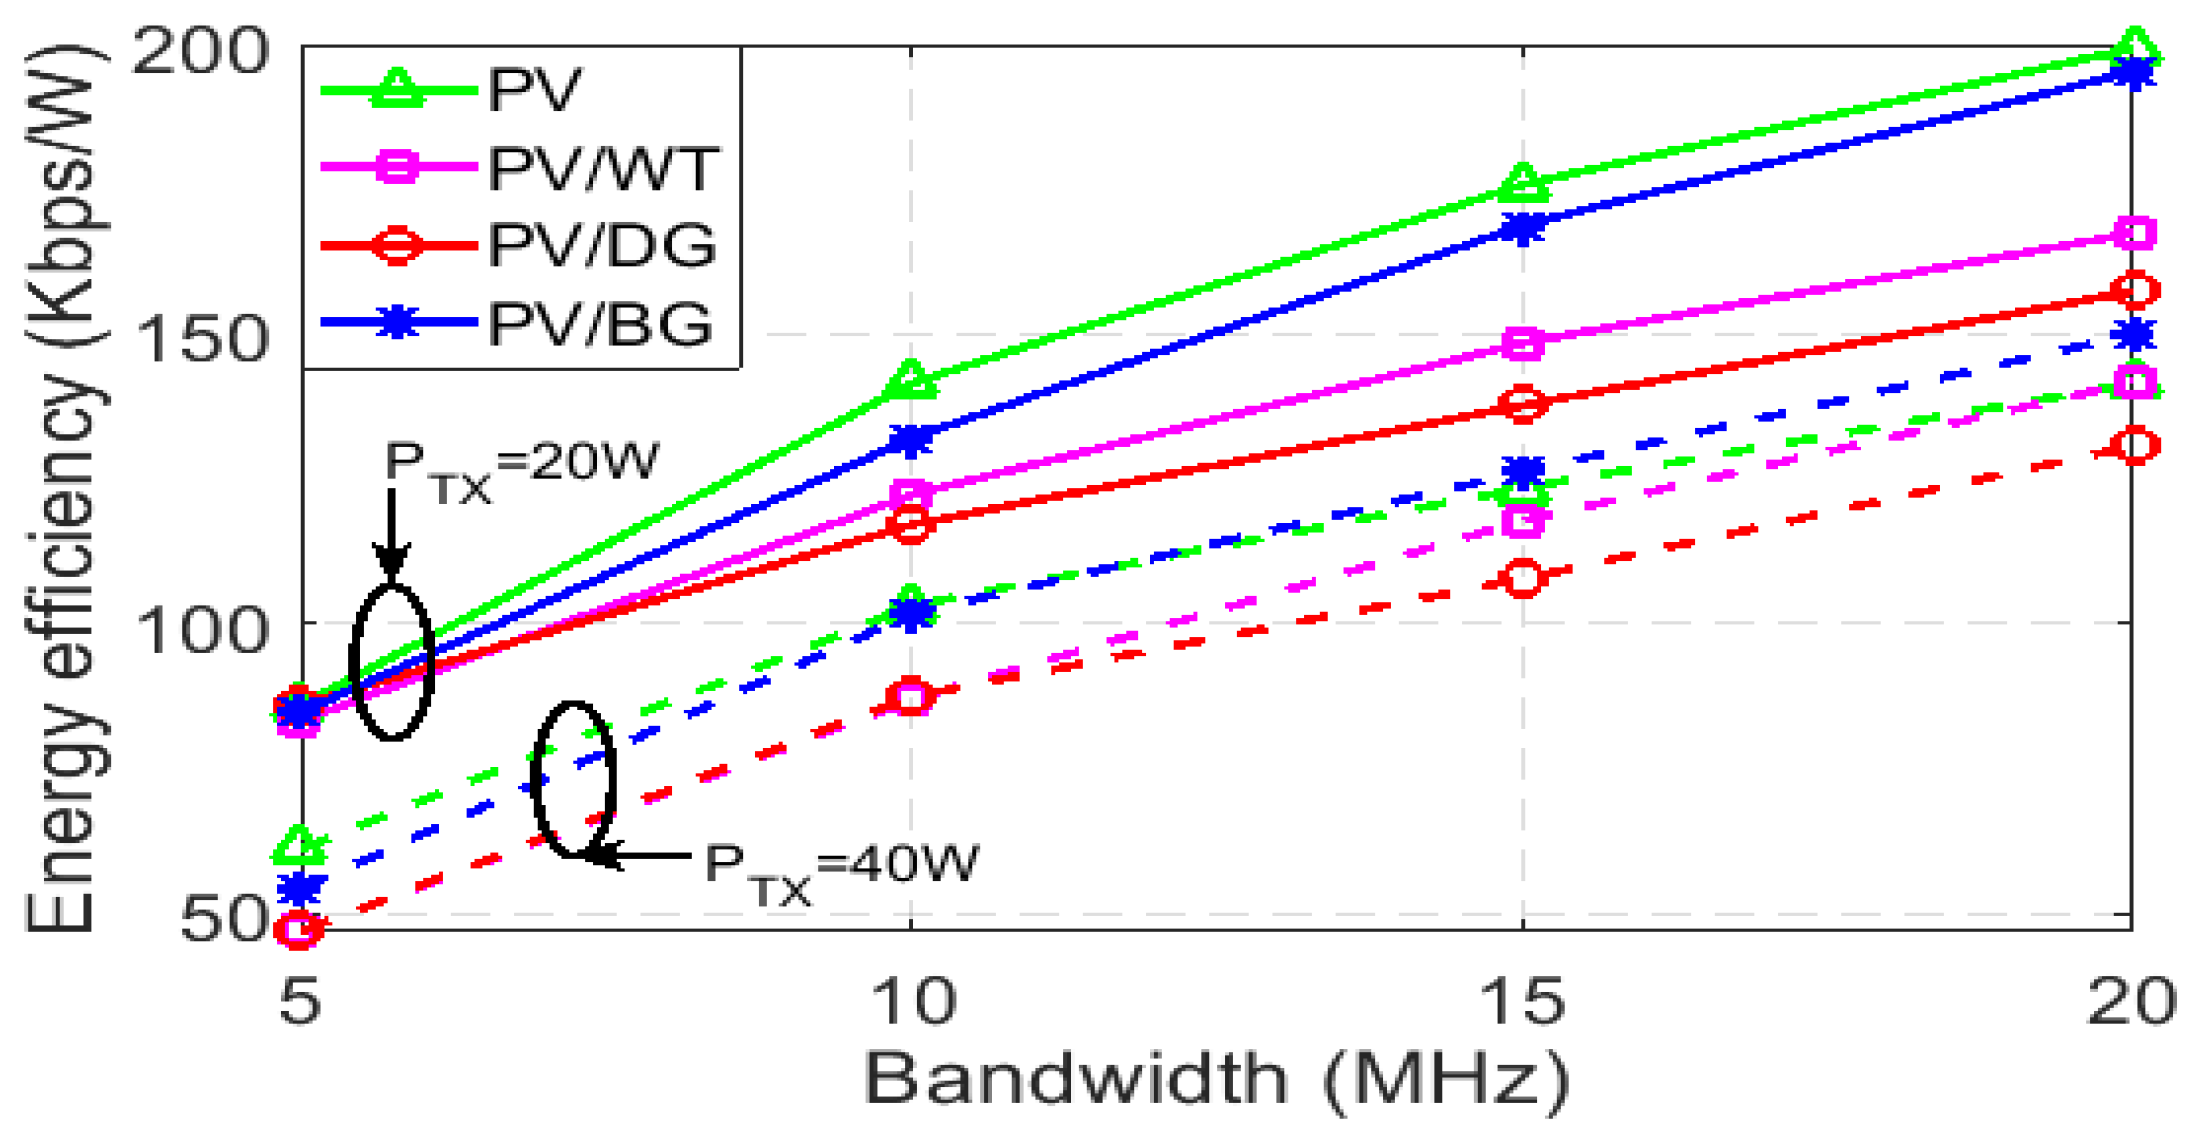
Figure 37.
Energy efficiency performance comparison among the PV, PV/DG, PV/WT, and PV/BG.
Figure 37.
Energy efficiency performance comparison among the PV, PV/DG, PV/WT, and PV/BG.
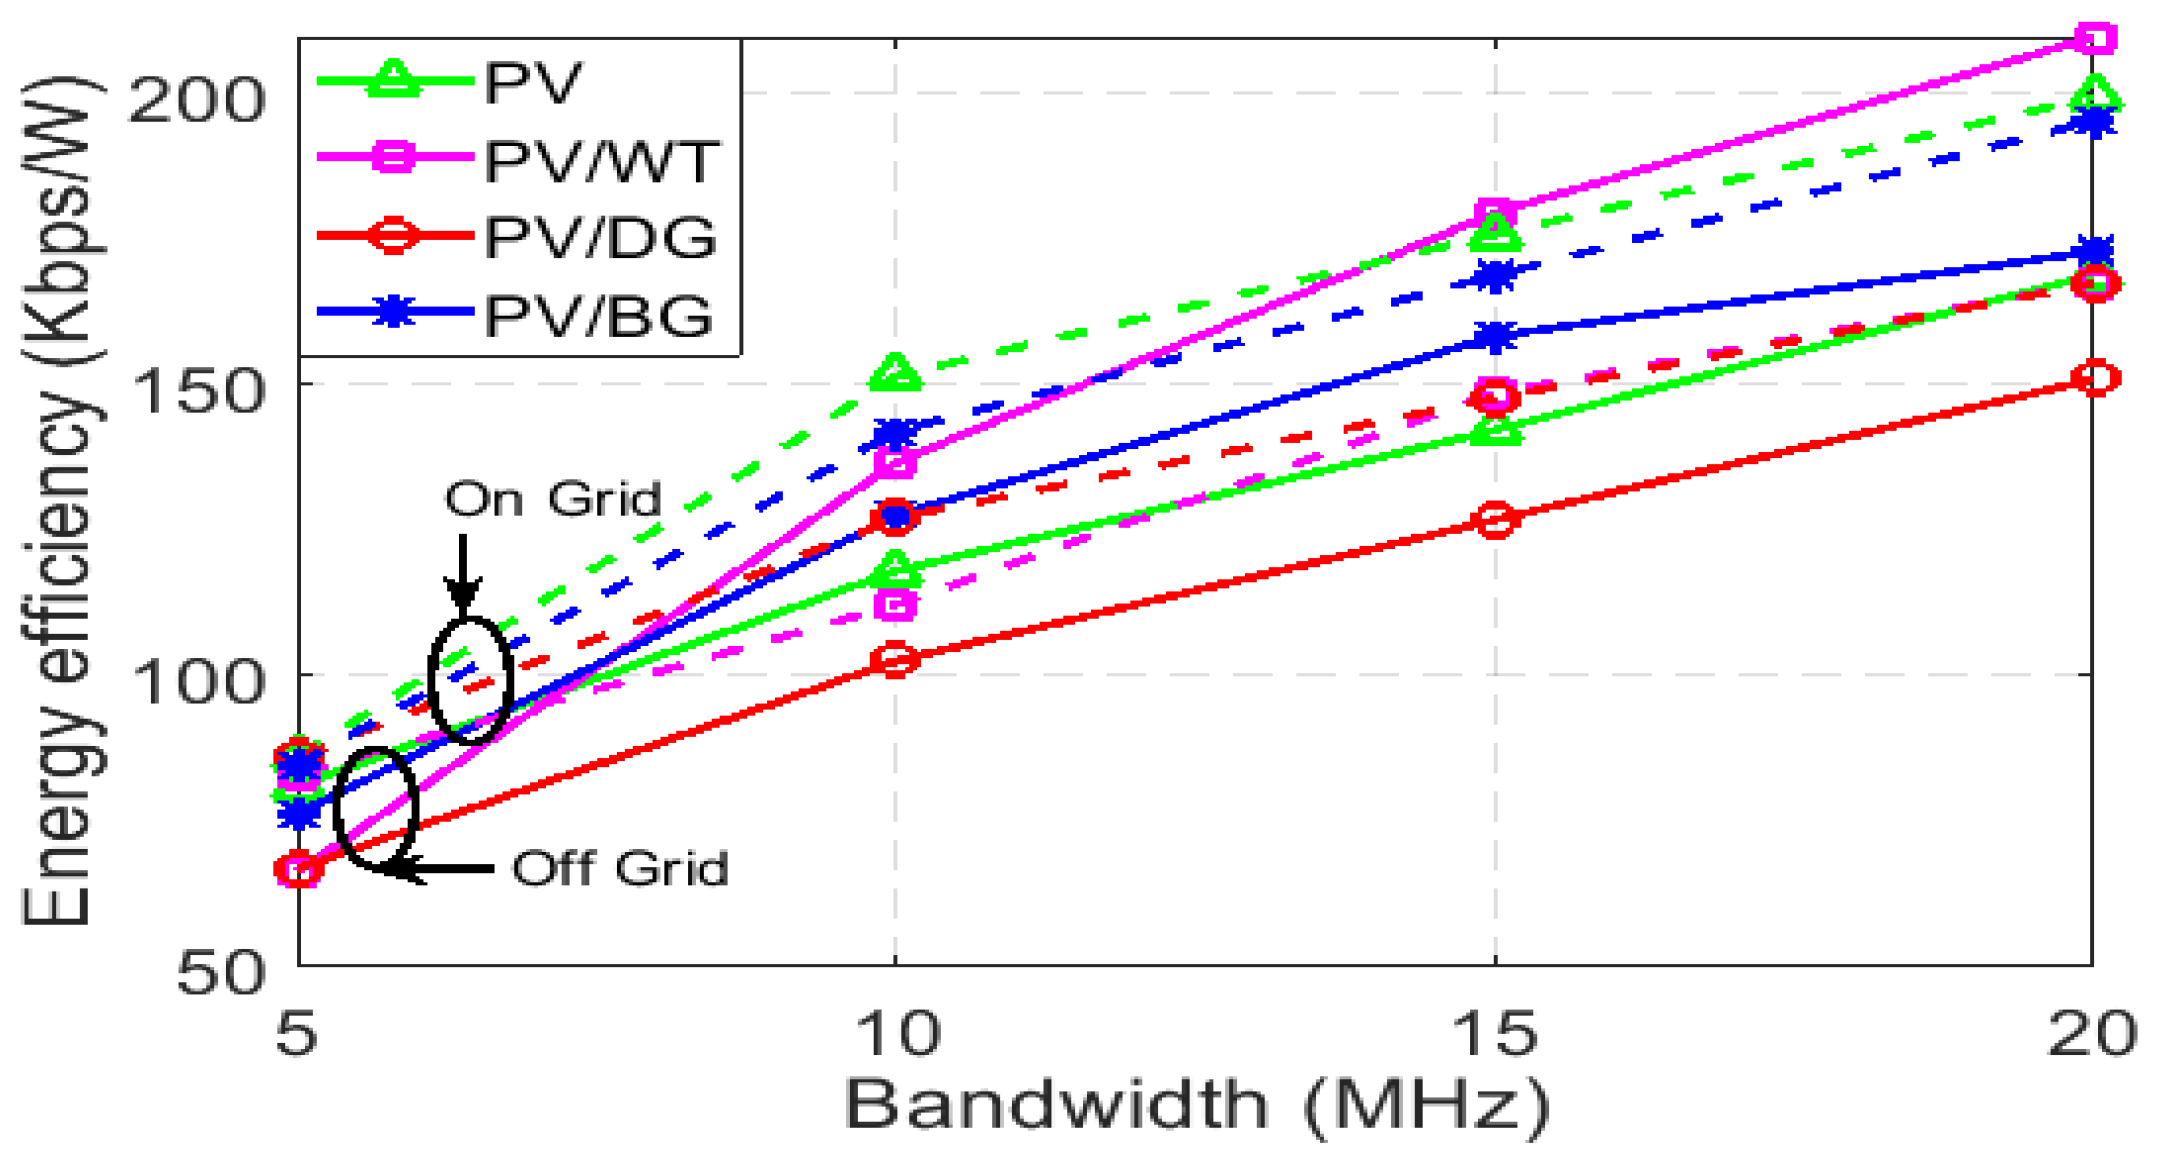
Figure 38.
Energy efficiency comparison performance among the PV, PV/DG, PV/WT, and PV/BG.
Figure 38.
Energy efficiency comparison performance among the PV, PV/DG, PV/WT, and PV/BG.
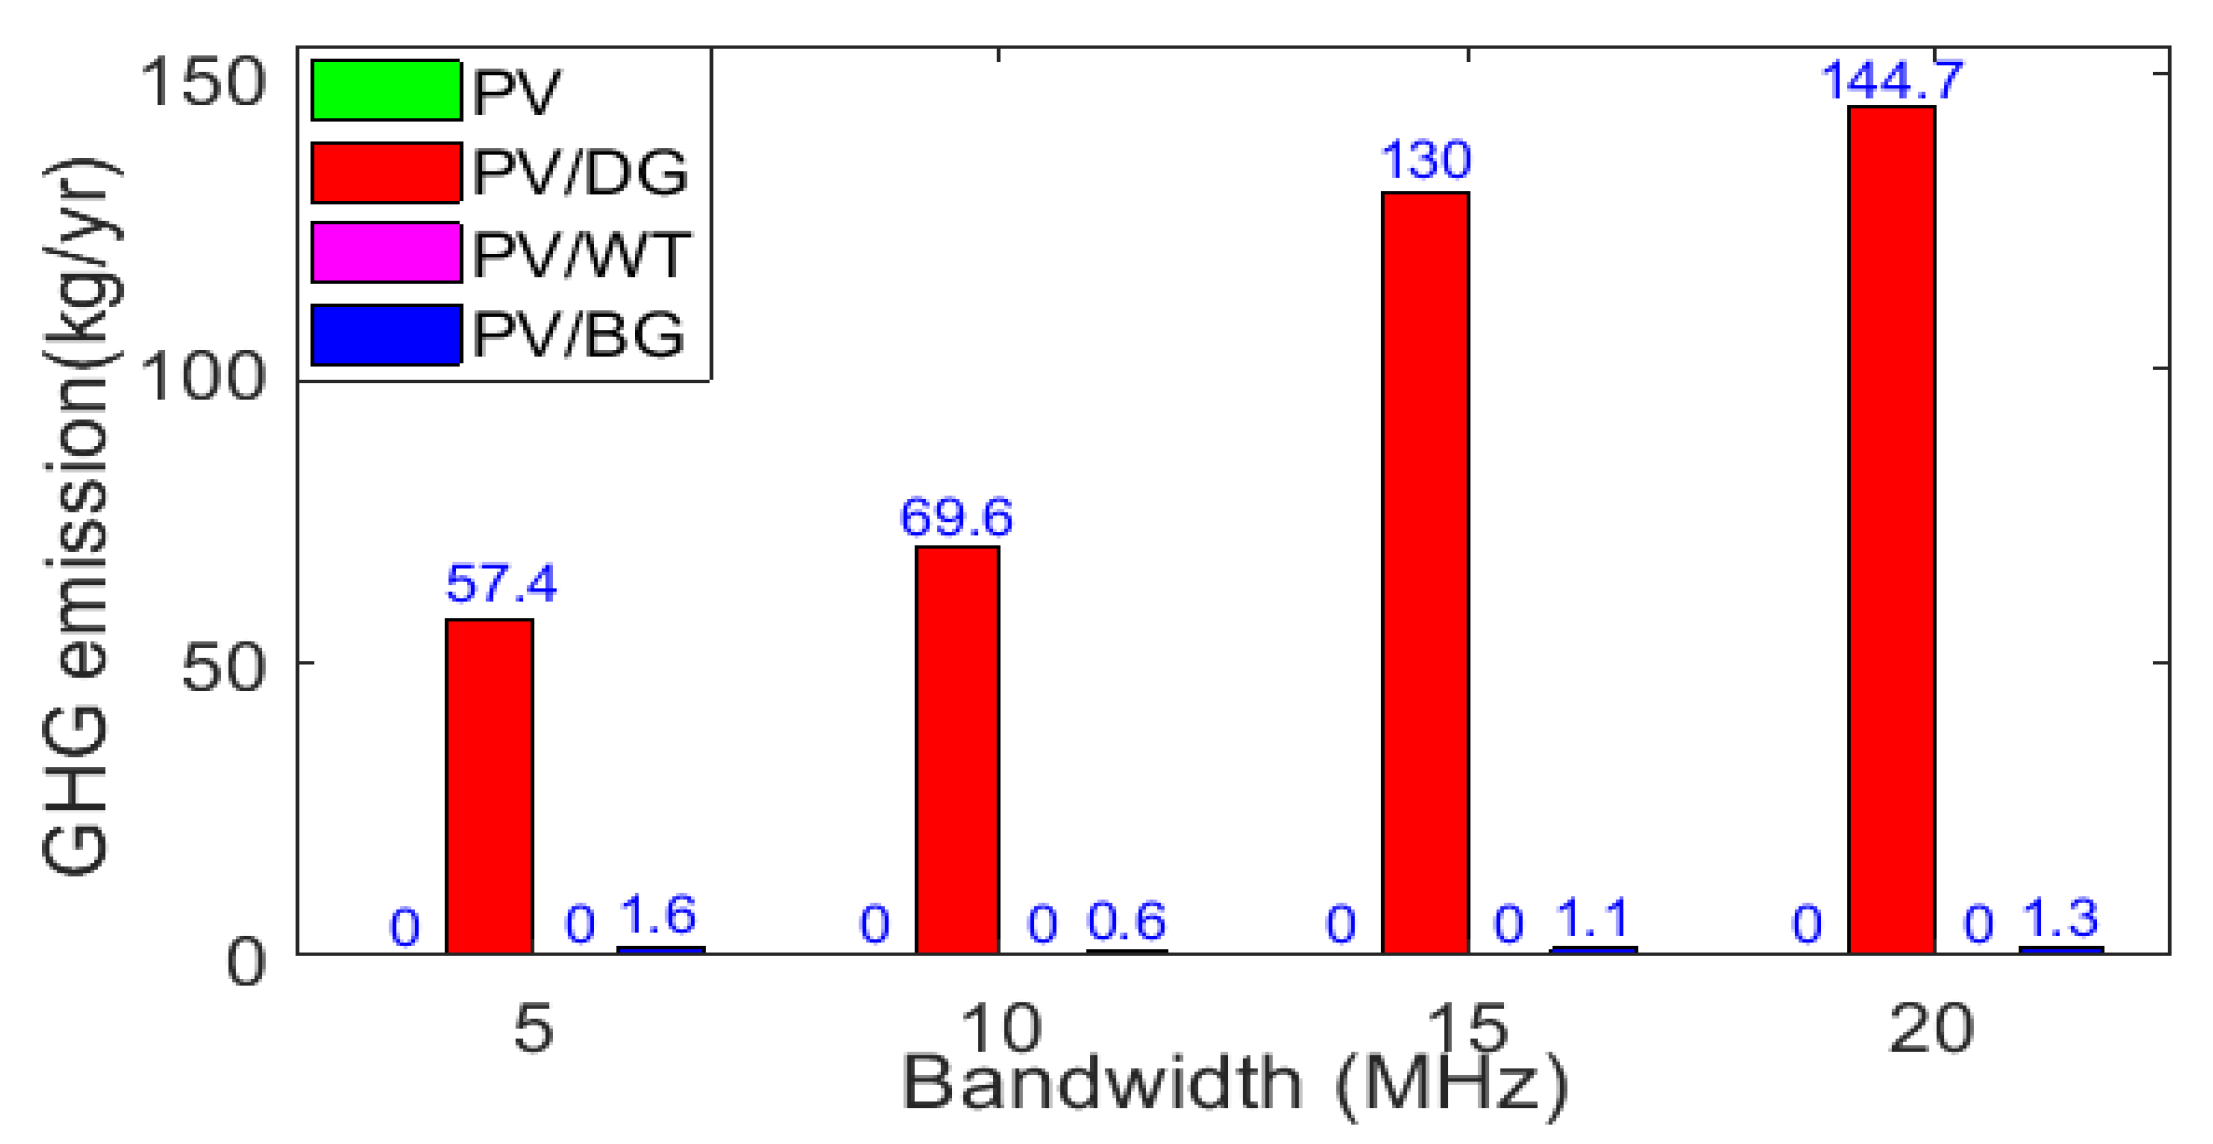
Figure 39.
Comparison of greenhouse gases (GHG) among the PV, PV/DG, PV/WT, and PV/BG.
Figure 39.
Comparison of greenhouse gases (GHG) among the PV, PV/DG, PV/WT, and PV/BG.
Table 1.
Summary of the abbreviations and symbols.
Table 1.
Summary of the abbreviations and symbols.
| Abbreviation | Meaning | Abbreviation | Meaning |
|---|
| BW | Bandwidth | | Total losses |
| COE | Cost of electricity | | Remaining green energy |
| EE | Energy efficiency | | Sold energy |
| GHG | Greenhouse Gas | | Green energy shortage |
| NPC | Net present cost | | Number of batteries |
| QoS | Quality of service | | BS Transmit power |
| R | Solar radiation | | Rated capacity of the solar PV panel |
| Excess electricity | | Converter efficiency |
| Green energy generation | | Charging efficiency |
| Grid energy | | BS Traffic load |
Table 2.
Key parameters of the macro-base station [
56].
Table 2.
Key parameters of the macro-base station [
56].
| BS Type | | | | | |
|---|
| Macro RRH | 6 | 20 and 40 | 84 | 2.8 | 56 |
Table 3.
Macro-BS power breakdown under peak load and 10 MHz bandwidth [
56].
Table 3.
Macro-BS power breakdown under peak load and 10 MHz bandwidth [
56].
| Components | Parameters | Macro BS | Macro BS |
|---|
| BS | (W) | 20 | 40 |
| | Feeder loss (dB) | 0 | 0 |
| PA | Back-off (dB) | 8 | 8 |
| | Max PA out (dBm) | 51 | 51 |
| | PA efficiency (%) | 31.1 | 31.1 |
| | Total PA,(W) | 64.4 | 128.6 |
| RF | (W) | 6.8 | 6.8 |
| | (W) | 6.1 | 6.1 |
| | Total RF, (W) | 12.9 | 12.9 |
| BB | Radio (inner Tx/Rx) (W) | 10.8 | 10.8 |
| | Turbo code(outer Tx/Rx) (W) | 8.8 | 8.8 |
| | Processors (W) | 10 | 10 |
| | Total BB, (W) | 29.6 | 29.6 |
| DC-DC | (%) | 7.5 | 7.5 |
| Cooling | (%) | 0 | 0 |
| Mains Supply | (%) | 9 | 9 |
| Sectors | | 3 | 3 |
| Antennas | | 2 | 2 |
| Total power (W) | | 754.8 | 1219.6 |
Table 4.
Key parameters for MATLAB-based Monte-Carlo simulation setup [
30].
Table 4.
Key parameters for MATLAB-based Monte-Carlo simulation setup [
30].
| Parameters | Value |
|---|
| Resource block (RB) bandwidth | 180 kHz |
| System bandwidth, BW | 5, 10, 15, 20 MHz |
| Carrier frequency, | 2 GHz |
| Duplex mode | FFD |
| Cell radius | 1000 m |
| BS Transmission power | 43 and 46 dBm |
| Noise power density | −174 dBm/Hz |
| Number of sectors | 3 |
| Number of antennas | 2 |
| Reference distance, | 100 m |
| Path loss exponent, | 3.574 |
| Shadow fading, | 8 dB |
| Access technique, DL | OFDMA |
| Traffic model | Randomly distributed |
Table 5.
Key parameters and their specifications for HOMER simulation setup [
19,
58].
Table 5.
Key parameters and their specifications for HOMER simulation setup [
19,
58].
| System Components | Parameters | Value |
|---|
| Resources | Solar intensity | 4.59 kWh/m/day |
| | Biomass available | 9 t/day |
| | Interest rate | 6.75% |
| Solar PV | Operational lifetime | 25 years |
| | Derating factor | 0.9 |
| | System tracking | Dual-axis |
| | Capital cost | $1/W |
| | Replacement cost | $1/W |
| | Operation and maintenance cost/year | $0.01/W |
| Biomass Generator | Efficiency | 30% |
| | Operational lifetime | 25,000 h |
| | Capital cost | $0.66/W |
| | Replacement cost | $0.66/W |
| | Operation and maintenance cost/year | $0.05/h |
| | Fuel Cost | $30/t |
| Grid | Energy purchase price | $0.122/kWh |
| | Energy sellback price | $0.110/kWh |
| | Demand charge | $0.350/kW/month |
| Diesel Generator | Efficiency | 40% |
| | Operational lifetime | 25,000 h |
| | Capital cost | $0.66/W |
| | Replacement cost | $0.66/W |
| | Operation and maintenance cost/year | $0.05/h |
| Battery | Round trip efficiency | 85% |
| | | 30% |
| | | 6 V |
| | | 360 Ah |
| | Capital cost | $300/unit |
| | Replacement cost | $300/unit |
| | Operation and maintenance cost/year | $10/unit |
| Converter | Efficiency | 95% |
| | Operational lifetime | 15 years |
| | Capital cost | $0.4/W |
| | Replacement cost | $0.4/W |
| | Operation and maintenance cost/year | $0.01/W |
Table 6.
The optimal architecture of the proposed system for average solar radiation.
Table 6.
The optimal architecture of the proposed system for average solar radiation.
| BW | PV (kW) | BG (kW) | Battery (units) | Converter (kW) |
|---|
| (MHz) | 20 W | 40 W | 20 W | 40 W | 20 W | 40 W | 20 W | 40 W |
|---|
| 5 | 3 | 3.5 | 1 | 1 | 64 | 64 | 1.5 | 1.5 |
| 10 | 3 | 3.5 | 1 | 1 | 64 | 64 | 1.5 | 1.5 |
| 15 | 3.5 | 4 | 1 | 1 | 64 | 64 | 1.5 | 1.5 |
| 20 | 3.5 | 4.5 | 1 | 1 | 64 | 64 | 1.5 | 1.5 |
Table 7.
Summary of technical criteria of the proposed system for different solar intensity, R (kWh/m/day) under 10 MHz bandwidth.
Table 7.
Summary of technical criteria of the proposed system for different solar intensity, R (kWh/m/day) under 10 MHz bandwidth.
| R | PV (kW) | BG (kW) | Battery (units) | Converter (kW) |
|---|
| | 20 W | 40 W | 20 W | 40 W | 20 W | 40 W | 20 W | 40 W |
|---|
| 4.5 | 3 | 3.5 | 1 | 1 | 64 | 64 | 1.5 | 1.5 |
| 5 | 3 | 3.5 | 1 | 1 | 64 | 64 | 1.5 | 1.5 |
| 5.5 | 3 | 3.5 | 1 | 1 | 64 | 64 | 1.5 | 1.5 |
Table 8.
Throughput and spectral efficiency performance of the wireless network.
Table 8.
Throughput and spectral efficiency performance of the wireless network.
| | Throughput (Kbps) | Spectral Efficiency (Kbps/Hz) |
|---|
| BW (MHz) | On-Grid | Off-Grid | On-Grid | Off-Grid |
|---|
| | 20 W 40 W | 20 W 40 W | 20 W 40 W | 20 W 40 W |
|---|
| 5 | 46,651 46,531 | 46,651 46,531 | 9.33 × 9.30 × | 9.33 × 9.30 × |
| 10 | 95,421 100,128 | 95,421 100,128 | 9.54 × 9.50 × | 9.54 × 9.50 × |
| 15 | 147,917 146,253 | 147,917 146,253 | 9.86 × 9.65 × | 9.86 × 9.65 × |
| 20 | 194,582 198,759 | 194,582 198,759 | 9.72 × 9.93 × | 9.72 × 9.93 × |
Table 9.
Cost breakdown of the proposed system under various system BW.
Table 9.
Cost breakdown of the proposed system under various system BW.
| BW | CC ($) | RC ($) | OMC ($) | FC ($) | SV ($) | NPC ($) |
|---|
| (MHz) | 20 W 40 W | 20 W 40 W | 20 W 40 W | 20 W 40 W | 20 W 40 W | 20 W 40 W |
|---|
| 5 | 23,460 23,960 | 11,479 11,546 | 3937 4246 | 897 1303 | 436 403 | 39,377 40,653 |
| 10 | 23,460 23,960 | 11,542 11,577 | 3668 4644 | 1130 1525 | 379 373 | 39,421 41,334 |
| 15 | 23,960 24,460 | 11,550 11,583 | 4226 4864 | 1347 1621 | 399 394 | 40,683 42,135 |
| 20 | 23,960 24,460 | 11,575 11,583 | 4646 5285 | 1548 1660 | 373 416 | 41,353 43,077 |
Table 10.
Cost breakdown of the proposed system under various solar intensity, R(kWh/m/day).
Table 10.
Cost breakdown of the proposed system under various solar intensity, R(kWh/m/day).
| R | CC ($) | RC ($) | OMC ($) | FC ($) | SV ($) | NPC ($) |
|---|
| | 20 W 40 W | 20 W 40 W | 20 W 40 W | 20 W 40 W | 20 W 40 W | 20 W 40 W |
|---|
| 4.5 | 23,460 23,960 | 11,545 11,583 | 3965 4749 | 1135 1535 | 377 367 | 39,528 41,460 |
| 5 | 23,460 23,960 | 11,523 11,558 | 3293 4227 | 1108 1490 | 397 391 | 38,987 40,844 |
| 5.5 | 23,460 23,960 | 11,501 11,536 | 2928 3814 | 1048 1455 | 416 412 | 38,557 40,352 |
Table 11.
Summary of technical criteria for the different scheme under = 20 W and BW = 10 MHz.
Table 11.
Summary of technical criteria for the different scheme under = 20 W and BW = 10 MHz.
| Supply | PV | BG | DG | WT | Conv. | | | | | |
|---|
| Scheme | (kW) | (kW) | (kW) | (kW) | (kW) | (Units) | (kWh/year) | (h) | (kWh/year) | (kWh/year) |
|---|
| PV | 2.5 | * | * | * | 0.1 | 64 | 463 | 162 | 14 | 1949 |
| PV/WT | 1 | * | * | 1 | 0.1 | 64 | 164 | 162 | 14 | 878 |
| PV/DG | 4 | * | 1 | * | 0.1 | 64 | 476 | 162 | 14 | 2911 |
| PV/BG | 3 | 1 | * | * | 1.5 | 64 | 16 | 162 | 493 | 1002 |

 ,
, 


