Assessing Riparian Areas of Greece—An Overview

1
UNESCO Chair Con-E-Ect, Conservation and Ecotourism of Riparian and Deltaic Ecosystems, International Hellenic University (IHU), 66100 Drama, Greece
2
Laboratory of Geomorphology, Edaphology and Riparian Areas (GERi Lab), Department of Forestry and Natural Environment, School of Geotechnical Sciences, International Hellenic University (IHU), 66100 Drama, Greece
*
Author to whom correspondence should be addressed.
Sustainability 2021, 13(1), 309; https://doi.org/10.3390/su13010309
Submission received: 26 October 2020
/
Revised: 18 December 2020
/
Accepted: 24 December 2020
/
Published: 31 December 2020
(This article belongs to the Special Issue Sustainable Management of Semi-aquatic Ecosystems)
Abstract
:Riparian areas, especially in the Mediterranean, offer many ecosystem services for the welfare of society benefits from their sustainable management. This study presents different tools used to assess riparian areas of Greece and their results. Riparian areas with different land-uses/vegetation covers along streams or torrents were assessed. The assessment tools were visual protocols, bioindicators, geographic information systems (GIS), vegetation indices, and a model. These tools differ in scale, accuracy, and difficulty of implementation. The riparian areas had Low and Moderate quality in Greece because of agricultural activities and hydrologic alterations. Vegetation appeared more important for the integrity of riparian areas than stream flow (perennial or intermittent). In addition, territorial variables (distance from dam and sea) were more influential compared to climatic variables. Visual protocols and GIS were effective for preliminary assessments. GIS can be applied at a greater scale but was less accurate than the protocols. Bioindicators can provide more cost-effective monitoring than physicochemical water variables. Finally, vegetation indices and models can be used for larger spatial and temporal scales, but require specialized personnel. Overall, riparian areas of Greece seem to be degraded, and monitoring would contribute to the development of a database on riparian areas that should form the basis for sustainable management plans in Greece.
1. Introduction
The sustainable management of riparian areas has been brought to the forefront in the last 4–5 decades by researchers, land and water managers, as well as policy makers because of the many and important ecosystem services they offer for the welfare and development of society [1,2]. The services of these areas have been known for thousands of years to humans who have used them, which has led to their extensive degradation. The conservation and protection of riparian areas is a main priority in most developed countries and can help meet the UN sustainable development goals of clean water and sanitation (#6), climate action (#13), life below water (#14), and life on land (#15).
Riparian areas are the transition zones between aquatic and terrestrial ecosystems [3,4]. This leads to a gradient of characteristics as you move from the terrestrial to the aquatic ecosystem [5]. Specifically, the zones of the riparian area that are closer to the terrestrial ecosystem retain characteristics of the terrestrial ecosystem, while as you get closer to the aquatic ecosystem many characteristics change and are more similar to those of the aquatic ecosystem. Thus, the term “transition zone” can have two meanings; first, the zone between an aquatic and terrestrial ecosystem, and second in regard to the different characteristics of the riparian areas that transition as one moves from the aquatic to the terrestrial ecosystem. In addition, riparian areas are azonal since they can be found in almost all terrestrial longitudes, latitudes, and altitudes [6]. The high diversity of riparian areas worldwide along with the diversity within each riparian area makes it difficult to establish a concrete and agreeable definition for this unique ecosystem.
The most distinguishable feature of the riparian areas is the vegetation [7] that differs in density as well the species composition from the adjacent terrestrial areas [8]. The vegetation is typically hydrophilic and is the result of the environmental conditions of the riparian areas. Specifically, the greater water availability year-round in the soil; since the water table is relatively high and the root systems have continuous access to water. In addition, these areas experience frequent floods, thus, the hydrophilic vegetation that can withstand waterlogged soil conditions have an advantage in establishing and occupying these areas [9]. Flooding can also open new areas for recolonization of pioneering species and the riparian stands can have a diversity of ages [10]. The flooding and the consequent erosion and deposition that occurs lead to unique fluvio-geomorphologic conditions that the riparian vegetation is adapted too. By not allowing the flooding of riparian areas, other species will gain the advantage that could lead to substantial changes in the riparian area communities. These disturbances also lead to soils that are considered young and very rich in nutrients [11]. The soil profile is not the typical one and can have buried horizons, while along the reach the soils can differ depending if they are a deposition or erosion area. Finally, droughts are another disturbance that riparian areas frequently face that can actually help in the expansion of the vegetation in the stream channels or under extreme intense events can lead to the death of the riparian vegetation.
Agriculture is considered the main culprit for the extreme degradation of riparian ecosystems [12,13]. The nutrient rich soils along with their close proximity to water make riparian areas prime lands for agricultural production. The vegetation of the riparian areas was in many cases completely eradicated and replaced with crops or in other cases a narrow strip of natural vegetation was left. These activities eliminate or substantially decrease the other ecosystems services they offer such as water quality, wildlife habitat, flood protection, ground water recharge etc. In addition, another major threat is urbanization [14,15,16]. More and more people are congregating in cities and towns that are typically located along rivers and deltas. Riparian areas in many cities are devoid of vegetation that cause their fragmentation. The re-establishment of riparian areas can, in both agricultural and urban settings, provide major benefits and enhance the ecosystem services they can offer [17]. This is the reason why efforts to restore and conserve riparian areas are made worldwide [18].
Riparian areas are semi-aquatic ecosystems with unique hydrologic and soil characteristics. Climate change is increasing the mean and extreme temperatures and altering precipitation patterns. These changes are also impacting the hydrologic cycle and will most likely, first impact semi-aquatic ecosystems [19,20]. The hydrologic cycle is becoming faster with more extreme events. In regard to riparian areas, despite being disturbance driven ecosystems, the increase in flood events and magnitudes along with increase of the intensity and duration of drought events could lead to new hydrologic conditions that exceed their natural hydrologic regime thresholds. Exceeding the ecosystem’s natural thresholds could substantially alter them. In addition, the decrease of freshwater availability will increase anthropogenic needs and put more pressure on aquatic and semi-aquatic ecosystems.
The Mediterranean region is unique because of its climatic and topographic conditions, frequent wildfires and extensive over thousands of years human use [21]. These characteristics also lead to unique riparian areas in regard to their vegetative characteristics and flow conditions of the adjacent water bodies [18]. The vegetation of Mediterranean riparian areas can have woody to herbaceous vegetation or mixtures with interannual fluctuations in richness and composition more diverse that those of temperate ones [22,23]. These assemblages are also characterized by shorter life spans, desiccation resistance or drought avoidance mechanisms, and high colonization rates [24,25]. The vegetative characteristics are also a consequence of the adjacent water bodies stream flows. Mediterranean rivers and streams have natural high flow variability. Wet winters can lead to floods while severe droughts in the summer can cause no flow conditions [26]. The streams in high altitudes have perennial flow with the highest flows occurring after rain and snowmelt in spring [27]. In contrast, streams located in lowland areas, have intermittent or ephemeral flow [27] and are called “torrents” in Southern Europe [28]. Torrents, compared to rivers, have a much more irregular flow that can change in hours from no flow to a flash flood event. Finally, sustainable environmental management is required in the Mediterranean since many consider it as one of the most sensitive regions to climate change [29].
The European Union based on Water Framework Directive (WFD; 2000/60/EC), requires Greece and all member countries to assess the features of their riparian areas [30,31]. In addition, EU programs such as the Natura 2000 Network and International programs such as the Ramsar Convention have recognized the importance of riparian areas in the Mediterranean region and particularly in Greece by designating many riparian areas as protected [7,23]. This has led to many research efforts on the conservation and sustainable management of these ecosystems, particularly in the European Mediterranean areas. Still Greece, although lately there have been efforts, is still lagging research wise compared to other EU Mediterranean countries [20].
The many important services that riparian areas offer along with the fact that they have been heavily degraded, showcase the need to assess their current condition in order to be able to develop sustainable management plans that take into consideration climate change. This is particularly true for Greece that only in recent decades researcher have made some efforts to sustainably manage these ecosystems [20,32]. The objective of this study was to present several different studies on riparian areas that will help assess their current condition of different representative environments throughout Greece. In addition, several different methods that were used to assess riparian areas will be presented and evaluated in regard to their effectiveness and applicability. The derived conclusions could be applicable throughout the European Mediterranean region since the studied reaches are representative of riparian areas, particularly adjacent to streams and torrents. Overall, the implementation of these methods could help improve the monitoring and sustainable management of riparian area in the European Mediterranean region.
2. Materials and Methods
2.1. Study Area
The focus was on studies conducted in Greece by the GERi Lab (Laboratory of Geomorphology, Edaphology and Riparian areas) research team of the International Hellenic University. Greece is at the end of the Balkan peninsula and belongs to the Mediterranean region. Its climate is Mediterranean that means that the summer is warm to hot and dry that can lead to droughts and wildfires. The winter can have mild to cold temperatures that are wet with the mountainous areas having snow. Overall, because of its proximity to the large water body of the Mediterranean Sea, the temperature variations are relatively small between seasons, even between summer and winter. The topography of the region is also very characteristic with flat areas along the seacoast with large and tall mountain ranges relatively nearby [28]. Overall, the large altitudinal differences in close proximity to the seacoasts, characterizes the hydrologic, vegetative and climatic regimes of the region and leads to unique riparian areas [7,33].
The riparian area reaches that were selected are representative of Greece and the Mediterranean region based on the stream types, vegetation cover/land-use practices and landscape positions. The focus was primarily on riparian areas on small-order streams and torrents [34], the dominant running water bodies of the region, although riparian areas of rivers were also included. Riparian areas along streams and especially torrents bodies have not been studied as extensively as rivers in Greece [28]. The reaches were along altitudinal gradients ranging from 0 to 1200 m with precipitation ranging from 400 to 1100 mm. In regard to the vegetation cover, the riparian areas were either natural vegetation, plantations or agricultural in agricultural or forest dominated watersheds. The natural vegetation in most reaches was Salix alba and Populus alba galleries (code: 92A0) although you could also find present Platanus orientalis and Quercus robur. In the Nestos River and Delta, five Mediterranean types of riparian areas can be found (i) Alluvial forests with Alnus glutinosa and Fraxinus excelsior, code: 91E0; (ii) Riparian mixed forests of Quercus robur, Ulmus laevis and Ulmus minor, Fraxinus excelsior or Fraxinus angustifolia, along major rivers, code: 91F0; (iii) Salix alba and Populus alba galleries, code: 92A0; (iv) Platanus orientalis and Liquidambar orientalis woods, code: 92C0; and (v) Southern riparian galleries and thickets, code: 92D0 [18]. The plantation had primarily Populus nigra. It also must be noted that even in the agricultural areas some remnants of riparian vegetation could be found. Finally, there were riparian areas along mountainous areas and lowlands. Overall, a wide range of representative riparian areas were investigated, and their location can be seen in Figure 1.
2.2. Assessment Methods
To assess riparian areas several different methods have been developed worldwide. The one used and preferred, depends on the objective and the spatial and temporal scale of the study and the availability of funds. In this paper, methods better suited for both small-scale (e.g., stream reach) and large-scale (e.g., watershed) study areas are presented.
Two different methods were used for the small-scale studies that focused on the reach of a torrent, stream or river. Specifically, the first type was visual protocols and the second bioindicators (e.g., insects and birds). Visual protocols are very popular because they can fast and accurately (if done correctly) provide a first assessment on the riparian study area. Of course, they provide a preliminary assessment and based on its results more detailed monitoring might need to take place afterwards. The two visual protocol used were the Stream Visual Assessment Protocol (SVAP) [35] and the Ecological Status of Riparian Vegetation index (QBR) [36]. Both have been used extensively in many studies in the Mediterranean and around the world and are accepted as useful tool for the quick assessment of riparian areas. The SVAP focuses on stream characteristics and provides the ecological condition primarily of the streams but also the riparian areas. It has been developed by the United States Department of Agriculture, Natural Resources Conservation Service and has been adopted and applied worldwide. Since Mediterranean riparian areas have unique characteristics [7], the SVAP was modified to better assess Greek riparian areas [37]. Specifically, at each sampling location 14 parameters are visually assessed with values ranging from 0 to 10 (0 the worst and 10 the best). These 14 parameters are averaged, and the stream reach is classified as Poor (≤6.0), Moderate (6.1 to 7.5), Good (7.6 to 9.0) and Excellent (>9.0). For the presented studies, the SVAP was used to assess 20 different reaches of streams and torrents in central and eastern Macedonia of Greece (Figure 1E, F). The 14 reaches had Lake Volvi as their end point (Figure 1F) [37] and the rest six reaches were in the prefectures of Drama and Kavala in lowlands and mountainous areas (Figure 1E) [38,39,40,41]. The QBR focuses on the riparian areas with an emphasis on the riparian forest quality. The assessment is based on three parameters of the riparian area (i-total vegetation area and cohesion, ii-tree overstory cover and shrubs and iii-understory vegetation and vegetation cover quality) and one on the stream channel and bed (human changes). Each parameter can get a maximum value of 25 point and afterwards these are added and classified as Bad (≤25), Not Satisfactory (30–50), Satisfactory (55–70), Good (75–90), Natural State (≥95). Since this method was developed in Spain it is more readily adopted for other Mediterranean regions such as Greece. The QBR was used to assess 4 reaches in the prefectures of Drama and Kavala that the SVAP was also used [38,40] (Figure 1E). All reaches were surveyed with SVAP and QBR only once.
Another assessment tool that is gaining more acceptance is bioindicators for riparian and river ecosystems. They are preferred because they are less variable than physicochemical indicators [42] but still can showcase water and habitat quality changes [43]. Certain endemic insects and bird populations have been used since some can be very sensitive in regard to their richness, composition and diversity, based on the stream and riparian habitat conditions, especially in relation to anthropogenic changes [44,45,46]. In one of the studies, ground-dwelling insects were used while in the second small birds and in the third flying insects, specifically dragonflies (Odonata). In all three cases, three reaches were studied that differed in stream type and/or riparian vegetation. The ground-dwelling insects were collected 11 times from March 2013 till November 2014 along reaches in Kavala and Drama prefectures from insect traps [47] (Figure 1B). Each reach had 3 traps. For the bird study along each reach there were 15 sampling points that were surveyed to record both sedentary and late migrant bird species from April till May 2011 [48] (Figure 1B). During this period, a total of three surveys were conducted. In regard to the dragonflies, they were collected along reaches in Fthiotida prefecture of Central Greece [49] (Figure 1D). Each reach had 5 sampling locations and dragonflies were surveyed at each location for 10 days, for 30 min for the period of July till September 2013. The comparisons among the reaches were made with the use of Diversity Indices; specifically: (a) Shannon-Wiener Diversity Index (H), (b) Shannon-Wiener Equitability Index (EH) and (c) Simpson’s Index (D) [50,51].
Field methods are essential to assess the actual conditions of the stream reaches of riparian areas and the authors believe they should be a mandatory component of any management and monitoring plan. Nonetheless, they are labor-intensive and time consuming and the new technologies that have been developed should be used more when conducting environmental studies. Methods based on these new technologies can be complimentary to the field methods, previously described. The methods used were based on geographic information systems (GIS), remote sensing and modeling. A major advantage of these methods is that they can be applied at larger scales and even for the entire watershed. With the GIS method, the “buffer” function was used to estimate the area of the different land-uses/vegetation covers, up to a specific distance for the stream edge on both sides of the stream [52]. Initially, relevant maps, aerial photos, satellite images or google map images were inserted into GIS. Afterwards the stream network and the different land-uses/covers were digitized. This method was used for the entire stream network with Greek Nestos Basin below the Platanovryssi dam (buffer was at 30 m for each stream side since this was a river) (Figure 1G) [52] but also along three stream reaches that the visual protocols were implemented (buffer was at 10 and 25 m for each stream side since these were small-order streams or torrents) (Figure 1C) [38,39,41].
The remote sensing methods (vegetation indices) and the model were applied in the Nestos River Delta (Figure 1G) [53]. Vegetation indices can showcase changes in vegetation through time [54] and have also been used for assessing riparian areas [55]. Specifically, eight vegetation indices were used: (a) 2 band Enhanced Vegetation Index (EVI 2) [56], (b) Green Atmospherically Resistant Vegetation Index (GARI) [57], (c) Land Surface Water Index (LSWI) [58], (d) Normalized Difference Burning Ratio (NDBR) [59], (e) Normalized Difference Vegetation Index (NDVI) [60], (f) Normalized Difference Water Index (NDWI) [61], (g) Perpendicular Vegetation Index (PVI) [62], (h) Vegetation Condition Index (VCI) [63]. The eight indices were applied to 14 Landsat images that spanned from 1989 till 2016. The changes in the vegetation based on the indices were examined at 573 points in the riparian forest of the Delta. These points were separated into three categories based on the tree cover; specifically: (a) 0–24% cover, (b) 25–49% cover, and (c) 50–75% cover [64].
For the Nestos Delta a prediction model was used to examine the relationship between changes in vegetation and other climatic and terrestrial variables. Specifically, the Random Forests model [65] was employed. The model has been used in the past with good results on studies in regard to riparian and coastal areas [66,67]. The reason for its selection was because it can analyze inputs with a different nature and scaling, it randomly selects training samples and predictors’ values leading to an independent, evenly distributed regression tree and provides meaningful metrics [68,69]. R was used to implement the Random Forest regression version [70]. The variables used as the predictors of the Random Forest were territorial and climatic (total 26 variables). The territorial variables were (a) Elevation, (b) Slope, (c) Distance from croplands, (d) Distance from sea, (e) Distance from river, (f) Distance from dam, and (g) Distance from residential areas. The climatic variables were: (a) Annual Mean Temperature, (b) Mean Diurnal Range, (c) Isothermality, (d) Temperature Seasonality, (e) Max Temperature of Warmest Month, (f) Min Temperature of Coldest Month, (g) Temperature Annual Range, (h) Mean Temperature of Wettest Quarter, (i) Mean Temperature of Driest Quarter, (j) Mean Temperature of Warmest Quarter, (k) Mean Temperature of Coldest Quarter (l) Annual Precipitation Annual Precipitation, (m) Precipitation of Wettest Month Precipitation of Wettest Month, (n) Precipitation of Driest Month, (o) Precipitation Seasonality, (p) Precipitation of Wettest Quarter, (q) Precipitation of Driest Quarter, (r) Precipitation of Warmest Quarter, and (s) Precipitation of Coldest Quarter. The metrics Mean Decrease Accuracy and Mean Decrease Gini [68] were used to quantify the importance and contribution of each parameter in vegetation change for the three different densities of tree coverage.
3. Results
Following are the results of the two visual assessment tools, the three bioindicators along with examples of the use of the buffer function of GIS, vegetation indices and a model, specifically the Random Forest.
3.1. Visual Assesement Tools
The SVAP results are present in two different tables (Table 1, Table 2 and Table S1). Specifically, Table 1 presents the results from all streams and torrents that end in Lake Volvi. The reaches sampled were separated based on landscape position, into mountainous, semi-mountainous and plains. The results show a clear trend that as we moved from the mountainous to plain reaches in almost all cases the stream and riparian habitat degrades (lower values). In most semi-mountainous and plains reaches the quality was Poor. In contrast, in most mountainous reaches the quality was characterized as Moderate. Differences were significant among the mountainous reaches and semi-mountainous and plain reaches.
The SVAP values of the reaches presented in Table 2 were either Moderate (4 reaches) or Poor (2 reaches). The reaches of the torrent adjacent to the forested area had the lowest value. The reaches of the streams adjacent to agricultural areas had a wide range of values from 5.8 to 7.2. Finally, the reaches of the stream adjacent to the forested area had the highest value. Differences were significant among Stream-Forested and Stream-Agriculture 1 and other 4 reaches.
The QBR results (Table 3 and Table S1) showed that reaches were Not Satisfactory in three of the study streams, while in one of the streams it was in the Good category. The reach of the stream adjacent to a forested area had the highest score. The QBR values among the sampling plots have a wide range of values. In the reaches of the torrent adjacent to a forested area the values were as low as 15 and as high as 95. Finally, for the reaches of the stream adjacent to agricultural field (Stream-agriculture-1), SVAP and QBR seem to have found slightly different results. The SVAP categorized it as Moderate while the QBR as Not Satisfactory. Differences were significant among Stream-Forested and the other 3 reaches.
3.2. Bioindicators
The values for the Shannon-Wiener Diversity (H), Equitability (Eh) and Simpson (D) Indices based on the ground-dwelling insects, dragonflies and small birds can be seen in Table 4. Starting with the ground-dwelling insects for the first year the H index had a higher value for the torrent adjacent to natural forested area in a hilly landscape (TNH), followed by the torrent adjacent to a natural forest in a flat landscape (TNF) and the stream adjacent to a forest planation in a flat landscape (SPF). The difference between TNH and SPF was statistically significant. No statistically significant differences were found for the Eh index among the three habitats although SPF had the largest values indicating that it was less diverse compared to the other two. Finally, for the D Index TNF and SPF had the largest values, but there were no statistically significant differences among the tree habitats. Overall, based on the indices and number of insects collected, the two habitats with natural vegetation (TNF and TNH) were more diverse compared to plantation monoculture habitat (SPF), even though they were adjacent to torrents. In addition, in all three habitats Silpha obscura was overwhelmingly the dominant ground-dwelling insect collected. These high numbers of this insect along with the fact that it has the desired characteristics for an indicator species [60] led to focus on this species during the second year. Specifically, 128 and 82 Silpha obscura were collected in year 1 and 2, respectively form the TNF, 120 and 114 were collected in year 1 and 2, respectively form the TNH and 18 and 14 were collected in year 1 and 2, respectively form the SPF.
Based on the dragonfly data, the perennial river with a wide riparian zone (>30 m) (RW), and the torrent with intermittent flow with medium riparian zone (>15 m) (TM) had similar H index values that were significantly larger than the thermal spring with the narrow riparian zone (<15 m) (SN). For the Eh index, RW had the lowest while TM had the highest; the lower the value the more diverse the habitat. As for the D Index, SN had the largest value while RW and TM had similar values. The high values for SN indicated less diversity. Overall RW performed the best, based on the indices that corresponds well since it had the largest widths of the riparian areas. Finally, in regard to species abundance, Crocothemis erythraea was the most abundant for both the TM and SN and Orthetrum brunneum along the RW. The abundant species, in all three habitats, were approximately half of the individual dragonflies surveyed.
Finally, for the small bird surveys the Multi Response Permutation Procedure (MRPP) results indicated that the three riparian habitat types significantly differed in regard to their bird communities. Only two indices were applied (H and Eh). The torrents with intermittent flow and natural woody vegetation (TN) had the most bird species (29) and highest H, followed by the stream with perennial flow with natural woody vegetation adjacent (SN) (23 species) and the stream with perennial flow with the woody monoculture plantation (SP) (19 species) (TN had a significantly higher H than SP). The Eh provides a different picture with SP being the more diverse in small birds while the other has similar values. In this study, again areas with natural vegetation were in better condition than the monoculture plantation.
3.3. Geographical Information Systems
Land-uses and/or vegetation cover of the riparian areas can be estimated quickly with the buffer functions, as long as you have this layer in GIS. In all stream orders of the Nestos River Basin (that was below the Platanovrysi dam) the forested vegetation was dominant in the riparian areas (Table 5). In the irrigation canals, agriculture was the dominant riparian land-use. When we separate the study basin into the mountainous and the plains areas the percentages showed a very different riparian area land-use/vegetation cover for the different stream orders (Table 5). In the stream reaches and irrigation canals that run through the plains all canals and reaches, except the 6th order, had primarily agriculture practices (greater than 73%) in their riparian areas. Only in the 6th order Nestos reach, the forests and grasslands dominated (together approximately 98%). This is where the main remaining riparian forest of the Nestos Delta is located, which is protected by the Ramsar Convention and the Natura 2000 Network. Looking at the mountainous region of the study basin, first there were no irrigation canals. In all stream orders (1st to 6th) the riparian areas were primarily forested. Most reaches have forested vegetation in more than 90% of their riparian areas. The highest percentage of forest was in the 5th-order reaches with 100%, while the lowest was the 6th-order reaches (e.g., the main river reach) with approximately 84%.
The buffer function was also applied to two reaches of streams and one reach of a torrent in the prefecture of Drama (Table 6). In the torrent the forested vegetation was more than 70% at both buffer distances (20 and 50 m). The torrent reach was in a mountainous region. In the streams the majority of the riparian areas were in agriculture activities (stream 2 had approximately 80%, and stream 3 had approximately 65%). Both stream reaches were in the plains of the Drama Prefect where agriculture is the dominant land-use practice. One of the main differences between the two stream reaches was the high percentages of broadleaved forests in its riparian areas (greater than 30% for both buffer widths) in the stream reach 3 adjacent to agricultural practices.
3.4. Remote Sensing-Vegetation Indices
For the 50–75% vegetation coverage class, the values of the five indices (EVI2, GARI, NDVI, PVI and VCI), initially (1989–2003) and in the end (2013–2016) did not follow a pattern (increasing, decreasing or stable). These five indices from 2003 to 2013 did follow an increasing trend indicating improvement of the vegetative condition. It must also be noted that three indices (NDWI, NDBR and LSWI), for the entire period did not follow any distinctive pattern, but differed from year to year. For the 25–49% vegetation class the trends among the indices seem to differ the most compared to the other two classes. Overall, the pattern for most indices was initially a decreasing trend that stabilized or increased in the later years. Finally, for the 0–24% vegetation class, the values of indices, initially followed an increasing trend (1989–1999) continued with a decreasing trend (1999–2013) that ended with an increase from 2013 to 2014. This pattern was similar in all eight indices for this vegetation class.
3.5. Random Forest Model
Twenty-six predictor variables were included in the Random Forest model. The focus was on the top five, based on their frequency as the top five for the eight different indices. For the Mean Decrease Accuracy (Table 6) and for the vegetation cover 50–75%, the top five variables were: (a) distance from the sea, (b) distance from the river, (c) distance from the dam, (d) mean diurnal range and (e) isothermality (Table 7). More specifically, the distance from the sea ranked first in all eight indices and the distance from the dams ranked second for most indices. Moving on to the 25–49% vegetation coverage the top five variables were: (a) distance from the sea, (b) distance from the dam, (c) distance from the residential areas, (d) annual precipitation and (e) distance from the river. Ranked first in most indices was the distance from the sea. Finally, for the 0–24% vegetation coverage the ranking was as follows: (a) distance from the dam, (b) distance from the sea, (c) mean temperature of the coldest quarter, (d) the distance from the river and (e) precipitation seasonality. In all eight indices, the distance from the dam and the distance from the sea variables were in the top five predictors.
The results based on the Mean Decrease Gini were a little different (Table 8). Starting with the class with the greatest vegetation cover (50–75%) the ranking was as follows: (a) distance from the river, (b) distance from the sea, (c) distance from croplands, (d) distance from dam and (e) distance from residential areas. The distance from the river was first in most indices and the distance from the sea was ranked second in most indices. Moving to 25–49% vegetation cover the ranking of the variables was: (a) distance from the sea (ranked first for most indices), (b) distance from the river, (c) distance from the dam, (d) distance from the residential areas and (e) distance from the croplands. The vegetation coverage of 0–24% had the following top five variables: (a) distance from the sea (always ranked first), (b) distance from the dam, (c) distance from the croplands, (d) distance from the river, and (e) distance from the residential areas.
4. Discussion
Riparian areas of the Mediterranean have unique characteristics because of the distinctive climatic, topographic and geomorphic conditions of the region [18]. The distinctive conditions along with human interventions in the region heavily impact the hydrologic regimes of the streams and rivers and consequently riparian area functionality [18]. Based on the SVAP results most reaches were in Poor condition and some were in Moderate condition. Only one reach, and just barely, was considered in Good condition (with a score of 7.6). The reaches assessed with QBR were less but again most reaches (three) had a Not Satisfactory condition and only one a Moderate condition. It is interesting that even when forest vegetation was dominant in the riparian areas still the conditions were degraded. This was because of the extensive anthropogenic activities detected during the surveys of the protocol that included garbage dumping and grazing. Anthropogenic activities can severely degraded riparia areas [13,20]. Other studies in Greece have also found that the riparian areas of the country are of low ecological conditions [71,72]. We must also note that other studies have found variables at the watershed scale more important than at the local (reach) scale [73,74]. This should not be surprising since riparian areas are interconnected with the upstream and downstream reaches of the entire watershed. This fact should be taken into consideration when management plans for riparian areas are being developed. In regard to the applicability of the two visual protocols used, SVAP and QBR, we highly recommend their adoption by the responsible authorities in Greece for three reasons. Based on personal experience with several different protocols for riparian areas and streams it appears that these two are easily applicable by managers with basic knowledge in riparian areas. Another advantage is repeatability, especially for SVAP. When tested by different users in most cases the results were very similar. Finally, another major advantage is that once trained, surveying a site can be conducted quite quickly. We also recommend that both SVAP and QBR should be used together. The categorization based on each protocol was different in some reaches. This has to do with the fact that the SVAP focus more on the stream characteristics while the QBR focuses more on the riparian vegetation characteristics. The two protocols are complimentary to each other, by focusing on different aspects in regard to the ecological integrity of streams and riparian areas. Of course, in case there are time, labor or money constraints in regard to monitoring the riparian areas, land or water managers should choose which protocol to use based on the objective of the study. If an assessment on the stream is the focal point, we recommend the SVAP; if the riparian vegetation is the focal point, we recommend the QBR. Overall, their adoption and implementation by the responsible authorities in Greece should help develop an extensive database enhancing the limited spatial scale of the currently surveyed reaches thus providing a more rigorous picture on the current condition of the riparian areas in Greece.
The use of bioindicators was also promising. The results indicate that all three bioindicators used, have the potential to be scientifically sound tools for monitoring riparian areas and streams. Other studies have also shown that small birds [75], ground-dwelling insects [46,76] and dragonflies [77] are effective monitoring tools. Longer-term datasets should provide more clear differences among riparian habitats. In these studies, the data were collected for 1 to 2 years only. Significant differences were found among the different riparian habitats and/or stream types based on these bioindicators that highlight three preliminary findings. First that vegetation type and structure was more important for riparian area quality than stream type (perennial or intermittent flow). This is probably because torrents are the most frequent type of running water bodies in the Mediterranean [28], so the fauna species have probably adjusted to such conditions, which is also a main characteristic of the unique Mediterranean riparian areas [18]. Natural riparian vegetation appears to be of higher quality compared to plantations, as indicated by the bioindicators. The second important finding was that riparian area width plays an important role in the quality of the riparian area. As other studies also found, wider widths with natural vegetation enhance the natural processes and functions of riparian areas [78,79]. Thirdly, bioindicators are also more practical and cost-effective than stream water physicochemical characteristics that are more highly variable (temporally and spatially) and require substantially more frequent measurements than bioindicators. Although the use of bioindicators shows promise, one of the main disadvantages is the need for more intensive training compared to the protocols, in order to be able to identify the birds, dragonflies, or ground-dwelling insects. This is essential for the small birds and dragonflies since the surveys are conducted by identification in the field. In contrast for the ground-dwelling insects since litter traps were used, the insects could be collected and then sent to the appropriate laboratory for identification. This difficulty is also why in many cases it is suggested that eventually instead of measuring all the insects or small birds, certain species (ideally one) should be selected to be measured. In the ground-dwelling insects, Silpha obscura was selected while for the birds, species that are endangered or have characteristic ecological requirements could be selected. This would significantly reduce the training time. Finally, the main difference between the visual protocols and the bioindicators was that the first method provides a quick initial assessment of riparian area conditions while the second can provide a more accurate assessment of the quality of the ecosystem although they are more labor-intensive and time-consuming. Typically, visual protocols should be initially used and based on their results, certain bioindicators could be selected and used for more targeted and detailed studies.
Land-use/vegetation cover of the riparian area plays the most important role in regard to their ecological integrity [13,80]. GIS allow for a quick assessment of the land-use/vegetation cover of large lengths of riparian areas, even at the entire watershed scale. As already mentioned, many studies have found that watershed variables are more important than local variables [73,74] because of the riparian area continuum [18]. This quick assessment can provide a first perspective on the conditions that can be expected in the riparian area and its stream. The accuracy of the assessment will depend on the resolution of the images of the data layers that are used. Based on the reaches investigated in this study, it appears that most riparian areas of Greece in the plains are primarily in agricultural practices. In contrast, in the mountainous regions of Greece most the riparian areas appear to be with forested vegetation. This is a consequence of the upstream-downstream anthropogenic gradient. As in many other Mediterranean areas, forests are located in mountainous headwaters with a low anthropogenic impact whereas agriculture dominates in flat lowlands [81]. A main advantage of this method is that most natural resource management services use GIS. The buffer function, as long as the land-use/vegetation cover layers are available, is a simplistic process easily implemented by those with basic knowledge of GIS. This method should be the first step in the assessment of riparian areas. Such a database could be easily developed if the responsible authorities would adopt this method and we strongly believe that it would be complimentary to the database that could be developed based on the SVAP and QBR protocols. This can also help locate the riparian areas that would require additional field measurements leading to a more targeted approach. Targeted approaches for riparian areas should be preferred because they are a cost-effective management practice [13,31]. Once specific riparian areas are targeted, then, in these areas field measurements (visual protocols and/or bioindicators) can be applied. Finally, in regard to the buffer width, it should be from 20 to 50 m depending on the size and order of the stream and river. These are the extents of riparian areas, typically found along Mediterranean streams and rivers [81].
Riparian areas offer many ecosystem services to different stakeholders, so in heavily populated areas their sustainable management requires detailed, long-term and scientific information on their ecological integrity and functionality. To maximize the benefits restoring riparian areas, a broader perspective on their ecosystem services needs to be included when management plans are developed [82]. Using new technologies can help develop management plans that are based on science-based information and incorporate many ecosystems services. Two scientific fields that could really help the sustainable management of riparian areas are remote sensing and modeling [83]. Specifically, different vegetation indices and the Random Forest model were used to look at long-term datasets that had a large number of data points. In the study of the Nestos Delta the impacts of the alteration of hydrologic regime due to the dam construction were found to be similar to those reported in other studies [84,85,86]. Based on the eight indices it appears that low density vegetation is being impacted more by the flow regulation. These areas were the furthest from the river and were showing a decrease in vegetation quality due to the lack of the floods, the increase in the water table depth (lack of floods and water pumping for agriculture), which means that the riparian vegetation does not have continuous year-round water source (groundwater) [87,88,89]. In contrast, the riparian vegetation near the river is still in contact with the groundwater year around thus maintaining dense vegetation. Of course, the lack of floods could also lead to shifts in the species composition, since species that do not tolerate flood waters for long periods could expand now in these areas [86,89]. Both metrics used in the Random Forest model found that the territorial predictor variables were more important than the climatic ones. Riparian areas are azonal, since they can be found in almost all biomes, with territorial characteristics typically being more influential. The two most important variables were distance to dam and distance to sea. This was expected, since dams can degrade the integrity on the riparian ecosystems especially in deltas [90,91]. In regard to the distance from the sea, as you move from the seascape to the landscape fluvio-geomorphological processes and water quality characteristics change that impact the riparian vegetation. Overall, the potential impacts of dams on deltas in Greece and the Mediterranean should be a main priority, since it was estimated that 50% of the sediment supply has been reduced in rivers of the region regulated by dams [92], while more than a third of the Mediterranean region’s population is concentrated near the coasts that occupy less than 12 % of its surface area [93]. Both methods need more specialized personnel compared to the other three methodologies described previously (protocols, bioindicators and GIS). These should be applied in riparian areas that based on the preliminary assessment tools, showcased strong indications of serious environmental problems. Their results would allow the implementation of management plans and actions that address specific problems identified by the vegetation indices or models.
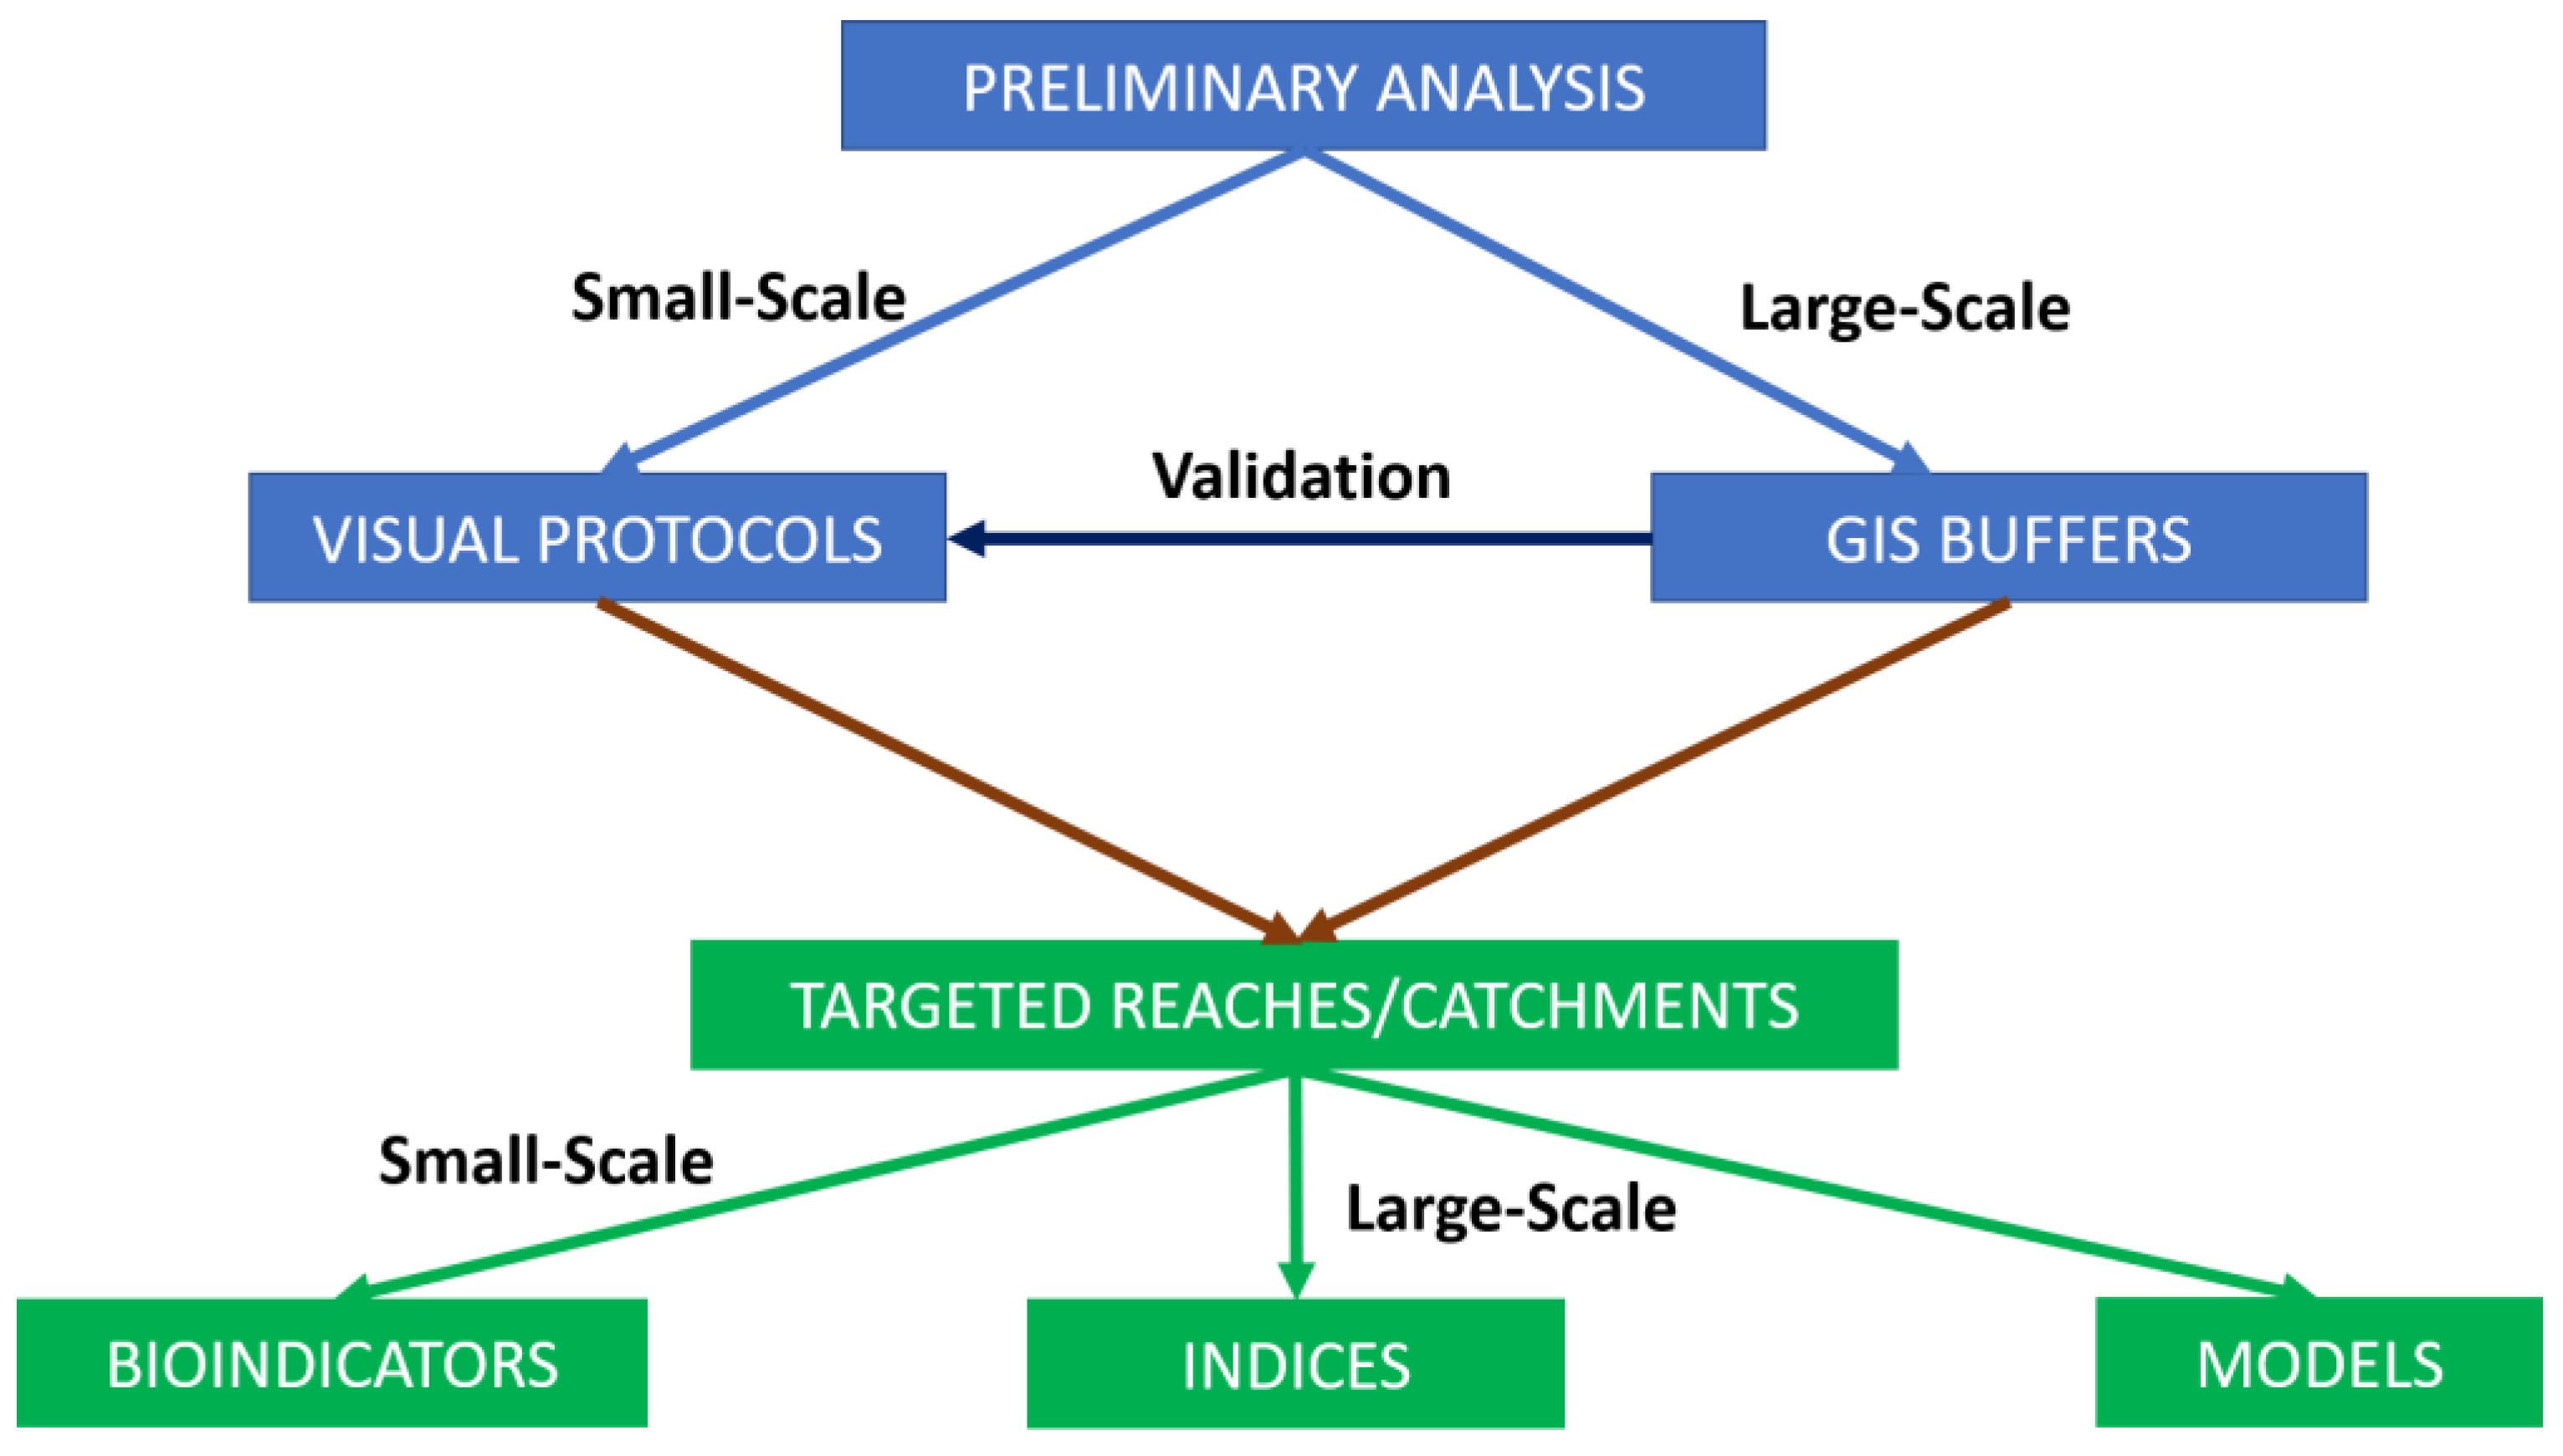
Riparian areas are interconnected with their watershed [73,74] but also can be heavily influenced by local factors [13]. To sustainably manage them, Integrated Water Resources Management needs to be applied [28]. This recommends management plans at the watershed scale and the use of large-scale monitoring methods such as those that we have showcased (Figure 2). At the same time, when specific areas of the watershed that are heavily degraded are identified, small-scale monitoring should be used (e.g., protocols and bioindicators) (Figure 2). The many ecosystem services they offer to human welfare should make it a priority in regard to conservation, but at the same time make it difficult due the many stakeholders that have an interest on them. This is why new innovative practices based on ecosystem-based approaches or nature-based solutions need to be implemented [32,94,95,96]. Ecosystem-based approaches include several different management actions that are based on the principles and process of natural ecosystems with the long-term objective to reduce the vulnerability while also increasing the resilience of communities [97]. Nature-based solution are based on natural environmental features and processes that can be implemented in cities, landscapes and seascapes [98]. The goal is to provide social, environmental and economic benefits and resilience to society. Overall, nature-based solutions need to be cost-effective, enhance the ecosystem services and promote biodiversity. Both practices have not been extensively implemented in Greece although they have shown great potential in the conservation and enhancement of natural ecosystems such as riparian areas.
5. Conclusions
The riparian areas in the plains of Greece seem to be primarily in agricultural practices. In contrast, the mountainous riparian areas seem to be dominated by woody vegetation. Still, most riparian areas, both in mountain and plain landscapes seem to be in Low or Moderate environmental quality. This is probably because these areas are heavily used with various anthropogenic activities (e.g., row-cropping, grazing, urbanization, logging) in addition to alterations in the hydrologic regimes (e.g., dams, water extraction, groundwater pumping) depending on the landscape position. It must be noted that most of the reaches of this study were relatively close to human communities. Riparian areas with natural vegetation and wide zones are healthier than narrow riparian areas with woody monoculture or agriculture activities. Natural resource managers of Greece need to enhance their conservation efforts in regard to riparian areas. A holistic and national plan needs to be developed for their enhancement and protection. This plan can only be successful with practical monitoring tools. The visual protocols and buffer function from GIS provide easily applicable preliminary assessment tools and both should be adopted and implemented. Their adoption by the responsible authorities should not be very difficult and would lead to development of an extensive database based on the GIS data and visual protocol assessments. This database could help expand the spatial scale of riparian areas that have been assessed. This should enhance the understanding on the current conditions of riparian areas in Greece but also showcase where specific targeted approaches should be implemented in areas that are of high importance due to their location and services and are seriously degraded. Currently, most streams in Greece are not monitored for physicochemical water characteristics and using bioindicators offers a more cost-effective alternative. Remote sensing and models can also significantly improve the monitoring of the riparian areas at larger temporal and spatial scales in order to be able to develop and implement sustainable management plans. Finally, these methods can be applied in other riparian areas of the world, especially those of the European Mediterranean.
Supplementary Materials
The SVAP and QBR values on each sampling locations are available online at https://www.mdpi.com/2071-1050/13/1/309/s1, Table S1: The average SVAP and total QBR of the assessment scores of stream or torrent reaches for each sampling point adjacent to agricultural or forested areas in Eastern Macedonia, Greece.
Author Contributions
Conceptualization, G.N.Z. and V.I.; methodology, G.N.Z. and V.I.; analysis, G.N.Z. and V.I.; writing—original draft preparation, G.N.Z.; writing—review and editing, V.I. Both authors have read and agreed to the published version of the manuscript. All authors have read and agreed to the published version of the manuscript.
Funding
This research received no external funding.
Data Availability Statement
Data sharing not applicable.
Acknowledgments
We would like to thank all the researchers, graduate and undergraduate students that have contributed to the collection of the data.
Conflicts of Interest
The authors declare no conflict of interest.
References
- Buchanan, S.W.; Baskerville, M.; Oelbermann, M.; Gordon, A.M.; Thevathasan, N.V.; Isaac, M.E. Plant diversity and agroecosystem function in riparian agroforests: Providing ecosystem services and land-use transition. Sustainability 2020, 12, 568. [Google Scholar] [CrossRef] [Green Version]
- Molina-Holgado, P.; Jendrzyczkowski Rieth, L.; Berrocal Menárguez, A.-B.; Álvarez, F.A. The analysis of urban fluvial landscapes in the centre of Spain, their characterization, values and interventions. Sustainability 2020, 12, 4661. [Google Scholar] [CrossRef]
- Naiman, R.J.; Decamps, H.; McClain, M.E. Riparia: Ecology, Conservation, and Management of Streamside Communities; Elsevier Academies Press: London, UK, 2005. [Google Scholar]
- National Research Council. Riparian Areas: Functions and Strategies for Management; National Academies Press: Washington, DC, USA, 2002. [Google Scholar]
- Stella, J.C.; Rodríguez-González, P.M.; Dufour, S.; Bendix, J. Riparian vegetation research in Mediterranean-climate regions: Common patterns, ecological processes, and considerations for management. Hydrobiologia 2013, 719, 291–315. [Google Scholar] [CrossRef]
- Baker, M., Jr.; Ffolliott, P.F.; DeBano, L.F.; Neary, D.G. Riparian Areas in the Southwestern United States: Hydrology, Ecology and Management; Lewis Publ.: Boca Raton, FL, USA, 2003. [Google Scholar]
- Zaimes, G.N.; Iakovoglou, V.; Emmanouloudis, D.; Gounaridis, G. Riparian areas of Greece: Their definition and characteristics. J. Eng. Sci. Technol. Rev. 2010, 3, 176–183. [Google Scholar] [CrossRef]
- Manning, A.; Julian, J.P.; Doyle, M.W. Riparian vegetation as an indicator of stream channel presence and connectivity in arid environments. J. Arid Environ. 2020, 178, 104167. [Google Scholar] [CrossRef]
- Stromberg, J.C.; Boudell, J.A. Floods, drought, and seed mass of riparian plant species. J. Arid Environ. 2013, 97, 99–107. [Google Scholar] [CrossRef]
- Kramer, K.; Vreugdenhil, S.J.; van der Werf, D.C. Effects of flooding on the recruitment, damage and mortality of riparian tree species: A field and simulation study on the Rhine floodplain. For. Ecol. Manag. 2008, 255, 3893–3903. [Google Scholar] [CrossRef]
- De Sosa, L.L.; Glanville, H.C.; Marshall, M.R.; Williams, A.P.; Jones, D.L. Quantifying the contribution of riparian soils to the provision of ecosystem services. Sci. Total Environ. 2018, 624, 807–819. [Google Scholar] [CrossRef] [Green Version]
- Tufekcioglu, M.; Schultz, R.C.; Isenhart, T.M.; Kovar, J.L.; Russell, J.R. Riparian land-use, stream morphology and streambank erosion within grazed pastures in Southern Iowa, USA: A catchment-wide perspective. Sustainability 2020, 12, 6461. [Google Scholar] [CrossRef]
- Zaimes, G.N.; Tufekcioglu, M.; Schultz, R.C. Riparian land-use impacts on stream bank and gully erosion in agricultural watersheds: What we have learned. Water 2019, 11, 1343. [Google Scholar] [CrossRef] [Green Version]
- Cao, Y.; Natuhra, Y. Effect of urbanization on vegetation in riparian area: Plant communities in artificial and semi-natural habitats. Sustainability 2020, 12, 204. [Google Scholar] [CrossRef] [Green Version]
- Iakovoglou, V.; Zaimes, G.N.; Gounaridis, G. Riparian areas in urban settings: Two case studies from Greece. Int. J. Innov. Sustain. Dev. 2013, 7, 271. [Google Scholar] [CrossRef]
- Johnson, L.R.; Trammell, T.L.E.; Bishop, T.J.; Barth, J.; Drzyzga, S.; Jantz, C. Squeezed from all sides: Urbanization, invasive species, and climate change threaten riparian forest buffers. Sustainability 2020, 12, 1448. [Google Scholar] [CrossRef] [Green Version]
- Cole, L.J.; Stockan, J.; Helliwell, J. Managing riparian buffer strips to optimise ecosystem services: A review. Agric. Ecosyst. Environ. 2020, 296, 106891. [Google Scholar] [CrossRef]
- Zaimes, G.N. Mediterranean riparian areas. Climate change implications and recommendations. J. Environ. Biol. 2020, 41, 957–965. [Google Scholar] [CrossRef]
- Albano, C.M.; McGwire, K.C.; Hausner, M.B.; McEvoy, D.J.; Morton, C.G.; Huntington, J.L. Drought sensitivity and trends of riparian vegetation vigor in Nevada, USA (1985–2018). Remote Sens. 2020, 12, 1362. [Google Scholar] [CrossRef]
- Zaimes, G.N.; Gounarids, G.; Iakovoglou, V.; Emmanouloudis, D. Riparian area studies in Greece: A literature review. Fresen. Environ. Bull. 2011, 20, 1470–1477. [Google Scholar]
- Olson, D.M.; Dinerstein, E.; Wikramanayake, E.D.; Burgess, N.D.; Powell, G.V.N.; Underwood, E.C.; D’amico, J.A.; Itoua, I.; Strand, H.E.; Morrison, J.C.; et al. Terrestrial ecoregions of the world: A new map of life on Earth. BioScience 2001, 51, 933–938. [Google Scholar] [CrossRef]
- Feio, M.J.; Aguiar, F.C.; Almeida, S.F.P.; Ferreira, J.; Ferreira, M.T.; Elias, C.; Serra, S.R.Q.; Buffagni, A.; Cambra, J.; Chauvin, C.; et al. Least disturbed condition for European Mediterranean rivers. Sci. Total Environ. 2014, 476–477, 745–756. [Google Scholar] [CrossRef]
- Ferreira, M.T.; Globevnik, L.; Schinegger, R. Water stressors in Europe: New threats in the old world. In Multiple Stressors in River Ecosystems: Status, Impacts and Prospects for the Future; Sabater, S., Elosegi, A., Ludwig, R., Eds.; Elsevier: Amsterdam, The Netherlands, 2019; pp. 131–137. [Google Scholar]
- Bonada, N.; Resh, V.C. Mediterranean-climate streams and rivers: Geographically separated but ecologically comparable freshwater systems. Hydrobiologia 2013, 719, 1–29. [Google Scholar] [CrossRef] [Green Version]
- Santos, M.J. Encroachment of upland Mediterranean plant species in riparian ecosystems of southern Portugal. Biodivers. Conserv. 2010, 19, 2667–2684. [Google Scholar] [CrossRef] [Green Version]
- Cid, N.; Bonada, N.; Carlson, S.M.; Grantham, T.E.; Gasith, A.; Resh, V.H. High variability is a defining component of Mediterranean-Climate rivers and their biota. Water 2017, 9, 52. [Google Scholar] [CrossRef] [Green Version]
- Lobera, G.; Batalla, R.J.; Vericat, D.; Lopez-Tarazin, J.A.; Tena, A. Sediment transport in two Mediterranean regulated rivers. Sci. Total Environ. 2016, 540, 101–113. [Google Scholar] [CrossRef] [PubMed]
- Emmanouloudis, D.; Garcia Rodriguez, J.L.; Zaimes, G.N.; Giminez Suarez, M.C.; Filippidis, E. 2011. Euro-Mediterranean torrents: Case studies on tools that can improve their management. In Mountain Ecosystems: Dynamics, Management and Conservation; Richards, K.E., Ed.; Nova Science Publishers: Hauppauge, NY, USA, 2011; pp. 1–44. [Google Scholar]
- Rault, P.A.K.; Koundouri, P.; Akinsete, E.; Ludwig, R.; Huber-Garcia, V.; Tsani, S.; Acuna, V.; Kalogianni, E.; Luttik, J.; Kok, K.; et al. Down scaling of climate change scenarii to river basin level: A transdisciplinary methodology applied to Evrotas river basin, Greece. Sci. Total Environ. 2019, 660, 1623–1632. [Google Scholar] [CrossRef]
- Van den Broeck, M.; Waterkeyna, A.; Rhazic, L.; Grillas, P.; Brendoncka, L. Assessing the ecological integrity of endorheic wetlands, with focus on Mediterranean temporary ponds. Ecol. Indic. 2015, 54, 1–11. [Google Scholar] [CrossRef]
- Magdaleno, F.; Martinez, R. Evaluating the quality of riparian forest vegetation. The Riparian Forest Evaluation (RFV) index. For. Syst. 2014, 23, 259–272. [Google Scholar] [CrossRef] [Green Version]
- Schismenos, S.; Zaimes, G.N.; Iakovoglou, V.; Emmanouloudis, D. Environmental sustainability and ecotourism of riparian and deltaic ecosystems: Opportunities for rural Eastern Macedonia and Thrace, Greece. Int. J. Environ. Stud. 2019, 76, 675–688. [Google Scholar] [CrossRef]
- Zogaris, S.; Hatzivarsanis, V.; Ecomomou, A.N.; Hatznikolaou, Y.; Giakoumi, S.; Dimopoulos, P. Riparian Zones in Greece: Protecting Riverine Oasis of Life; IIW and HCMR: Athens, Greece, 2007. [Google Scholar]
- Strahler, A.N. Quantitative analysis of watershed geomorphology. Trans. Am. Geophys. Union 1957, 38, 913–920. [Google Scholar] [CrossRef] [Green Version]
- Bjorkland, R.; Pringle, C.M.; Newton, B. A stream visual assessment protocol (SVAP) for riparian landowners. Environ. Monit. Assess. 2001, 68, 99–125. [Google Scholar] [CrossRef]
- Munné, A.; Prat, N.; Solà, C.; Bonada, N.; Rieradeval, M. 2003. A simple field method for assessing the ecological quality of riparian habitat in rivers and streams: QBR index. Aquat. Conserv. 2003, 13, 147–163. [Google Scholar] [CrossRef]
- Iakovoglou, V.; Koutsoumis, A.; Zaimes, G.N.; Emmanouloudis, D. Using the Stream Visual Assessment Protocol (SVAP) to Evaluate the Streams and their Riparian Areas of Lake Volvi in Greece. In Proceedings of the International Caucasian Forestry Symposium, Artvin, Turkey, 24–26 October 2013; pp. 1139–1146. [Google Scholar]
- Giatas, G.; Pagonis, G.; Iakovoglou, V.; Raptis, D.; Emmanouloudis, D.; Zaimes, G.N. Assessing rural and agricultural riparian areas of Greece with the use of GIS and SVAP. In Proceedings of the 2nd International Conference Natural Resources Green Technology & Sustainable Management, Zagreb, Croatia, 5–7 October 2016; Redovnikovic, I.R., Srcek, V.G., Radosevic, L., Jakovljevic, T., Stojacovic, R., Hendrih, D.E., Eds.; Faculty of Food Technology and Biorechnology, University of Zagreb: Zagreb, Croatia, 2016; pp. 24–30. [Google Scholar]
- Kasapidis, K.; Giatas, G.; Pagonis, G.; Kiourtziadis, P.; Iakovoglou, V.; Zaimes, G.N. Assessing mountainous riparian areas of North Greece adjacent to forested and rural areas with the use of GIS, SVAP and QBR. In Proceedings of the Sixth International Conference on Environmental Management, Engineering, Planning & Economics, Thessaloniki, Greece, 25–30 June 2017; pp. 1167–1178. [Google Scholar]
- Kiourtziadis, P.; Iakovoglou, V.; Zaimes, G.N.; Emmanouloudis, D. Hydrologic and anthropogenic impacts on riparian areas in agricultural dominated landscapes of Greece. In Proceedings of the 3rd International Conference Water Resources and Wetlands, Tulcea, Romania, 8–10 September 2016; Gastescu, P., Bretcan, P., Eds.; Romanian Limnogeographical Association: Tulcea, Romania, 2016; pp. 107–112. [Google Scholar]
- Savopoulou, A.; Giatas, G.; Pagonis, G.; Iakovoglou, V.; Zaimes, G.N. Visual protocols and GIS as preliminary investigative tools to locate potential ecoengineering in streams and riparian areas. Procedia Environ. Sci. Eng. Manag. 2017, 4, 227–234. [Google Scholar]
- Sharifinia, M.; Mahmoudifard, A.; Imanpour Namin, J.; Ramezanpour, Z.; Kong Yap, C. Pollution evaluation in the Shahrood River: Do physico-chemical and macroinvertebrate-based indices indicate same responses to anthropogenic activities? Chemosphere 2016, 159, 584–594. [Google Scholar] [CrossRef] [PubMed]
- Sharma, M.P.; Sharma, S.; Goel, V.; Sharma, P.; Kumar, A. Water quality assessment of Nigland stream using benthic macroinvertebrates. Life Sci. J. 2008, 5, 67–72. [Google Scholar]
- Berges, S.A.; Schulte Moore, L.A.; Isenhart, T.M.; Schultz, R.C. Bird species diversity in riparian buffers, row crop fields, and grazed pastures within agriculturally dominated watersheds. Agrofor. Syst. 2010, 79, 97–110. [Google Scholar] [CrossRef]
- Hassall, C. Odonata as candidate macroecological barometers for global climate change. Freshw. Sci. 2015, 34, 1040–1049. [Google Scholar] [CrossRef]
- Viegas, G.; Stenert, C.; Schulz, U.W.; Maltchik, L. Dung beetle communities as biological indicators of riparian forest widths in southern Brazil. Ecol. Indic. 2014, 36, 703–710. [Google Scholar] [CrossRef]
- Zaimes, G.N.; Loisios, P.; Fytopoulos, P.; Mersina, C.; Fyllas, N.; Iakovoglou, V.; Avtzis, D. Ground dwelling insects as environmental indicators of riparian habitats in agricultural Mediterranean landscapes. Environ. Eng. Manag. J. 2019, 18, 1977–1986. [Google Scholar] [CrossRef]
- Kontsiotis, V.; Zaimes, G.N.; Tsiftsis, S.; Kiourtziadis, P.; Bakaloudis, D. Assessing the influence of riparian vegetation structure on bird communities in agricultural Mediterranean landscapes. Agrofor. Syst. 2019, 93, 675–687. [Google Scholar] [CrossRef]
- Zaimes, G.N.; Manikas, N.; Spanos, T.; Chrisopoulos, V.; Avtzis, D.N. Odonata as indicators of riverine habitats in Central Greece. Fresen Environ. Bull. 2017, 26, 4244–4253. [Google Scholar]
- Shannon, C.E.; Weaver, W. The Mathematical Theory of Communication; Illinois University Press: Urbana, IL, USA, 1949. [Google Scholar]
- Simpson, E.H. Measurement of diversity. Nature 1949, 163, 688. [Google Scholar] [CrossRef]
- Zaimes, G.N.; Gounarids, D.; Fotakis, D. Assessing riparian land-uses/vegetation cover along the Nestos River in Greece. Fresen Environ. Bull. 2011, 20, 3217–3225. [Google Scholar]
- Zaimes, G.N.; Gounaridis, D.; Symeonakis, E. Assessing the impact of dams on riparian and deltaic vegetation using remotely-sensed vegetation indices and Random Forests modelling. Ecol. Indic. 2019, 103, 630–641. [Google Scholar] [CrossRef]
- Higginbottom, T.P.; Symeonakis, E. Assessing land degradation and desertification using vegetation index data: Current frameworks and future directions. Remote Sens. 2014, 6, 9552–9575. [Google Scholar] [CrossRef] [Green Version]
- Wilson, N.R.; Norman, L.M.; Villarreal, M.; Gass, L.; Tiller, R.; Salywon, A. Comparison of remote sensing indices for monitoring of desert cienegas. Arid Land Res. Manag. 2016, 30, 460–478. [Google Scholar] [CrossRef] [Green Version]
- Jiang, Z.; Huete, A.R.; Kim, Y.; Didan, K. 2-band enhanced vegetation index without a blue band and its application to AVHRR data. Remote Sensing and Modeling of Ecosystems for Sustainability. Proc. SPIE 2007, 6679, 667905. [Google Scholar]
- Gitelson, A.A.; Kaufman, Y.J.; Merzlyak, M.N. Use of a green channel in remote sensing of global vegetation from EOS-MODIS. Remote Sens. Environ. 1996, 58, 289–298. [Google Scholar] [CrossRef]
- Chandrasekar, K.; Sesha Sai, M.V.R.; Roy, P.S.; Dwevedi, R.S. Land Surface Water Index (LSWI) response to rainfall and NDVI using the MODIS vegetation index product. Int. J. Remote Sens. 2010, 31, 3987–4005. [Google Scholar] [CrossRef]
- Key, C.H.; Benson, N.; Ohlen, D.; Howard, S.; McKinley, R.; Zhu, Z. The normalized burn ratio and relationships to burn severity: Ecology, remote sensing and implementation. In Proceedings of the Ninth Forest Service Remote Sensing Applications Conference, San Diego, CA, USA, 8–12 April 2002; Greer, J.D., Ed.; American Society for Photogrammetry and Remote Sensing: Bethesda, MD, USA, 2002.
- Tucker, C.J. Red and photographic infrared linear combinations for monitoring vegetation. Remote Sens. Environ. 1979, 8, 127–150. [Google Scholar] [CrossRef] [Green Version]
- Gao, B. NDWI—A normalized difference water index for remote sensing of vegetation liquid water from space. Remote Sens. Environ. 1996, 58, 257–266. [Google Scholar] [CrossRef]
- Richardson, A.J.; Wiegand, C.L. Distinguishing vegetation from soil background information (by gray mapping of Landsat MSS data. Photogramm. Eng. Remote Sens. 1987, 47, 1541–1552. [Google Scholar]
- Liu, W.T.; Kogan, F.N. 1996. Monitoring regional drought using the Vegetation Condition. Index. Int. J. Remote Sens. 1996, 17, 2761–2782. [Google Scholar] [CrossRef]
- Hansen, M.C.; Potapov, P.V.; Moore, R.; Hancher, M.; Turubanova, S.A.; Tyukavina, A.; Thau, D.; Stehman, S.V.; Goetz, S.J.; Loveland, T.R.; et al. High-resolution global maps of 21st-century forest cover change. Science 2013, 342, 850–853. [Google Scholar] [CrossRef] [PubMed] [Green Version]
- Breiman, L. Random forests. Machine Learn. 2001, 40, 5–32. [Google Scholar] [CrossRef] [Green Version]
- Cortes, R.M.V.; Hughes, S.J.; Pereira, V.R.; Da Grac, S.; Varandas, P. 2013. Tools for bioindicator assessment in rivers: The importance of spatial scale, land use patterns and biotic integration. Ecol. Indic. 2013, 34, 460–477. [Google Scholar] [CrossRef]
- Nguyen, U.; Glenn, E.P.; DucDang, T.; Pham, L.T.H. Mapping vegetation types in semi-arid riparian regions using random forest and object-based image approach: A case study of the Colorado River Ecosystem, Grand Canyon, Arizona. Ecol Inform. 2019, 50, 43–50. [Google Scholar] [CrossRef]
- Gounaridis, D.; Chorianopoulos, I.; Koukoulas, S. Exploring prospective urban growth trends under different economic outlooks and land-use planning scenarios: The case of Athens. Appl. Geograp. 2018, 90, 134–144. [Google Scholar] [CrossRef]
- Gounaridis, D.; Chorianopoulos, I.; Symeonakis, E.; Koukoulas, S. A multi-scale Random Forest/Cellular Automata modelling approach for mapping land use/cover changes in Attica (Greece), under divergent socioeconomic realities. Sci. Total Environ. 2019, 646, 320–335. [Google Scholar] [CrossRef]
- Liaw, A.; Wiener, M. Classification and regression by randomForest. R News 2002, 2, 18–22. [Google Scholar]
- Zogaris, S.; Chatzinikolaou, Y.; Dimopoulos, P. Assessing environmental degradation of montane riparian zones in Greece. J. Environ. Biol. 2009, 30, 719–726. [Google Scholar]
- Kazoglou, Y.; Fotiadis, G.; Vrahnakis, M.; Koutseri, I.; Crivelli, A. Assessment of riparian forest vegetation of rivers supporting the Prespa trout in the Transboundary Prespa Park. Ecohydrol. Hydrobiol. 2011, 11, 63–78. [Google Scholar] [CrossRef]
- Bruno, D.; Belmar, O.; Sánchez-Fernández, D.; Guareschi, S.; AndrésMillán, A.; Velasco, J. Responses of Mediterranean aquatic and riparian communities to human pressures at different spatial scales. Ecol. Indic. 2014, 45, 456–464. [Google Scholar] [CrossRef]
- Larsen, S.; Scalici, M.; Tancioni, L. Scale dependent biodiversity patterns in Mediterranean river catchments: A multi taxa approach. Aquat. Sci. 2015, 77, 455–463. [Google Scholar] [CrossRef]
- Batisteli, A.F.; Tanaka, M.O.; Souza, A.L. Bird functional traits respond to forest structure in riparian areas undergoing active restoration. Diversity 2018, 10, 90. [Google Scholar] [CrossRef] [Green Version]
- Perry, K.I.; Herms, D.A. Dynamic responses of ground-dwelling invertebrate communities to disturbance in forest ecosystems. Insects 2019, 10, 61. [Google Scholar] [CrossRef] [Green Version]
- Lee, D.-Y.; Lee, D.-S.; Bae, M.-J.; Hwang, S.-J.; Noh, S.-Y.; Moon, J.-S.; Park, Y.-S. Distribution patterns of odonate assemblages in relation to environmental variables in streams of South Korea. Insects 2018, 9, 152. [Google Scholar] [CrossRef] [Green Version]
- Sirabahenda, Z.; St-Hilaire, A.; Courtenay, S.C.; van den Heuvel, M.R. Assessment of the effective width of riparian buffer strips to reduce suspended sediment in an agricultural landscape using ANFIS and SWAT models. Catena 2020, 195, 104762. [Google Scholar] [CrossRef]
- Elliott, K.J.; Voseb, J.M. Effects of riparian zone buffer widths on vegetation diversity in southern Appalachian headwater catchments. For. Ecol. Manag. 2016, 376, 9–23. [Google Scholar] [CrossRef] [Green Version]
- Clerici, N.; Paracchini, M.L.; Maes, J. Land-cover change dynamics and insights into ecosystem services in European stream riparian zones. Ecohydrol. Hydrobiol. 2014, 14, 107–120. [Google Scholar] [CrossRef]
- Corbacho, C.; Sanchez, J.M.; Costillo, E. Patterns of structural complexity and human disturbance of riparian vegetation in agricultural landscapes of a Mediterranean area. Agric. Ecosyst. Environ. 2003, 95, 495–507. [Google Scholar] [CrossRef]
- Riis, T.; Kelly-Quinn, M.; Aguiar, F.C.; Manolaki, P.; Bruno, D.; Bejarano, M.D.; Clerici, N.; Fernandes, M.R.; Franco, J.C.; Pettit, N.; et al. Global overview of ecosystem services provided by riparian vegetation. BioScience 2020, 70, 501–514. [Google Scholar] [CrossRef]
- Duke, J.R.; White, J.D.; Prochnow, J.S.; Zygo, L.; Allen, P.M.; Muttiah, R.S. The use of remote sensing and modelling to detect small-dam influences on land-use changes along downstream riparian zones. Ecohydrol. Hydrobiol. 2007, 7, 23–35. [Google Scholar] [CrossRef]
- Bejarano, M.D.; Sarneel, J.; Su, X.; Sordo-Ward, A. Shifts in riparian plant life forms following flow regulation. Forests 2020, 11, 518. [Google Scholar] [CrossRef]
- Ibáñez, C.; Caiola, N.; Belmar, O. Environmental flows in the lower Ebro river and delta: Current status and guidelines for a holistic approach. Water 2020, 12, 2670. [Google Scholar] [CrossRef]
- Lozanovska, I.; Rivaes, R.; Vieira, C.; Ferreira, M.T.; Aguiar, F.C. Streamflow regulation effects in the Mediterranean rivers: How far and to what extent are aquatic and riparian communities affected? Sci. Total Environ. 2020, 749, 141616. [Google Scholar] [CrossRef] [PubMed]
- Zhou, H.; Chen, Y.; Zhu, C.; Li, Z.; Fang, G.; Li, Y.; Fu, A. Climate change may accelerate the decline of desert riparian forest in the lower Tarim River, Northwestern China: Evidence from tree-rings of Populus euphratica. Ecol. Indic. 2020, 111, 105997. [Google Scholar] [CrossRef]
- Shakhane, T.; Fourie, F.D.; Du Preez, P.J. Mapping riparian vegetation and charactersing its groundwater dependency at the modder river government water scheme. Groundw. Sustain. Dev. 2017, 5, 216–228. [Google Scholar] [CrossRef]
- Ye, C.; Butler, O.M.; Chen, C.; Liu, W.; Du, M.; Zhang, Q. Shifts in characteristics of the plant-soil system associated with flooding and revegetation in the riparian zone of Three Gorges Reservoir, China. Geoderma 2020, 361, 114015. [Google Scholar] [CrossRef]
- Bergillos, R.F.; Ortega-Sánchez, M. 2017. Assessing and mitigating the landscape effects of river damming on the Guadalfeo River delta, southern Spain. Landsc. Urban Plann. 2017, 165, 117–129. [Google Scholar] [CrossRef]
- Wang, H.; Wu, X.; Bi, N.; Li, S.; Yuan, P.; Wang, A.; Syvitski, J.P.M.; Saito, Y.; Yang, Z.; Liu, S.; et al. Impacts of the dam orientated water-sediment regulation scheme on the lower reaches and delta of the Yellow River (Huanghe): A review. Glob. Planet. Change 2017, 157, 93–113. [Google Scholar] [CrossRef]
- Poulos, S.; Collins, M. Fluviatile sediment fluxes to the Mediterranean Sea: A quantitative approach and the influence of dams. Geol. Soc. Lond. Spec. Publ. 2002, 191, 227–245. [Google Scholar] [CrossRef]
- UNEP/MAP. State of the Mediterranean Marine and Coastal Environment; UNEP/MAP–Barcelona Convention: Athens, Greece, 2012. [Google Scholar]
- Zaimes, G.N.; Tardio, G.; Iakovoglou, V.; Gimenez, M.; Garcia-Rodriguez, J.L.; Sangalli, P. New tools and approaches to promote soil and water bioengineering in the Mediterranean. Sci. Total Environ. 2019, 693, 133677. [Google Scholar] [CrossRef] [PubMed]
- Symmank, L.; Natho, S.; Scholz, M.; Schröder, U.; Raupach, K.; Schulz-Zunkel, C. The impact of bioengineering techniques for riverbank protection on ecosystem services of riparian zones. Ecol. Eng. 2020, 158, 106040. [Google Scholar] [CrossRef]
- Lilli, M.A.; Nerantzaki, S.D.; Riziotis, C.; Kotronakis, M.; Efstathiou, D.; Kontakos, D.; Lymberakis, P.; Avramakis, M.; Tsakirakis, A.; Protopapadakis, K.; et al. Vision-based decision-making methodology for riparian forest restoration and flood protection using nature-based solutions. Sustainability 2020, 12, 3305. [Google Scholar] [CrossRef] [Green Version]
- Doswald, N.; Munroe, R.; Roe, D.; Giuliani, A.; Castelli, I.; Stephens, J.; Möller, I.; Spencer, T.; Vira, B.; Reid, H. Effectiveness of ecosystem-based approaches for adaptation: Review of the evidence-base. Clim. Dev. 2014, 6, 185–201. [Google Scholar] [CrossRef]
- Cohen-Shacham, E.; Andrade, A.; Dalton, J.; Dudley, N.; Jones, M.; Kumar, C.; Maginnis, S.; Maynard, S.; Nelson, C.R.; Renaud, F.G.; et al. Core principles for successfully implementing and upscaling Nature-based Solutions. Environ. Sci. Pol. 2019, 98, 20–29. [Google Scholar] [CrossRef]
Figure 1.
(A) The study area locations in Greece; (B) the study reaches of the ground-dwelling insects and small birds in Northern Greece; (C) the study reaches using the geographic information systems (GIS) Buffer function in Northern Greece; (D) the study reaches of the dragonflies in Central Greece; (E) the study reaches for the visual protocols in Northern Greece, (G) the watershed boundaries of the study using the GIS buffer function and the delta boundaries for the Indices and Random Forest in The Nestos Basin and (F) the studies streams and torrents of Volvi watershed.

Figure 2.
The different methods that can be used to assess riparian areas based on analysis and the scale requirements of the study.
Figure 2.
The different methods that can be used to assess riparian areas based on analysis and the scale requirements of the study.

Table 1.
The SVAP average assessment scores of the plain, semi-mountainous and mountainous reaches of the torrents that end in Lake Volvi of Central Macedonia, Greece.
Table 1.
The SVAP average assessment scores of the plain, semi-mountainous and mountainous reaches of the torrents that end in Lake Volvi of Central Macedonia, Greece.
| Landscape/ Stream # | 1 | 2 | 3 | 4 | 5 | 6 | 7 | 8 | 9 | 10 | 11 | 12 | 13 | 14 |
|---|---|---|---|---|---|---|---|---|---|---|---|---|---|---|
| Plains | 3.7 | 3.5 | 3.5 | 3.2 | 4.1 | 3.9 | 5.4 | 4.7 | 6.0 | 3.7 | 4.4 | 5.9 | 4.7 | 4.4 |
| Semi-Mountainous | 4.2 | 3.9 | 3.0 | 4.0 | 5.0 | 4.3 | 4.4 | 5.5 | 5.7 | 4.2 | 4.1 | 7.3 | 5.9 | 5.4 |
| Mountainous | 6.4 | 6.9 | 6.4 | 6.0 | 7.6 | 6.8 | 7.2 | 6.7 | 7.2 | 5.7 | 6.0 | 5.8 | 6.3 | 6.8 |
Table 2.
The SVAP average and range of the assessment scores of stream or torrent reaches adjacent to agricultural or forested areas in Eastern Macedonia, Greece.
Table 2.
The SVAP average and range of the assessment scores of stream or torrent reaches adjacent to agricultural or forested areas in Eastern Macedonia, Greece.
| Reach Characteristics | Torrent— Forested | Stream— Agriculture 1 | Torrent— Agriculture | Stream— Forested | Stream— Agriculture 2 | Stream— Agriculture 3 |
|---|---|---|---|---|---|---|
| Average | 5.5 | 7.2 | 6.2 | 7.4 | 6.4 | 5.8 |
| Range | 3.8–7.1 | 6.5–7.7 | 5.0–7.3 | 6.9–7.8 | 4.6–7.6 | 4.5–7.6 |
| Sample plots | 21 | 20 | 20 | 20 | 20 | 25 |
Table 3.
The QBR average and range of the assessment scores of stream or torrent reaches adjacent to agricultural or forested areas in Eastern Macedonia, Greece.
Table 3.
The QBR average and range of the assessment scores of stream or torrent reaches adjacent to agricultural or forested areas in Eastern Macedonia, Greece.
| Reach Characteristics | Torrent—Forested | Stream—Agriculture 1 | Torrent—Agriculture | Stream—Forested |
|---|---|---|---|---|
| Average | 63 | 58 | 59 | 83 |
| Range | 15–95 | 45–75 | 40–80 | 65–95 |
| Sampling plots | 21 | 20 | 20 | 20 |
Table 4.
The Shannon-Wiener Diversity (H), Equitability (Eh) and Simpson (D) Indices for different riparian habitats based on surveys of ground-dwelling insects, dragonflies and small birds.
Table 4.
The Shannon-Wiener Diversity (H), Equitability (Eh) and Simpson (D) Indices for different riparian habitats based on surveys of ground-dwelling insects, dragonflies and small birds.
| Habitat/Indices | H | Eh | D |
|---|---|---|---|
| Ground-dwelling insects | |||
| Torrent adjacent to Natural forested area in a Hilly landscape (TNH) | 0.90 | 0.41 | 0.62 |
| Torrent adjacent to a Natural forest in a Flat landscape (TNF) | 0.64 | 027 | 0.77 |
| Stream adjacent to a Forest Planation in a Flat landscape (SPF) | 0.41 | 0.59 | 0.76 |
| Dragonflies | |||
| River with a Wide riparian zone (>30 m) (RW) | 1.29 | 0.80 | 0.34 |
| Torrent with Medium riparian zone (>15 m) (TM) | 1.31 | 0.73 | 0.35 |
| Spring, thermal with the Narrow riparian zone (<15 m) (SN) | 1.05 | 0.75 | 0.38 |
| Small birds | |||
| Torrent adjacent to Natural forested area (TN) | 4.3 | 0.54 | - |
| Stream adjacent to Natural forested area (SN) | 3.9 | 0.50 | - |
| Stream adjacent to a Forested Planation (SP) | 3.2 | 0.30 | - |
Table 5.
The land-uses/vegetation cover of the riparian areas (%) of the Nestos Basin downstream from the Platanovrysi dam. The land-uses/vegetation cover are presented for each stream order, the irrigation canals for the entire basin, the mountainous and plain areas.
Table 5.
The land-uses/vegetation cover of the riparian areas (%) of the Nestos Basin downstream from the Platanovrysi dam. The land-uses/vegetation cover are presented for each stream order, the irrigation canals for the entire basin, the mountainous and plain areas.
| Watershed Landscape | Land-Use | Stream Order (%) | ||||||
|---|---|---|---|---|---|---|---|---|
| 1 | 2 | 3 | 4 | 5 | 6 | Irrigation Canals | ||
| Entire | Forest | 77.94 | 75.44 | 84.55 | 65.26 | 69.04 | 74.07 | 1.41 |
| Agriculture | 9.60 | 14.22 | 8.00 | 30.76 | 30.96 | 3.17 | 83.45 | |
| Grassland | 8.82 | 6.49 | 6.07 | 3.58 | 0.00 | 21.90 | 7.49 | |
| Urban | 0.67 | 1.30 | 1.06 | 0.00 | 0.00 | 0.00 | 4.20 | |
| Other | 2.97 | 2.55 | 0.32 | 0.39 | 0.00 | 0.86 | 3.25 | |
| Plains | Forest | 6.53 | 6.76 | 0.00 | 0.0 | 0.00 | 53.58 | 1.62 |
| Agriculture | 73.63 | 77.80 | 79.56 | 93.58 | 100.00 | 2.29 | 83.06 | |
| Grassland | 13.00 | 8.12 | 13.11 | 6.42 | 0.00 | 44.13 | 7.75 | |
| Urban | 2.85 | 5.33 | 7.33 | 0.00 | 0.00 | 0.00 | 4.57 | |
| Other | 4.00 | 2.00 | 0.00 | 0.00 | 0.00 | 0.00 | 3.00 | |
| Mountainous | Forest | 90.00 | 91.53 | 94.03 | 94.97 | 100.00 | 84.99 | 0.00 |
| Agriculture | 1.99 | 1.50 | 0.00 | 2.51 | 0.00 | 3.82 | 0.00 | |
| Grassland | 7.56 | 6.37 | 5.40 | 2.52 | 0.00 | 11.19 | 0.00 | |
| Urban | 0.46 | 0.59 | 0.57 | 0.00 | 0.00 | 0.00 | 0.00 | |
| Other | 0.00 | 0.00 | 0.00 | 0.00 | 0.00 | 0.00 | 0.00 | |
Table 6.
The land-uses/vegetation cover (%) of the riparian areas of three study reaches in Drama prefect.
Table 6.
The land-uses/vegetation cover (%) of the riparian areas of three study reaches in Drama prefect.
| Land-Use/Vegetation Cover | Buffer 20 Meters | Buffer 50 Meters | ||||
|---|---|---|---|---|---|---|
| Torrent— Forested | Stream— Agriculture 2 | Stream— Agriculture 3 | Torrent— Forested | Stream— Agriculture 2 | Stream— Agriculture 3 | |
| Shrub vegetation | 13.92 | - | - | 13.30 | - | - |
| Transition zones (Shrub to Forest) | 9.67 | - | - | 12.97 | - | - |
| Broadleaved Forests | 64.73 | 4.51 | 32.32 | 62.47 | 4.62 | 31.37 |
| Conifer Forests | 11.68 | - | - | 11.27 | - | - |
| Non-irrigated farmland | - | 45.25 | 44.55 | - | 45.21 | 43.86 |
| Irrigated farmland | - | 34.91 | 22.89 | - | 35.05 | 23.86 |
| Discontinuous rural settlements | - | 0.25 | 0.24 | - | 0.91 | - |
| Rangelands | - | 8.88 | - | - | 8.67 | |
| Agricultural land with natural vegetation | - | 6.20 | - | - | 6.09 | - |
Table 7.
The five most important predictor variables for the vegetation changes based on the Random Forest model. This was based on the frequency of a variables in the top five of each of the eight indices examined. The Mean Decrease Accuracy was used for the three classes of vegetation covers.
Table 7.
The five most important predictor variables for the vegetation changes based on the Random Forest model. This was based on the frequency of a variables in the top five of each of the eight indices examined. The Mean Decrease Accuracy was used for the three classes of vegetation covers.
| Mean Decrease Accuracy | ||||||
|---|---|---|---|---|---|---|
| Rank | Vegetation Cover of 50–75% | Vegetation Coverage of 25–49% | Vegetation Coverage of 0–24% | |||
| Parameter | Number of Indices | Parameter | Number of Indices | Parameter | Number of Indices | |
| 1 | Distance from sea | 8 | Distance from sea | 8 | Distance from dam | 8 |
| 2 | Distance from river | 8 | Distance from dam | 8 | Distance from sea | 8 |
| 3 | Distance from dam | 8 | Distance from residential areas | 5 | Mean temp. coldest quarter | 5 |
| 4 | Mean diurnal range | 7 | Annual precipitation | 5 | Distance from river | 4 |
| 5 | Isothermality | 6 | Distance from river | 4 | Precipitation seasonality | 4 |
Table 8.
The five most important predictor variables for the vegetation changes based on the Random Forest model. This was based on the frequency of a variable in the top five of each of the eight indices examined. The Mean Decrease Gini was used for the three classes of vegetation covers.
Table 8.
The five most important predictor variables for the vegetation changes based on the Random Forest model. This was based on the frequency of a variable in the top five of each of the eight indices examined. The Mean Decrease Gini was used for the three classes of vegetation covers.
| Mean Decrease Gini | ||||||
|---|---|---|---|---|---|---|
| Rank | Vegetation Cover of 50–75% | Vegetation Coverage of 25–49% | Vegetation Coverage of 0–24% | |||
| Parameter | Number of Indices | Parameter | Number of Indices | Parameter | Number of Indices | |
| 1 | Distance from river | 8 | Distance from sea | 8 | Distance from sea | 8 |
| 2 | Distance from sea | 8 | Distance from river | 8 | Distance from dam | 8 |
| 3 | Distance from croplands | 8 | Distance from dam | 8 | Distance from croplands | 8 |
| 4 | Distance from dam | 8 | Distance from residential areas | 7 | Distance from river | 8 |
| 5 | Distance from residential areas | 8 | Distance from croplands | 6 | Distance from residential areas | 8 |
Publisher’s Note: MDPI stays neutral with regard to jurisdictional claims in published maps and institutional affiliations. |
© 2020 by the authors. Licensee MDPI, Basel, Switzerland. This article is an open access article distributed under the terms and conditions of the Creative Commons Attribution (CC BY) license (http://creativecommons.org/licenses/by/4.0/).
Share and Cite
MDPI and ACS Style
Zaimes, G.N.; Iakovoglou, V. Assessing Riparian Areas of Greece—An Overview. Sustainability 2021, 13, 309. https://doi.org/10.3390/su13010309
AMA Style
Zaimes GN, Iakovoglou V. Assessing Riparian Areas of Greece—An Overview. Sustainability. 2021; 13(1):309. https://doi.org/10.3390/su13010309
Chicago/Turabian StyleZaimes, George N., and Valasia Iakovoglou. 2021. "Assessing Riparian Areas of Greece—An Overview" Sustainability 13, no. 1: 309. https://doi.org/10.3390/su13010309
Note that from the first issue of 2016, this journal uses article numbers instead of page numbers. See further details here.