Article

Simulating the Shallow Groundwater Level Response to Artificial Recharge and Storage in the Plain Area of the Daqing River Basin, China

1
College of Construction Engineering, Jilin University, Changchun 130026, China
2
Institute of Water Resources and Environment, Jilin University, Changchun 130021, China
3
College of New Energy and Environment, Jilin University, Changchun 130012, China
4
Nanjing Center of China Geological Survey, Nanjing 210016, China
*
Author to whom correspondence should be addressed.
Sustainability 2021, 13(10), 5626; https://doi.org/10.3390/su13105626
Submission received: 12 April 2021 / Revised: 7 May 2021 / Accepted: 7 May 2021 / Published: 18 May 2021

Abstract

:
Water shortage and overexploitation of groundwater (GW) have become the key factors restricting the development of the Xiongan New Area (XNA), the environmental management of Baiyangdian Lake, and the social and economic development of surrounding areas. This study used a numerical GW flow model to quantitatively analyze the changes to the shallow GW level and GW reserves of the plain area of the Daqing River Basin over the next 15 years (2021–2035) under different artificial recharge schemes with the south to north water diversion project (SNWDP) acting as the GW recharge source. The results showed increasing GW storage and GW levels and that the regional GW resources are in a positive equilibrium state. The rates of change of the well irrigation supply scheme and the joint river-well irrigation supply scheme in the XNA will increase by 14.56% and 11.04% by 2035 as compared with the current situation. The well irrigation recharge scheme for the XNA was determined to be the most effective when comparing with the effects of the different artificial recharge schemes on the GW levels and recharge. This study provides a reference for the management and protection of aquifers in other areas suffering serious GW overexploitation.

1. Introduction

Groundwater (GW) is an essential source of water for the environment, domestic water supply, agriculture, and industry due to its generally good quality and widespread occurrence [1]. While GW has supported rapid socioeconomic development in China and globally, overexploitation of groundwater has caused many environmental and geological problems. The negative environmental impacts of GW depletion from overexploitation are well known, and include deteriorating GW quality, ecosystem degradation, and in some cases, land subsidence and/or seawater intrusion [2,3,4,5]. The excessive depletion of GW over the last 50 years has become a global problem affecting major regions of North Africa, the Middle East, South and Central Asia, North China, North America, and Australia [6,7,8].
The North China Plain (NCP) is recognized to be one of the areas experiencing serious GW depletion [9,10]. The Chinese government established the Xiongan New Area (XNA) on the 1st April, 2017. The establishment of the XNA is of great practical and far-reaching historical significance [11]. However, achieving sustainable development in the XNA is currently being hindered by water deficits, severe water pollution, and overexploitation of GW.
Although the GW system has a certain natural regulation ability, this has been increasingly degraded under the strong influence of human activities. Therefore, artificial GW storage has become an important measure implemented to prevent the continuous shortage in GW resources and to maintain the vitality of the GW system. Artificial recharge can be defined as the artificial regulation and storage of water resources in space and time to ensure their full and reasonable utilization. An important prerequisite for artificial GW replenishment is the availability of a rechargeable source of abundant and good water quality. Water for GW replenishment in the plain area of the Daqing River Basin mainly includes regulated water from the middle route of the south to north water diversion project (SNWDP), reservoir-regulated water, and rainfall runoff. The middle route of the SNWDP has provided ecological water replenishment to Hebei Province through the Fu, Bao, Beiyishui, Nanjuma, Hutuo, and other rivers since September, 2018. To date, the total volume of replenished water has exceeded 1.2 billion m3 [12]. The Wangkuai, Xidayang, Angozhuang, and Longmen reservoirs have been built in the plain area of the Daqing River Basin since the 1950s. In recent years, each reservoir has continuously replenished water through each river to the plain area of the Daqing River Basin to meet ecological requirements. Approximately 420 million m3 of regulated water from each reservoir enters the plain area of the Daqing River Basin every year [12]. Therefore, the study area is characterized by conditions conducive to artificial GW recharge. The Chinese government has issued a series of policies to reduce GW exploitation and increase recharge to solve the problem of continuous GW overexploitation. These developments are likely to lead to complex changes in the GW level in this area.
The numerical simulation of GW is the main technical method used to study the response of GW processes system to GW regulation and storage measures. GW flow models can assist in the formulation of GW regulation and storage management policies [13]. Numerical GW models are clearly appropriate for the assessment of sustainable GW use given the complexity and heterogeneity of aquifer systems and the ability of numerical modeling to integrate different data and to evaluate regional GW dynamics [14,15,16]. Several numerical models have been constructed to evaluate the GW resources and flow dynamics in the NCP. Zhang et al. [17] simulated and analyzed the initial state of GW exploitation in plain area of the Haihe River Basin, with their simulation results providing a basis for water resource management and restoration of the water environment. Wang et al. [18] evaluated the GW depletion in the NCP from January 2002 to December 2003 with their results estimating a total inflow and outflow of 49.4 km3 and 56.5 km3, respectively, for a budget deficit of 7.1 km3. Cui et al. [19] used GW modeling to evaluate the effects of reductions in GW extraction over a ten-year period in response to the additional water provided by the SNWDP. Their study concluded that the SNWDP plays an important role in the recovery of GW in the NCP. Xue et al. [20] use numerical simulation to comprehensively analyze the change in the GW system and the impact of long-term GW exploitation of the shallow aquifer in the plain area of the Haihe River Basin. Liu et al. [21] simulated GW flow dynamics from 1960 to 2004 to evaluate the effects of urbanization of rural areas in the vicinity of Shijiazhuang City and the SNWDP. Hu et al. [22] integrated a crop-growth model and a GW model to evaluate the effects of a reduction in irrigation in Shijiazhuang, with the results of their study showing that a reduction in irrigation of 140 mm/yr could reverse GW depletion in this area.
The implementation of policies mandating GW artificial recharge and GW compression mining will result in changes to the GW-dependent water supply of the NCP. These changes will relieve water deficits to some extent, thereby allowing an opportunity for the recovery of the GW system. The present study established a GW flow numerical model to evaluate the recovery of the GW level and the change in GW reserves. Artificial recharge of GW can directly and effectively increase GW resources, regulate and store surface water, prevent or control the decline in GW levels, control the formation and further expansion of depression cones, and prevent or control land subsidence and other environmental geological problems. It is hoped that the results of the present study can guide a suitable GW recharge and storage scheme to alleviate the environmental risk resulting from the continuous decline of the GW level.

2. Hydrogeological Settings

The plain area of the Daqing River Basin is in the piedmont plain of the Taihang Mountains and covers an area of 13,338 km2 (Figure 1). The elevation increases slightly from northwest to southeast, the terrain is flat, and the surface slope is 1–4‰. The Daqinghe River Basin falls within a temperate semihumid and semiarid continental monsoon climate zone with four distinct seasons. The annual average temperature of the region is 12.3 °C (2015–2018a) [12]. Precipitation in the plain area shows both intra- and interannual heterogeneity and a regional distribution with an annual average of 526 mm (2015–2018a) [12]. Annual average evaporation in the plain area is 1309.7 mm (2015–2018a) [12].
The stratigraphy of the study area consists mainly of unconsolidated quaternary sediments. These sediments contain most of the GW [23]. Previous studies [24,25,26] have shown that the aquifer structure varies from a single aquifer composed of gravels and pebbles in the upper parts of the piedmont fan in the west to multiple aquifers composed of sand, silt, and clay in the east. The GW system can be divided into four aquifer groups based on this stratigraphy (I–IV). Aquifer groups I and II represent shallow aquifers, whereas groups III and IV represent deep aquifers [27] (Figure 2). Aquifer groups I (10–50 m depth) and II (≤210 m) represent unconfined and semiconfined aquifers, respectively, and are exploited for irrigation and ecosystem services. Aquifer groups III (≤310 m) and IV (>400 m) represent confined aquifers. The shallow GW system is characterized by a faster water cycle as compared to the deep GW system, and mainly includes the aquifer groups I and II. GW exploitation in the study area is mainly of the shallow GW system. Overexploitation of the shallow GW system has resulted in water shortages, GW fall cones, and a series of environmental and geological problems. Artificial GW recharge is urgently required to assist in the recovery of this aquifer. Therefore, the present study concentrated on the shallow aquifer system under aquifer groups I and II. The deep GW system (aquifer groups III and IV) mainly consists of confined GW. This aquifer group primarily receives recharge from lateral runoff and shallow water. Artificial exploitation is currently the main discharge route for the deep GW system.
GW recharge processes are mainly precipitation infiltration, lateral flow in the mountains, and irrigation return flow. GW discharge processes are mainly phreatic evaporation and human GW exploitation. However, GW exploitation in the central and eastern parts of the plain results in flow of GW into the center of depression cones and in the flow of shallow GW into the deep aquifers.
The study area has a per-capita water resources availability of 282 m3/a, which is only 7% of the average per-capita water resources availability in China. There is a high reliance on GW in the study area to support agriculture, industry, and domestic water use. Shallow GW is mainly exploited, accounting for 86.33% of total GW exploitation. Although a series of measures have been introduced in Hebei Province since 2015 to reduce GW exploitation, agricultural production activities in the study area remain reliant on GW.
The middle route of the SNWDP has been an important measure to alleviate water deficits and the deterioration of the ecological environment in the plains of the Daqing River Basin. The middle route of the SNWDP was officially opened in December, 2014 [28]. Under current water transfer levels, the SNWDP can be used to artificially replenish 160 million m3 of GW per year in the plains of the Daqing River Basin.

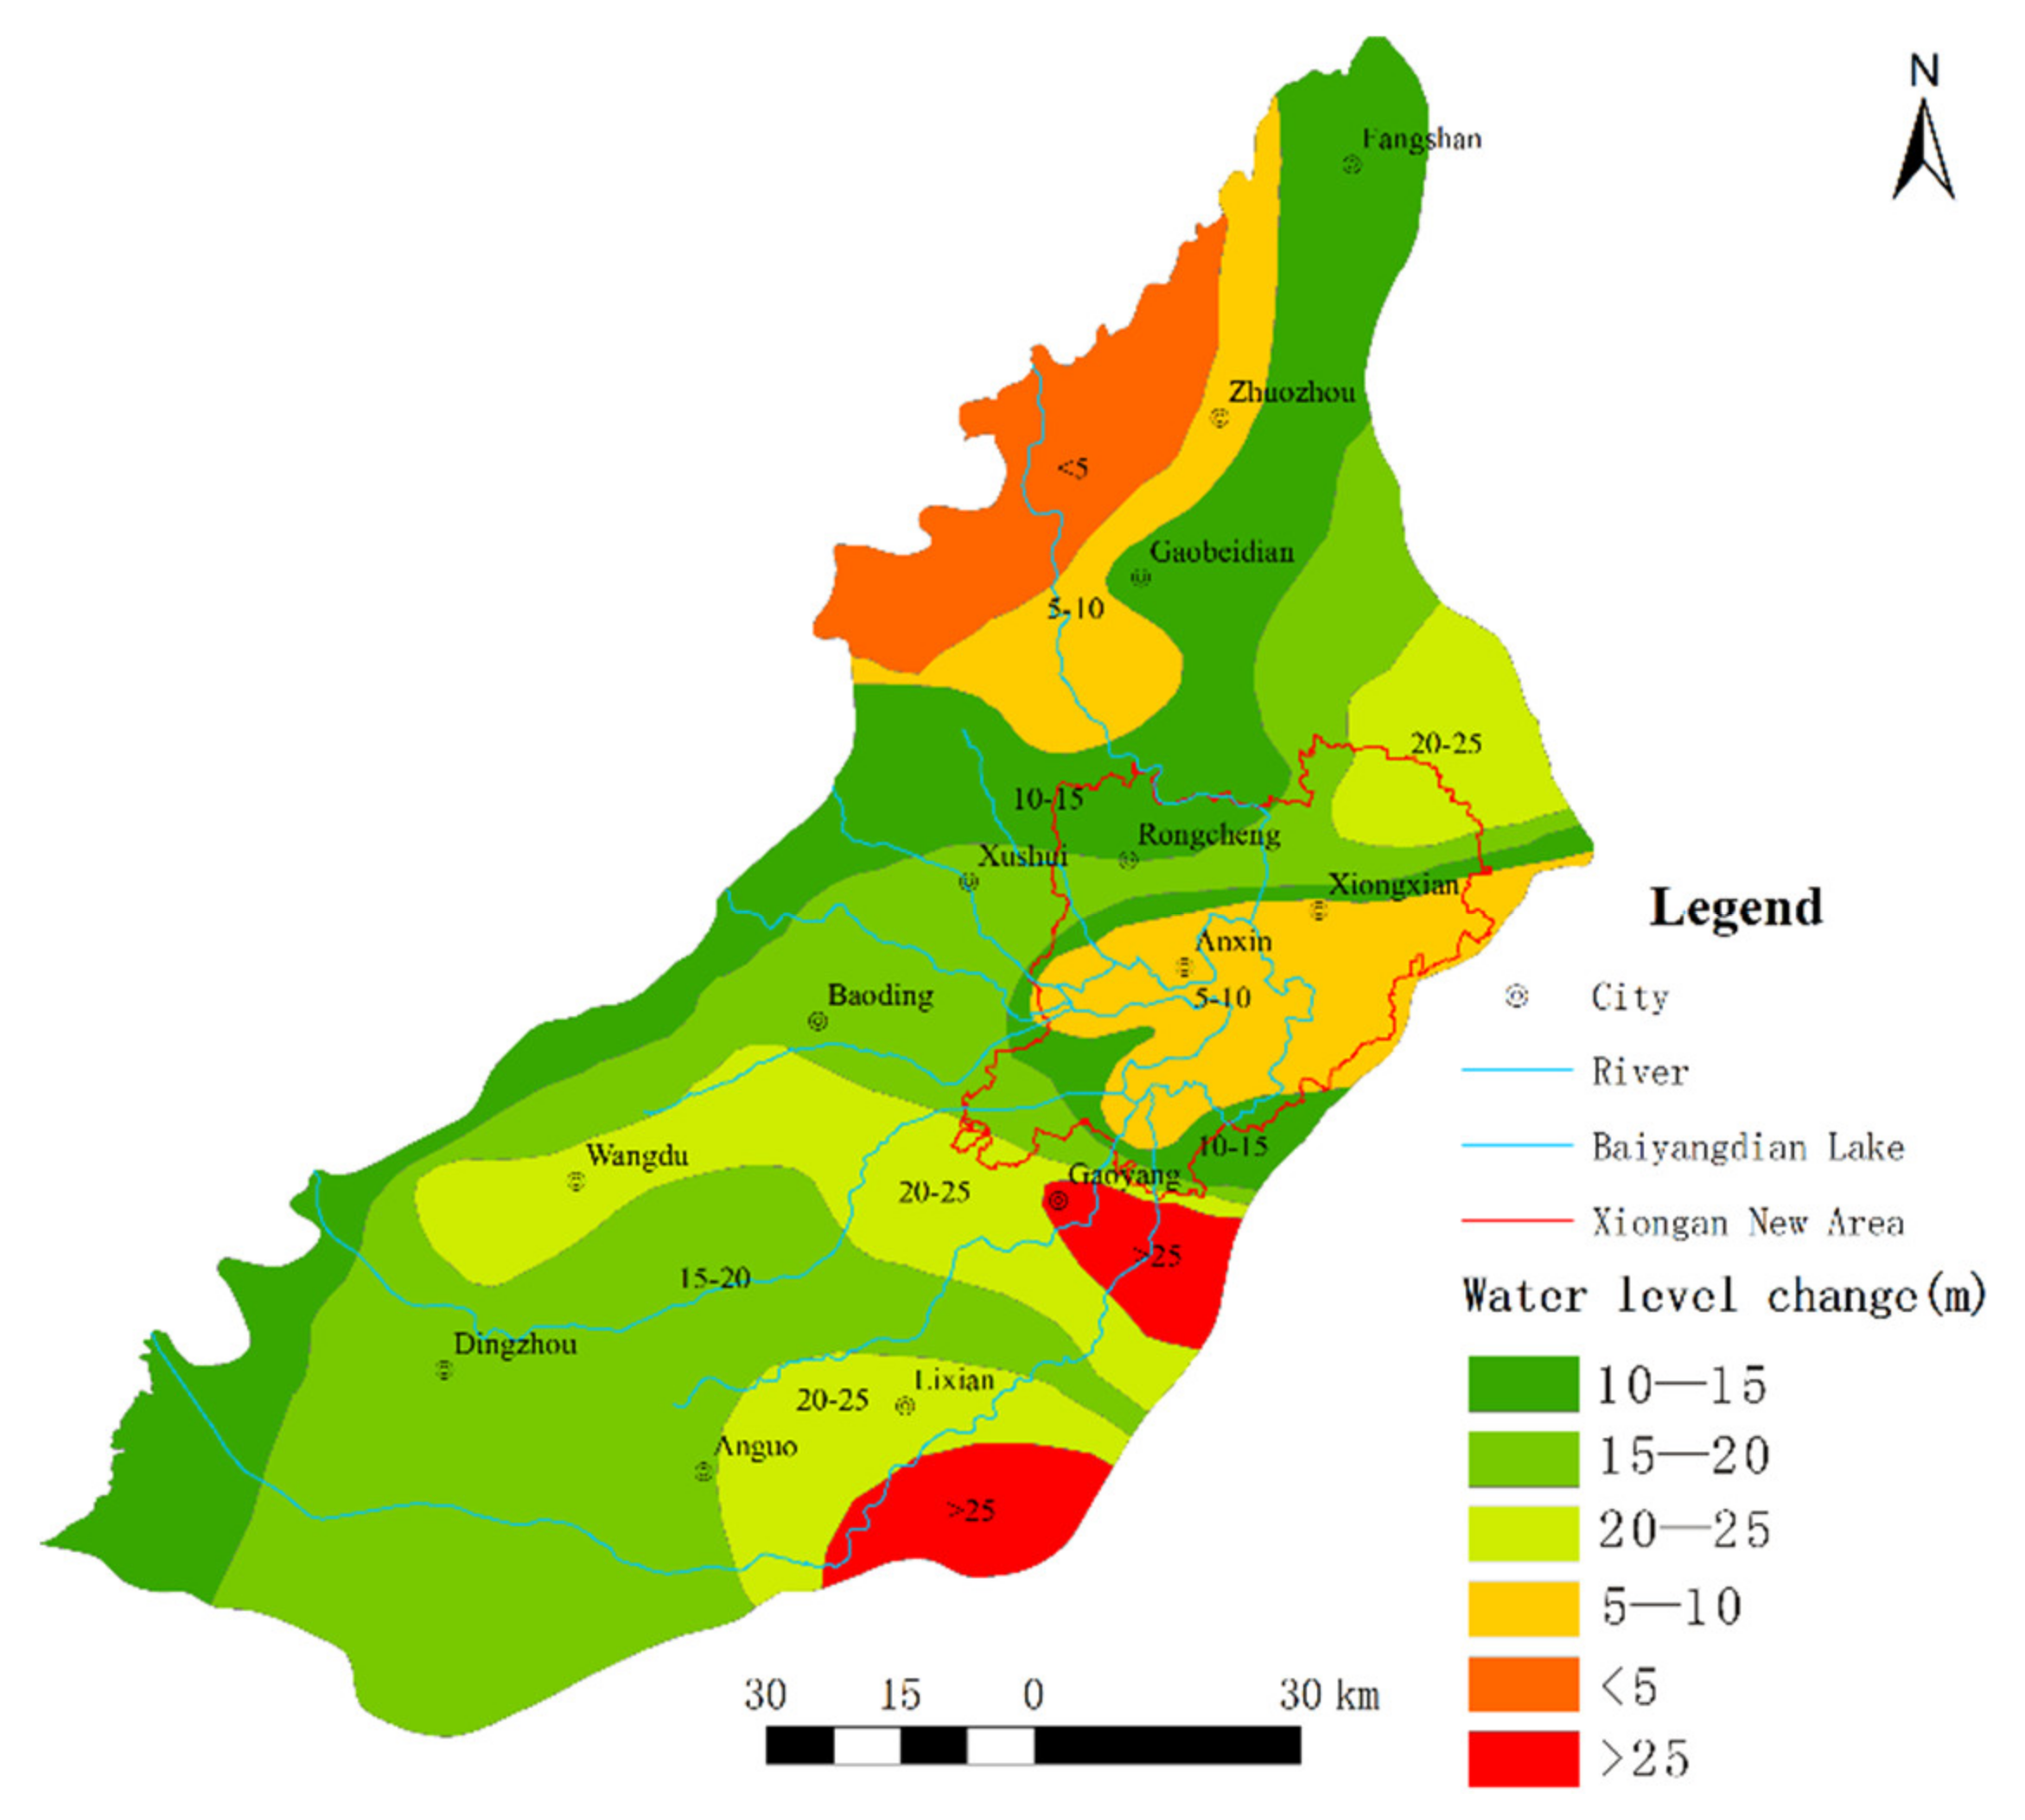
3. Changes in the GW Level

Interannual fluctuations in the shallow GW level are directly affected by atmospheric precipitation and artificial exploitation. Changes to GW levels in the study area over time can be roughly categorized into five periods: (1) the natural flow stage prior to 1964; (2) a stage of a localized declines in GW levels (1964–1972); (3) a stage of rapid decline in regional GW levels (1972–1985); (4) a stage of fluctuating declines in GW level (1985–2015) and; (5) a stage of gradual GW level rise post 2015 [1]. Shallow GW in the study area showed a general decline from 1982 to 2015 (Figure 3). While the rate of decline was small in the piedmont area and the area surrounding Baiyangdian Lake, larger declines in GW were evident in the Wangdu Baoding Gaoyang and Boye Lixian areas due to the large-scale exploitation of GW. GW levels in areas of large-scale exploitation dropped dramatically, resulting in the formation of depression cones. The regional GW level has gradually increased since 2015 due to the implementation of a policy restricting GW exploitation and promoting artificial recharge (Figure 4).

4. GW Flow Model

4.1. Conceptual Model

Figure 1 shows a map of the plain area of the Daqing River Basin. A model was constructed to represent the complex multilayer aquifer system, including two aquifer groups and one aquitard. Aquifer groups I and II were combined into one aquifer group representing the shallow aquifer system due to the presence of several incomplete aquitards. These incomplete aquitards showed enhanced hydraulic connections due to the presence of many pumping wells. Aquifer group III was taken to represent the deep aquifer system. Aquitards were located between the aquifer groups. These aquifers were either characterized by strong horizontal flow due to their wide distribution and thickness or slight flow in the vertical direction. The recharge and discharge of this area changes over time along with the GW level, showing features of transient flow. At the same time, GW parameters show spatial variation, representing heterogeneous flow. As a result, the GW system of the Daqing River Basin could be described using a conceptual hydrologic model comprising three tiers and a heterogeneous, three-dimensional transient flow system with horizontal isotropy.
The mountains form the western boundary of the plain study area and also act to provide lateral GW recharge; therefore, the mountains are treated as a flow boundary in the model. The study area falls within the Daqing River Basin, with the eastern part of the study area bounded by the Daqing and Zhongting rivers and the northeast by the Mangniu River. The southern, northern, and eastern parts of the model were based on the surface watershed obtained from hydrological analysis conducted in the ArcGIS software. Since there are two possibilities for inflow and outflow of GW at the boundary, these boundaries were treated as general head boundaries in the model. The GW table was regarded as the top boundary in the model within which exchange between the GW and the other systems occurred through infiltration of precipitation and evaporation of phreatic water. The bottom of the system was regarded as impermeable due to the presence of loam and clay beneath the quaternary strata.
Since infiltration of precipitation is the dominant source of GW recharge in the study area, GW recharge is affected by the amount of precipitation and the infiltration coefficient. Within the model, the monthly precipitation was evenly distributed across the study area, whereas the infiltration coefficient differed spatially according to six zones, with the coefficient ranging from 0.12 to 0.3 [29]. Although lateral flow from the west is a significant source of recharge in the study area, it is poorly quantified [30]. The recharge rates originating from lateral flow used in the model were based on previous studies in which they were estimated by the profile method [31] and hydrological analysis [32,33]. GW is the primary source of water for irrigation in the study area, accounting for 90% of the total irrigation water [33,34]. The infiltration coefficient of irrigation used in the model was less than that of precipitation considering land use since evaporation is higher during the irrigation season. The irrigation infiltration used in the present study was distributed in 42 zones based on the monthly irrigation and infiltration coefficients. Groundwater recharge through surface water infiltration decreased after the 1960s in the study area, and by the 1980s, the rivers had nearly dried up [20,35]. Before the establishment of the XNA, river GW recharge in the basin mainly occurred through infiltration recharge from the Nanjuma River. Ephemeral streams only influence GW recharge rates in the study area during the flood season. The recharge from ephemeral streams during the flood season was incorporated into total recharge in the model. Most of the rivers in the study area have dried up or have become ephemeral streams during the flood season due to decreasing precipitation and upstream reservoirs retaining runoff [35]. Under the current situation, seepage from Baiyangdian Lake recharges the surrounding GW, and the average lake level in 2017 used in the model was 6.5 m.
The current study generated the evapotranspiration rate by Thiessen polygons using daily potential evaporation data measured by four meteorological stations. These data were provided by the China Meteorological Data Sharing Service system and were based on the phreatic evaporation coefficient, which is decided by the characteristics of the vadose zone. The extinction depth of the entire modelled study area was set to 4 m [35]. Artificial discharge from the aquifers in the study area occurs through well pumping [35,36]. Data for GW exploitation were obtained from the hydrological bureau of each municipality in the study area and previous field research [35,36,37,38,39]. Although detailed information on the locations and depths of the wells was not available, the layers of exploitation were known.

4.2. Numerical Model

The GW flow model was developed using MODFLOW [40]. MODFLOW includes a set of stress packages that allows the simulation of external flow stresses, such as wells, areal recharge, evapotranspiration, drains, and rivers [41,42].
The simulation was divided horizontally into 100 rows and 100 columns with a cell size of 1.5 km × 1.5 km. The model was divided into three vertical layers based on the hydrogeological conditions and data on the porous aquifers at the study site. Layer 1 included the aquifer groups I and II, layer 3 represented aquifer group III, and layer 2 represented the aquitards. The simulation period extended from December 2016 to December 2017 due to data limitations. Each calendar month represented a stress period with constant source and sink terms. Contour maps for December 2016 were used as the initial head.
All sources and sinks were input using MODFLOW packages such as well (WEL), recharge (RCH), and evapotranspiration (EVT). Hydrogeological parameters such as the hydraulic conductivity, specific yield, and storage coefficient were imported by subarea [43].

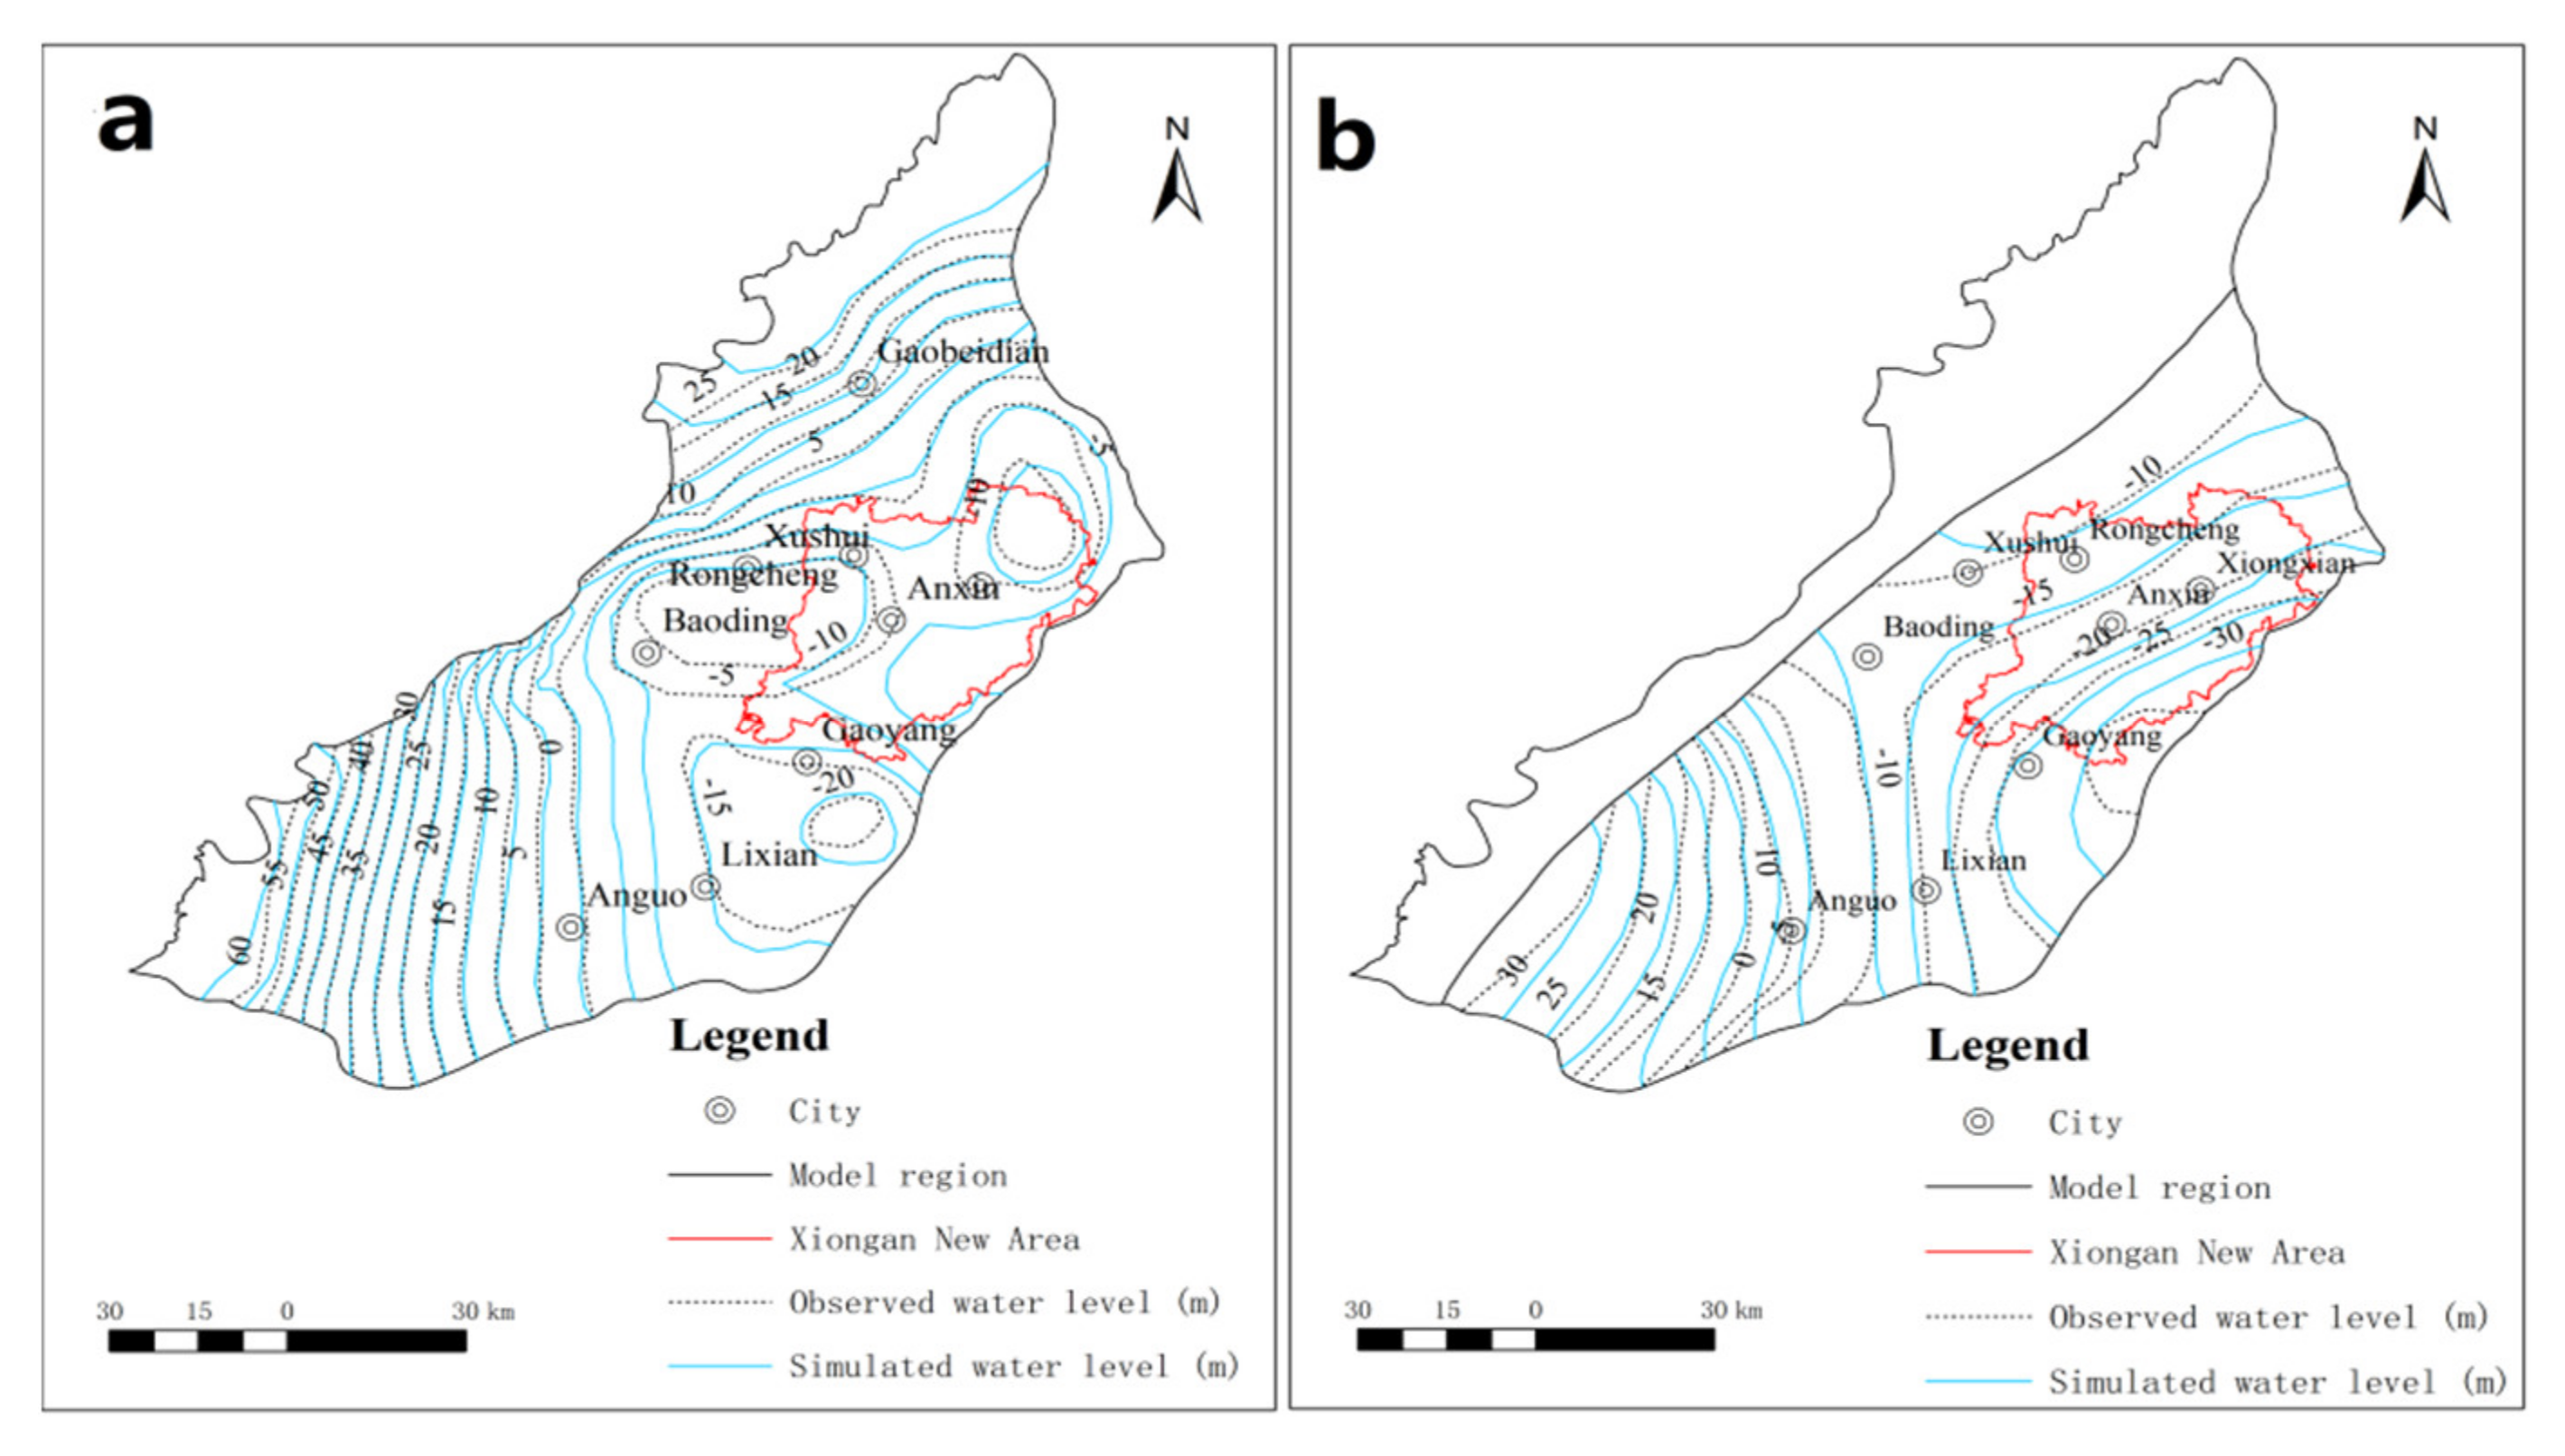
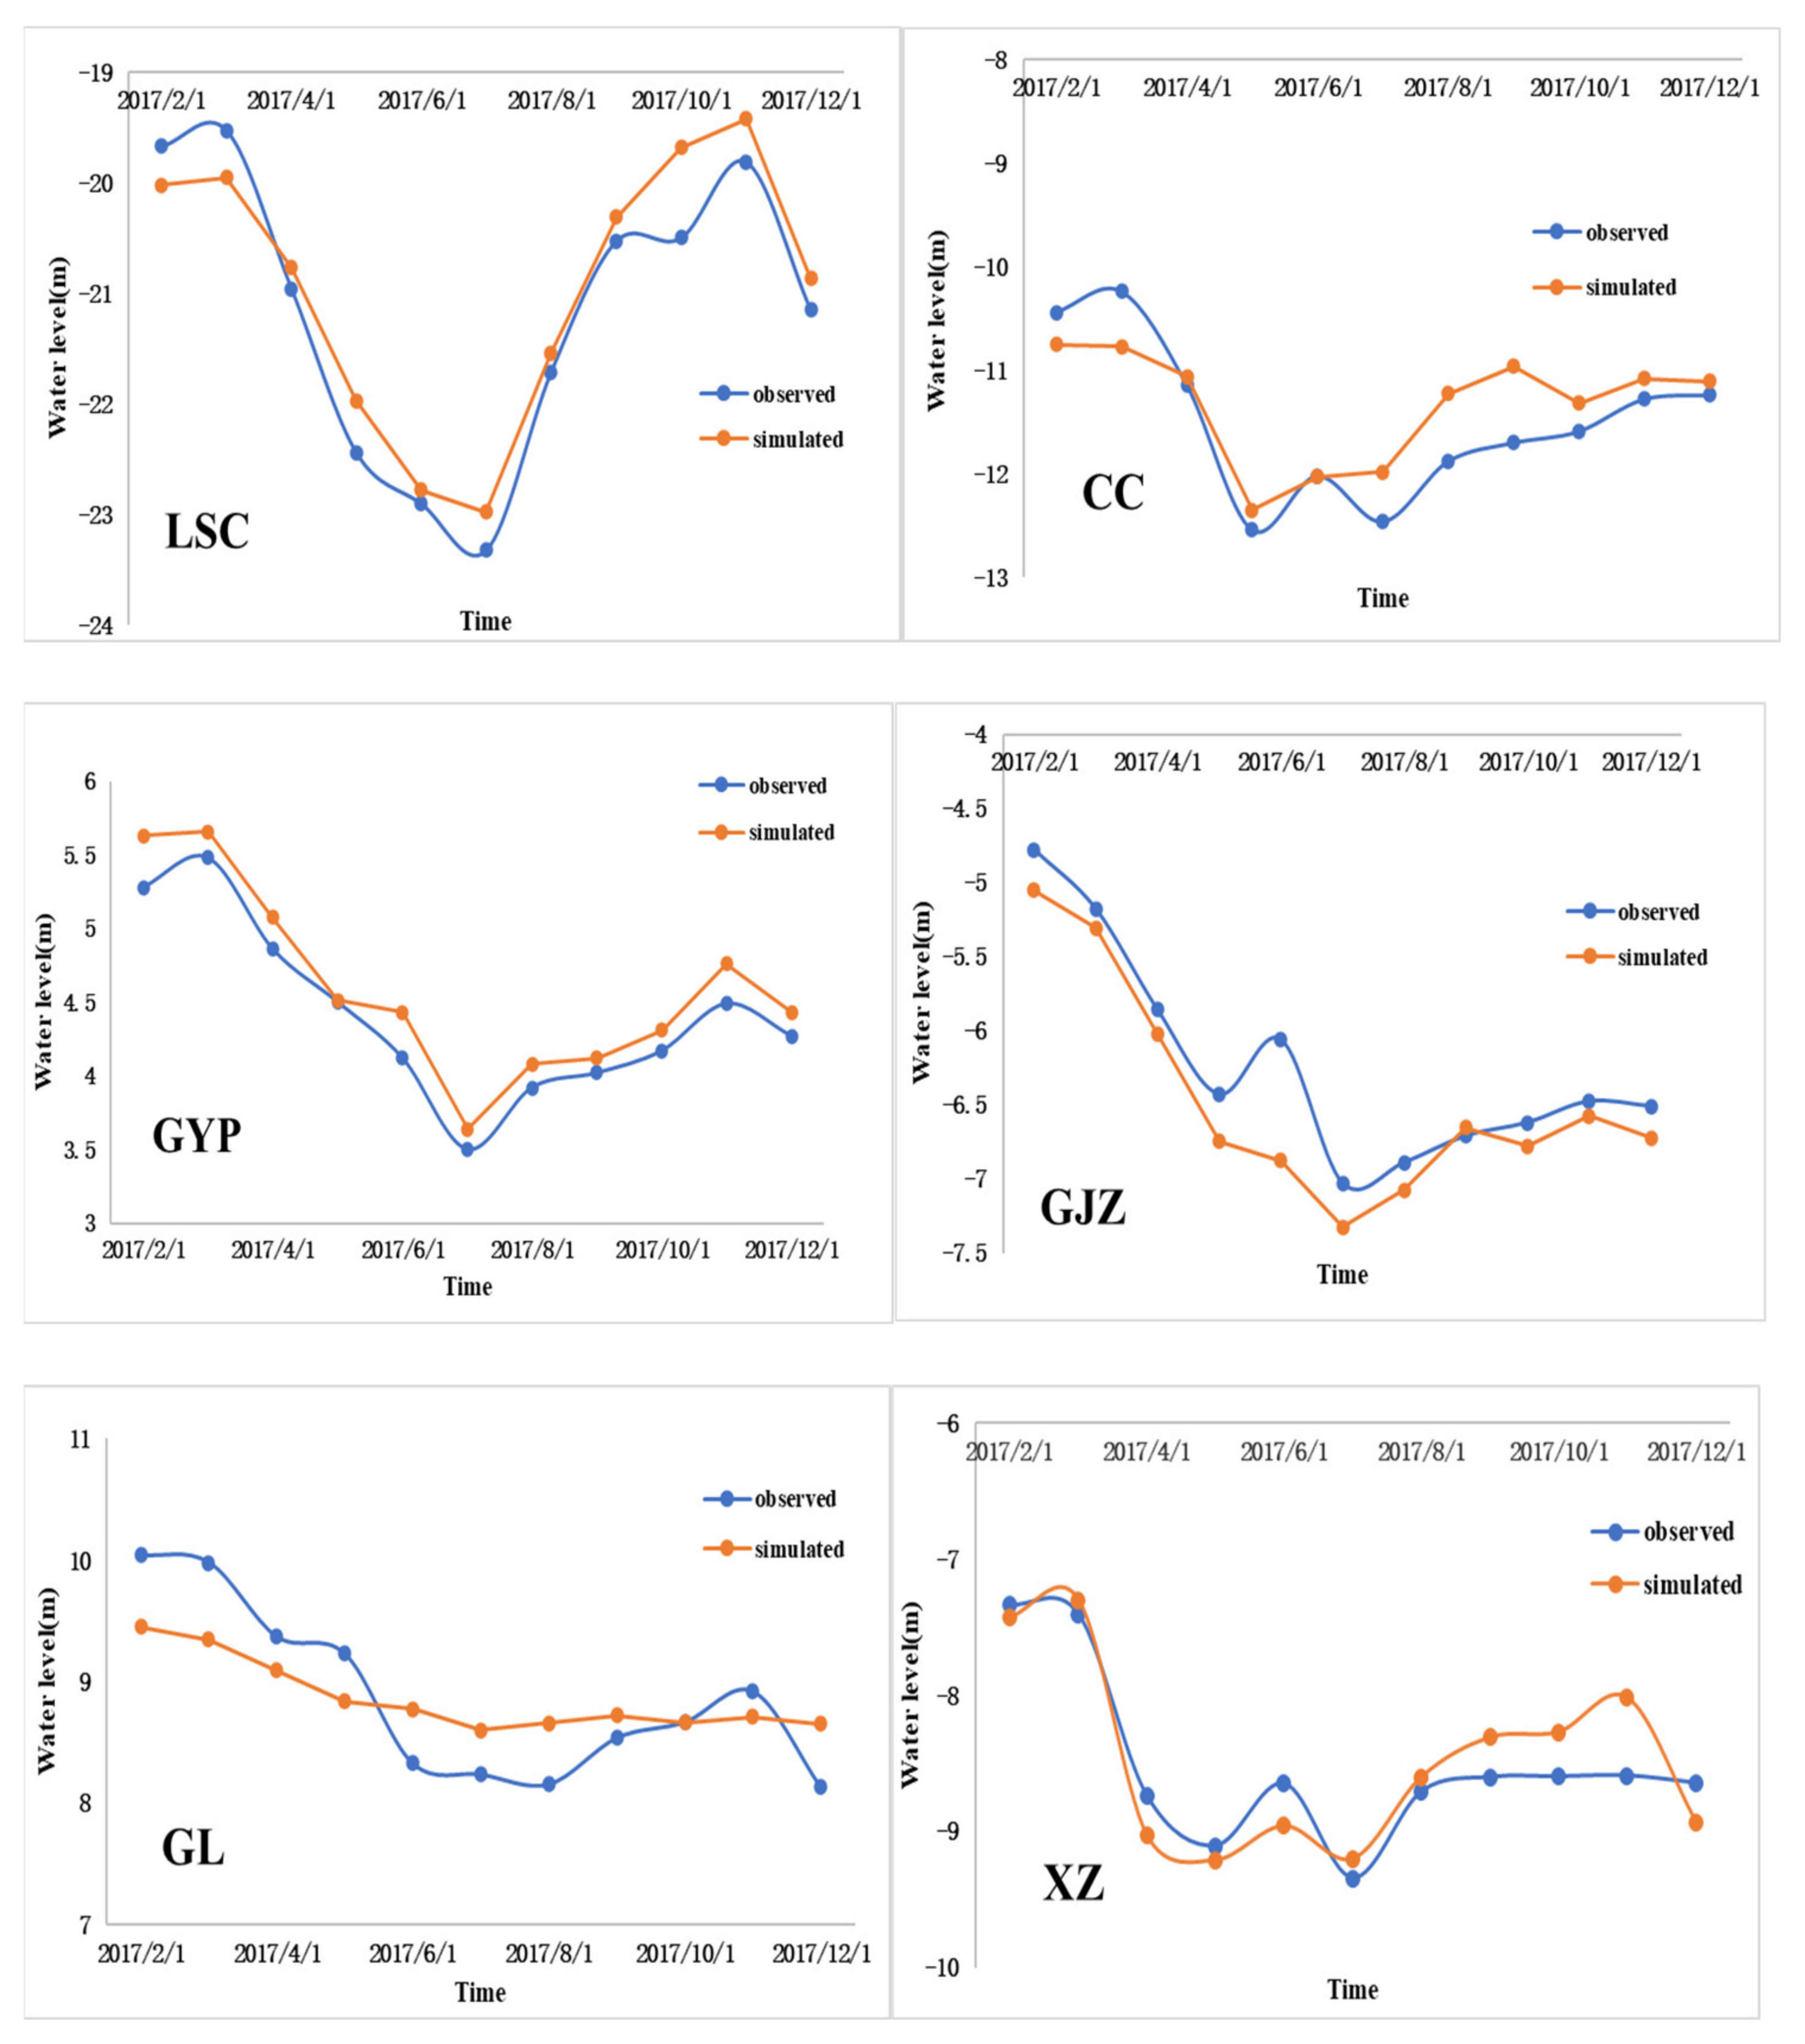
4.3. Model Calibration

The model calibration period extended from December 2016 to June 2017, whereas model validation extended from July 2017 to December 2017. The calibration process was divided into two parts: (1) fitting of the observed and simulated GW flow fields and (2) comparison between the observed and simulated hydrographs at typical observation wells [31]. The simulated flow fields were similar to the observed water level contours in 2017 for the shallow and deep aquifers (layers 1 and 3; Figure 1). A total of 45 observation wells were selected for comparison of the GW hydrographs. Figure 5 shows the goodness-of-fit between simulated and observed water levels at all monitoring wells. Figure 6 shows a comparison between the simulated and observed water levels for five observation. These results showed that the model simulations provided a good representation of the actual GW flow field and the features of the GW regime.
The model parameters, including hydraulic conductivity and storage parameters, were manually adjusted during the calibration. The variations in the parameters were consistent with the actual hydrogeological conditions in the model parameter zones, with hydraulic conductivities of 3–80 m/d for the shallow aquifers and 0.5–15 m/d for the deep aquifers (Figure 7; Table 1).
An equilibrium analysis of the transient GW flow model was used to compute the GW equilibrium in the Daqing River Basin from December 2016 to December 2017. The recharge value for the entire GW system was 1.858 billion m3 and the recharge–discharge shortfall was 1.008 billion m3. These results suggest that the GW discharge exceeded recharge for several years, resulting in the continuous reduction in GW storage.

5. Artificial Recharge Scenarios and the Response of the GW Level

The calibrated and verified model was used to investigate scenarios to predict and evaluate GW levels for the next 15 years (2021–2035). The present study only analyzed the shallow GW levels as this GW layer was the focus of the current study. The study area was in a significantly negative equilibrium state under the current conditions, which could be attributed to the local overexploitation of GW, resulting in the formation of several GW depression cones. The regional GW main recharge and discharge processes were precipitation recharge and artificial exploitation, accounting for 70% and 90% of total recharge and discharge, respectively. This result indicated the need to conduct artificial GW recharge through the use of river channels and recharge wells in the study area while also regulating GW exploitation. Under this approach, water consumed by exploitation can be counterbalanced by recharge to the aquifer. Four scenarios were developed based on these assumptions.

6. Scenarios

6.1. Scenario 1: River Recharge across the Entire Study Area

The action plan for comprehensive treatment of GW overexploitation in North China issued by the Ministry of Water Resources in January 2019 sets a target plan for future GW replenishment by major rivers. Therefore, the Zhulong, Tang, Baohe, and Nanjuma rivers will be recharged in the future. These rivers will become a major supply channel for GW resources and for surface water resources in Baiyangdian Lake. The comprehensive river recharge scheme under the pressure mining conditions in the study area is designed to provide each of the Nanjuma, Bao, Tang, and Zhulong rivers with 100 million m3/a of recharge water.

6.2. Scenario 2: River Recharge in the XNA

The average GW recharge for each river was set with reference to ecological water recharge and GW recharge in the implementation plan of the Ministry of Water Resources. The focus of the model prediction was on the GW recharge schemes for the Nanjuma and Baigou rivers flowing through the main GW level cone within the XNA. Since the water source of the middle route of the SNWDP mainly recharges the Nanjuma river, the Nanjuma River and Baigou Diversion River were designed to facilitate GW recharge of 40 million m3/a and 10 million m3/a, respectively on the basis of natural river infiltration.

6.3. Scenario 3: Well Recharge in the XNA

A number of recharge wells were set within 1 km of the Baigou Diversion River according to the regional GW flow field and GW level cone distribution characteristics. The water source of the middle route of the SNWDP was used to recharge the regional GW. The focus of the scenario was on the recovery of the GW table in the district depression cone in Xiongxian and Rongcheng. The evaluation of the regional suitability showed that natural infiltration near the Baigou Diversion River is poor. Therefore, the pressurized method was selected for injection of recharge water within the reinjection wells. Recharge water was injected into the phreatic aquifer. Artificial recharge of 50 million m3/a was implemented and single-well recharge of 5000 m3/d was required for a minimum of 27 recharge wells.

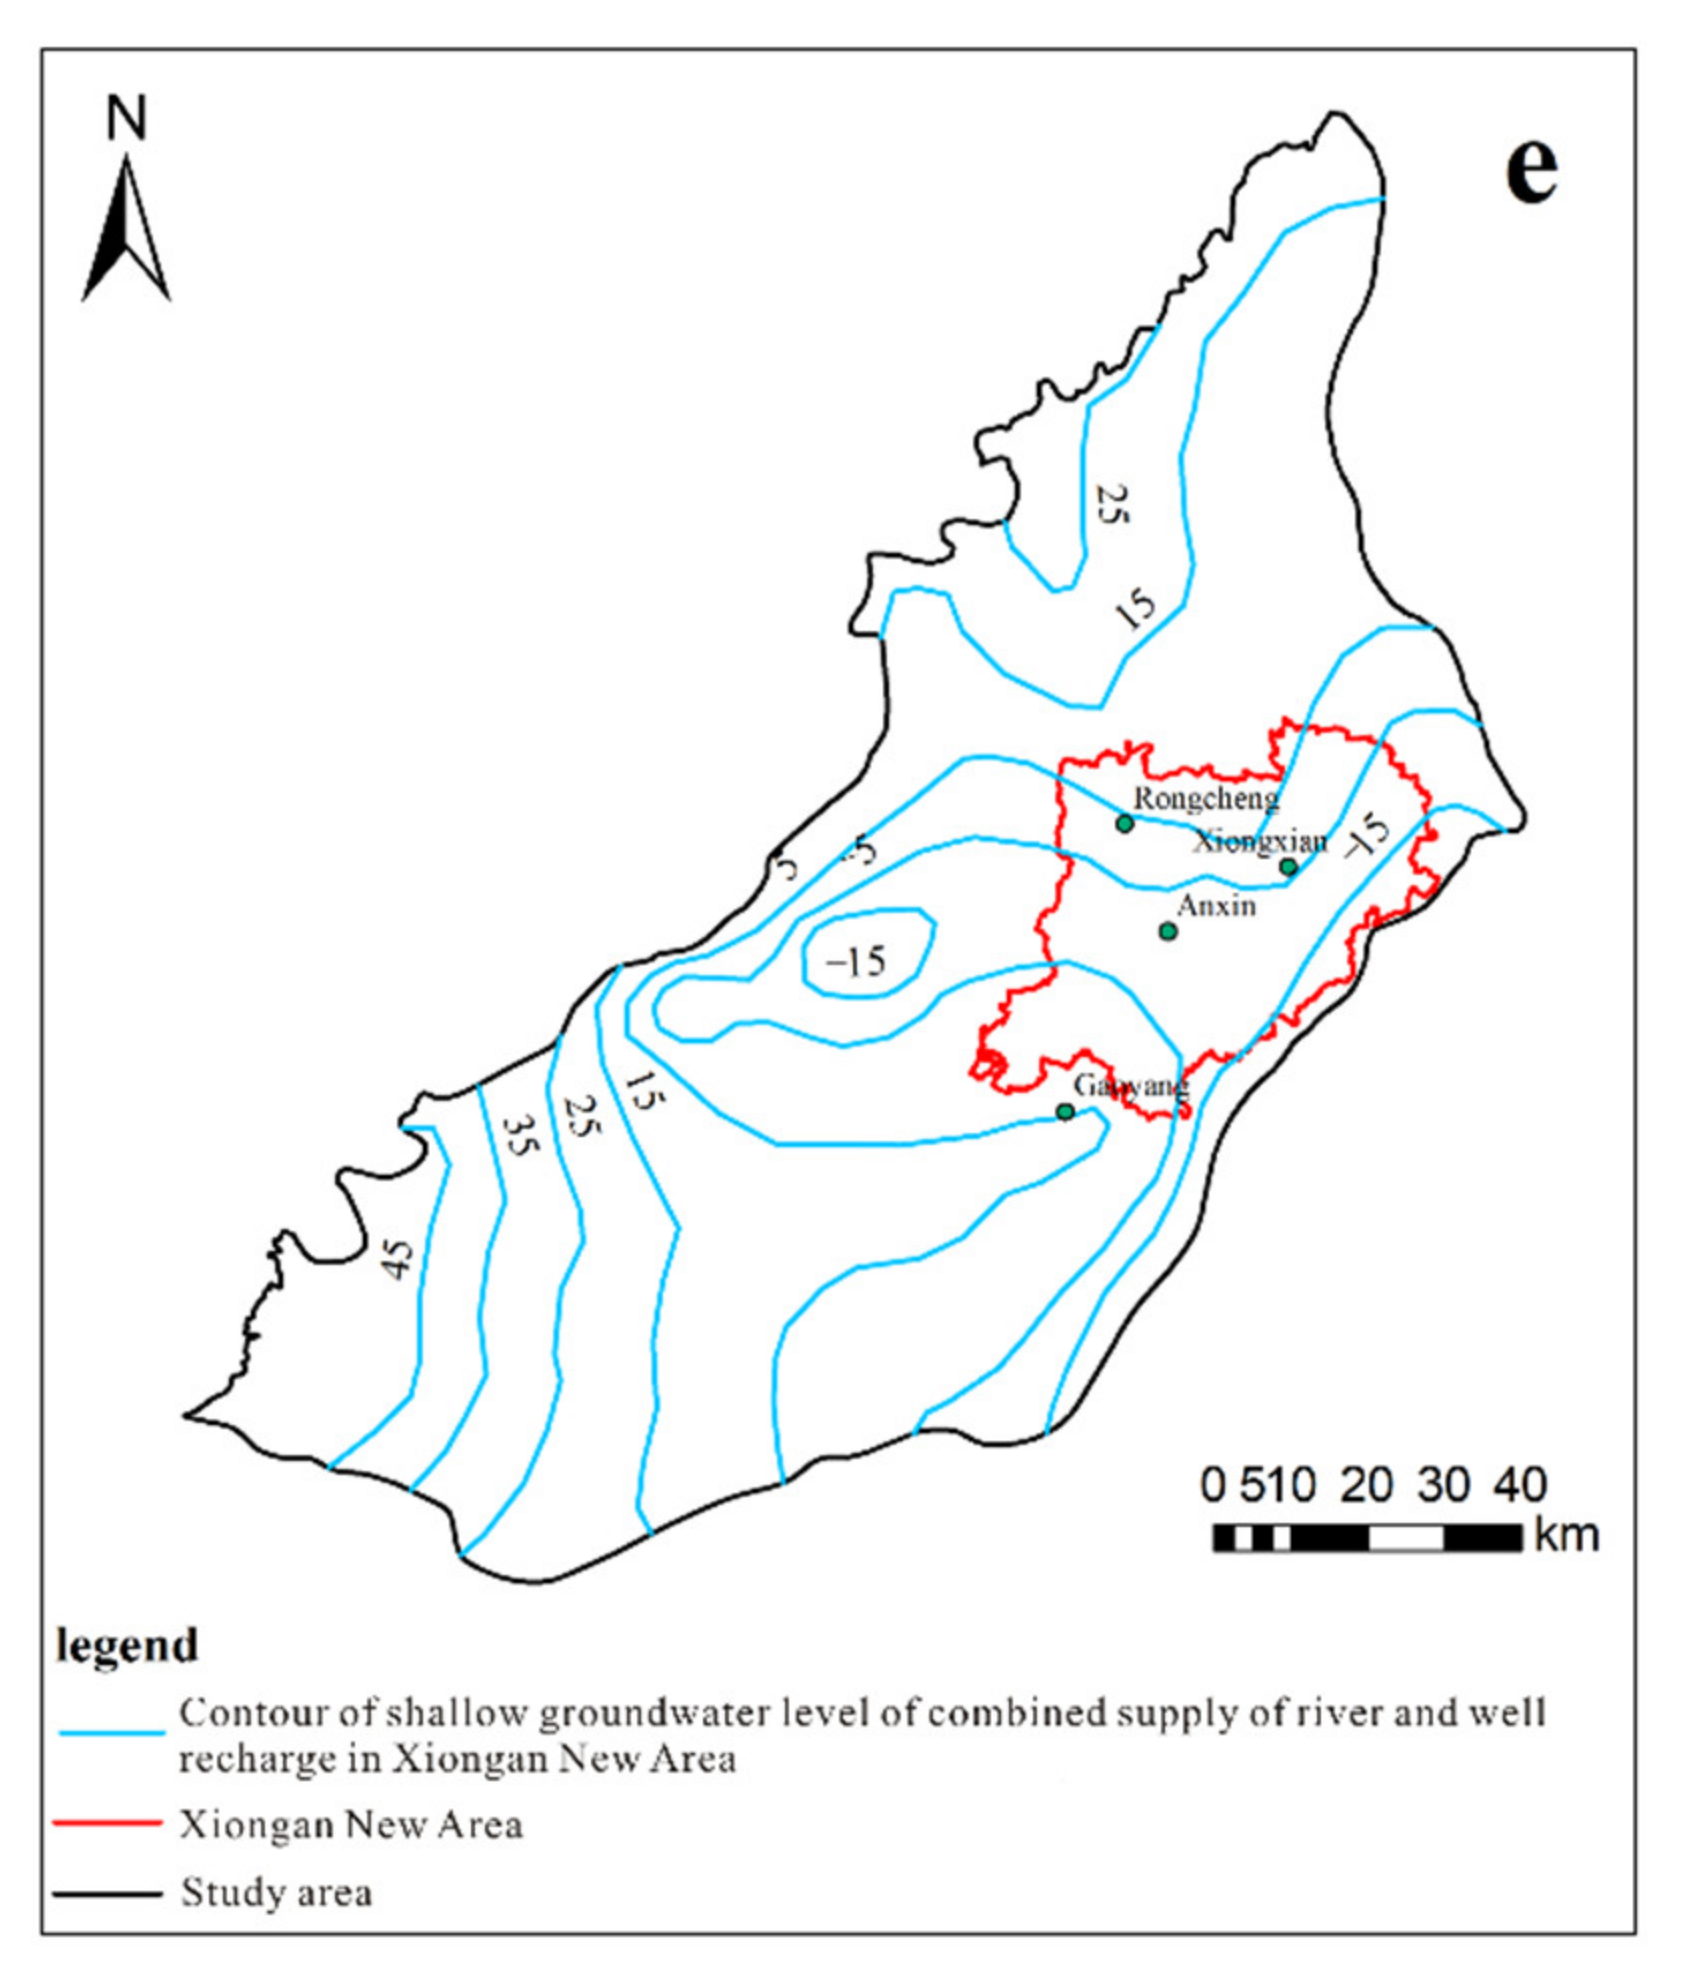
6.4. Scenario 4: Combined Supply of River and Well GW Recharge in the XNA

A combined supply of river and well recharge (river–well GW recharge) was established in the XNA according to the regional GW flow field and GW level cone distribution characteristics. A river recharge volume of 10 million m3/a and well recharge volume of 40 million m3/a were implemented. The pressurized method was used for artificial recharge at the recharge wells due to the poor natural infiltration near the Baigou Diversion River. The recharge water was injected into the phreatic aquifer. A single well recharge rate of 5000 m3/d was implemented and a minimum of 22 recharge wells were required.

7. Results and Discussion

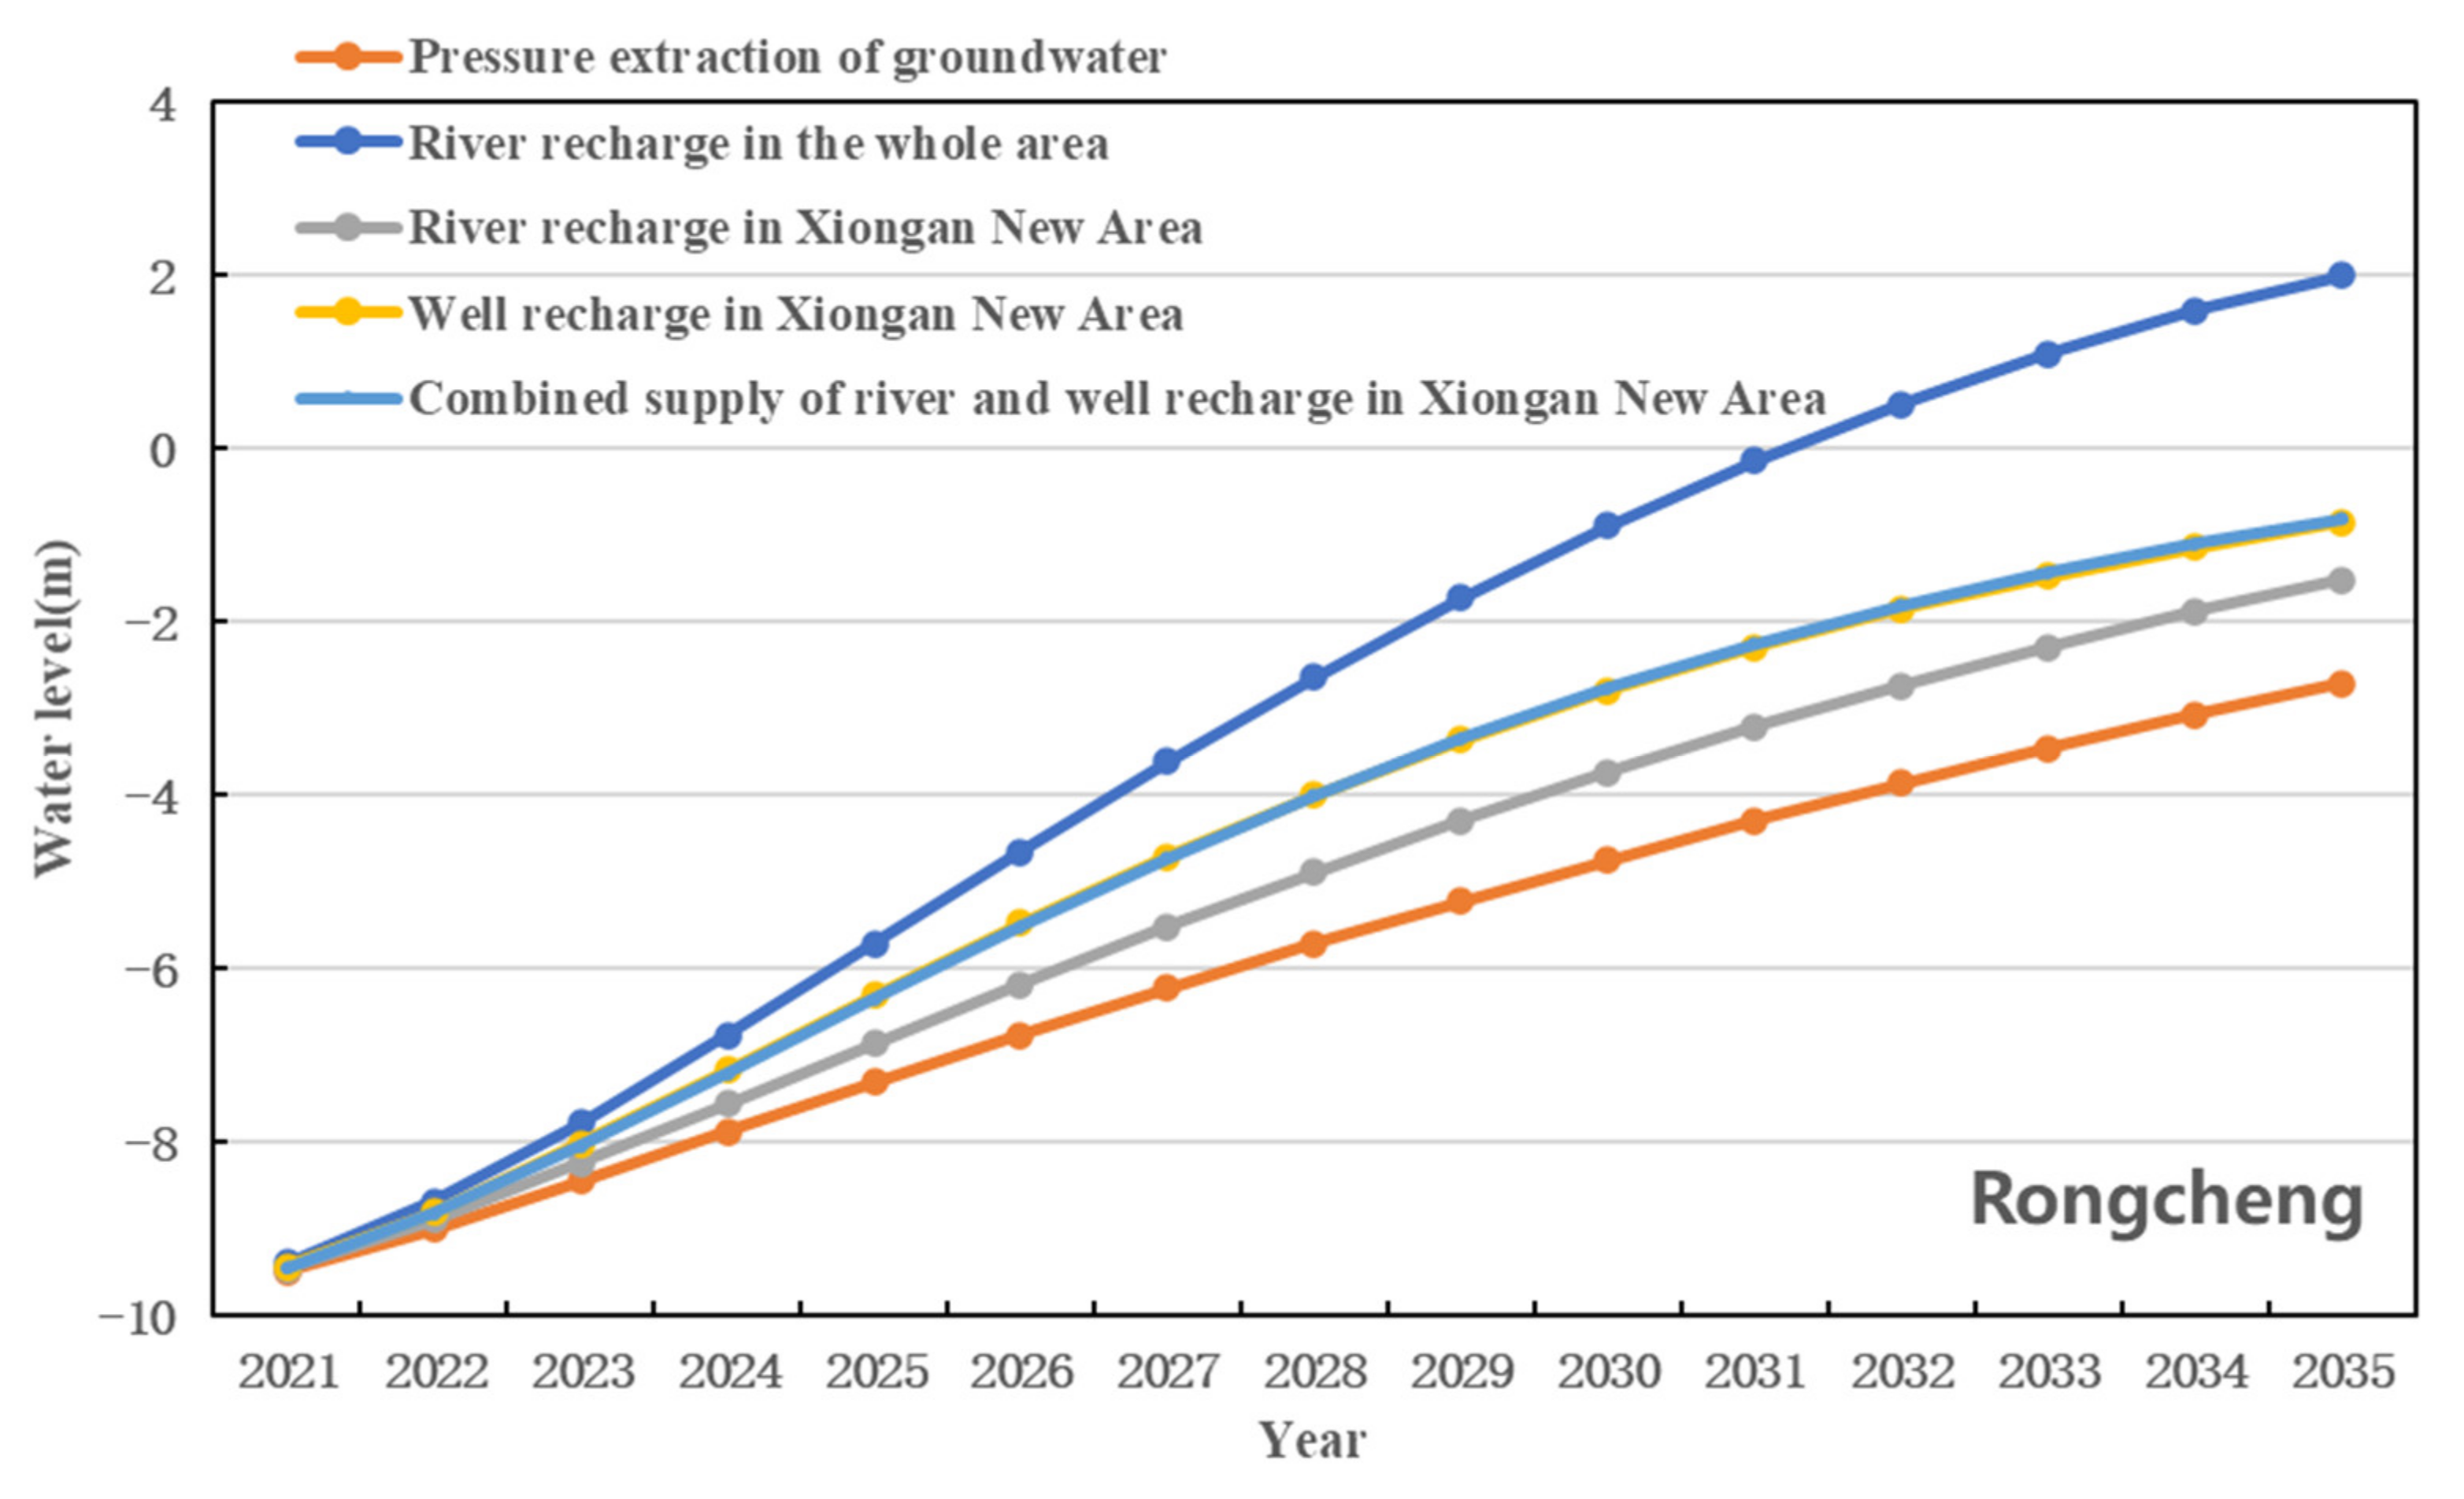
7.1. Changes in the GW Level

A comparison of the predicted flow field in 2035 under various recharge schemes with that for the same year under current conditions showed an upward trend in the GW flow field in the study area (Figure 8). The trend in the GW flow field was consistent across the Western Piedmont area, the flow field in the XNA showed obvious changes, the area of the depression cone decreased, and there was an obvious rise in the GW level of 20 m. The GW level in the Rongcheng depression cone area increased by 11 m whereas that in the Xiongxian depression cone area increased by 4 m. The downward trend in the GW flow field had a certain inhibitory effect. These results showed that the different recharge schemes adopted in the Baigou Diversion River and within 1 km of the river could effectively act to recharge the GW level of the depression cone area on the eastern and western sides of the river. The storage condition of aquifer is the key factor affecting the effect of groundwater recharge. The storage condition of the aquifer is characterized by two parts. One is that the target aquifer should have enough space to store recharge water, that is, the size of underground water storage space. The other is that the groundwater can be rapidly distributed in the whole water storage space without forming a groundwater mound after entering the aquifer, that is, the water transmitting ability of the aquifer.
The results showed that all the recharge schemes will result in a rise in the shallow GW level of the Rongcheng depression cone area, with the most obvious rise in the GW level under the pressure extraction of the GW scheme. Similar increases in the shallow groundwater levels were achieved under well GW recharge and river–well GW recharge schemes in the XNA. This result could be attributed to the ratio of the river–well GW recharge to well GW recharge being 1:4. Therefore, river GW recharge across the entire study area is helpful for facilitating the recovery of the GW level in the Rongcheng depression cone area.
The results showed that all the recharge schemes resulted in increases to the shallow GW level in the depression cone area of Xiongxian, among which well GW recharge had the largest effect followed by combined river–well GW recharge. This result showed that all the recharge schemes are helpful for the recovery of the GW level in the Xiongxian depression cone area.
A comparison of the GW level of the depression cone in 2035 under the current situation with that under various recharge schemes showed that pressure mining resulted in a significant rise in the water level in the cone area. The GW level in the depression cone area of Rongcheng increased significantly under river GW recharge across the entire area, with the GW level rising by 11 m (Figure 9). The well irrigation GW recharge plan in the XNA greatly increased the GW level in the depression cone area of Xiongxian, with a rise in the water level of 4 m (Figure 10).

7.2. Changes to Supply

Four artificial GW recharge schemes were implemented in the study area within the case of pressure extraction. The results showed that the regional GW resources entered a positive equilibrium state (Table 2). The relative changes in well GW recharge in the XNA, combined river–well GW recharge in the XNA, river GW recharge across the entire area, and river recharge in the XNA were 14.56%, 11.04%, −0.12%, and −3.18%, respectively. A comprehensive comparison of various recharge schemes from the perspective of the overall effect of artificial recharge on GW level and the increase in recharge showed that the well irrigation recharge scheme for the XNA was relatively reasonable.
The results indicated that the influence of the SNWDP helped to control the decrease in the GW levels. The results of the present study are consistent with those of other studies [1,44,45]. The present study can improve the understanding of the impact of the SNWDP on GW levels in the plain area of the Daqing River Basin. Beijing has less than 100 m3 per capita water resources within its administrative area, 1/20 of the national average, 1/80 of the global average, and far below the internationally recognized danger level of 1700 m3 and absolute scarcity of less than 500 m, the degree of groundwater depletion is similar to that in plain area of Daqing River Basin. Long et al. used physical based hydrological models to quantify the impact of SNWD in the context of the effects of climate extremes and water policies (e.g., reduction in irrigation pumpage) using physically based hydrologic modeling, and to project how these factors may influence GWS in the future. The results show that water diverted to Beijing reduced cumulative GW depletion by 3.6 km3, accounting for 40% of total GW storage recovery during 2006–2018. Increased precipitation contributes similar volumes to GW storage recovery of 2.7 km3 (30%) along with policies on reduced irrigation (2.8 km3, 30%) [14]. The conclusion is similar to that of this study.

8. Conclusions

A conceptual GW flow model was developed by analyzing the hydrogeological conditions in the Daqing River Basin. A three-dimensional transient numerical flow model was then developed using MODFLOW. The hydrogeologic parameters were identified and the model was calibrated by fitting the simulated GW flow field with the hydrographs of observation wells. The model was then used to simulate the response of the GW levels to different artificial recharge schemes. The GW levels were simulated and analyzed under four scenarios. When compared with the current situation, the GW level increased to a certain extent in 2035 after the implementation of four artificial recharge schemes. The order of the different recharge schemes according to the relative rate of change in GW was well GW recharge in the XNA (14.56%) > combined river and well GW recharge in the XNA (11.04%) > river GW recharge across the entire area (−0.12%) > river GW recharge in the XNA (−3.18%). A comprehensive comparison of various recharge schemes from the perspective of the overall effect of artificial recharge on the GW levels and the increase in recharge showed that the well GW recharge scheme for the XNA was relatively reasonable. Therefore, the implementation of artificial GW recharge can alleviate the environmental risk resulting from the continuous decline in the GW level in the plain area of the Daqing River Basin. This study provides a reference for the management and protection of aquifers in other areas suffering serious GW overexploitation.
The present study considered the impact of artificial recharge on GW under only one climate scenario. The interactions between climate change, multisource recharge, and socioeconomic activity for integration into a GW flow model requires further research.

Author Contributions

Conceptualization and methodology, G.C., X.S. and H.L.; investigation and analysis G.C., G.X., Y.Z., N.L.; data curation, G.X., N.L.; writing—original draft preparation, G.C., X.S. and H.L.; writing—review and editing, X.S., H.L. All authors have read and agreed to the published version of the manuscript.

Funding

This article was funded by the national key research and development project “Artificial recharge and storage of groundwater in Xiongan New Area (2018YFC0406503)”.

Institutional Review Board Statement

Not applicable.

Informed Consent Statement

Informed consent was obtained from all subjects involved in the study.

Data Availability Statement

Data sharing not applicable.

Conflicts of Interest

The authors declare no conflict of interest.

References

  1. Cao, G.; Zheng, C.; Scanlon, B.R.; Liu, J.; Li, W. Use of flow modeling to assess sustainability of groundwater resources in the North China Plain. Water Resour. Res. 2013, 49, 159–175. [Google Scholar] [CrossRef]
  2. Sophocleous, M. Interactions between groundwater and surface water: The state of the science. Hydrogeol. J. 2002, 10, 52–67. [Google Scholar] [CrossRef]
  3. Konikow, L.F.; Kendy, E. Groundwater depletion: A global problem. Hydrogeol. J. 2005, 13, 317–320. [Google Scholar] [CrossRef]
  4. Fogg, G.E.; LaBolle, E.M. Motivation of synthesis, with an example on groundwater quality sustainability. Water Resour. Res. 2006, 42, W03S05. [Google Scholar] [CrossRef]
  5. Konikow, L.F. Contribution of global groundwater depletion since 1900 to sea-level rise. Geophys. Res. Lett. 2011, 38, L17401. [Google Scholar] [CrossRef] [Green Version]
  6. Shah, T.; Molden, D.; Sakthivadivel, R.; Seckler, D. The Global Groundwater Situation: Overview of Opportunities and Challenges; International Water Management Institute: Colombo, Sri Lanka, 2000. [Google Scholar]
  7. Shah, T.; Roy, A.D.; Qureshi, A.S.; Wang, J. Sustaining Asia’s groundwater boom: An overview of issues and evidence. Nat. Resour. Forum 2003, 27, 130–141. [Google Scholar] [CrossRef] [Green Version]
  8. Wada, Y.; van Beek, L.P.H.; van Kempen, C.M.; Reckman, J.W.T.M.; Vasak, S.; Bierkens, M.F.P. Global depletion of groundwater resources. Geophys. Res. Lett. 2010, 37, L20402. [Google Scholar] [CrossRef] [Green Version]
  9. Alley, W.M.; Healy, R.W.; LaBaugh, J.W.; Reilly, T.E. Flow and storage in groundwater systems. Science 2002, 296, 1985–1990. [Google Scholar] [CrossRef] [Green Version]
  10. Zheng, C.; Liu, J.; Cao, G.; Kendy, E.; Wang, H.; Jia, Y. Can China cope with its water crisis? Perspectives from the North China Plain. Ground Water 2010, 48, 350–354. [Google Scholar] [CrossRef]
  11. Xia, J.; Zhang, Y.Y. Water Resource and Pollution Safeguard for Xiongan New Area Construction and Its Sustainable Development. Bull. Chin. Acad. Sci. 2017, 11, 31–37. [Google Scholar]
  12. Zhang, Y.W. Evaluation of Groundwater Artificial Recharge Suitability in Plain Area of Daqing River Basin Based on GIS—EWM; Jilin University: Changchun, China, 2020. [Google Scholar]
  13. Hao, Q.; Shao, J.; Zhen, X. A Study of the artificial adjustment of groundwater storage of the Yongding River alluvial fan in Beijing. Hydrogeol. Eng. Geol. 2012, 39, 12–18. [Google Scholar]
  14. Long, D.; Yang, W.T.; Scanlon, B.R. South-to-North Water Diversion stabilizing Beijing’s groundwater levels. Nat. Commun. 2020, 11, 3665. [Google Scholar] [CrossRef] [PubMed]
  15. Kinzelbach, W.; Bauer, P.; Siegfried, T.; Brunner, P. Sustainable groundwater management—Problems and scientific tool. Episodes 2003, 26, 279–284. [Google Scholar] [CrossRef]
  16. Welsh, W.D. Great Artesian Basin Transient Groundwater Model; Bureau of Rural Science, Fisheries and Forestry: Canberra, Australia, 2006. [Google Scholar]
  17. Zhang, X.; Xue, L.; Zhang, Q.; Li, J. Simulation of groundwater exploitation at early stage and analysis on water budget in Haihe River Basin. J. Arid Land Resour. Environ. 2008, 9, 102–107. [Google Scholar]
  18. Wang, S.; Shao, J.; Song, X.; Zhang, Y.; Huo, Z.; Zhou, X. Application of MODFLOW and geographic information system to groundwater flow simulation in North China Plain, China. Environ. Geol. 2008, 55, 1449–1462. [Google Scholar] [CrossRef]
  19. Cui, Y.; Wang, Y.; Shao, J.; Chi, Y.; Lin, L. Research on groundwater regulation and recovery in North China Plain after the implementation of south-to-north water transfer. Resour. Sci. 2009, 31, 382–387. [Google Scholar]
  20. Xue, L.; Li, W.; Yang, W.; Li, J.; Zhu, X. Numerical modelling on exploited shallow groundwater flow in the plain of Haihe river basin. Geotech. Invest. Surv. 2010, 3, 50–55. [Google Scholar]
  21. Liu, J.; Zheng, C.; Zheng, L.; Lei, Y. Ground water sustainability: Methodology and application to the North China Plain. Ground Water 2010, 46, 897–909. [Google Scholar] [CrossRef]
  22. Hu, Y.K.; Moiwo, J.P.; Yang, Y.H.; Han, S.M.; Yang, Y.M. Agricultural water-saving and sustainable groundwater management in Shijiazhuang Irrigation District, North China Plain. J. Hydrol. 2010, 393, 219–232. [Google Scholar] [CrossRef]
  23. Li, X.; Ye, S.Y.; Wei, A.H.; Zhou, P.P.; Wang, L.H. Modelling the response of shallow groundwater levels to combined climate and water-diversion scenarios in beijing-tianjin-hebei plain, China. Hydrogeol. J. 2017, 25, 1733–1744. [Google Scholar] [CrossRef]
  24. Foster, S.; Garduno, H.; Evans, R.; Olson, D.; Tian, Y.; Zhang, W.; Han, Z. Quaternary Aquifer of the North China Plain: Assessing and achieving groundwater resource sustainability. Hydrogeol. J. 2004, 12, 81–93. [Google Scholar] [CrossRef]
  25. Qin, H.; Cao, G.; Kristensen, M.; Refsgaard, J.C.; Rasmussen, M.O.; He, X.; Liu, J.; Shu, Y.; Zheng, C. Integrated hydrological modeling of the North China Plain and implications for sustainable water management. Hydrol. Earth Syst. Sci. 2013, 17, 3759–3778. [Google Scholar] [CrossRef] [Green Version]
  26. Shen, H.; Leblanc, M.; Tweed, S.; Liu, W. Groundwater depletion in the Hai River basin, China, from in situ and GRACE observations. Hydrol. Sci. J. 2015, 60, 671–687. [Google Scholar] [CrossRef] [Green Version]
  27. Chen, W. Groundwater in Hebei Province; Earthquake Publishing House: Beijing, China, 1999. [Google Scholar]
  28. Yue, J.T. Research on Water Resources Allocation at the Intake Area in Hebei Province of Central Line Project of the South-to-North Water Diversion; Donghua University: Shanghai, China, 2016. [Google Scholar]
  29. Meng, S.; Fei, Y.; Zhang, Z.; Lei, T.; Qian, Y.; Li, Y. Research on spatial and temporal distribution of the precipitation infiltration amount over the past 50 years in North China Plain. Adv. Earth Sci. 2013, 28, 923–929. [Google Scholar]
  30. Kendy, E.; Zhang, Y.; Liu, C.; Wang, J.; Steenhuis, T. Groundwater recharge from irrigated cropland in the North China Plain: Case study of Luancheng County, Hebei Province, 1949–2000. Hydrol. Process 2006, 18, 2289–2302. [Google Scholar] [CrossRef]
  31. Shao, J.; Li, L.; Cui, Y.; Zhang, Z. Groundwater flow simulation and its application in groundwater resource evaluation in the North China Plain, China. Acta Geol. Sin. 2013, 87, 243–253. [Google Scholar]
  32. Chung, I.; Kim, N.; Lee, J.; Sophocleous, M. Assessing distributed groundwater recharge rate using integrated surface water–groundwatermodelling: Application to Mihocheon watershed, South Korea. Hydrogeol. J. 2010, 18, 1253–1264. [Google Scholar] [CrossRef]
  33. Zhang, Y.; Li, G. Long-term evolution of cones of depression in shallow aquifers in the North China Plain. Water 2013, 5, 677–697. [Google Scholar] [CrossRef] [Green Version]
  34. Zhang, X.; Pei, D.; Hu, C. Conserving groundwater for irrigation in the North China Plain. Irrigation Sci. 2003, 21, 159–166. [Google Scholar] [CrossRef]
  35. Zhang, Z.; Fei, Y.H.; Chen, Z.Y. Investigation and Assessment of Sustainable Utilization of Groundwater Resources in the North China Plain; Geological Publishing House: Beijing, China, 2009. [Google Scholar]
  36. Fei, Y. Evolution and Conservation of Groundwater in Hebei Plain to the South of Beijing and Tjianjin; Hohai University: Nanjing, China, 2006. [Google Scholar]
  37. Xu, X. A study of Numerical Simulation for Groundwater Flow in the Beijing Plain, China; University of Geosciences: Beijing, China, 2006. [Google Scholar]
  38. Yang, Y.; Li, X.; Wang, L.; Li, C.; Liu, Z. Characteristics of the groundwater level regime and effect factors in the plain region of Tianjin City. Geolog. Surv. Res. 2011, 34, 313–320. [Google Scholar]
  39. Zhang, Z.; Shen, Z.; Xue, Y. Groundwater Environment Evolution in the North China Plain; Geological Publishing House: Beijing, China, 2000. [Google Scholar]
  40. McDonald, M.G.; Harbaugh, A.W. A Modular Three-Dimensional Finite Difference Ground-Water Flow Model; US Geological Survey: Reston, VA, USA, 1984. [Google Scholar]
  41. Harbaugh, A.W. The US Geological Survey Modular Ground-Water Model: The Ground-Water Flow Process; US Geological Survey: Reston, VA, USA, 2005. [Google Scholar]
  42. Harbaugh, A.W.; Banta, E.R.; Hill, M.C.; McDonald, M.G. The US Geological Survey Modular Ground-Water Model: User Guide to Modularization Concepts and the Ground-Water Flow Process; US Geological Survey: Reston, VA, USA, 2000. [Google Scholar]
  43. Zhang, Z.; Fei, Y. Atlas of Sustainable Utilization of Groundwater Resources in the North China Plain; SinoMaps Press: Beijing, China, 2009. [Google Scholar]
  44. Zhang, Y.; Li, G. Influence of south-to-north water diversion on major cones of depression in North China Plain. Environ. Earth Sci. 2014, 71, 3845–3853. [Google Scholar] [CrossRef]
  45. Chen, H.R.; Gao, Z.Y.; Wang, S.L. Modeling on impacts of climate change and human activities variability on the shallow groundwater level using MODFLOW. J. Hydraulic. Eng. 2012, 43, 344–363. [Google Scholar]
Figure 1. Location and model boundaries of the plain area of the Daqing River Basin, China.
Sustainability 13 05626 g001
Figure 2. Hydrogeological cross section of the plain area of the Daqing River Basin, China. “I”, “II”, “III”, and “IV” represent different aquifer groups.
Sustainability 13 05626 g002
Figure 3. Variations in groundwater level in the plain area of the Daqing River Basin, China from 1982 to 2015.
Sustainability 13 05626 g003
Figure 4. Variations in the groundwater level in the plain area of the Daqing River Basin, China from 2015 to 2020.
Sustainability 13 05626 g004
Figure 5. Fitting of simulated and observed groundwater flow fields in the plain area of the Daqing River Basin, China in 2017. (a) Shallow aquifer; (b) deep aquifer.
Sustainability 13 05626 g005
Figure 6. Observed vs. simulated hydrographs at typical observation wells in the plain area of the Daqing River Basin, China. LSC, CC, GYP, GJZ, GL, and XZ are the names of observation wells.
Sustainability 13 05626 g006
Figure 7. Division of hydrogeological parameters in the plain area of the Daqing River Basin, China. (a) Shallow aquifer and (b) deep aquifer, the numbers represent different hydrogeological parameter zones.
Sustainability 13 05626 g007
Figure 8. Comparison between current groundwater conditions with the shallow groundwater level contour after artificial groundwater recharge in the plain area of the Daqing River Basin, China. (a) Current situation; (b) river recharge implemented across the whole area; (c) river recharge implemented in the Xiongan New Area (XNA); (d) well recharge in the XNA; (e) combined river and well GW recharge in the XNA.
Sustainability 13 05626 g008aSustainability 13 05626 g008b
Figure 9. Changes to the shallow groundwater level in the Rongcheng depression cone area in the plain area of the Daqing River Basin, China.
Sustainability 13 05626 g009
Figure 10. Changes to the shallow groundwater level in the Xiongxian depression cone area in the plain area of the Daqing River Basin, China.
Sustainability 13 05626 g010
Table 1. Summary of model parameters of aquifers in the model representing the plain area of the Daqing River Basin, China.
Model LayerParameters
Hydraulic Conductivity (m/d)Storage ParametersInfiltration Coefficient of PrecipitationInfiltration Coefficient of IrrigationExtinction Depth (m)
13–800.02–0.150.18–0.250.1154
30.5–1510−4–10−6---
Note: Specific yield (Sy) for layer 1; specific storage (Ss) for layers 3; layers 2 represents an aquitard
Table 2. Comparison of the effect on groundwater recharge of different groundwater recharge schemes for shallow groundwater in the Xiongan New Area (XNA) in the plain area of the Daqing River Basin, China (106 m3).
TimeSource-Sink TermCurrent SituationPressure Extraction of GroundwaterArtificial Recharge under a Reduction in Groundwater Exploitation
River GW across the Entire AreaRiver GW RechargeWell GW RechargeCombined River and Well GW Recharge
2035aRechargePrecipitation infiltration114.46114.46114.46114.46114.46114.46
Lateral inflow29.7722.5623.2121.0918.3318.39
Irrigation infiltration19.9219.9219.9219.9219.9219.92
River infiltration26.6526.6538.9333.1026.6527.81
Infiltration of Baiyangdian Lake31.8226.9925.8426.9626.4026.44
Well irrigation 000049.2840.15
total222.62210.58222.36215.53255.03247.18
Rate of change from the current situation0−5.41%−0.12%−3.18%14.56%11.04%
DischargeArtificial exploitation227.00158.90158.90158.90158.90158.90
Lateral outflow34.7625.3120.8426.1731.5431.40
Evaporation0044.2418.1756.8049.37
Total261.76184.21223.98203.24247.24239.67
Rate of change from the current situation0−29.63%−14.43%−22.36%−5.54%−8.44%
Storage variation11.1558.7066.5960.8957.7857.93
Publisher’s Note: MDPI stays neutral with regard to jurisdictional claims in published maps and institutional affiliations.

