Article

The Study of AR-Based Learning for Natural Science Inquiry Activities in Taiwan’s Elementary School from the Perspective of Sustainable Development

1
Department of Applied Informatics, Fo-Guang University, Yilan County 26247, Taiwan
2
Cisian Elementary School, Yuanshan Township, Yilan County 264012, Taiwan
*
Author to whom correspondence should be addressed.
Sustainability 2021, 13(11), 6283; https://doi.org/10.3390/su13116283
Submission received: 31 March 2021 / Revised: 22 May 2021 / Accepted: 29 May 2021 / Published: 2 June 2021

Abstract

:
Experiential activities are the most direct form of ecological teaching, so outdoor education is an important way of learning. Through direct observation and life experience, students will learn about the ecological environment, understand the importance of the ecological environment, raise their awareness of environmental protection, and put into practice the protection of the ecological environment. This study involved plant teaching activities that incorporated school plant learning paths into environmental education, so that students could learn about flora, experience nature, and take care of the environment. We created an augmented reality application for use in schools that takes the user on an ecological tour of the plants in the diet of butterflies. The application formed the localized and special mobile learning content in a school. Students were allowed to walk out of the classroom and use their mobile device to engage in autonomous learning, and we then determined their acceptance of the augmented reality application. Through this application we were able to tell whether students were able to adapt to learning with technology combined with traditional teaching methods. This application was tested on a group of elementary school students, who were then interviewed using quantitative and qualitative research methods to understand the users’ feedback.

1. Introduction

1.1. Research Background and Motivation

The concept of sustainable development was first coined by ecologists in reference to the balance between natural ecology and its level of exploitation to arrive at ecological sustainability. However, the growth of industrial and economic development in recent years has led to increasingly serious global crises such as the greenhouse effect and ozone depletion, threatening the ecology of the earth [1]. In 1972, the United Nations Conference on the Human and Environment issued the “Stockholm Declaration” [2], which drew human attention to environmental issues and led to concern and research on environmental education. In 1987, the World Commission on Environment and Development (WCED) released “Our Common Future” [3]. Agenda 21 [4], adopted by the United Nations Earth Summit in 1992, emphasizes the importance of education as a means of building the concept of sustainable development, incorporating it into the education system at all levels, enhancing the skills of people in solving social and environmental problems and heightening environmental awareness through education, from the basic education level to the adult education level. Both environmental protection and sustainability require education for people to foster the right attitudes and take the right actions. It is also incumbent upon the international community to make environmental education an essential part of global citizenship and action [5,6,7,8].
Today, however, most children grow up in urban areas and lack opportunities to interact with, observe and care for their environment, and to have a deep sense of its changes. Exposure to the natural environment during childhood can inspire an emotional attachment to nature and help build environmental awareness and sensitivity to shape future environmental actions. Only when a person can feel and care for the environment around him, and develop a sense of concern for the land and environmental identity, can he become a responsible environmental citizen. It is all the more important to educate our children on how to become responsible environmental citizens in the future [9,10,11,12]. There are two ways in which environmental education can be integrated into school teaching. One is the single-subject interdisciplinary integrated environmental curriculum [7,8], in which materials related to the environment are extracted from various fields of study and combined into a complete curriculum. The other is the multi-subject integrated environmental curriculum [8], which incorporates appropriate environmental themes or components into existing curricula in various areas. Taiwan in 2003 established environmental education as one of the Grade 1–9 Curriculum themes, and developed a curriculum and operational guidelines to fully demonstrate the spirit and content of environmental education [13,14,15]. As for children, growing up is the focus of their lives and interacting with their surroundings is a fundamental skill that they gradually learn to adapt to society. As environmental education is one of the six major topics in the Grade 1–9 Curriculum and is therefore integrated into all learning areas, this study adopts a multi-subject integration approach and focuses on incorporating environmental education into the field of science and technology.

1.2. Research Purpose

Most of the educational grants in Taiwan are distributed to urban students and aboriginal students. Small rural schools that do not serve either of these groups have limited educational resources. Consequently, characteristic localized courses that reduce the rural–urban gap cannot be developed. Teaching in rural schools is limited by a lack of computer hardware and teachers with less satisfactory professionalism and teaching ability. Rural students thus do not have the opportunity to fulfil the ideal educational goals or commonly use information technology. The aforementioned findings indicate the trend and expectation of educational reform in Taiwan. Accordingly, this project was conducted in a primary school in a rural area of Taiwan by walking out of the classroom and using mobile devices to engage in autonomous learning. The purpose of the project was to use the phenomenon of augmented reality (AR) to facilitate experiential learning in line with the environmental education curriculum. Therefore, this study aimed to use interactive AR in mobile learning devices that are lightweight and easy to use, supporting learning materials for understanding school plants and helping teachers meet the requirements of the primary school curriculum. The objectives of this part of the project were to assess the ways in which the AR devices are used by teachers and learners, and how and whether their use expands the effect and meaning the devices have on learning about the environment, and their attitudes towards learning about the environment. Thus, this study was conducted to respond to the following two questions:
  • How to develop an outdoor learning guide application that allows students to learn about the campus trees?
  • Which factors will affect students’ intention to use the proposed AR-based application?
The rest of this paper is organized as follows: Section 2 describes the literature review of the study. The research model and hypotheses are proposed in Section 3. Section 4 discusses research methodology. Section 5 discusses the results obtained. Finally, Section 6 contains the conclusions.

2. Literature Review

2.1. Augmented Reality Technology

Augmented reality, known as AR, refers to the projection of virtual information, such as images, texts, video, and sounds, on the display through which user receives the information visually, i.e., overlapping virtual information onto the user’s viewing device through which the user experiences the real world. It is a concept between the real environment and the virtual environment. Milgram et al. [16] regarded the real environment and virtual environment as a closed continuum as depicted in Figure 1. Towards the virtual end of the spectrum, it is called the augmented virtuality (AV) and mixed reality (MR) falls between the two. In the figure, the far left is a purely real environment, and the far right a purely virtual environment; everything in between is mixed reality, in which both real and virtual objects are present. The position of a user interface in this closed set is determined by the number of computer-generated elements in the user environment. Moreover, the far left represents a user interface entirely in the real physical world, whereas the far right represents a virtual environment entirely generated by computer. Between the extremes are AR, which refers to a real world augmented by virtual items, and augmented virtuality, which refers to an immersive virtual environment with elements from the real world.
In addition, Azuma [17] defined AR as an environment containing both virtual and real-world elements, and this definition is widely accepted by academics. By this definition, AR encompasses real and virtual items, real-time interaction, and a three-dimensional environment. By contrast, because VR fully immerses users in a computer-generated virtual environment, users cannot see the real environment around them. AR has been applied for guided tours of museums, outdoor tourist attractions, and school campuses, enabling users to instantaneously acquire information regarding an educational or tourist venue. An image generated from AR requires the support of image recognition technology to integrate real and virtual objects. That is, the augmented content must be seamlessly superimposed on a real object so that the object can be vividly simulated on the display of a device. Thus, the AR application was designed to enable users to enjoy the fun of image scanning and recognition and thus afford them a unique visual experience and access to in-depth multimedia resources relating to the items on display.

2.2. M-Learning and U-Learning

The rapid development of Internet technology and mobile devices has had a significant impact on the practical application of teaching. With the aid of Internet technology and mobile devices, students can access more information about the learning environment for their learning activities. Mobile learning, also known as M-learning, refers to the acquisition of knowledge through the use of mobile devices [18,19]. Usually, mobile devices are characterized by their high mobility, e.g., lightweight smartphones. Such a learning approach not only extends the learning space beyond the classroom, creating a meaningful learning experience, but also allows for appropriate adjustments according to the level of students, greatly enhancing learners’ motivation [19]. M-learning, however, is often limited by the size of the device and therefore provides only memorable narrative knowledge [20]. Ubiquitous learning, also known as U-learning, overcomes its shortcomings by using environmental awareness technology to guide students through the real world and help learners finish their learning activities [21,22]. M-learning and U-learning is applied to a wide range of fields and learners of all ages, and is even treated as a form of lifelong learning. In such an emerging learning environment, learners are not constrained by time and space; they can access relevant resources and uninterrupted learning services at any time and any place, as long as they are interested in learning, with personalized learning guidance and learning content also available. Mobile technology has created a learning environment rich in learning resources and has facilitated the exchange of information and learning interactions in the learning process, thereby boosting learners’ learning efficiency and achieving the goals of self-learning and self-examination.
U-learning requires good learning strategies and mobile information technology to enable learners to learn everywhere, and it is only through authentic learning that knowledge can be constructed and learned in a practical way. For learners, learning about nature and ecology is about living on the ground, caring for, and understanding one’s hometown and land from the perspective of one’s own community and school, so that learning can be integrated with life and activities can be closely linked to the environment. From the learner’s point of view, the real-life contextual activities range from basic memorization, to the analysis, application and synthesis of knowledge, to the assessment of learning, all within a contextual context. By placing ecological teaching in life, learning can take place anytime and anywhere, and by using mobile devices to deliver the required language information to learners in an appropriate manner, learners can quickly respond to the context of life and secure solutions to their problems. To sum up, this study utilized wireless Internet technology to introduce the concept of U-learning into the teaching of the outdoor ecological environment in primary schools to facilitate students’ learning and enhance their awareness of and interest in the ecological environment. Through this study and the use of information technology, the ubiquitous environment was applied to practical teaching strategies, offering a different option and approach to teaching in the future. M-learning capitalizes on the high mobility of mobile devices and can be integrated into multimedia platforms to provide a geographically unconstrained U-learning experience. M-learning has its place in both the teaching of teachers and the independent learning of students, and is particularly suitable for the application of M-learning digital materials in teaching activities because of the diverse and interactive nature of mobile learning aids, which can enrich students’ learning, and the portability and high mobility can remove the constraints of traditional classrooms. Therefore, the M-learning digital materials are combined with curriculum activities to extend the diversity of teaching and learning in order to improve learners’ learning attitude and revitalize teaching and learning.

2.3. Augmented Reality-Based Learning

With the advent of mobile devices and the maturity of AR technology in recent years, new opportunities have opened up for the development of technology education [23,24]. Through the combination of mobile tour applications and augmented reality (AR) technology, smart devices such as tablets and smartphones can make learning more interesting and enable more diverse interaction modes. Learners interact directly between real environments and virtual objects, allowing users to manipulate virtual information intuitively, which not only reinforces the immersion of the learner, but also helps students to immerse themselves in the learning content, making it easy for users with little experience in computer use to learn. Students can also learn through the 3D perspective in AR, visualizing abstract things and enhancing the learning of cognitive content and procedural operations. By combining virtual digital information, text, images, and other data in a real environment, AR is a real-time interactive tool that can help complement information lacking in the physical environment and assist learners in learning abstract concepts and constructing knowledge [16]. Recent research in the field of AR-assisted science has been widely applied to astronomy [25,26], mathematics [27], science [28], STEM education [29], and environmental education [30,31,32,33]. In particular, Tarng et al. [30] developed the Augmented Reality Butterfly Ecological Learning System (ARBELS) using AR technology combined with a mobile device and a GPS positioning system to raise virtual butterflies in the vicinity of food plants and nectariferous plants on campus as a background. The ARBELS has been tested and found to resolve the traditional learning difficulties caused by difficulty in observing butterflies, making it easy for users to observe butterflies and giving them an immersive experience. Based on these studies, it can be assumed that AR technology has been effectively applied in the field of environmental education and has been effective in sharpening learners’ perspectives and learning outcomes.
The application of AR to education can be mainly separated into four categories as shown in Figure 2: (1) Popularization of information technology and the Internet have made the methods through which people collect travel information more diverse. Additionally, mobile services provide the timeliest information. Apps relevant to travel tour systems and 3D scenes have been developed to respond to the needs of the market. Tourists’ performance expectancy and the social influence of AR applications were discovered to have a positive influence on the intention to use such applications. (2) AR has been integrated and combined with teaching methods, for example in mobile learning, aided learning, and teaching strategies. (3) AR has been used in the design of teaching games. (4) AR has been used to aid the learning of particular groups, such as children with retardation and students with hearing difficulty. The purposes of these four types of application differ. In the first type, AR is applied to evaluate and compare system effectiveness, and the AR used is of the highest technical level. In the second type, AR is highly connected with educational courses and employed to assist, by using scaffolding, the achievement of teaching outcomes such as learning motivation, performance, and attitude among students. The most common example of the second type is the memorization of English vocabulary, followed by learning of geometry and science. In the third type, AR is employed in an interactive learning model. Finally, in the fourth type, AR helps students to complete learning and developmental tasks and is used for training.

2.4. Development of Mobile Augmented Reality System

Smart devices are usually equipped with a camera as well as mobile positioning and wireless Internet access. This study employed these features in a cross-platform mobile AR application with markerless AR [34,35] and location-based service (LBS) capabilities. The system architecture comprises three major parts: the client, server, and AR system as depicted in Figure 3. The server and its database were first established to provide AR mobile tour services. Two modes were developed for users of the cross-platform AR mobile tour application: LBS AR [36] and markerless AR. Relevant service elements were compiled to perform background services. Thus, in the LBS AR mode, the application maintains backend connections with the server, transmitting the latitude and longitude of the user’s current location. When the latitude and longitude of a user attraction are detected, the application immediately displays a location marker with which the user can interact. Through such interaction, the user can acquire information about an attraction, including the distance between the user and the attraction. Moreover, in the markerless AR mode, the user takes a photo of an object and gains access to multimedia information about the object. In this manner, both modes integrate virtual images into a real-world setting, providing an interactive guided tour to users of the application. The Cordova plugin of Wikitude SDK [37,38] was used to establish the cross-platform AR mobile tour system’s backend data interface, which is connected and synchronized with the server and database.

2.5. Technology Acceptance Model

The Technology Acceptance Model (TAM) was proposed for determining users’ acceptance of new information systems. The TAM is thus a behavioral intention model and was developed by Davis according to rational action theory in 1986 [39]; the model is illustrated in Figure 4. The TAM was proposed as an effective behavioral model. The model is used to explain users’ acceptance of new information systems in computer technology and can analyze the various factors affecting acceptance simultaneously. The external factors affecting users’ internal belief, attitude, and intention can be determined, thereby understanding factors influencing the use of information technology. The factors affecting people’s use of information technology have been investigated by numerous scholars. For example, the TAM model has been used as the theoretical basis for investigating users’ adoption of technology in two dimensions, namely perceived usefulness and perceived ease of use. The TAM has also been used to investigate user intention and adoption among application users.

3. Research Model and Hypotheses

3.1. Hypothesis Development

In this study, we employed the TAM as a theoretical basis to study users’ adoption patterns in terms of perceived usefulness and perceived ease-of-use, and used the TAM as a basic research framework to look into app users’ willingness and adoption behavior. Based on many previous TAM-related studies [39,40,41,42,43,44,45,46], this study inherits the relevant research results and constructs a blueprint for the research to be explored. Therefore, we integrated external factors such as age and experience into the research framework of Venkatesh et al. and TAM of Davis et al. Some appropriate modifications were made to the model according to the situations and needs of our research.
(1)
When the user’s knowledge of the new technology is limited, subjective norms have more influence, but when the system development is complete and the user becomes proficient, attitudes have a more significant effect on behavioral intentions than subjective norms.
(2)
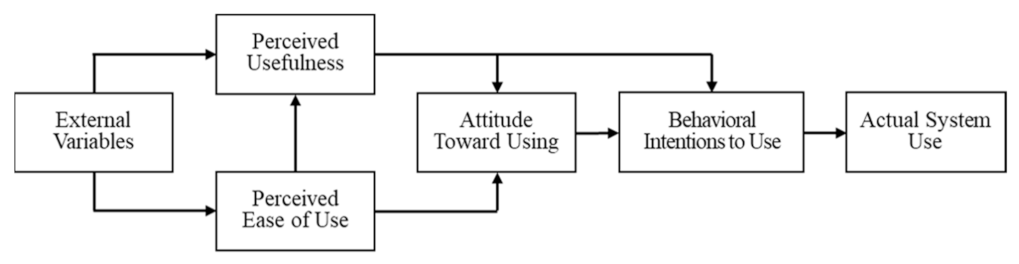
The TAM assumes that perceived usefulness and perceived ease-of-use are key factors that influence individuals’ attitudes towards using information systems. An individual’s attitude toward using will influence his or her intentions to use, which will in turn determine the actual behavior of using the information system.
(3)
The TAM is used to understand the factors that contribute to a user’s acceptance or rejection of a computer information system. Theoretical support is provided not only as a predictor of user behavior but also as an explanation of that user behavior.
(4)
The TAM suggests two main dimensions, “perceived ease-of-use” and “perceived usefulness,” in individuals’ perceptions to predict and explain why users accept or reject the system. The two major variables that affect individuals’ acceptance of technology are “perceived ease-of-use” and “perceived usefulness.” Moreover, these two major aspects not only directly affect users’ attitudes towards using, but further influence users’ behavioral intentions to use the technology system.
(5)
Perceived usefulness (PU): refers to “the extent to which individuals believe how useful information technology systems would be, which will not only enhance the user’s PU of the system, but also create positive attitudes such as trust in the system.” The dimension applied in this study indicates that when elementary school students are satisfied with the quality and quantity of their learning experience via the mobile learning system, they perceive that the system does help them strengthen their learning. Thus, the degree of PU is a reflection of the degree to which students themselves can actually learn via this system.
(6)
Perceived ease-of-use (PEU): is defined as “the degree to which individuals perceive how easy it is to use the information technology systems, which will not only enhance the user’s PEU of the system, but also create positive attitudes such as confidence in the system.” In this study, when users perceive the interactive learning interface of the mobile learning system as easy to use rather than difficult, the degree of PEU also reflects the degree of students’ mastery and familiarity with the system.
(7)
Attitude toward using: In this study, it refers to users’ positive or negative perceptions of the learning experience with the information technology system in terms of its interface environment, quality, and operation, which is expected to have an impact on students’ intentions to use the system.
(8)
Behavioral intention to use: In this study, it refers to the frequency of users using the information technology learning system in the future.
Therefore, the following hypotheses are as follows:
Hypothesis 1 (H1a).
The Gender variable has a positive effect on the PU of the Campus Tree Guide application.
Hypothesis 2 (H1b).
The Gender variable has a positive effect on the PEU of the Campus Tree Guide application
Hypothesis 3 (H2a).
The Age variable has a positive effect on the PU of the Campus Tree Guide application.
Hypothesis 4 (H2b).
The Age variable has a positive effect on the PEU of the Campus Tree Guide application
Hypothesis 5 (H3a).
The Information Experience variable has a positive effect on the PU of the Campus Tree Guide application.
Hypothesis 6 (H3b).
The Information Experience variable has a positive effect on the PEU of the Campus Tree Guide application
Hypothesis 7 (H4a).
The Digital Literacy variable has a positive effect on the PU of the Campus Tree Guide application.
Hypothesis 8 (H4b).
The Digital Literacy variable has a positive effect on the PEU of the Campus Tree Guide application
Hypothesis 9 (H5).
The PEU of the Campus Tree Guide application affects the PU of the application.
Hypothesis 10 (H6).
The PU of the Campus Tree Guide application affects students’ use attitude toward the application.
Hypothesis 11 (H7).
The PEU of the Campus Tree Guide application affects students’ use attitude toward the application.
Hypothesis 12 (H8).
The students’ use attitude toward the Campus Tree Guide application affects their intention to use the application.

3.2. Research Architecture

The research architecture is as shown in Figure 5, containing external variables, internal variables, and behavioral intentions. The questionnaire completed by the students collected the basic information of the students and assessed perceived AR app usefulness, use attitude, perceived ease of use of the AR app, and app use attitude. The questionnaire data were analyzed to determine whether the app use intention of the students can be increased.

4. Methodology

4.1. Sampling Procedures

To assess the proposed model presented in Figure 5, the target participants for the project were the students in a primary school in a rural area of Taiwan. In particular, a questionnaire was administered to all 80 students in this elementary school. A total of 80 questionnaires were obtained, from which these 77 responses were valid. The students acquired relevant knowledge through a teaching process that enabled them to practice at a learning site by using a portable mobile device. The students acquired knowledge by autonomously engaging in mobile learning. We observed the problems encountered by the students outside the classroom at any time and obtained solutions to those problems. We undertook the roles of observer and recorder when teaching the course content. During participant observation, close attention was paid to the students’ responses during operational learning; these responses were the data source. Students in each grade were randomly selected and qualitatively interviewed about their acceptance of mobile learning. Furthermore, we analyzed the sample data by using IBM SPSS Statistics Base version 22.0 for windows. The descriptive statistical results of 77 questionnaires that analyzed the demographic characteristics of the respondents, such as personal information, experience of using information applications, and digital literacy background information are depicted in Table 1. As the number of students who had ever used a mobile phone (92.2%) or mobile applications (88.3%) before accounted for a relatively high proportion, this indicated that the popularizing rate of mobile learning is relatively high at present, and the inference may be directly related to whether the parents of students let their children use 3C electronic products’ concepts and habits. The questionnaire shows that those who have used smartphones are no longer age-related. There is a common use phenomenon in all age groups. Six students have never used a smart phone, and only nine students have never used a mobile app. The results of the questionnaire also show that the ability to search for information on the Internet is mainly in the middle and upper grades, and the inference and student information courses are only related to the middle grades.

4.2. Instrument

A questionnaire was the instrument to collect the dataset. The instrument consisted of a questionnaire with five dimensions designed to measure the adequate reliability and validity of the study. The questions were answered by students following their action learning using the AR app. Moreover, the measuring scale for the constructs included in the project was shown in the Appendix A. The questionnaire had five dimensions: (1) basic information of the students (gender, age, experience of using information applications, and digital literacy); (2) perceived usefulness of the AR application; (3) perceived ease of use of the AR application; (4) attitude toward using the AR application; and (5) factors related to AR application use intention. The questionnaire was divided into seven parts and contained 32 questions. Among them, the students were asked to rate the importance and feasibility of each indicator according to a 5-point Likert scale, with anchors of 1 (strongly disagree) and 5 (strongly agree) [47].

5. Results and Discussion

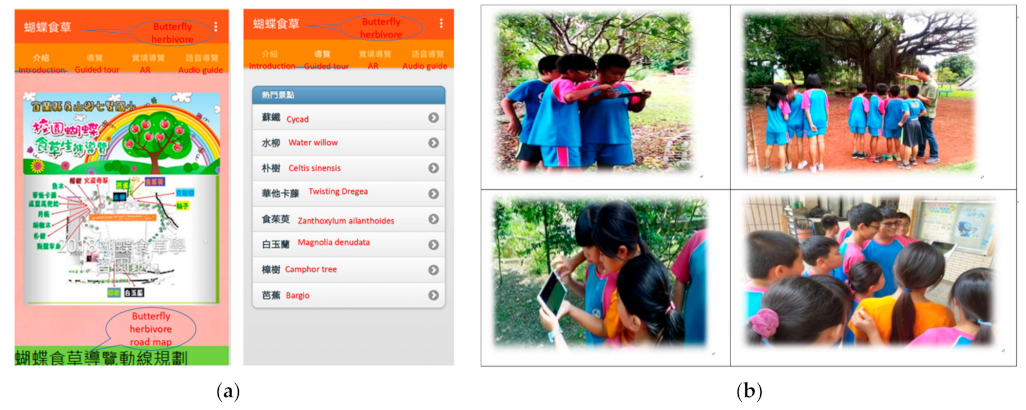
5.1. System Demonstration

The guide is one interactive guide application tool based on geographic locations to enhance the real views. The use of sensor e-compass and GPS can mark virtual objects on the screen of smart phones, so that users can understand the current direction via smart phones and click on the information object on the screen in order to acquire tree-related information. The users will see a radar map, photo of scenic area, and information on the screen while the radar map obtains the current mobile direction primarily through java script linking with the e-compass or gyro sensor of mobile phones as shown in Figure 6. Users will find out the direction in the east, south, west, and north, as well as see the quantity of scenic areas established on current system. Users will also see other scenic area objects by rotating on the spot as shown in Figure 7. When users click on the scenic area containing interesting objects, the objects will appear.

5.2. Scale Validity and Reliability

5.2.1. Discriminant Validity

Discriminant validity is tested by Pearson’s correlation value. Pearson’s correlation coefficients are calculated to determine the correlations between the following variables: external variables, perceived usefulness (PU), perceived ease of use (PEU), app use attitude (Att), and app use behavior intention (BI). The Pearson Correlation coefficient is a measure of linear correlation between two sets of data. The correlations in the table below are interpreted in the same way as those above, such that the result always has a value between −1 and 1, with –1 indicating a perfect negative correlation, +1 indicating a perfect positive correlation, and 0 indicating no correlation at all. Pearson’s correlation coefficients were calculated to determine the correlations between variables. The analytical results as depicted in Table 2 indicated strong correlations between the external variables and four main constructs. The results show that every pairs of the variables are significantly correlated at the level of 0.05. Additionally, the constructs were highly correlated with each other. This verified that the main dimensions in the research framework were significantly correlated, verifying the TAM.

5.2.2. Reliability Analysis

Cronbach’s alpha is a measure of scale reliability, and is a convenient test used to estimate how closely related a set of items are as a group. Theoretically, Cronbach’s alpha results should give you a number from 0 to 1. The general rule of thumb is that a Cronbach’s alpha of 0.70 and above is good, 0.80 and above is better, and 0.90 and above is best. Higher reliability indicates that measurement errors are smaller. In this research, Cronbach’s α is calculated to determine the consistency of the PU, PEU, Att, and BI scale and is found to be 0.819, 0.818, 0.847, and 0.731, respectively. That is, from Table 3, the questionnaires of this study measured consistency in these four constructs.

5.3. Variance Analysis: One-Way ANOVA Test and Scheffe’s Method

When more than three groups exist, ANOVA can be used to determine whether a continuous variable differs significantly between the groups. We employed ANOVA to determine whether age had significant effects on PU, PEU, Att, and BI. We employed ANOVA to examine the age variable, the item “Easy to download Applications,” and the variance of the four dimensions; all variables were discovered to be statistically significant according to Table 4. ANOVA indicated that age and the four dimensions were all statistically significant. That is, the following results were obtained from Table 4:
  • The perceived usefulness in the group of students aged 12 years was significantly different from that in all other age groups.
  • The perceived ease of use in the group of students aged 13 years was not significantly different from that in the group aged 12 years. That in all other age groups differed significantly from that in the 12-year-old group.
  • The application use attitude in the group of students aged 8 years was significantly different from that in the 12-year-old group. That in all other groups was not significantly different from that in the 12-year-old group.
Scheffe’s method is a post-hoc test used in analysis of variance. After we have run ANOVA and got a significant F-statistic, we can run Sheffe’s test to find out which pairs of means are significant. Scheffe’s test corrects alpha for simple and complex mean comparisons. Complex mean comparisons involve comparing more than one pair of means simultaneously. Therefore, multiple comparisons were conducted using the post hoc Scheffé method. The results are shown in Table 5 for the external variable (age) and Table 6 for the variable “Easy-to-download Applications.” We also discovered the following:
  • The item “Easy-to-download Applications” was not significantly correlated with perceived usefulness.
  • The item “Easy-to-download Applications” was significantly correlated with perceived ease of use only in the anchors “strongly agree” and “agree.”

5.4. Hypotheses Model Test

The independent t-test is an inferential statistical test that determines whether there is a statistically significant difference between the means in two unrelated groups. Moreover, regression analysis can be used to determine the power of an independent variable (X) to explain or predict a dependent variable (Y). We conducted regression analysis to discover the validity of our twelve hypotheses.

5.4.1. The Independent t-Test Results

In this section, we analyze whether PU, PEU, Att, and BI are different between students with differing demographics (gender, experience of using information applications, and digital literacy background information). The significance is used to select and judge whether the average of the four main dimensions is significantly different. In this independent t-test, the significance threshold is traditionally set at p = 0.05 and SPSS gives us the significance levels of the differences in means. Table 7 shows that the four aspects of the students’ ability to use the mobile app, the computer equipment at home, the ability to search for information on the Internet, and the experience of using e-mail, will benefit from the PU and PEU of this AR application significantly. In addition, whether the learners of this school have computer equipment in their homes is the main significant difference in the aspect of Att.

5.4.2. Regression Results for H1a, H2a, H3a, and H4a

The correlations between constructs were statistically significant. Therefore, this study further investigated the relationships between the external variables, PU, PEU, Att, and BI. To verify the hypothesized relationships between the independent and dependent variables in our research framework, regression analysis was conducted between pairs of the aforementioned five factors. In particular, a regression analysis was performed, with an external variable as an independent variable and PU as dependent variable. Table 8 presents the regression results used to test the hypotheses. Regression analysis of external variables and PU indicated that the standardized coefficients of all independent variables were negative except for digital literacy. The effect of age on PU (H2a) was significant and extremely strong (p < 0.001). Moreover, digital literacy had a significant effect on PU (H4a) (p = 0.026).

5.4.3. Regression Results for H1b, H2b, H3b, and H4b

Table 9 provided results from the regression analysis for H1b, H2b, H3b, and H4b. As indicated in Table 9, regression analysis of external variables and PEU indicated that the standardized coefficient β of all independent variables were negative except for digital literacy. The effect of age on PEU (H2b) was significant and extremely strong (p < 0.001); no significant correlations were discovered for the other factors.

5.4.4. Regression Results for H5

Regression analysis of PEU and PU indicated that the standardized coefficient β   of PEU was 0.741 and t = 9.568 (p < 0.001) in Table 10. This indicated that the effect of PEU of use on PU was positive; that is, students who perceived the app to be easier to use also perceived it to be more useful. Thus, the hypothesis H5 was supported.

5.4.5. Regression Results for H6 and H7

The hypotheses H6 and H7 were tested by regressing both PEU and PU on Att. Table 11 provided results from the regression analysis for both H6 and H7. Regression analysis of the effect of PEU and PU on Att indicated that the standardized coefficients   β   of PEU and PU were 0.693 (p < 0.001) and 0.738 (p < 0.001), respectively; both PEU and PU have a significant influence on A tt. Thus, PEU and PU positively affected Att.

5.4.6. Regression Results for H8

Regression results for H8 are presented in Table 12. Regression analysis of Att and BI indicated that the standardized coefficient was 0.611 and t = 6.687 (p < 0.001). Thus, the effect of Att on BI was positive. The analytical results thus indicated that the hypotheses in our research framework were supported and the model was significant.

5.4.7. Hypotheses Results of the proposed TAM

In summary, quantitative analysis and a questionnaire were conducted on the basis of the TAM. The results as depicted in Table 13 indicated that students who gave a higher rating to PU also had a more positive attitude toward using the application. The stronger PEU score among the students was correlated with more positive application use attitude. We discovered that students with stronger application use and positive attitude had higher intention to use the app. Furthermore, the results of hypothesis testing indicate that the proposed TAM has moderate predictive power when investigating the acceptance of using the app. This finding is consistent with the literature and shown in Table 13 and Figure 8.

6. Conclusions

We designed a method of creative teaching that combines an AR app with self-designed teaching materials. The application enables schools to develop special and local-oriented teaching materials for mobile learning. The subject of the application was the plant diet of butterflies, an issue related to ecological conservation and teaching children about their neighboring natural creatures. Children can learn about nature by using and integrating new technology. The AR application developed in this study combines videos, special effects, and AR. In addition to providing visual and auditory experiences, tactile stimulation is also achieved. There, the results can serve as a reference for teachers hoping to develop similar teaching materials. Besides this, we used the TAM to evaluate the effect of the developed app on the students, and through SPSS analysis of the questionnaire data, we verified the hypotheses as follows:
  • Age and digital literacy affect the PU of the AR application. The results suggested that PU was weaker among the older students in the elementary school. A negative correlation in the data also indicated that the younger students felt more strongly that the AR app was useful.
  • The digital literacy of the students was assessed on the basis of their experience of using mobile phones and tablets, ability to search for information on the Internet, ability to use email, ability to use a word processor, experience of using smartphone applications, and whether they agree with statement “Easy to download Applications.” Students with weaker digital literacy perceived the AR app to be more useful. Thus, digital literacy was positively correlated with perceived usefulness.
  • The correlations of PU with student gender and experience of using information apps were nonsignificant.
  • Age affects PEU of AR application. The results suggested that older students perceived the AR application to be less useful, which differs from the general belief of scholars. We speculate that this could have been because younger students are more likely to follow teachers’ instructions and because the system operation function was not difficult. Alternatively, it could have been because younger students considered the level of difficulty to be different from that considered by older students.
  • PEU positively affects PU of AR application. The results indicated that students who perceived the AR application to be easier to use also perceived the app to be more useful. This result is consistent with the literature.
  • PU positively affects app use attitude. The results indicated that students who perceived the usefulness of the AR application to be higher also had a more positive attitude toward using the application. This is consistent with previous findings.
  • PEU positively influences application use attitude. Stronger PEU among the students was correlated with more positive app use attitude. This result was in agreement with the literature.
  • Application use attitude positively affects application use intention. We discovered that students with stronger application use attitude had higher intention to use the application. This finding is consistent with the literature.
Moreover, teachers can give students in rural areas a different learning experience through the assistance of information technology. Students’ class participation and passion for learning can be enhanced by the use of such technology. Students with relatively poor academic performance will no longer be outsiders during class. Mobile learning can also cultivate the confidence of students in their ability to use information apps. Moreover, it can enable rural students to adapt to teaching methods implemented using new information apps, ensuring their technological development. Finally, we hope that the integration of information into teaching beliefs in Taiwan will be more complete and friendly.

Author Contributions

Conceptualization, J.-H.L. and Y.-F.L.; methodology, J.-H.L. and Y.-F.L.; software, T.-L.H. and Y.-F.L.; validation, J.-H.L. and Y.-F.L.; investigation, Y.-F.L.; data curation, Y.-F.L.; writing—original draft preparation, Y.-F.L.; writing—review and editing, Y.-F.L.; visualization, J.-H.L. and Y.-F.L.; supervision, J.-H.L.; project administration, J.-H.L.; funding acquisition, J.-H.L. All authors have read and agreed to the published version of the manuscript.

Funding

This research was funded by Ministry of Science and Technology (MOST) of Taiwan, under grant no. [MOST 109-2221-E-431-003, MOST 108-2221-E-431-003, and MOST 107-2221-E-431-002], and the Ministry of Education under plan no. PEE1080223 and PSR1090305.

Conflicts of Interest

The authors declare no conflict of interest.

Appendix A. Student Questionnaire Questions

Personal Information

  • Gender
  • Age

Experience of Using Information Applications

  • Do you have computer equipment at home?
  • Is the computer at home connected to the Internet?
  • Have you ever used a mobile phone or tablet?

Digital Literacy Background Information

  • Do you search for information online?
  • Do you use email?
  • Do you use word processing software?
  • Have you ever used mobile applications?
  • In order to meet your needs for mobile vehicles, do you think it is easy to download the application and use it?

Perceived Usefulness

  • I think using this AR application can speed up my learning.
  • I think using this AR application can improve my learning effectiveness.
  • I think using this AR application will make it easier for me to understand the learning content.
  • I think using this AR application can improve my learning skills.
  • I think using this AR application is helpful for my study.

Perceived Ease of Use

  • The download method provided by this AR application is very easy for me to use.
  • The interface function provided by this AR application is very easy for me to use
  • The learning screen provided by this AR application is clear and easy to understand to me.
  • The teaching function provided by this AR application makes it easy for me to complete learning.
  • This AR application is very convenient to use, which makes me think it is usable and easy to use.

Attitudes Toward Using

  • When using this AR application, I prefer to use computers, mobile phones, and other mobile vehicles to learn.
  • When using this AR application, I am confident that I can keep up with the development trend of new technology.
  • When using this AR application, I can learn happily.
  • When using this AR application, I don’t feel anxious about learning.
  • Because this AR application is easy to use, I prefer to use computers, mobile phones, and other mobile vehicle-related devices to learn.
  • Because this AR application is easy to use, it gives me confidence that I can keep up with the development trend of new technologies.
  • Because this AR application is easy to use, it allows me to study happily.
  • Because this AR application is easy to use, so I don’t feel anxious about learning

Behavoral Intentions to Use

  • If I have the opportunity, I hope to use this AR application frequently.
  • If there is a chance, I am happy to let more people know about this AR application.
  • If there is an opportunity, I hope that the learning content of other subjects can also develop AR applications.
  • If I have the opportunity, I hope to use mobile vehicles for augmented reality courses.

References

  1. Sachs, J.D. The Age of Sustainable Development; Columbia University Press: New York, NY, USA, 2015. [Google Scholar]
  2. United Nations Conference on the Human Environment (Stockholm Conference, 1972). Available online: https://sustainabledevelopment.un.org/milestones/humanenvironment (accessed on 20 March 2021).
  3. Keeble, B.R. The Brundtland report: ‘Our common future’. Med. War 1988, 4, 17–25. [Google Scholar] [CrossRef]
  4. United Nations Conference on Environment and Development (Rio de Janeiro, 1992). Available online: https://sustainabledevelopment.un.org/content/documents/Agenda21.pdf (accessed on 20 March 2021).
  5. United Nations Decade of Education for Sustainable Development (2005–2014). Available online: https://www.bibb.de/dokumente/pdf/a33_unesco_international_implementation_scheme.pdf (accessed on 20 March 2021).
  6. Kalogiannakis, M.; Papadakis, S. Combining mobile technologies in environmental education: A Greek case study. International J. Mob. Learn. Organ. 2017, 11, 108–130. [Google Scholar] [CrossRef]
  7. UNESCO. Trends in Environmental Education; UNESCO: Paris, France, 1977. [Google Scholar]
  8. UNESCO. Environmental Education: A Process for Pre-service Teacher Training Curriculum Development; UNESCO: Paris, France, 1988. [Google Scholar]
  9. Palmer, J.A.; Suggate, J. Influences and experiences affecting the pro-environmental behavior of educators. Environ. Educ. Res. 1996, 2, 109–121. [Google Scholar] [CrossRef]
  10. Palmer, J.A.; Suggate, J.; Bajd, B.; Tsaliki, E. Significant influences on the development of adults’ environmental awareness in the UK, Slovenia and Greece. Environ. Educ. Res. 1998, 4, 429–444. [Google Scholar] [CrossRef]
  11. Gough, N.; Palmer, J.A. Environmental education in the 21st century: Theory, practice, progress and promise; Routledge, London. Aust. J. Environ. Educ. 1999, 15, 165–166. [Google Scholar] [CrossRef]
  12. United Nations Sustainable Development Summit (New York, 2015). Available online: https://sustainabledevelopment.un.org/post2015/summit (accessed on 20 March 2021).
  13. K-12 Education Administration. 2008 Grade 1–9 Curriculum Guidelines. Available online: https://www.k12ea.gov.tw/Tw/Common/SinglePage?filter=F34E9417-8374-4A02-97CC-0DEDFD13514F (accessed on 20 March 2021)In Chinese.
  14. K-12 Education Administration. Curriculum Guidelines of 12-Year Basic Education. Available online: https://cirn.moe.edu.tw/WebFile/index.aspx?sid=11&mid=55 (accessed on 20 March 2021). In Chinese.
  15. Liu, Z.W.; Yang, H.C.; Shiau, Y.C. Investigation on evaluation framework of elementary school teaching materials for sustainable development. Sustainability 2020, 12, 3736. [Google Scholar] [CrossRef]
  16. Milgram, P.; Kishino, F. A taxonomy of mixed reality visual displays. IEICE Trans. Inf. Syst. 1994, 77, 1321–1329. [Google Scholar]
  17. Azuma, R.T. A survey of augmented reality. Presence Teleoperators Virtual Environ. 1997, 6, 355–385. [Google Scholar] [CrossRef]
  18. Georgieva, E.S.; Smrikarov, A.S.; Georgiev, T.S. Evaluation of mobile learning system. Procedia Comput. Sci. 2011, 3, 632–637. [Google Scholar] [CrossRef] [Green Version]
  19. Sandberg, J.; Maris, M.; De Geus, K. Mobile English learning: An evidence-based study with fifth graders. Comput. Educ. 2011, 57, 1334–1347. [Google Scholar] [CrossRef]
  20. Liu, G.Z.; Hwang, G.J. A key step to understanding paradigm shifts in e-learning: Towards context-aware ubiquitous learning. Br. J. Educ. Technol. 2010, 41, E1–E9. [Google Scholar] [CrossRef]
  21. Wang, S.L.; Wu, C.Y. Application of context-aware and personalized recommendation to implement an adaptive ubiquitous learning system. Expert Syst. Appl. 2011, 38, 10831–10838. [Google Scholar] [CrossRef]
  22. Chen, C.C.; Huang, T.C. Learning in a u-Museum: Developing a context-aware ubiquitous learning environment. Comput. Educ. 2012, 59, 873–883. [Google Scholar] [CrossRef]
  23. Squire, K.; Klopfer, E. Augmented reality simulations on handheld computers. J. Learn. Sci. 2007, 16, 371–413. [Google Scholar] [CrossRef]
  24. Martín-Gutiérrez, J. Proposal of methodology for learning of standard mechanical elements using augmented reality. In Proceedings of the IEEE 2011 Frontiers in Education Conference (FIE), Rapid City, SD, USA, 12–15 October 2011; pp. T1J-1–T1J-6. [Google Scholar]
  25. Herfana, P.; Nasir, M.; Prastowo, R. Augmented Reality Applied in Astronomy Subject. J. Phys. Conf. Ser. 2019, 1351, 12058. [Google Scholar] [CrossRef] [Green Version]
  26. Önal, N.T.; Önal, N. The effect of augmented reality on the astronomy achievement and interest level of gifted students. Educ. Inf. Technol. 2021, 1–27. [Google Scholar] [CrossRef]
  27. Chen, Y.C. Effect of mobile augmented reality on learning performance, motivation, and math anxiety in a math course. J. Educ. Comput. Res. 2019, 57, 1695–1722. [Google Scholar] [CrossRef]
  28. Chang, S.C.; Hwang, G.J. Impacts of an augmented reality-based flipped learning guiding approach on students’ scientific project performance and perceptions. Comput. Educ. 2018, 125, 226–239. [Google Scholar] [CrossRef]
  29. Ibáñez, M.B.; Delgado-Kloos, C. Augmented reality for STEM learning: A systematic review. Comput. Educ. 2018, 123, 109–123. [Google Scholar] [CrossRef]
  30. Tarng, W.; Ou, K.L.; Yu, C.S.; Liou, F.L. Development of a virtual butterfly ecological system based on augmented reality and mobile learning technologies. Virtual Real. 2015, 19, 253–266. [Google Scholar] [CrossRef]
  31. Mei, B.; Yang, S. Nurturing Environmental Education at the Tertiary Education Level in China: Can Mobile Augmented Reality and Gamification Help? Sustainability 2019, 11, 4292. [Google Scholar] [CrossRef] [Green Version]
  32. Ducasse, J. Augmented Reality for Outdoor Environmental Education. In Augmented Reality in Education; Springer: Cham, Switzerland, 2020; pp. 329–352. [Google Scholar]
  33. Sermet, Y.; Demir, I. Virtual and augmented reality applications for environmental science education and training. New Perspect. Virtual Augment. Real. Find. New Ways Teach A Transform. Learn. Environ. 2020, 261–275. [Google Scholar] [CrossRef]
  34. Comport, A.I.; Marchand, É.; Chaumette, F. A real-time tracker for markerless augmented reality. The Second IEEE and ACM International Symposium on Mixed and Augmented Reality, Tokyo, Japan, 10 October 2003; pp. 36–45. [Google Scholar]
  35. Teichrieb, V.; Lima, J.P.S.M.; Apolinário, E.; Farias, T.S.M.C.; Bueno, M.; Kelner, J.S. A survey of online monocular markerless augmented reality. Int. J. Model. Simul. Pet. Ind. 2007, 1, 1–7. [Google Scholar]
  36. Werner, P.A. Review of implementation of augmented reality into the georeferenced analogue and digital maps and images. Information 2019, 10, 12. [Google Scholar] [CrossRef] [Green Version]
  37. Wikitude Augmented Reality SDK. Available online: https://www.wikitude.com/products/wikitude-sdk/ (accessed on 20 March 2021).
  38. Cordova. Available online: https://cordova.apache.org/ (accessed on 20 March 2021).
  39. Davis, F.D. A Technology Acceptance Model for Empirically Testing New End-User Information Systems: Theory and Results. Ph.D. Thesis, Massachusetts Institute of Technology, Cambridge, MA, USA, 1986. [Google Scholar]
  40. Davis, F.D.; Bagozzi, R.P.; Warshaw, P.R. User acceptance of computer technology: A comparison of two theoretical models. Manag. Sci. 1989, 35, 982–1003. [Google Scholar] [CrossRef] [Green Version]
  41. Venkatesh, V.; Davis, F.D. A model of the antecedents of perceived ease of use: Development and test. Decis. Sci. 1996, 27, 451–481. [Google Scholar] [CrossRef]
  42. Venkatesh, V.; Morris, M.G.; Davis, G.B.; Davis, F.D. User acceptance of information technology: Toward a unified view. MIS Q. 2003, 425–478. [Google Scholar] [CrossRef] [Green Version]
  43. Guest, W.; Wild, F.; Vouk, A.; Lefrere, P.; Klemke, R.; Fominykh, M.; Kuula, T. A Technology Acceptance Model for Augmented Reality and Wearable Technologies. J. UCS 2018, 24, 192–219. [Google Scholar]
  44. Lasica, I.E.; Meletiou-Mavrotheris, M.; Katzis, K. Augmented Reality in Lower Secondary Education: A Teacher Professional Development Program in Cyprus and Greece. Educ. Sci. 2020, 10, 121. [Google Scholar] [CrossRef]
  45. Jung, J.; Park, E.; Moon, J.; Lee, W.S. Exploration of Sharing Accommodation Platform Airbnb Using an Extended Technology Acceptance Model. Sustainability 2021, 13, 1185. [Google Scholar] [CrossRef]
  46. Jang, J.; Ko, Y.; Shin, W.S.; Han, I. Augmented Reality and Virtual Reality for Learning: An Examination Using an Extended Technology Acceptance Model. IEEE Access 2021, 9, 6798–6809. [Google Scholar] [CrossRef]
  47. Joshi, A.; Kale, S.; Chandel, S.; Pal, D.K. Likert scale: Explored and explained. Curr. J. Appl. Sci. Technol. 2015, 7, 396–403. [Google Scholar] [CrossRef]
Figure 1. Reality–Virtuality Continuum. (Source: Milgram & Kishino’s [16]).
Sustainability 13 06283 g001
Figure 2. Classification diagram of AR-based learning applications.
Sustainability 13 06283 g002
Figure 3. Mobile Augmented Reality System Architecture.
Sustainability 13 06283 g003
Figure 4. The TAM (Davis, 1986) [39].
Sustainability 13 06283 g004
Figure 5. The research architecture of proposed TAM.
Sustainability 13 06283 g005
Figure 6. Application Functions and students exploring the campus’ natural ecology by using the AR application. (a) First page that shows all functions; (b) Students explore campus natural ecology.
Sustainability 13 06283 g006
Figure 7. AR views and scenic information expanded view. (a) AR views and radar map; (b) Information Expanded View.
Sustainability 13 06283 g007
Figure 8. Structural results of the proposed TAM (Significant at: * p ≤ 0.05; ** p ≤ 0.01).
Sustainability 13 06283 g008
Table 1. Profile of participants.
External Variables Items of External VariableFrequencyPercentage
Personal informationGenderMale4457.1
Female3342.9
Age7810.4
81114.3
91114.3
101215.6
111114.3
121013.0
131418.2
Information experienceDo you have computer equipment at home?5672.7
Is the computer at home connected to the Internet?5267.5
Have you ever used a mobile phone or tablet?7192.2
Digital literacyDo you search for information online?6077.9
Do you use email?4153.2
Do you use word processing software?4761.0
Have you ever used mobile applications?6888.3
In order to meet your needs for mobile vehicles, do you think it is easy to download the app and use it?Strongly agree5267.5
Agree1620.8
Neither agree nor disagree67.8
Disagree33.9
Strongly disagree00
Table 2. Pearson’s correlation results.
External
Variable
PUPEUAttBI
External
variable
Pearson correlation1−0.437−0.487−0.469−0.317
Significance(2-tailed) 0.000 ***0.000 ***0.000 ***0.005 **
N7777777777
PUPearson correlation
Significance(2-tailed)
N
−0.437
0.000 ***
77
1

77
0.741
0.000 ***
77
0.693
0.000 ***
77
0.495
0.000 ***
77
PEUPearson correlation
Significance(2-tailed)
N
−0.487
0.000 ***
77
0.741
0.000 ***
77
1

77
0.738
0.000 ***
77
0.435
0.000 ***
77
AttPearson correlation
Significance(2-tailed)
N
−0.469
0.000 ***
77
0.693
0.000 ***
77
0.738
0.000 ***
77
1

77
0.611
0.000 ***
77
BIPearson correlation
Significance(2-tailed)
N
−0.317
0.005 **
77
0.495
0.000 ***
77
0.435
0.000 ***
77
0.611
0.000 ***
77
1

77
Variables of Significance (** p ≤ 0.01, *** p ≤ 0.001).
Table 3. Cronbach’s analysis for Constructs.
ConstructsCronbach’s Alpha
PU0.819
PEU0.818
Att0.847
BI0.731
Table 4. One way ANOVA variance results.
External VariableConstructsSum of SquaresdfMean SquareFp
AgePU14.832761.1768.6800.000 ***
PEU15.272761.1117.2380.000 ***
Att13.457760.6874.7700.000 ***
BI11.644760.5062.7580.018 *
Easy-to-download ApplicationsPU14.832760.9324.4200.007 **
PEU15.272761.0535.0880.003 **
Att13.457760.5812.4730.068
BI11.644760.2860.8570.467
Variables of Significance (* p ≤ 0.05, ** p ≤ 0.01, *** p ≤ 0.001).
Table 5. The Scheffé method results for the external variable “Age.”
ConstructsI(Age)J(Age)Mean Difference
(I-J)
Standard Errorp95% Confidence Interval
Lower BoundUpper Bound
PU7
8
9
10
11
13
120.800000.165340.002 **0.19511.4049
120.990910.152300.000 ***0.43371.5481
120.881820.152300.000 ***0.32461.4390
120.650000.149240.008 **0.10391.1961
120.609090.152300.022 *0.05191.1663
120.600000.144320.014 *0.07201.1280
PEU7
8
9
10
11
120.850000.174050.002 **0.21321.4868
120.781820.160320.002 **0.19521.3684
120.836360.160320.001 ***0.24981.4230
120.700000.157110.006 **0.12521.2748
120.636360.160320.024 *0.04981.2230
Att8120.631820.161400.027 *0.04131.2224
BI8130.543830.147790.048 *0.00311.0846
Variables of Significance (* p ≤ 0.05, ** p ≤ 0.01, *** p ≤ 0.001).
Table 6. The Scheffé method results for the external variable “Easy to download the app”.
ConstructsI
(Easy to Download the App)
J
(Easy to Download the App)
Mean Difference
(I-J)
Standard Errorp95% Confidence
Interval
Lower BoundUpper Bound
PEUStrongly agree
Strongly agree
Strongly agree
Agree
Neither agree nor disagree
−0.2447
0.45513
0.24698
0.17934
0.805
0.102
−0.9517
−0.0581
0.4620
0.9684
Disagree0.350960.118920.040 *0.01060.6913
Variables of Significance (* p ≤ 0.05).
Table 7. The Independent t-Test Results.
External VariablesPUPEUAttBI
Gender0.3290.2090.8920.546
Do you have computer equipment at home?0.1130.040 *0.026 *0.048 *
Is the computer at home connected to the Internet?0.9570.5390.2450.778
Have you ever used a mobile phone or tablet?0.3960.3770.1190.222
Do you search for information online?0.001 ***0.005 *0.0640.005 **
Do you use email?0.000 ***0.012 *0.0920.253
Do you use word processing software?0.1780.7920.8810.328
Have you ever used mobile applications?0.008 **0.004 **0.1260.282
Variables of Significance (* p ≤ 0.05, ** p ≤ 0.01, *** p ≤ 0.001).
Table 8. Regression results for H1a, H2a, H3a, and H4a.
Standardized
Coefficients   β
Adjusted
R Square
Ftp
Gender−0.1130.0130.966−0.9830.329
age−0.4370.18017.682−4.2050.000 ***
Information Experience−0.1150.0131.006−1.0030.319
Digital literacy0.2540.0525.1552.2710.026 *
Variables of Significance (* p ≤ 0.05, *** p ≤ 0.001).
Table 9. Regression results for H1b, H2b, H3b, and H4b.
Standardized
Coefficients   β
Adjusted
R Square
Ftp
Gender−0.1450.0211.606−1.2670.209
age−0.4870.22723.380−4.8350.000 ***
Information Experience−0.1670.0282.145−1.4640.147
Digital literacy0.0820.0070.5030.7090.480
Variables of Significance (*** p ≤ 0.001)
Table 10. Regression results for H5.
Standardized
Coefficients   β
Adjusted R SquareFtp
PEU0.07410.54491.5509.5680.000 ***
Variables of Significance (*** p ≤ 0.001).
Table 11. Regression results for H6 and H7.
Standardized
Coefficients   β
Adjusted
R Square
Ftp
PU0.6930.47369.2428.3210.000 ***
PEU0.7380.53889.4419.4570.000 ***
Variables of Significance (*** p ≤ 0.001).
Table 12. Regression results for H6.
Standardized
Coefficients   β
Adjusted
R Square
Ftp
Att0.6110.36544.7156.6870.000 ***
Variables of Significance (*** p ≤ 0.001).
Table 13. Hypotheses Results of the proposed TAM.
HypothesesResults
H1aNot supported
H1bNot supported
H2aSupported ***
H2bSupported ***
H3aNot supported
H3bNot supported
H4aSupported *
H4bNot supported
H5Supported ***
H6Supported ***
H7Supported ***
H8Supported ***
Significant at: * p ≤ 0.05; *** p ≤ 0.001.
Publisher’s Note: MDPI stays neutral with regard to jurisdictional claims in published maps and institutional affiliations.

