Abstract
The transportation industry is one of the major sectors for air pollution. In particular, the freight transportation sector possesses the biggest share of air pollution in South Korea. Therefore, it is required to evaluate current environmental performance of this sector and predict regulation impact on the local economy for a sustainable future. Based on the sustainable governance, each local government should take actions or change the paradigm of the regulatory policies. Thus, this study examines the environmental performance of the freight transportation industry with air pollution of PM2.5 and NOx in 16 Korean local governments, based on the non-radial directional distance function (NDDF). On average, the freight transportation sector shows very low performance with a high potential value of 0.649. Furthermore, no significant uptrend was witnessed during the sample period (2012 to 2017), implying a lack of sustainable governance. Some local governments such as Seoul (0.9301) and Busan (0.9709) show high efficiency, and Gwangju shows a slow but increasing trend, while most of other cities are very low in their environmental performance of freight transportation industries. Even Seoul and Busan may not maintain their sustainable performance, because outperforming high sales revenue in these cities could lead to high efficiency even with high levels of aggravating air pollution. Therefore, it is meaningful to empirically test the sustainable feasibility in terms of regulatory costs, reflecting the opportunity costs to select increased regulation toward a sustainable, higher environment-friendly efficiency. Environmental regulation causes very low, negligible costs in most of the local governments, except Seoul, implying that a more regulatory regime will bring in the sustainable governance of the environmental efficiency (Porter hypothesis) for the freight transportation sector for these local governments. However, Seoul will endure a heavy economic burden if heavier environmental regulations are posed on its freight transport sector. Stepwise and fine tuning of regulations is required for Seoul. In contrast to Seoul, Incheon needs drastic reformation since it shows low efficiency with low regulatory cost.
1. Introduction
As with other rapidly growing developing countries, Korea has been suffering two environmental difficulties simultaneously: greenhouse gases and air pollution. The former may force the long-term solution to overcome the climate change, while the latter is a more urgent challenge in the short-term due to its severe effects on human health. Most developing countries are experiencing this air pollution more seriously; thus, air pollution issues are much more urgent to solve because it is causing thousands of deaths every year owing to related diseases such as stroke, chronic obstructive pulmonary disease, and lung cancer. As seen in Figure 1, the air pollution issue is also severe in Korea. The X axis of bar graph indicates the annual polluted days and the X axis in the line graph shows the concentration ratio of polluted air. In 2019, more than 16 days were reported as highly concentrated air pollution days, with 135 μg/m3 at its maximum concentration level. The more serious issue is that its concentration becomes much severe over time.
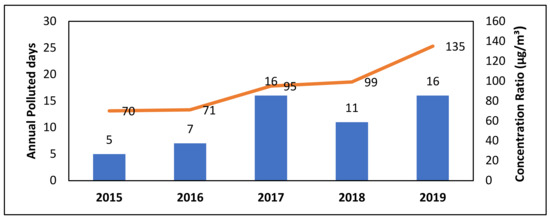
Figure 1.
The number of days of high concentration, and the highest value of concentration (Seoul) Source: National Assembly Budget Office. “PM corresponding project”, p. 12 (Korean), accessed on 12 April 2021 [1].
One of the major factors causing air pollution is transportation. According to the Korean Ministry of Environment [1], the particulate matter (hereafter PM) share of automobile transportation was ranked third with 13.5% of national volume, and first from the capital area (Seoul, Gyeonggi, Incheon), where one third of the Korean population lives. Among automobile transportation, the freight car’s share of PM2.5 and NOx are overwhelming other types of transport mode (see Figure 2).
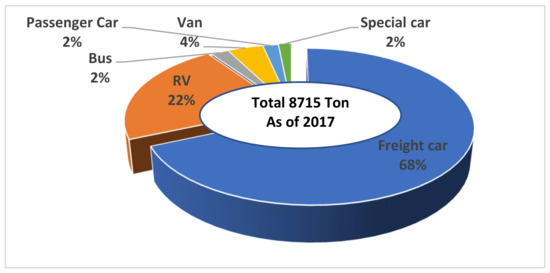
Figure 2.
PM2.5 emission share of automobile pollution sources (2017). Sources: National institute of environmental research [2].
Therefore, as the major sector of the air pollution, evaluating the environmental performance of the freight transportation sector could be a strategically important task for the sustainable future of the Korean economy. There have been numerous regulatory policies for the freight transportation industry to reduce its air pollution, but there is still strong doubt about the effectiveness of the current regulatory policies. Therefore, the purpose of this research is to find out the effectiveness of the regulatory policies on the freight transportation industry in terms of its dynamically enhanced performance of environmental efficiency and evaluate its sustainable governance in terms of its additional regulatory costs. In particular, local governments may have different approaches to regulate their air pollution issues due to the trade-off between the local economic development and air pollution; thus, the empirical test on the regulatory cost of each local government shall shed light on the future direction for how to harmonize between the regulatory policies on the air pollution and the local economic development. According to Kuznets curve theorem, it is feasible for the rapid economic growth to harmonize with better performance in the environment as well [3]. The research shall empirically test this Kuznets curve theorem with the Porter hypothesis [4] on the regulation policies toward a positive effect on the economic development of the 16 local governments.
The unique contribution of this study could be summarized as follows; first, we evaluated the environmental efficiency of provincial freight transport sectors by incorporating both PM2.5 as the primary index of air pollution and NOx as the primary source of generating PM2.5. To the best of our knowledge, no one has used these air pollutant variables together in examining the environmental performance of transportation sector. Therefore, we could measure a more precise and accurate impact on the freight transportation sector. As a second stage of this study, we will derive the regulatory cost in terms of opportunity cost as the potential economic loss coming from the additional environment regulation. It will provide the implications of whether each local government should strengthen regulation or loose it, and if needed, in which way they should approach. These practical implications will shed light on the appropriate sustainable governance for all local governments.
2. Literature Review
As a methodology for evaluating environmental performance, directional distance function (DDF) is widely used because it models joint-production technology with both desirable and undesirable outputs at the same time. The inclusion of the undesirable output of air pollutants makes the result more realistic and reliable. In general, DDF is classified into two types, the parametric and non-parametric approaches respectively. The former requires a specific functional form such as a trans-log or a quadratic function. This parametric function has the advantage of providing a theoretical representation of sustainable production technology, which is differentiable and easily manageable, algebraically [5]. Therefore, the parametric method can be used to estimate shadow prices of emissions [6] and the curvature or substitutability along the frontier [7]. Meanwhile, the non-parametric approach is based on the construction of a piecewise linear combination of all observed outputs and inputs and relies on mathematical programming. In addition, this approach is very advantageous in that it does not require the imposition of any specific functional form of underlying environmental technology. This is the different characteristic with the parametric approach. As we aim to compare environmental performance in local governments without any connection to shadow price or elasticity of substitution, we will use the non-parametric approach as the methodological tool due to its simple yet much more practical implications.
Meanwhile, in exploring the environmental efficiency or productivity of transportation sector, numerous researches have used the concept of data envelopment analysis (DEA) by incorporating multi-inputs and -outputs. Cui et al. [8] proposed a DEA method to evaluate transportation energy efficiencies based on 30 Chinese provincial administrative regions. The research results show that transport structure and measures have impacts on transportation energy efficiency. Chang and Zhang [9] also adopted a method to study the environment efficiency in the transportation industry between China and Korea. The results show that Korea and China have improved their environmental efficiency in the transportation sector in recent years. Chang et al. [10] analyzed the impact of emission regulation based a DEA model on the ports in Korea. This study suggests that the current administration should impose an appropriate emissions target at the initial stages if it aims to minimize the regulatory impacts on the industry. All of these arguments on the methodology in Table 1 support our selection of research model DDF-DEA with the appropriate selection of input/output variables.

Table 1.
Previous researches on the environmental efficiency.
However, there are still some problems remaining in the existing DEA-based DDF researches. First of all, most existing research has only conducted empirical studies on the efficiency under environmental regulation [13,14,15,16,17,18,19,20,21,22]. Very few of them have taken a further step to explore the impact of environmental regulation for sustainable governance. That is a contribution of our paper to the literature. Second, when investigating environmental regulations, most research has employed only greenhouse gases (GHG) such as CO2. However, our focus will be on air pollution, not the climate change issue. Wang and Feng [23] studied the environmental regulatory cost of energy utilization in China. Zhang and Xie [5] analyzed the CO2 emission regulatory cost of the electronic industry in China. Based on their efforts, we shall expand their approach to focus on air pollutants such as PM2.5 or NOx. Therefore, here, we take a step further to investigate the environmental regulatory cost of PM2.5 and NOx in Korean freight transport sector.
3. Methodology and Data
In this section, conceptual characteristics of the DEA and the non-radial directional distance function (NDDF) will be utilized to estimate environment efficiency. In addition, we will present how to calculate the environmental regulatory cost in the second stage.
3.1. Data Envelopment Analysis (DEA)
DEA is a widely used and popular model for constructing environmental performance measures [24] as it provides an inclusive efficiency index. In order to introduce the concept of DEA, we first need to define “environmental production technology”. Assume that there are j = 1, …, N (decision-making units; DMUs). In this study, DMUs are Korean local governments. Assume that each DMU employs input vector x ∈ Ri to produce a jointly desirable output vector y ∈ Rm and an undesirable output vector b ∈ Rb. Then, this multi-input/output production technology can be expressed as:
where T satisfies the traditional axioms of production theory. Inactivity is always feasible, and finite amounts of input can produce only finite amounts of output. Moreover, weak disposability of the environmental regulation should be imposed for desirable and undesirable outputs, implying that reducing undesirable outputs, such as PM2.5 or NOx emissions, is costly in terms of compensating decreases in production process. The null-jointness assumption is imposed such that air pollutants are inevitable in production and the only way to eliminate air pollutants is to discontinue production. In mathematical terms, two assumptions are expressed as follows:
T = {(x, y, b):x can produce (y, b)}
(i) If (x, y, b) ∈ T and 0 ≤ q ≤ 1, then (x, θy, θb) ∈ T
(ii) If (x, y, b) ∈ T and b = 0, then y = 0
(ii) If (x, y, b) ∈ T and b = 0, then y = 0
Now, we define a DEA model to evaluate the production performance of each local government’s freight transportation industry. In order to compare the efficiency of DMUs over the whole research period, we construct a global DEA model considering undesirable outputs. N DMUs over T periods assuming constant return to scale (CRS) can be expressed as Equation (1). Here, I and M indicate the input and output, and S means undesirable outputs.
3.2. Environment Efficiency
In order to solve Equation (1), we adopted the non-radial distance function (hereafter NDDF). NDDF is advantageous in that it can take into account slacks, which cause a biased result in examining efficiency. Therefore, adopting NDDF is helpful to obtain discriminating power. This NDDF is expressed as follows:
Here, w implies the weight vector of both inputs and outputs; g and β is the direction vector and scaling vector, respectively. Concerning the value of vector, based on Zhang et al. [25], the weight vector is set as (0, 0, 1/2, 1/4, 1/4) for labor, capital, sales revenue, PM2.5 emission, NOx emission. respectively. Based on this setting, environmental efficiency can be obtained from Equation (2).
In Equation (2), when = 0, it implies the DMU is located on the production frontier. In this case, the DMU is regarded efficient with efficiency value unity. Meanwhile, it is through solving Equation (2) that each DMU is able to obtain its corresponding optimal solution , implying the inefficiencies of the DMU in inputs and outputs. Thus, we can define environmental efficiency as follows:
3.3. Environmental Regulatory Cost
The regulatory cost to strengthen the environmental measures marginally can be articulated by the opportunity cost of mitigating environmentally negative impacts such as carbon emissions or greenhouse gas emission. The opportunity costs are measured by the difference in desirable outputs between scenarios of regulated (weak disposability) and unregulated production (strong disposability) sets [26]. Following Yang et al. [27], unregulated production set with strong disposability assumption are presented as follows:
Different from Yang et al. [27], here, we only measure environmental regulatory cost instead of the simultaneous effect of environmental regulation on economic loss and energy saving. Therefore, following Färe, Grosskopf, and Pasurka [28], the weight vector is set as (0, 0, 1, 0, 0). Here, environmental regulatory cost (ERC) can then be expressed as an opportunity cost minus potential cost for a DMU to bear if restricting its emission level at the observed level:
where and represents optimal solutions for gross regional production under unregulated and regulated scenarios, correspondingly. Therefore, each DMU could evaluate the feasibility of regulation from the perspective of potential loss.
3.4. Data
To examine the environmental performances of the Korean freight transportation sector, data from 16 Korean local governments from 2012 to 2017 were collected. Each local government is regarded as a DMU, which cover all freight transportation firms’ data. From the Korean Statistical Information Service (KOSIS) website [29], two basic inputs (capital and labor) and one output (sales revenue) were collected. Meanwhile, two air pollution markers—PM2.5 and NOx—were obtained directly from the National air pollutants emission service [30]. Descriptive statistics of the data are shown in Table 2.
Table 2.
Descriptive statistics of the input–output data.
4. Empirical Result
4.1. Environmental Efficiency
Based on Equation (2), environmental efficiency is derived in Table 3, and its trend is shown in Figure 3. The environmental efficiency value on the X axis for six consecutive years ranges from 0.149 to 1, and the average value is 0.351, implying that each local government shows very inferior performance except some local governments on the relative top of the production possibility frontier. To enhance this huge potential efficiency improvement of 0.649, each ineffective DMU (local government) should be move toward the frontier. With respect to average environmental efficiency value trend over time, except the lowest year of 2012 (0.296), it shows a stable trend with a value of 0.34 to 0.37, implying never narrowing bipolarization among the local governments. Based on the huge potential efficiency of 64.9%, it implies that regulatory policy against air pollution did not work effectively during the research period. To improve the environmental efficiency, more proactive efforts for the freight transportation industry should be promoted by much more aggressive policies enacted by the government, because it otherwise gives a very weak signal for future improvement. Without strong intervention against air pollution by the local governments, the freight transportation companies will have no reluctance to choose higher revenue with worse aggravation of air pollution, making them consider any measures for air pollution as an extra burden. In order to avoid this kind of conceptual misunderstanding, the monumental policy by the local government could be the complete ban of the fossil-fuel engine by 2035 in Seoul, and relatively higher tax scale adjustment on diesel as well as more emphasis on the rail train renaissance. Nonetheless, these policies may not be sustainable unless the freight car companies voluntarily participate and demand pressure for green transportation by the consumers match with the policies, because the industry did consider the measure for cleaner air as an extra burden. Above all, the transparent and predictable, and thus reliable, roadmap toward clean air in the freight transportation industry should be provided as a strong guideline, not just a signal, for all economic agents including the freight car owners and users of these cars.
Table 3.
Environmental efficiency of 16 Korean local governments.
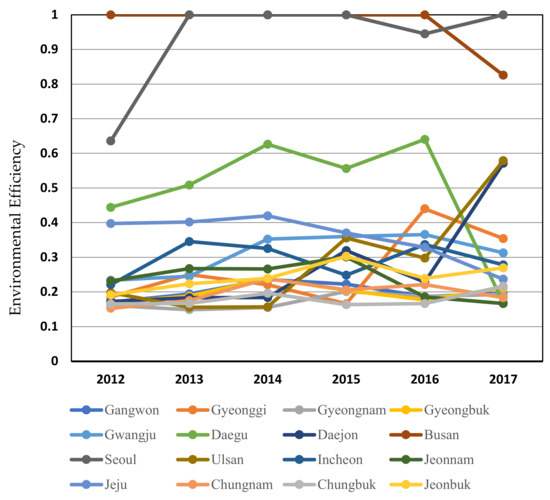
Figure 3.
Environmental efficiency of 16 Korean local governments.
For the performance of each local government, Seoul shows the highest efficiency value with the top for four years in the research period. Even though the capital areas of Seoul, Incheon, and Gyeonggi province have suffered from air pollution coming from the freight transport industry, in contrast to the other two local governments, Seoul shows much superior performance. The reason for this superior performance of Seoul may come from the fact that our efficiency index is based on the harmonized weighted values of desirable output of sales revenues and undesirable outputs of PM2.5 and NOx altogether, and thus the outperforming desirable outputs may offset the undesirable outputs, resulting in superior performance. It does not mean Seoul reduced the volume of air pollution enough, because the outperforming high sales revenue may also not be sustainable with higher environmental efficiency, unless the freight transportation companies are voluntarily participating in the abatement of polluted air emission. High sales revenue indicates that many freight transportation companies are congested in Seoul. Therefore, Seoul must not overlook the treatments for air pollution, even with the superior performance in its environmental efficiency. Moreover, it should clearly make efforts for the environmental regulatory policies to be sustainable. From Table 3, Busan showed a similar situation to Seoul with the top ranked environmental efficiency.
In contrast to the metropolitan city of Seoul, Incheon, just neighboring Seoul, shows very low performance, implying that there are many environmental difficulties coming from the bottlenecks of the transportation on the complicated yet scattered locations of diverse industrial complex as well as locational disparity of the traffic infrastructure. Due to this malfunctioning infrastructure and industrial complexity, regulation policy in Incheon may have resulted in the much lower efficiency of 29%, compared with the national average efficiency of 35%. Therefore, it is necessary for Incheon city to improve the environmental efficiency of transportation sector by systematically reshuffling of the complex clusters and improving the connectivity each other. It must also make a lot of detour roads to avoid diverse traffic bottlenecks in the city center so that traffic congestion in the downtown area can be solved with a much smoother and more efficient traffic operational management.
Not only is the improvement of the traffic efficiency necessary, but so too is the consideration of its sustainable performance from a governance perspective. Thus, our focus should go to evaluate whether or not this kind of environmental efficiency is sustainable. In the sustainable perspective, Gwangju may be a good benchmarking case. Although its environmental efficiency is not high, it shows an increasing trend, implying a good signal for sustainable management of the environmental pollution. The reason for Gwangju to show this increasing trend, comes from the fact that this city has very strong investment on the eco-friendly high-tech industries such as optical and medical industries, with very well-organized traffic operational management. It is noteworthy that, similar to Seoul, Busan also shows superior performance, even if the GDP of Busan is not as high as Seoul. Thus, it may not always be true, at least in Busan, that higher GDP may result in higher environmental efficiency, as the Kuznets curve argues.
Therefore, it is meaningful to empirically test the sustainable governance of these two top-ranked cities in terms of its regulatory costs, because it reflects the opportunity costs of selecting more regulation toward the sustainable, more environmental-friendly efficiency. We will examine this sustainable governance in the regulatory cost perspective in the following section as the second stage of our research.
4.2. Regulatory Cost
In this section, environmental regulatory cost of the freight transport sector is measured using Equation (6), in terms of its opportunity cost. That is to say, regulatory costs will be defined as the difference between the revenues coming from the current regulated regime with the regime in which there is no environmental regulation in the region, implying the potential sales loss using command-and-control policies to restrict the environmental emissions to the observed levels. If there is a regulatory policy being implemented, the regulatory cost implies the potential benefits of relaxing the restriction on emissions. Therefore, our results of environmental regulatory costs can be interpreted as the additional burdens of implementing an environmental regulation to the freight transport sector.
Table 4 shows the average environmental regulatory costs of the transport sector. The results show that the costs of the transport sector rose rapidly from 67,933.1 million KRW in 2012 to 143,092.4 million KRW in 2015, and then gradually fell down to 117,226.1 million KRW in 2017. This implies that the trajectory of environmental efficiency, with the improvement of environmental management, has also enlarged the economic potential of the Korean transport sector. It means that the transport sector of Korea followed a sustainable development trajectory in the first period of 2012 to 2015. However, the regulatory cost dropped in the later period of 2016 to 2017, suggesting that the sector turned the wheel to a non-sustainable manner in the following years. Further efforts are needed to strengthen the environmental regulation, but in a more economically feasible manner.
Table 4.
Average environmental regulatory costs of the Korean freight transport sector.
With respect to each local government, as shown in Figure 4 with regulatory costs on the X axis, most of local governments exhibited no or very low environmental regulatory costs. This result implies that exerting any environmental regulations on those cities will engender no emission reduction costs, implying no freight transportation company feels the regulation as an extra burden at all. Many Korean freight transportation firms argue that regulation will lower competency and deteriorate management, but this is a misunderstanding, because the regulation does not cause any loss in sales volume of the freight transportation companies. On the other hand, if the government is passive on implementing regulation, the Korean government will lose valuable time in controlling air pollution. Therefore, it is highly encouraged to implement much stronger environmental standards on the freight transport sector of those cities to force them to drive down their PM2.5 and NOx emissions.
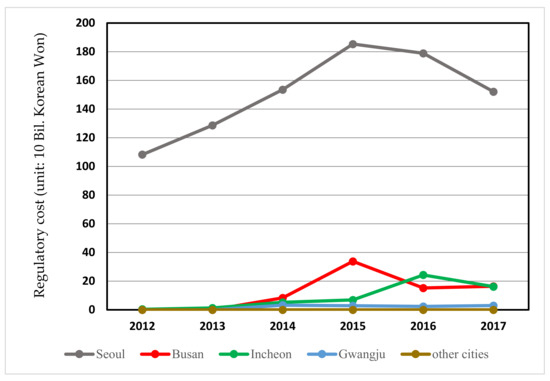
Figure 4.
Environmental regulatory costs of the transport sector in Korean local governments.
In contrast to these local governments with non-regulatory costs, as shown in Figure 4, the highest regulatory costs were exhibited by Seoul with its peak cost of 1850 billion Korean Won in 2015, suggesting that if the government tries to add even a little regulation, Seoul will face strong resistance because it leads to a huge amount of potential sales loss. Therefore, regulations on the transport sector in Seoul must be carefully designed to mitigate air pollution while maintaining its high sales revenue. Due to this high regulatory cost in Seoul, much scrutinized or customized pin-point regulation is necessary; selective concentration on the regulatory measures is needed to make efficiency higher, without any additional substantial loss in its economic performance. For example, regulating on the entrance of the city center during the busy time with transit fees and penalties or a number plate-based day-off program could be useful to pin-point activities by the local government.
However, Incheon not only exhibited low environmental efficiency but also a low regulatory cost, implying that there is no big burden for the additional regulation, and this regulation is necessary to enhance the efficiency. As mentioned above, there are no systematic industrial complexes in Incheon, and no effective connectivity in its infrastructure among these scattered business complexes for mitigating air pollution. Therefore, drastic reform is desperately required for this city. If Seoul requires stepwise for fine-tuning and discreet action, Incheon must take a totally different approach with stronger regulatory policies. Incheon may need some benchmarking cases from Gwangju.
It is noteworthy that even if Seoul and Busan are located at the top ranks on the environmental efficiency as shown in Figure 3, their regulatory costs are totally different in Figure 4, implying that the high efficiency in Busan does not have any sustainable governance in its regulatory costs, and thus Busan also needs to very proactively strengthen its regulations on the environment. Recently, Busan city proclaimed that it would enhance the port operational management in much more environmental-friendly ways, but our results show that all these regulatory measures do not seem to inflict any additional burden to the freight transportation industry, because there is no additional loss in sales volume of the freight transportation companies for additional regulation. It may imply that most of the regulatory measures by Busan city seem to be the “tiger in the picture”; no company feels its sustainable governance, with just a show-off effect only. Therefore, the appropriate, precise measures with much stronger penalties should be followed with the new regulatory regime, as the Porter hypothesis argues.
5. Concluding Remark
This research examined the environmental performance of the freight transportation industry for each local government perspective. Korea has been suffered from serious air pollution coming from PM2.5 and NOx as a major source of PM2.5 coming from the freight transportation industry. In particular, the automobile transportation possesses the highest share of the air pollution in the capital area and the third highest on a national level, as shown in Figure 1. Therefore, it is urgent to find out the optimal path control on the freight transportation in more environmental-friendly way, based on the harmonization between local economic development and air pollution issues. The empirical findings and resulting implications are summarized as follows.
First, in terms of environmental efficiency, Korea shows very low performance with the average value 0.351, implying that there is huge potential of 0.659 improvement in environmental efficiency of freight transportation industry. Furthermore, except for two consecutive years of 2012 and 2013, there was no significant increasing trend during the sample period (2012 to 2017), implying that there is no sustainable governance on the regulatory policies. Among local governments, Seoul and Busan showed overwhelmingly high efficiency, while all other cities and provinces were much lower, resulting in bipolarization in the performance of environmental policies. This may stem from the fact that efficiency is calculated based on the harmonized weighted values of desirable output of sales revenues and undesirable outputs of PM2.5 and NOx. The rest of the local governments usually showed inferior performance during the sample period. In order to improve the national environmental efficiency, more proactive efforts from the freight transportation industry should be promoted by aggressive policies enacted by the government.
Since outperforming high sales revenue could lead to high efficiency in Seoul and/or Busan, we evaluated the environmental regulatory cost of the freight transport sector in the second stage of our research. We found varying patterns of regulatory costs across Korean local governments, which can inform governments of the priorities and potentials of environmental regulation on the freight transport sector—one of the largest emitters of air pollutants. First of all, environmental regulation causes no or negligible cost to most of the cities (Daegu, Gwangju, among others). Therefore, considering their poor environmental performance, immediate and effective measures must be implemented to restrict air pollutant emissions from the freight transport sector of these local governments. According to the results, freight transportation companies in Seoul endure a heavy economic burden if any additional regulation for air pollution is imposed. Therefore, stepwise and customized fine-tuning regulations are required for the capital city of Korea. In contrast to Seoul, Incheon needs drastic reformation since it shows low efficiency and low regulatory cost, and Busan is the same. It implies that even with the higher efficiency, the regulatory policies should be different for each metropolitan city and province. These empirical findings may shed some light on the trade-off between the economic growth and environmental protection in developing countries. The regulation should be differentiated based on their locational characters and infrastructure, and in most of cases, the claims from the freight transportation industry against the extra burden for cleaner air is not true in terms of regulatory costs. As Porter says, stronger regulation may result in higher environmental efficiency in most cases [4]. However, as shown in the case of Seoul, this is also not always true; thus, scrutinized, precise, appropriate measures are important for metropolitan areas.
Note that we analyzed the costs of the environmental regulation as an opportunity cost. The real costs associated with environmental regulations may need more empirical evidence generated under real-world regulatory settings. Hence, we suggest further efforts for the research in the future to extend data after 2017, when air pollutants regulation started to be implemented, to re-examine the true costs that regulations have engendered and how the cost is distributed among citizens, firms, and governments.
Author Contributions
The authors contributed to each section of the paper by conceptualization, Y.C.; methodology, F.Y.; software, F.Y.; validation, H.L.; formal analysis, H.L.; investigation, H.W.; resources and data curation, H.L. writing—original draft preparation, H.W.; writing—review and editing, H.L.; supervision, H.L.; project administration. All authors have read and agreed to the published version of the manuscript.
Funding
This research received no external funding.
Institutional Review Board Statement
Not applicable.
Informed Consent Statement
Not applicable.
Data Availability Statement
Not applicable.
Conflicts of Interest
The authors declare no conflict of interest.
References
- National Assembly Budget Office. “PM Corresponding Project”, (Korean). Available online: https://www.nabo.go.kr/system/common/JSPservlet/download.jsp?fCode=33315609&fSHC=&fName=%EB%AF%B8%EC%84%B8%EB%A8%BC%EC%A7%80+%EB%8C%80%EC%9D%91+%EC%82%AC%EC%97%85+%EB%B6%84%EC%84%9D.pdf&fMime=application/pdf&fBid=19&flag=bluenet (accessed on 12 April 2021).
- National Institute of Environmental Research. Available online: https://airemiss.nier.go.kr/user/boardList.do?command=view&page=1&boardId=74&boardSeq=303&id=airemiss_040100000000 (accessed on 12 April 2021).
- Kuznet, S. Economic growth and income inequality. Am. Econ. Rev. 1955, 45, 1–28. [Google Scholar]
- Porter, M.E.; Van der Linde, C. Toward a new conception of the environment-competitiveness relationship. J. Econ. Perspect. 1995, 9, 97–118. [Google Scholar] [CrossRef]
- Zhang, N.; Xie, H. Toward green IT: Modeling sustainable production characteristics for Chinese electronic information industry, 1980–2012. Technol. Forecast. Soc. Chang. 2015, 96, 62–70. [Google Scholar] [CrossRef]
- Färe, R.; Grosskopf, S. The review of economics and statistics derivation of shadow prices for undesirable outputs: A distance function approach. Rev. Econ. Stat. 1993, 75, 374–380. [Google Scholar] [CrossRef]
- Lee, M.; Zhang, N. Technical efficiency, shadow price of carbon dioxide emissions, and substitutability for energy in the Chinese manufacturing industries. Energy Econ. 2012, 34, 1492–1497. [Google Scholar] [CrossRef]
- Cui, Q.; Li, Y. The evaluation of transportation energy efficiency: An application of three-stage virtual frontier DEA. Transp. Res. Part D Transp. Environ. 2014, 29, 1–11. [Google Scholar] [CrossRef]
- Chang, Y.; Zhang, N. Environmental efficiency of transportation sectors in China and Korea. Marit. Econ. Logist. 2017, 19, 68–93. [Google Scholar] [CrossRef]
- Nguyen, H.; Chang, Y. Measuring port efficiency using bootstrapped DEA: The case of Vietnamese ports. Marit. Policy Manag. 2016, 43, 644–659. [Google Scholar] [CrossRef]
- Zhang, N.; Chang, Y. Total-factor carbon emission performance of the Chinese transportation industry: A bootstrapped non-radial Malmquist index analysis. Renew. Sustain. Energy Rev. 2015, 41, 584–593. [Google Scholar] [CrossRef]
- Liu, H. Green productivity growth and competition analysis of road transportation at the provincial level employing Global Malmquist-Luenberger Index approach. J. Clean. Prod. 2021, 279, 123677. [Google Scholar] [CrossRef]
- Chang, Y.; Zhang, N.; Danao, D.; Zhang, N. Environmental efficiency of transportation system in China: A non-radial DEA approach. Energy Policy 2013, 58, 277–283. [Google Scholar] [CrossRef]
- Wu, J. Measuring energy and environmental efficiency of transportation systems in China based on a parallel DEA approach. Transp. Res. Part D Transp. Environ. 2016, 48, 460–472. [Google Scholar] [CrossRef]
- Wang, Z.; He, W. CO2 emissions efficiency and marginal abatement costs of the regional transportation sectors in China. Transp. Res. Part D Transp. Environ. 2017, 50, 83–97. [Google Scholar] [CrossRef]
- Bing, G.; Wang, P.; Yang, F.; Liang, L. Energy and Environmental Efficiency of China’s Transportation Sector: A Multidirectional Analysis Approach. Transp. Modeling Manag. 2014, 2014, 539596. [Google Scholar]
- Lin, W.B.; Chen, B.; Xie, L.N.; Pan, H.R. Estimating Energy Consumption of Transport Modes in China Using DEA. Sustainability 2015, 7, 4225–4239. [Google Scholar] [CrossRef]
- Omrani, H.; Shafaat, K.; Alizadeh, A. Integrated data envelopment analysis and cooperative game for evaluating energy efficiency of transportation sector: A case of Iran. Ann. Oper. Res. 2019, 274, 471–499. [Google Scholar] [CrossRef]
- Egilmez, G.; Park, Y.S. Transportation related carbon, energy and water footprint analysis of US manufacturing: An eco-efficiency assessment. Transp. Res. Part D Transp. Environ. 2014, 32, 143–159. [Google Scholar] [CrossRef]
- Song, M.L.; Zhang, G.J.; Zeng, W.X.; Liu, J.H.; Fang, K.N. Railway transportation and environmental efficiency in China. Transp. Res. Part D Transp. Environ. 2016, 48, 488–498. [Google Scholar] [CrossRef]
- Zhou, G.H.; Chung, W.; Zhang, Y.X. Measuring energy efficiency performance of China’s transport sector: A data envelopment analysis approach. Expert Syst. Appl. 2014, 41, 709–722. [Google Scholar] [CrossRef]
- Boban, D.; Evelin, K. Evaluation of Energy-Environment Efficiency of European Transport Sectors: Non-Radial DEA and TOPSIS Approach. Energies 2019, 12, 2907. [Google Scholar]
- Wang, Z.; Feng, C. The impact and economic cost of environmental regulation on energy utilization in China. Appl. Econ. 2014, 27, 3362–3376. [Google Scholar] [CrossRef]
- Mahmoudi, R.; Ali, E. The origins, development and future directions of data envelopment analysis approach in transportation systems. Socio-Econ. Plan. Sci. 2020, 69, 100672. [Google Scholar] [CrossRef]
- Zhang, N.; Choi, Y. Total-factor carbon emission performance of fossil fuel power plants in China: A metafrontier non-radial Malmquist index analysis. Energy Econ. 2013, 40, 549–559. [Google Scholar] [CrossRef]
- Färe, R.; Grosskopf, S. Environmental production functions and environmental directional distance functions. Energy 2007, 32, 1055–1066. [Google Scholar] [CrossRef]
- Yang, F.; Choi, Y.; Lee, H. Life-cycle data envelopment analysis to measure efficiency and cost-effectiveness of environmental regulation in China’s transport sector. Ecol. Indic. 2021, 126, 107717. [Google Scholar] [CrossRef]
- Fäe, R.; Grosskopf, S.; Pasurka, C. Effects on relative efficiency in electric power generation due to environmental controls. Resour. Energy 1986, 8, 167–184. [Google Scholar] [CrossRef]
- Korean Statistical Information Service (KOSIS). Available online: https://kosis.kr (accessed on 12 April 2021).
- National Air Pollutants Emission Service. Available online: http://airemiss.nier.go.kr (accessed on 12 April 2021).
Publisher’s Note: MDPI stays neutral with regard to jurisdictional claims in published maps and institutional affiliations. |
© 2021 by the authors. Licensee MDPI, Basel, Switzerland. This article is an open access article distributed under the terms and conditions of the Creative Commons Attribution (CC BY) license (https://creativecommons.org/licenses/by/4.0/).