Article

Complex Socio-Ecological Systems: Translating Narratives into Future Land Use and Land Cover Scenarios in the Kilombero Catchment, Tanzania

1
Department of Geography, University of Bonn, 53115 Bonn, Germany
2
Centre for Rural Development, Mzumbe University, Morogoro 67311, Tanzania
3
Department of Forest & Environmental Economics, Sokoine University of Agriculture, Chuo Kikuu, Morogoro P.O. Box 3009, Tanzania
4
African Wildlife Foundation, Ifakara, Morogoro P.O. Box 277, Tanzania
5
Department of Economics, Mzumbe University, Morogoro 67311, Tanzania
*
Author to whom correspondence should be addressed.
Sustainability 2021, 13(12), 6552; https://doi.org/10.3390/su13126552
Submission received: 19 May 2021 / Revised: 1 June 2021 / Accepted: 1 June 2021 / Published: 8 June 2021
(This article belongs to the Special Issue Environmental Sustainability of Contemporary Land Use Change)

Abstract

:
The Kilombero wetland in Tanzania is affected by advancing land use and land cover changes (LULCC), where we observe a conflict between development interests and the necessity of conservation measures to maintain the functionalities of the ecosystem. Thus, assessing patterns of LULCC is crucial to foresee potential future developments and to develop sustainable future management strategies. In this study, we use a multi-method scenario approach to assess the spatial implications and underlying driving forces of potential change by (1) developing a System Dynamics Causal Loop Diagram (CLD) to disentangle the underlying socio-economic and ecologic driving forces, (2) deriving a qualitative business-as-usual (BAU) and a conservation scenario from participatory narratives elaborated during a stakeholder workshop, and (3) quantifying the spatial implications of these scenarios with the Land Change Modeler (LCM). Results indicate that under the BAU assumption only 37% of the natural vegetation is expected to persist until 2030 in the wetland. In contrast, strict enforcement of protected areas (conservation scenario) halts further conversion of the wetland. However, both scenarios pinpoint considerable expansions of cropland in the western highlands with potentially serious impacts on catchment-wide hydrological processes. The produced qualitative and quantitative outputs reveal hotspots of possible future change and starting points for advisable further research and management interventions.

1. Introduction

Anthropogenic land use and land cover change (LULCC) is a fundamental component of global change [1]. Primarily driven by the accelerating societal demand for ecosystem goods and services, more than 50% of the terrestrial surfaces are already anthropogenically transformed [2]. This has profound implications on the climate [3], soils [4], water resources [5] as well as biodiversity and ecosystems [6]. On the one hand, the production of food and the use of natural resources are fundamental to human development and the achievement of the Sustainable Development Goals (SDGs). On the other hand, the ongoing conversion and degradation of natural vegetation are at risk to ultimately erode the ability of the biosphere to permanently provide ecosystem goods and services, thus risking the long-term sustainability of human livelihoods and well-being [7]. The assessment of potential future LULCC and its underlying dynamics is therefore crucial for ensuring sustainable land management, development strategies, and conservation measures [8]. LULCC arises from dynamic and multi-scalar interactions of biophysical, socio-economic, and political systems [9]. Scenario analysis is widely applied to investigate possible future pathways of such coupled socio-ecologic systems [9,10,11]. Rather than giving accurate forecasts or predictions, the objective of scenario approaches is to investigate a variety of alternative future trajectories based on coherent and internally consistent assumptions about the development of key driving forces [8,10]. Diverse approaches, frameworks, and methods for scenario analysis exist [10,12,13,14]. Commonly, a distinction is made between qualitative scenarios expressed in narrative storylines and quantitative scenarios usually based on numerical computer models. Qualitative LULCC scenarios provide the benefit that they enable the investigation of complex interrelationships and interdependencies [13,15]. Moreover, qualitative scenarios easily facilitate the communication between scientists, decision-makers, and the public both during the scenario development process and in the presentation of results [15]. Participatory scenario building is increasingly applied since the inclusion of different perspectives and insider knowledge considerably enhances the relevance and legitimacy of scenarios [8,12,15]. At the same time, however, qualitative scenarios are criticized firstly for their difficult reproducibility and secondly for their lack of numerical information, which is considered to prevent further scientific and decision-making processes [12,15]. These criteria are in turn met by quantitative scenarios. Quantitative LULCC scenarios examine potential futures through numerical simulations of the rates, types, and tempo-spatial allocations of land use/land cover (LULC) related to the investigated development paths. The comprehensive modeling process produces detailed and reproducible numerical information, but risks the exclusion of stakeholder knowledge and the loss of communicability [9,13]. Therefore, a combination of both well-elaborated and described qualitative scenarios and quantitative scenarios is well recognized as it makes studies more holistic and robust: The contextualization and inclusiveness of a quantitative scenario can be enriched through qualitative information while a qualitative scenario can become more plausible and meaningful through substantiation with quantitative information [10,13,14,15,16]. Yet, the integration of both qualitative and quantitative scenarios poses a methodological challenge which Alcamo (2008) [15] denotes the reproducibility problem and the conversion problem. The reproducibility problem relates to the fact that the assumptions and logics behind the qualitative scenario storylines are often based on specific participatory processes and therefore difficult to replicate. The conversion problem arises because scenario storylines cannot be directly transformed into numerical model inputs. In order to improve scientific credibility, the transformation process of the underlying assumptions and scenario logics therefore requires a transparent translation process [10,11,13].
This study presents an approach for transparently combining qualitative and quantitative scenario building methods using the Kilombero catchment in Tanzania as an example. By combining the contextual strengths of the qualitative System Dynamics method with participatory narratives on potential future pathways in the Kilombero catchment and a spatial LULCC modeling method, two LULCC scenarios are scrutinized. Hence, the objective of this study is to investigate how participatory narratives on potential future development trajectories in the Kilombero catchment can transparently be translated into quantitative scenarios and made spatially explicit. In doing so, we are able to assess the different impacts of the scenarios on future LULC in the Kilombero catchment, a highly contested area where conflicting land-use interests and pressures collide with the need for more conservation measures to maintain the functionalities of the ecosystem. Thus, our findings build the basis for further research on the consequences of the different LULCC scenarios for biodiversity, hydrological processes, or livelihoods, hereby supporting the identification of intervention priorities and the development of adapted and sustainable future strategies.

2. Materials and Methods
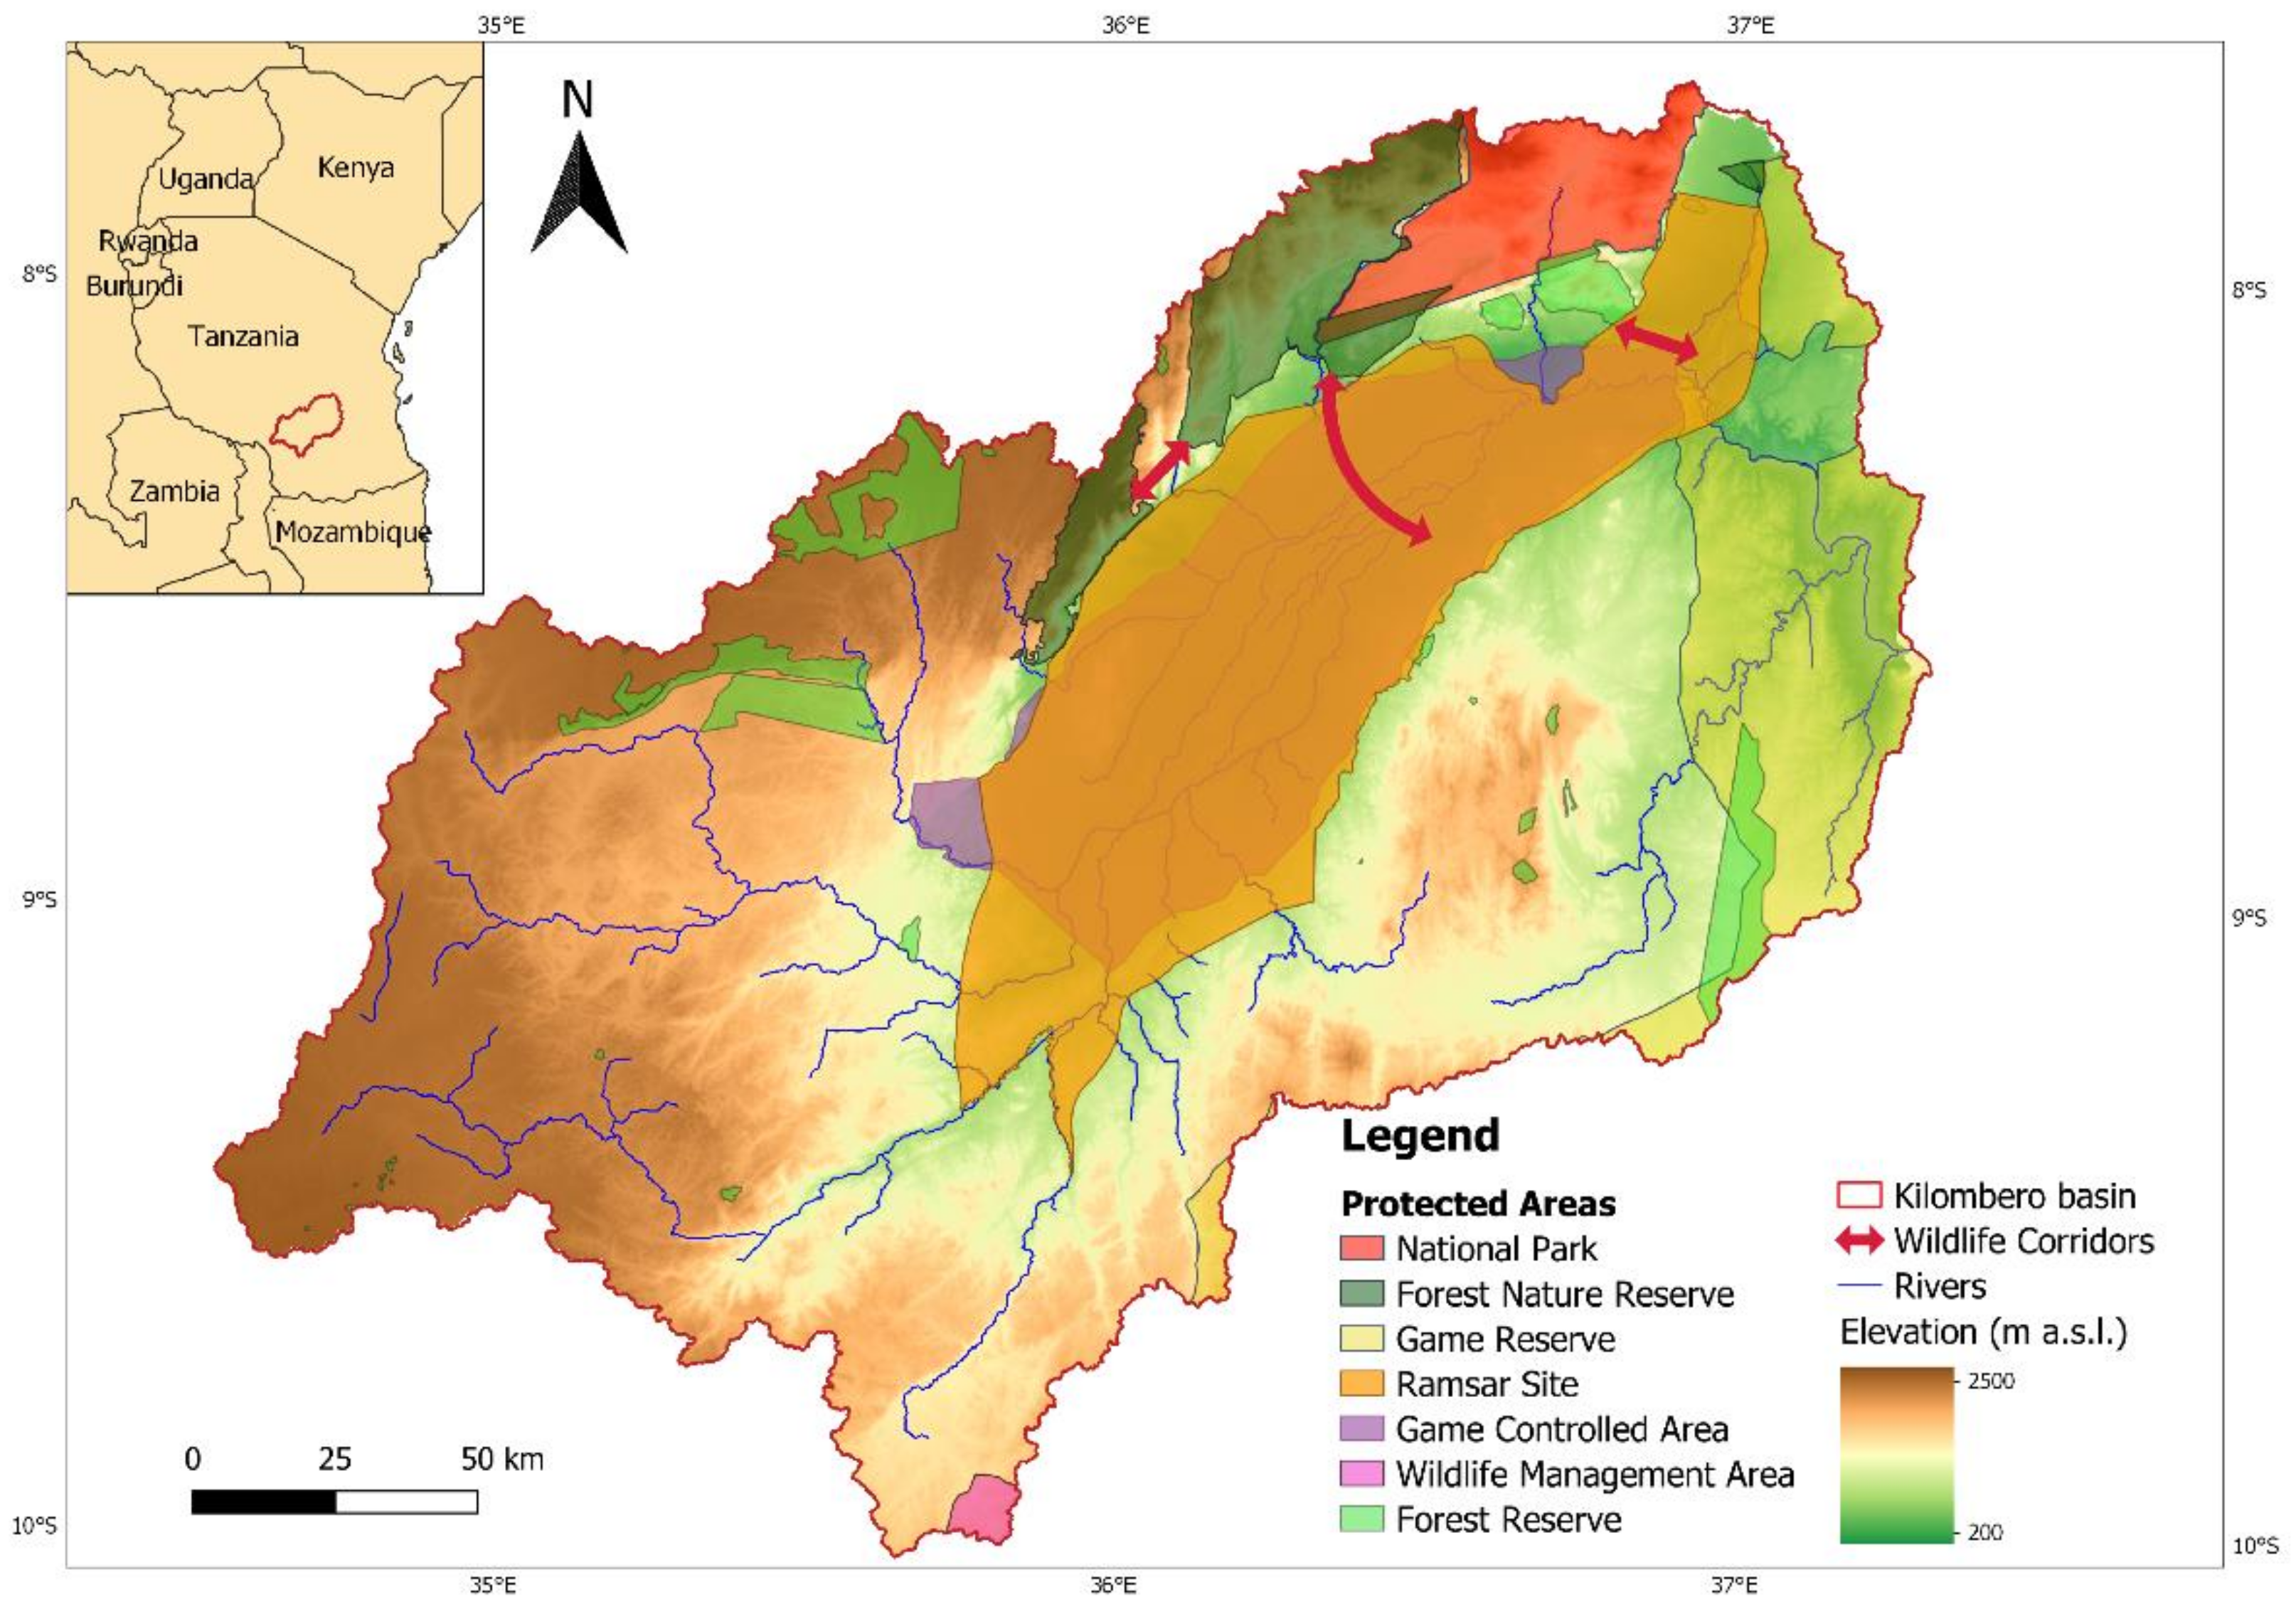
2.1. Study Area

The Kilombero catchment is situated in south central Tanzania in the Morogoro Region (Figure 1). Enclosed by the Mbarika Mountains and Mahenge Highlands in the south and southeast as well as the Udzungwa Mountains in the north and northeast, the catchment covers an area of 40,240 km2. The mountain ranges constitute important habitats for flora and fauna, including several endemic species [17], which is why considerable parts of the catchment area are put under protection (Figure 1). In its wide valley floor, the catchment comprises one of East Africa’s largest freshwater wetlands [18]. The wetland is regularly flooded by the perennial Kilombero River with water levels strongly influenced by the inflow from the upland areas [19]. Due to its outstanding global importance in terms of biodiversity, flow regulation, and nutrient provision, the wetland has been designated as a Ramsar Site since 2002 [20,21].
Concurrently, the valley is often also referred to as the ‘Breadbasket of Tanzania’, as more than 80% of its steadily growing population is engaged in farming [27]. Especially the production of rice in the floodplain is of great national importance [28]. From the 2012 census, it can be deduced that 670,000 people lived in the area in 2012 with a population growth rate exceeding 3% [21]. The high pace of population growth coupled with weak land management led to an unregulated expansion of settlement, livestock, and farming areas [20,21]. As a result, the average farm size declined to only one hectare, resulting in low food security [29,30].
To improve food security, the Kilombero floodplain was targeted as one of the central clusters of the Southern Agricultural Growth Corridor of Tanzania (SAGCOT). As part of the ‘Kilimo Kwanza’ (agriculture first) initiative, introduced by the former president Kikwete in 2010, the objective of the SAGCOT corridor is the reduction of poverty and the improvement of food security through public-private partnerships and the commercialization of agriculture [31]. Following the Green Growth paradigm, a triple-win situation was envisioned that benefited investors, local communities, and nature conservation [32,33]. Yet, the associated expanding large-scale investments (e.g., in rice, sugarcane, or plantations) constitute further competitors for land.
As a consequence of the high land pressure, the LULC of the Kilombero catchment has considerably changed in recent decades [5,19,27,34,35,36]. By 2014, around 18% of the catchment’s natural vegetation had been converted to cropland [36]. Wildlife populations declined considerably [20,37] and former wildlife corridors (Figure 1) are inactive [18,19,23,34,37,38]. This applies, to varying degrees, also to the protected areas found in the Kilombero catchment [18]. In total, the protected area categories considered in this study cover an area of 1,670,296 ha (41% of the catchment) and are characterized by differing conservation goals and levels of enforcement (Table 1) [18,21,39,40,41]. In the Ramsar wetland, for instance, rice now constitutes the dominant LULC category [36] although agriculture and grazing are legally prohibited [40] (section 32 (2) and section 34 (1b)). Facing these ongoing anthropogenic disturbances, the long-term viability of the ecosystem and the Ramsar status of the wetland are endangered [21,42]. A recent study indicates that the ecosystem service values provided by the Kilombero Valley floodplain have already decreased by more than 25% over the past decades [43].
Accordingly, the Kilombero wetland represents an illustrative example of the dichotomy between investment interests and the urgent need for food production on the one hand and the dependency of the population on an intact ecosystem on the other. Since the wetland is embedded in a larger socio-ecological system, a catchment-wide approach is recommended for investigating the degradation of the wetland [44,45,46]. Our multi-method approach for investigating future LULCC scenarios in the catchment is therefore of high relevance not only for the Kilombero Valley itself but can also be transferred to other areas globally.
Table 1. Protected areas within the Kilombero catchment considered in this study. The Nyerere National Park was only established in 2019 and no GIS data are available yet.
CategorySpecificationHuman Use Restrictions
National Park (NP)Udzungwa Mountains NP
Nyerere NP
Only tourism [47,48]
Forest Nature Reserve (FNR)Kilombero FNR
Magombera FNR
Uzunwga Scarp FNR
Only tourism [39]
Game Reserve (GR)Selous Game Reserve
(World Heritage Site)
Only tourism and hunting [40] (section 32–34)
Ramsar Site (RS)Kilombero Valley FloodplainAgriculture and grazing prohibited but not enforced, hunting restricted [40] (section 32–34); [18,21]
Game Controlled Area (GCA)Kilombero GCAAgriculture and grazing prohibited but not enforced, hunting restricted
[40] (section 33–34); [18,21]
Wildlife Management Area (WMA)Mbarang’andu WMAIn this part of the WMA, only tourism and hunting are permitted [41]
Forest Reserves31 Forest ReservesRanging from sustainable timber production to protection [39]

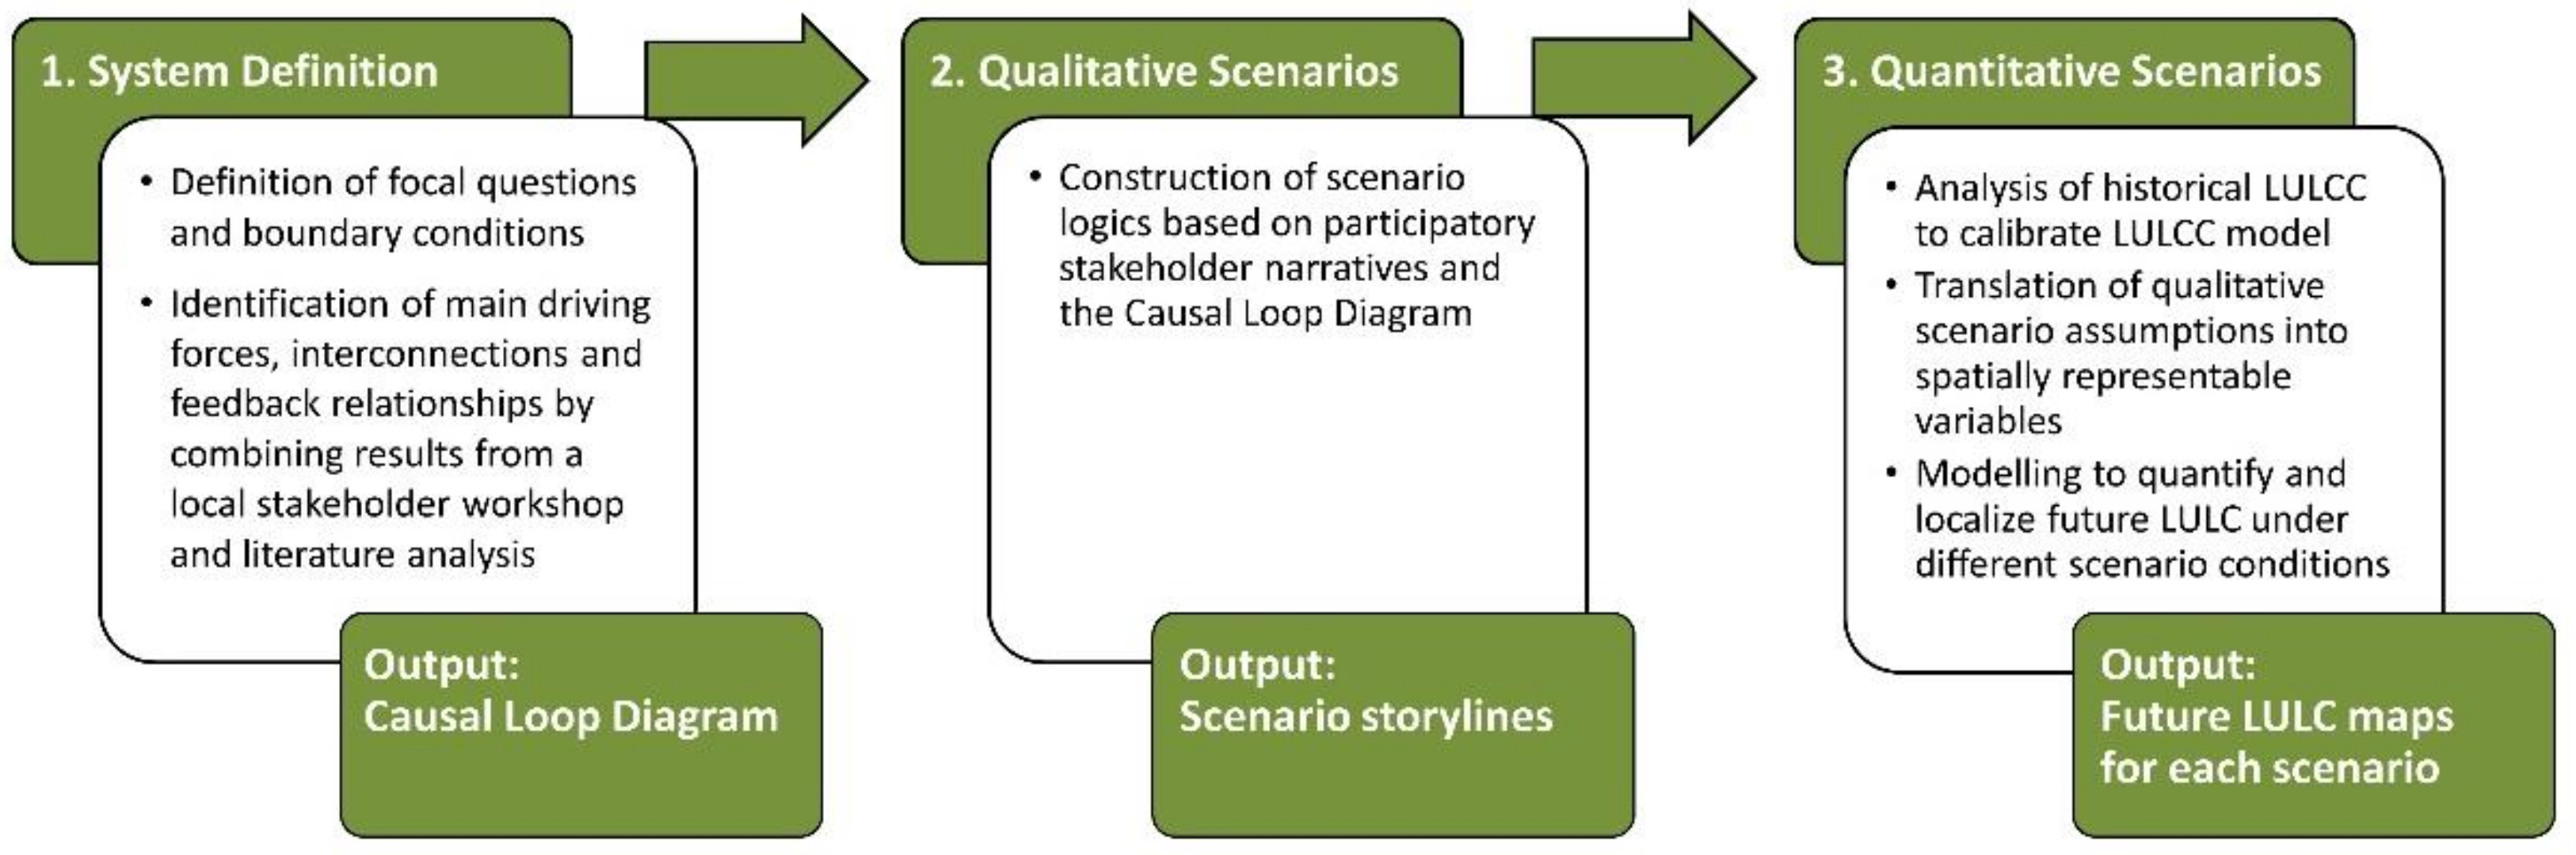
2.2. Conceptual Framework

To assess the spatial implications and underlying driving forces of participatory scenario narratives, a multi-method scenario approach is applied which enables the combination of the strengths of qualitative and quantitative scenario building [13]. First, in order to construct consistent and plausible scenarios, an understanding of the complex driving forces of LULCC in the Kilombero catchment is developed by creating a System Dynamics Causal Loop Diagram (CLD). Second, qualitative scenario logics are constructed based on participatory narratives from a local stakeholder workshop and the CLD. Finally, the qualitative scenarios are translated into quantitative and spatially explicit LULC simulations using the Land Change Modeler (LCM). With this step, we are able to analyze future LULC configurations under the respective scenario conditions (Figure 2).

2.3. Data

Our research forms part of the collaborative research center ‘Future Rural Africa: Future-making and social-ecological transformation’ (sub-project A03: Agro Futures, www.crc228.de). Within this framework, a two-day stakeholder workshop was held at Mzumbe University, Tanzania, in February 2019 [49]. It dealt with the stakeholders’ perceptions of human–water interactions as well as their expectations for future development in the Kilombero catchment, following the guiding question: How is future made in the Kilombero Valley? The workshop included three interactive sessions. First, applying a systems approach, the participants determined prevailing problems, their driving forces and consequences. Second, in a participatory mapping exercise, the stakeholders localized hotspots of current and future LULCC. Third, employing a scenario-building technique, narratives on potential future development pathways for the Kilombero Valley were identified. The 26 Tanzanian workshop participants were purposely selected from different disciplines, targeting representatives engaged in research and academic institutions, national and regional government, local authorities, the SAGCOT initiative, and non-governmental organizations (NGOs). Thereby, different perspectives from conservation, ecology, hydrology, economy, and the social sciences were included.
The central baseline data set used in this study consists of two LULC maps derived from multitemporal metrics of 2004 and 2014 Landsat imagery by Thonfeld et al. 2020 [36], who also provide a detailed description of the methodological processing. The LULC maps provide satisfying overall classification accuracies of 73% (2004) and 71% (2014) respectively [36]. Table 2 provides an overview of the data utilized in this study.

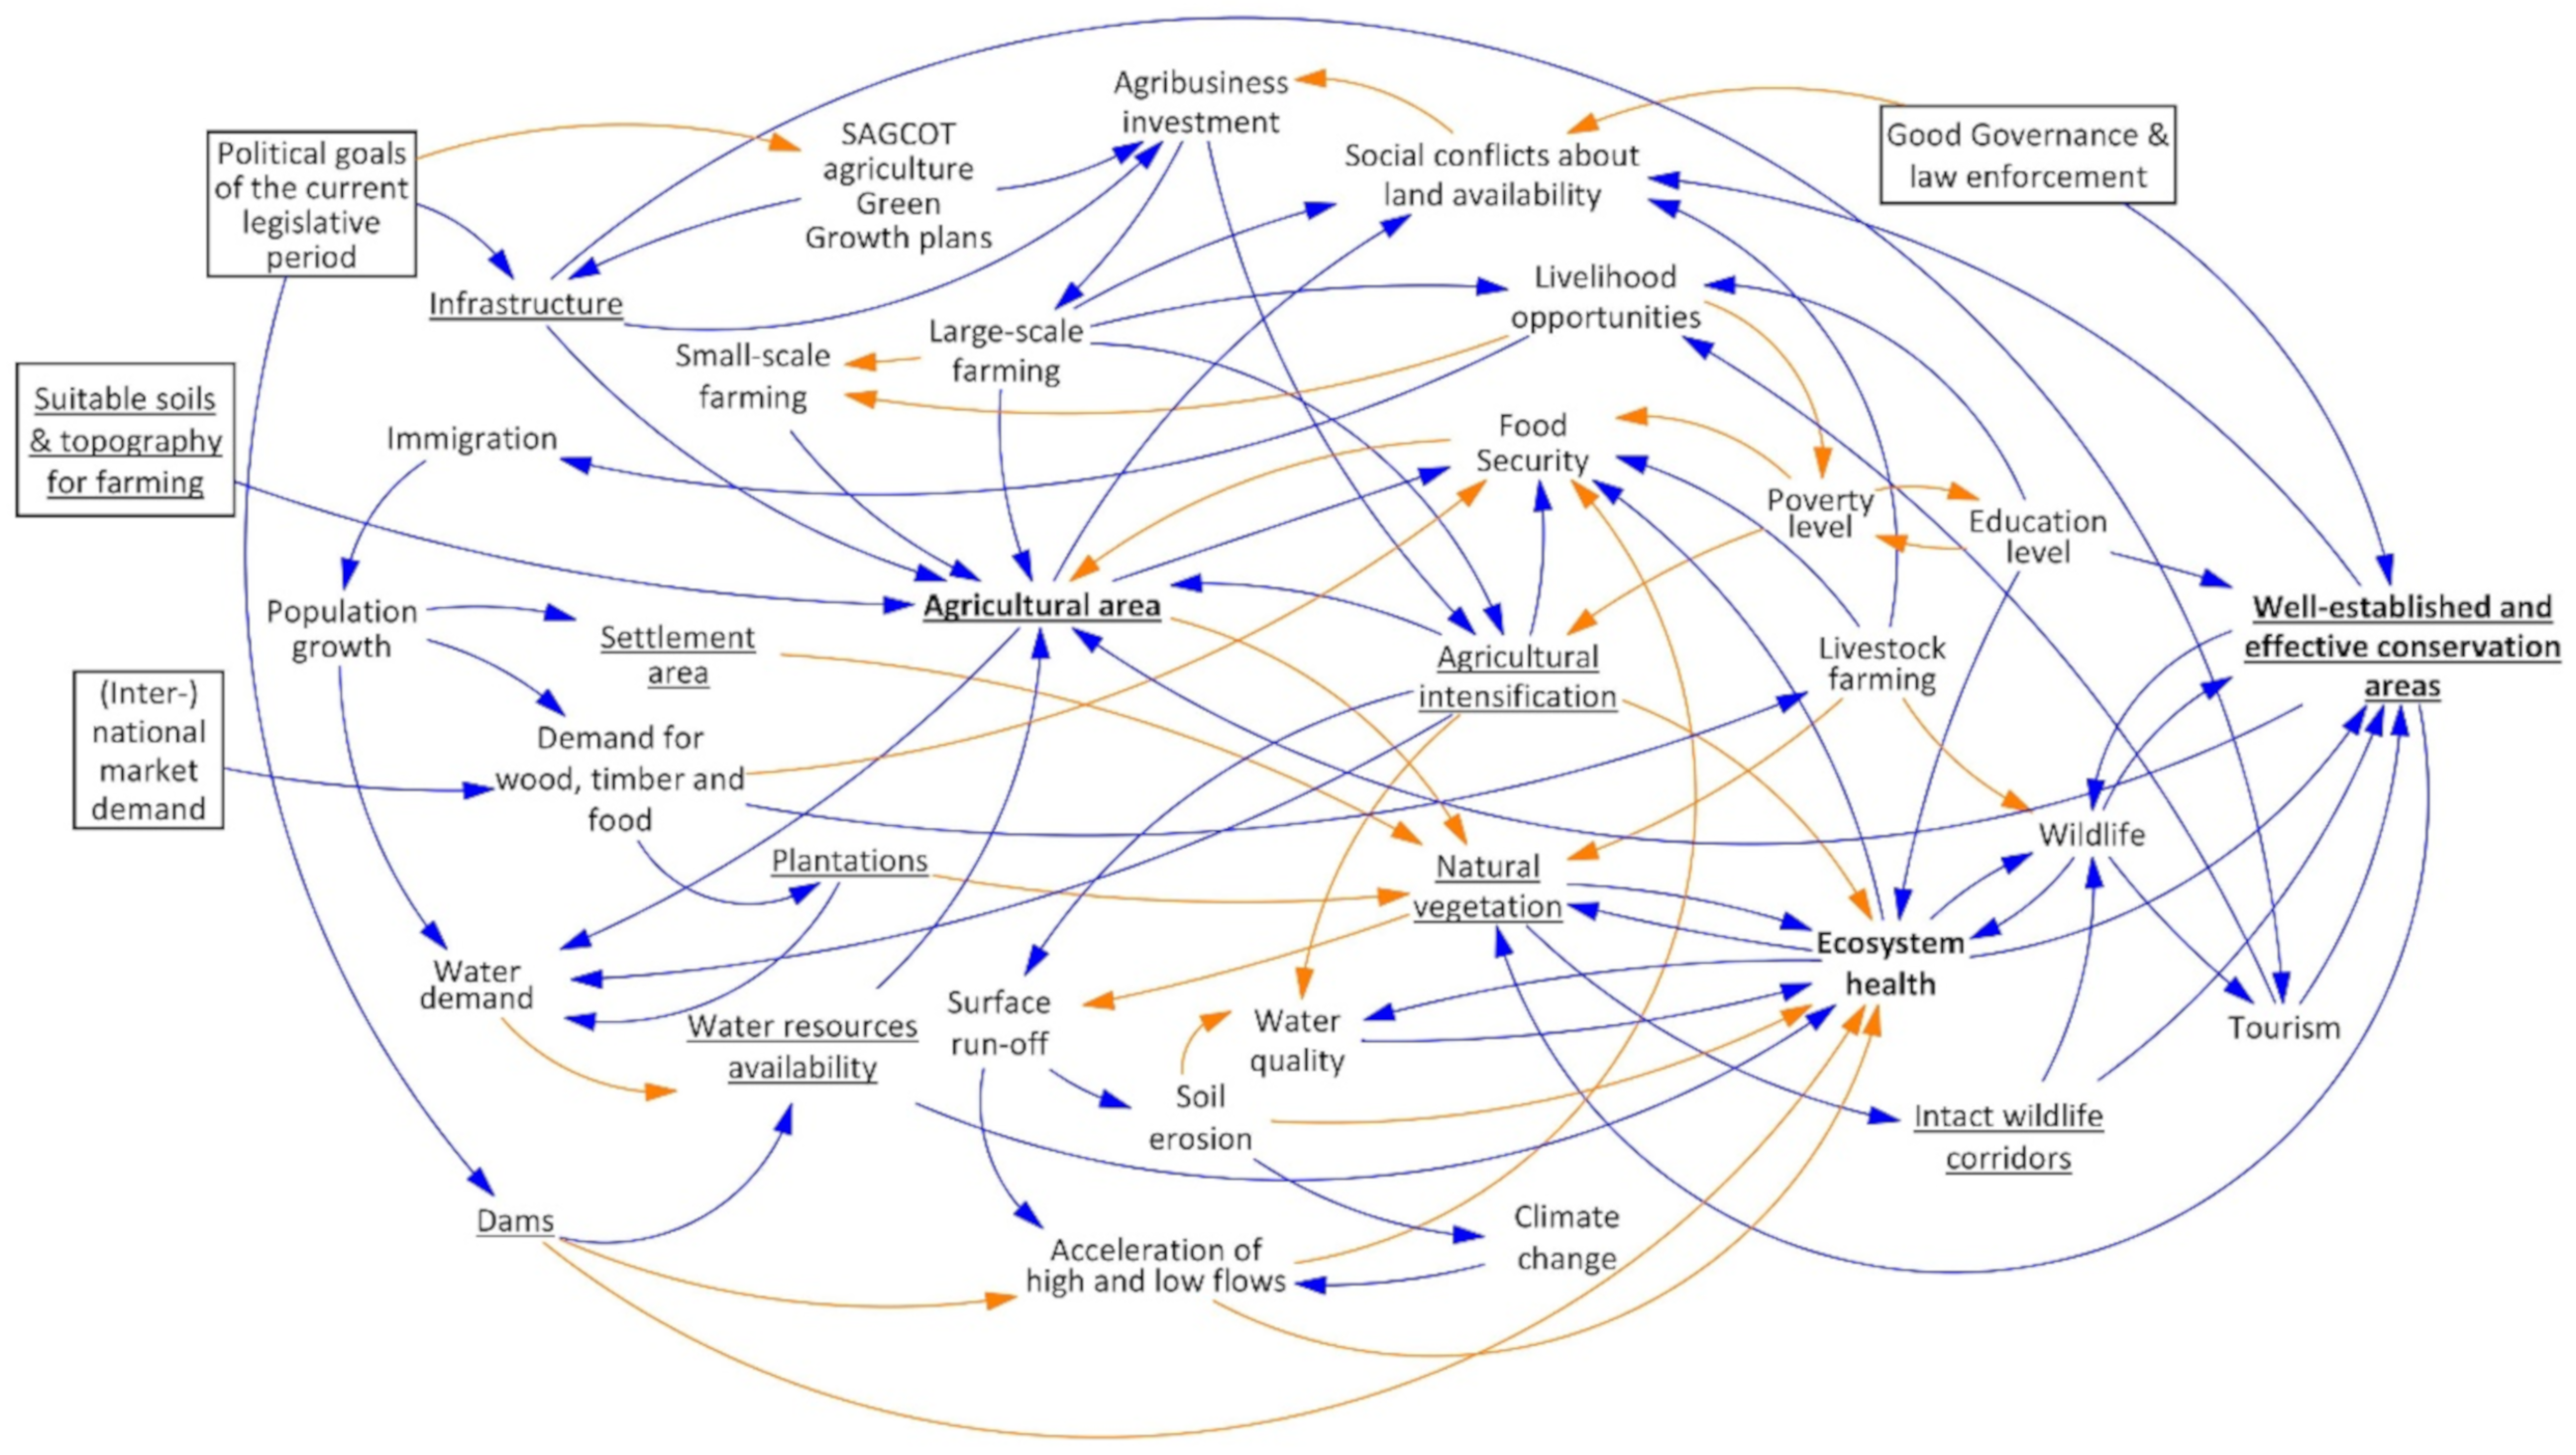
2.4. System Definition—Causal Loop Diagram for Understanding the Complex System of LULCC

For constructing internally consistent and realistic scenario logics, prior identification of driving forces and important factors shaping the investigated developments is essential [10]. Therefore, an approach is required that enables the systematic portrayal and analysis of the cause and effect relationships and feedbacks between the socio-economic, political, and ecological factors contributing to LULCC in the Kilombero catchment [8,45]. Systems thinking allows the reduction of complex phenomena to their main components in order to understand their functioning and interrelations, predict their behavior, and identify opportunities for intervention [52]. Mallampalli et al. (2016) [13] and Kelly et al. (2013) [53] give an overview on different approaches for system analysis. Among these, qualitative System Dynamics was identified as most suitable for this research as it enables an in-depth understanding and description of complex systems through the identification of reciprocal interconnections and feedback relationships between system factors. System dynamics was initially developed by Forrester (1961) [54] in the 1960s for the simulation of industrial and urban dynamics and has been further elaborated ever since [55,56,57]. Today, due to its interdisciplinary scope, it is widely applied in numerous research fields, especially in hydrology and water resource management [58,59], but also in the context of LULCC [60,61] and scenario analysis [13,53,57]. The key strength of qualitative System Dynamics is the graphic representation of the system components, their causal relationships, balancing and self-reinforcing structures as well as central system determinants in Causal Loop Diagrams (CLDs) [58]. A CLD consists of several internal and external factors (or system components). Internal system components are interactive within the system boundaries whereas external factors influence the system though they are not interactive and outside the system boundaries [57]. Within the CLD, causal links between the system components are marked by arrows. The arrows express positive or negative correlations. For instance, if an increase in factor A leads to an increase in factor B, there is a positive relationship between the two factors (change in the same direction). If an increase in factor A leads to a decrease in factor B, the relationship is negative (change in the opposite direction) [56]. In this study, a CLD was developed to analyze and more profoundly understand interconnections and feedback mechanisms leading to LULCC in the Kilombero Valley. Following Coyle (1996) [56], a three-step approach was applied. First, the problem setting, as well as the scope and boundaries, of the study were defined by a review of the literature and an evaluation of the workshop results. Second, the system components of the CLD and their connections were determined using a mixed-method approach combining participatory methods and literature research [13]. In the framework of the workshop, the stakeholders interactively developed CLD outlines to identify current problems, their causes, and consequences [49]. These insights were conceptualized and aggregated to a broader CLD on LULCC in the region, thus representing the experts’ perceptions in a quasi-participatory manner [59]. On the other hand, extensive literature research of both peer-reviewed, as well as grey literature and reports, allowed for substantiation and extension of the CLD [13]. Particular emphasis was put on ensuring that the evaluated literature had an explicit spatial focus on the study area. Using the software Vensim PLE [62], the CLD was subsequently developed in an iterative process; hence several versions of the CLD were created and continuously developed. The third step regarding the qualitative System Dynamics method comprises the analysis of the generated CLD. First, system variables with the most incoming and outgoing arrows were statistically determined to identify key control factors influencing LULCC in the Kilombero catchment. By calculating 90% quantile of all factors, the upper 10% of the system variables with the most incoming and/or outgoing arrows were detected. Second, underlying causal structures and feedback loops leading to and resulting from LULCC were identified. “A loop exists when, starting from a given variable and following arrows in the direction they lead, it is possible to get back to the start, without going through any variable more than once” [56] (p. 21). There are positive and negative feedback loops. Negative feedback loops (B) contain an odd number of negative and positive links [56]. They are self-limiting and have a balancing effect on the system [57]. Positive feedback loops (R), on the other hand, contain either solely positive links or an even number of negative links [56]. They are also referred to as self-reinforcing or exponential loops [57]. If these self-reinforcing loops set desired processes in motion, targeted stimulation of such loops is possible. However, if they increasingly aggravate the situation in a system, corrective measures can be developed to interrupt or balance these feedback processes [56]. Complex CLDs may contain several hundreds of feedback loops. Therefore, the analysis must focus on the most relevant causal loops only [63]. Based on the preceding statistical analysis of central system components, the most relevant feedback loops representing key system mechanisms were identified through a combination of both the automatic loop detection provided by the software Vensim PLE together with a visual examination performed by the researcher.

2.5. Qualitative Scenarios—Deriving Scenarios from Participatory Narratives and the CLD

In this study, scenarios were derived from participatory narratives identified in the stakeholder workshop [14,49]. Stakeholder involvement is a crucial factor to make scenarios more legitimate and plausible as it enables the inclusion of different points of view as well as local knowledge [11]. Applying a participatory scenario building technique, the 26 stakeholders discussed their assumptions and expectations for the future development in the next 10–20 years. In the course of the discussion, the participants concluded on four future narratives, namely the conservation narrative, the agricultural intensification narrative, the livestock intensification narrative as well as the hydropower and dams narrative. Combining these narratives with the central findings of the CLD, two spatially representable scenarios were derived and further investigated (Section 3.1 and Section 3.2).
To construct the underlying assumptions and scenario logics, the preliminarily elaborated CLD, in which driving forces, feedback structures, and key elements were determined, served as an important basis [11,13]. Information from the workshop was combined with literature analysis [13,14]. References of particular relevance for the construction of the scenario logics included studies that have likewise developed scenarios for the Kilombero catchment [5,20,64,65]. In essence, by combining researcher-driven and partici-patory scenario building approaches, both normative and explorative approaches could be included in the scenario logics (see also Section 3.2, especially Table 4).

2.6. Quantitative Scenarios—Spatial LULCC Scenario Modeling

For locating and quantifying the implications of alternative development trajectories for LULC, the narrative-based qualitative scenarios were translated into spatially explicit scenarios. Thereby, the previously developed CLD and the workshop results of the participatory mapping exercise supported the contextualization [13,49]. The simulation of the LULC scenarios was performed using the Land Change Modeler (LCM) [66,67,68] integrated into the IDRISI GIS-Software TerrSet (version 18.31) [67]. The LCM is widely applied in LULC scenario modeling such as deforestation [69], urban growth [70], conservation [71,72], and water resources modeling [5].
The LCM modeling process is divided into three consecutive steps. First, dominant LULC transitions and patterns of change were identified by performing a change analysis between two historic LULC maps of 2004 and 2014 [66]. Given the available data, those years represent the current changes in the Kilombero catchment most appropriately [5]. Second, two transition submodels representing the identified major LULC transformations were calibrated deploying the multi-layer perceptron (MLP) neural network [68,70,71]. The submodel ‘cropland’ included all LULC class transitions from natural vegetation to cropland while the submodel ‘rice’ included all transitions from natural vegetation to rice. A distinction was made between rice and cropland due to the special characteristics of rice and its outstanding role in the floodplain area [5]. Submodel calibration was performed through an empirical evaluation of spatial explanatory variables considered to influence LULCC [72]. The explanatory variables were determined through the application of both qualitative and quantitative methods [9]. First, the preliminarily developed CLD, which depicts factors contributing to LULCC, was examined [61]. Spatially representable system variables were identified, and available region-specific GIS data were collected. As the CLD was developed based on causal loops identified within the stakeholder workshop, the participatory insights were thereby indirectly incorporated into the model [13,49]. Second, literature on driver variables frequently used in the LCM modeling process was reviewed [5,61,69,70,71,72]. Consequently, eight explanatory variables were included for calibrating both submodels: (i) A digital elevation model, (ii) slope gradients, (iii) soil types, and (iv) the evidence likelihood of change for each LULC category as well as distance variables such as (v) the proximity to rivers, (vi) the proximity to roads, (vii) to settlement structures and (viii) to already established rice fields (submodel ‘rice’) or cropland (submodel ‘cropland’) as of 2004. The MLP was run in the automatic training mode including dynamic learning rates and a selection of 10,000 sample pixels per LULC category. The process was repeated multiple times, continuously testing combinations of explanatory driver variables and changing learning rates. The MLP predicts the potential of a pixel to transition derived from the values of the explanatory variables for the respective pixel [71]. It models based on samples of pixels that went through each transition investigated in the submodel as well as on samples that were eligible for the transition but did not go through it. After, the sample pixels are randomly assigned to two groups: Half of the selected pixels are used to calibrate the model; the other half is used to validate how well the model predicts changes expressed through the accuracy rate [68,71]. Since some of the pixels are correctly assigned by pure coincidence, additionally to the accuracy rate also the skill statistic of the model is provided. Potential values of the skill measure can range between −1 and +1 where a skill less than 0 means that the prediction performs worse than chance, while a skill of 1 indicates an entirely correct prediction [68]. After achieving an accuracy rate of 82.62% for the submodel rice and 77.07% for the submodel cropland (skill measures: 0.8 and 0.72), the submodels were simulated to predict the most probable LULC allocation in 2030. To incorporate feedback, the dynamic explanatory variables ‘proximity to settlements’ and ‘proximity to rice/cropland’ were recalculated three times during the simulation process. The quantity of expected LULCC was determined by applying a Markov Chain analysis, extrapolating the observed trends from the 2004 and 2014 LULC maps to the year 2030 [66].
The different scenario assumptions were included in the modeling process by preparing constraints and incentives maps. These exert an influence on the prediction outputs by being multiplied with the individual transition potential maps in the course of the change prediction process. Maps with a value of 0 impose absolute restrictions, whereas a value of 1 has no effect when being multiplied. Yet, a value greater than 1 increases the transition potential thus acting as an incentive [67]. Consequently, according to the respective scenario assumptions, areas that were considered as incentives were classified with a value above 1, while areas that were considered as constraints were in turn classified with a value below 1.

3. Results

The results of the consecutive methods are presented following the conceptual framework (Figure 2). First, the Causal Loop Diagram (Figure 3) with its identified key factors and feedback structures is introduced. Second, the narrative-based scenarios are outlined. Third, the quantitative LULC scenario modeling results are presented.

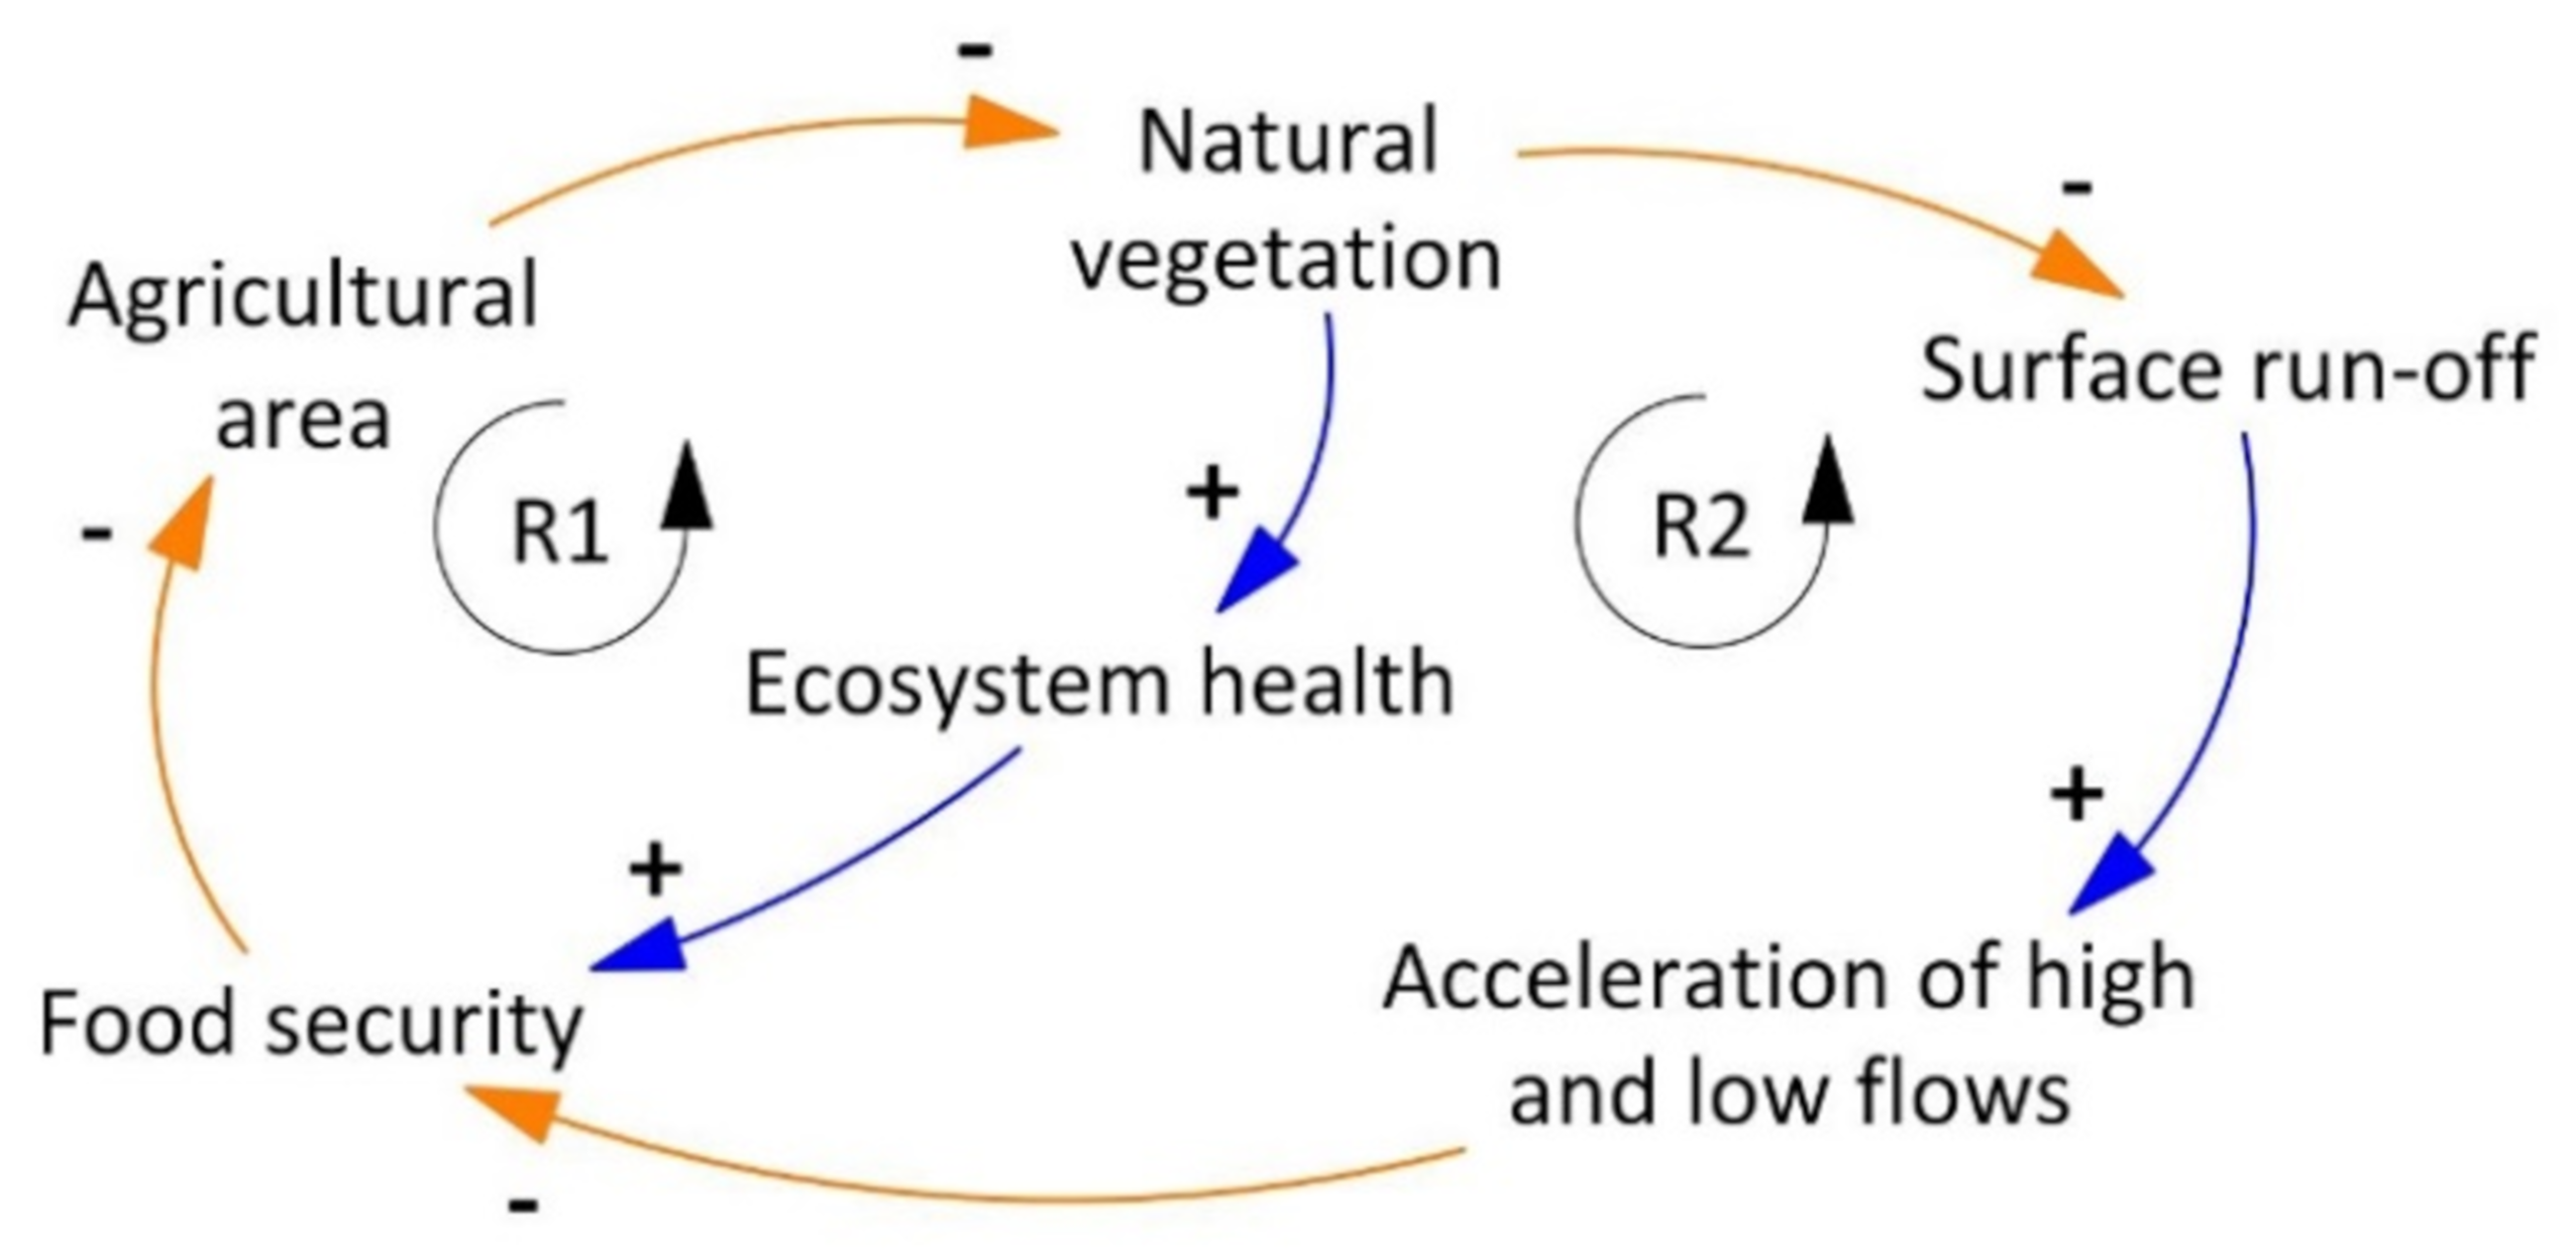
3.1. Socio-Ecological System of LULCC

The CLD visualizes the complex socio-ecological system of LULCC in the Kilombero catchment. To adequately account for the wetland-catchment interactions, the boundary for the diagram was drawn at the catchment level. In total, the CLD (Figure 3) highlights four external factors (rectangular shape) and 32 internal factors. The factors are connected by 183 links (93 outgoing and 90 incoming arrows). All system variables and connections within the CLD are proven by expert knowledge from the stakeholder workshop and/or the evaluation of more than 90 region-specific publications (c).
The CLD contains more than 500 feedback loops. The statistical determination of the 90% quantile revealed that there are three system main factors with more than nine incoming and outgoing arrows within the CLD, namely ecosystem health (14 arrows in total), agricultural area (12 arrows) and well-established and effective conservation areas (10 arrows). Based on these identified factors the following feedback loops were selected, hereby genuinely describing the tension of LULCC in Kilombero catchment, where there is a sensitive interplay between the integrity of the ecosystem, the growing agricultural area and the effort to conserve pristine vegetation. The CLD shows that those factors are embedded within a web of socio-ecological factors fine-tuning the main processes, for example, food security, social conflicts about land availability, or natural vegetation. By focusing on the main factors, we were able to identify balancing (B) and reinforcing loops (R) demonstrating the potential of some factors to redirect change.

3.1.1. Consequences of Agricultural Expansion

The first pair of positive, self-reinforcing feedback loops R1-R2 (Figure 4) concerns the negative consequences agricultural expansion may have for the environment and food security.
Starting from the agricultural area, an increase in cultivated land leads to a decrease in natural vegetation. A decline in natural vegetation affects ecosystem health negatively. The worse the condition of ecosystem health, the less food security prevails. The lower food security, the higher the need to further expand agricultural areas whereby the loop closes (R1). In the long term, this leads to a self-reinforcing deterioration of the situation. The second feedback loop (R2) constitutes an extension of the first feedback loop: The more agricultural area increases, the less natural vegetation is left and the more surface run-off is generated. This in turn results in an acceleration of high and low flows. The longer and more intense high and low flows occur, the further food security is jeopardized. Hence, more agricultural areas are cultivated. The two feedback loops reinforce LULCC through an expansion of agricultural areas at the expense of natural vegetation. This leads to continuing environmental degradation and food insecurity. The references for the drawn connections within the feedback loops are provided in Table 3.

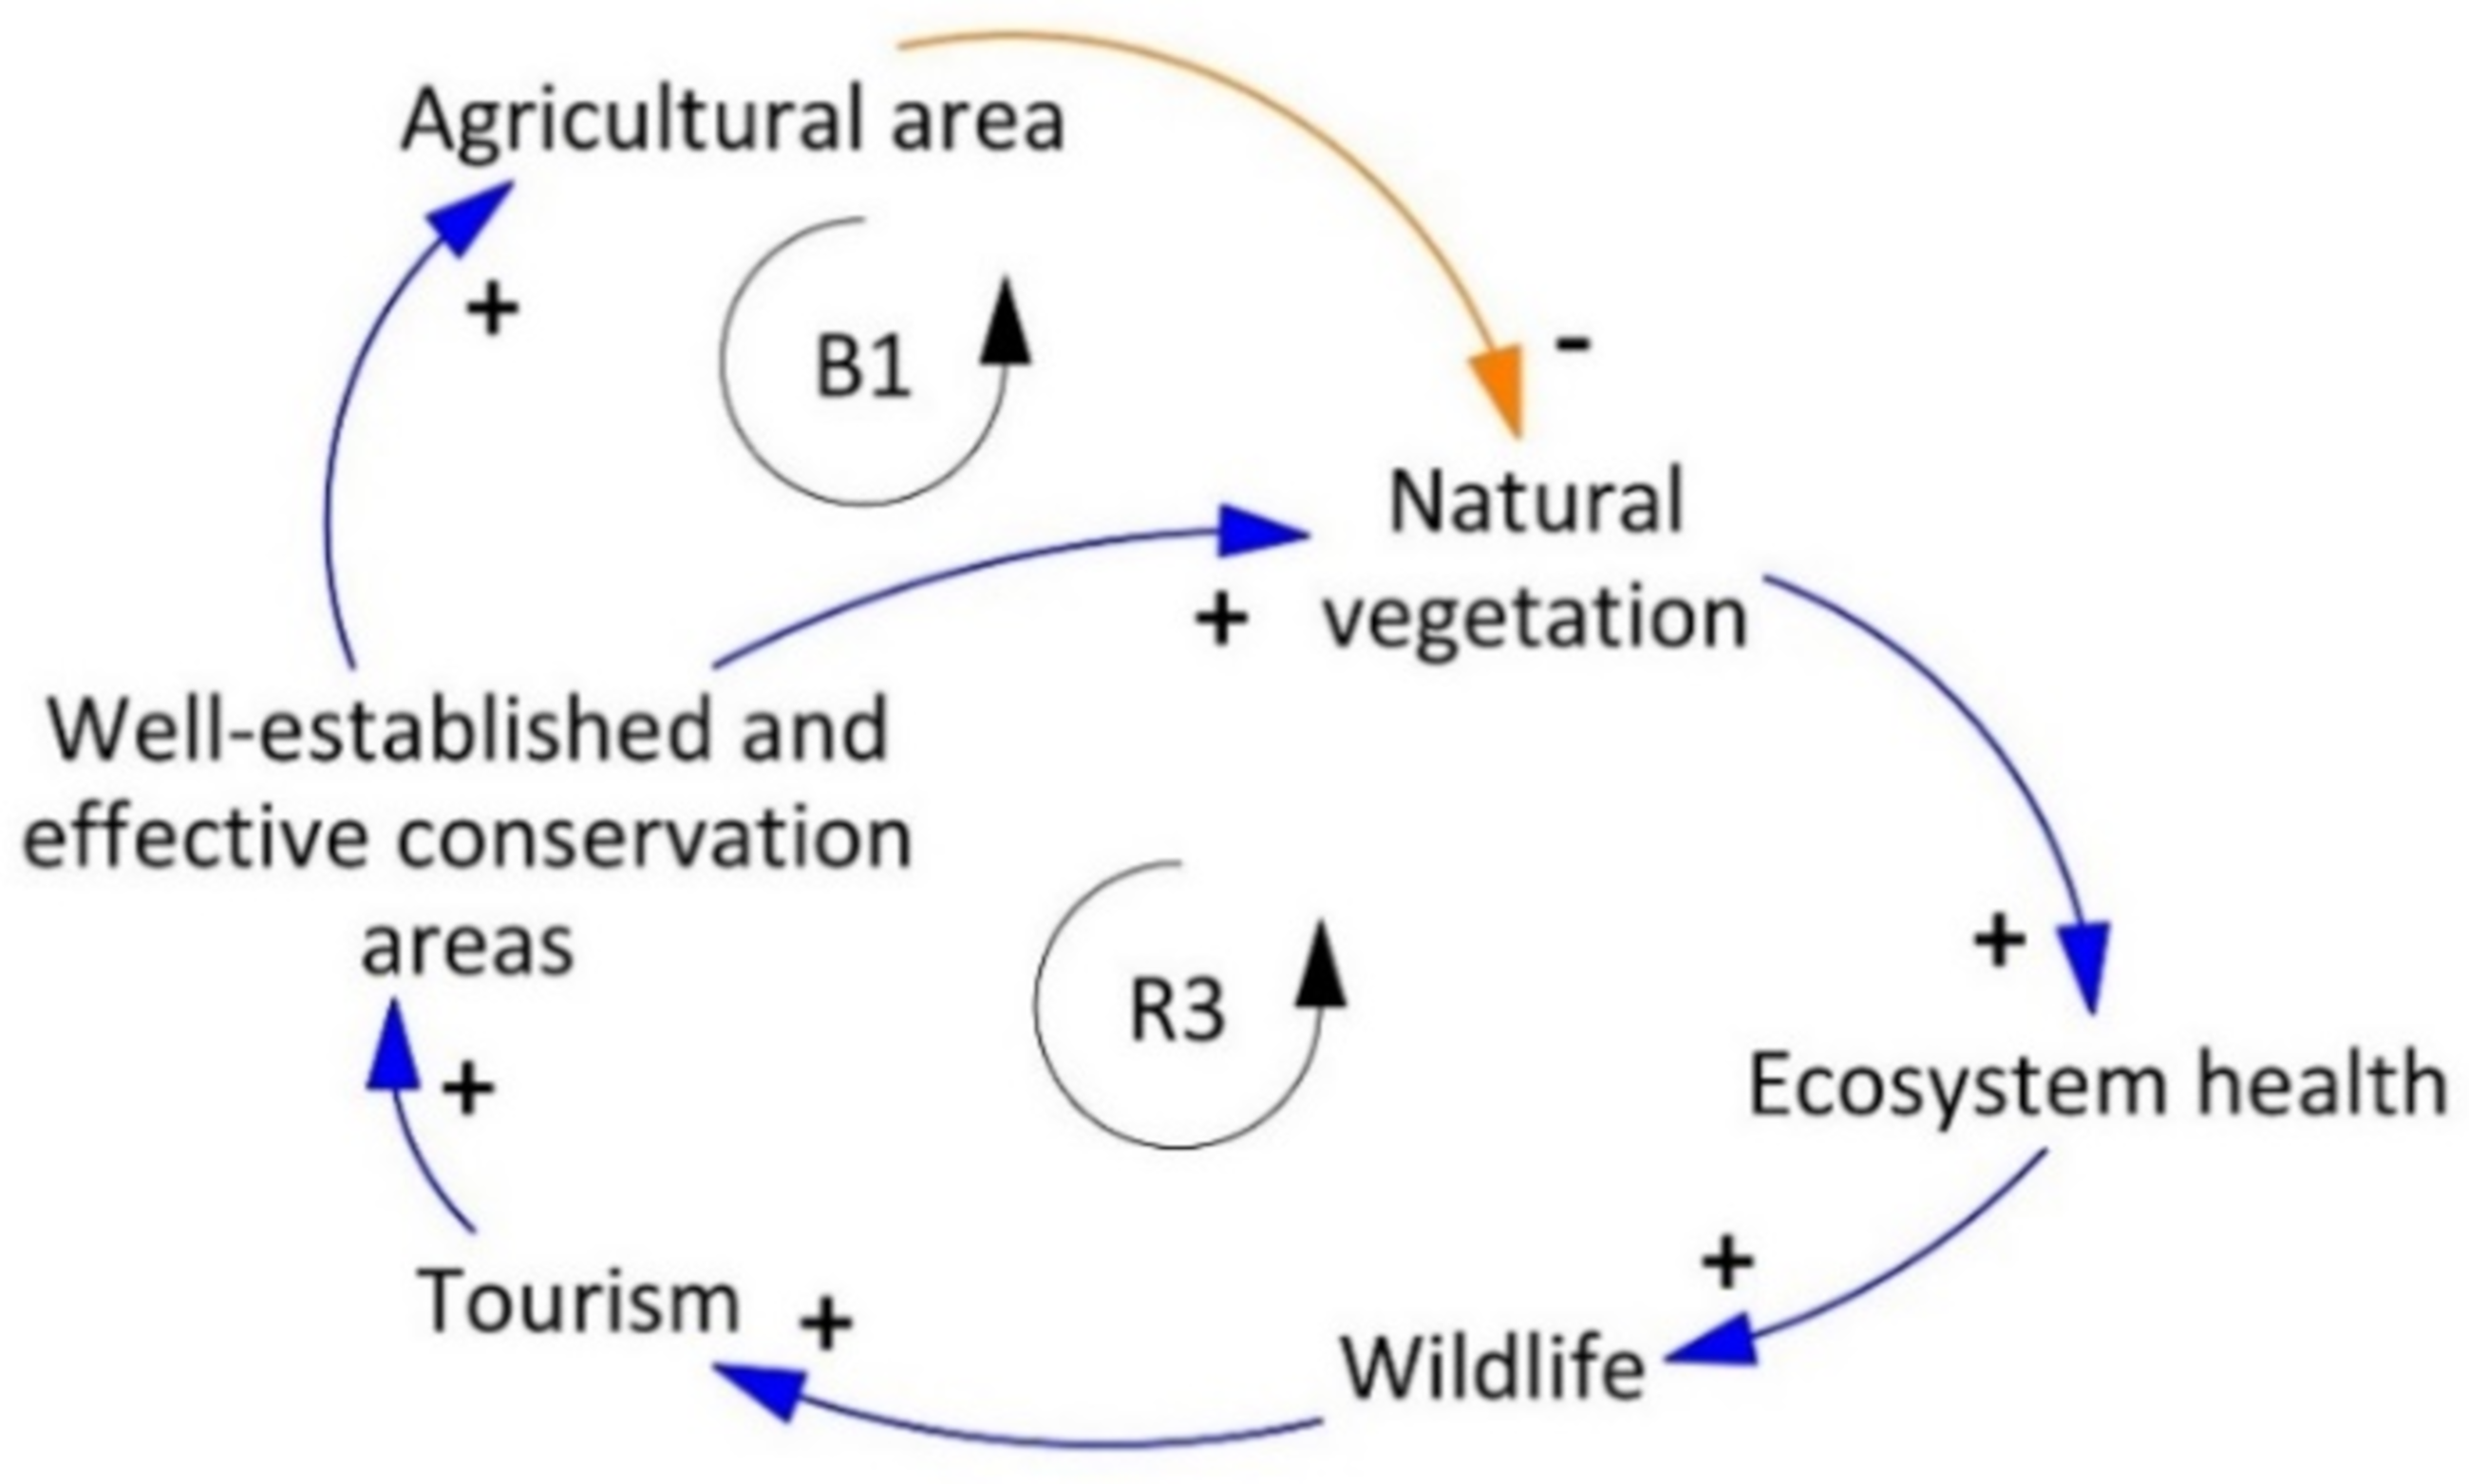
3.1.2. Contrasting Consequences of Conservation Measures

The second pair of feedback loops concern positive and negative consequences conservation measures may have. Feedback loop R3 (Figure 5) demonstrates that conservation areas positively affect the environment and might be self-sustaining through the income generated from tourism. However, these effects might be constrained as conservation measures potentially stimulate LULCC outside protected areas (loop B1, Figure 5).
The more well-established and effective conservation areas there are, the more natural vegetation is resulting in an increase in ecosystem health. The more ecosystem health, the more wildlife exists. The more wildlife is to watch, the more tourists are attracted. The more tourism generates income through park fees, the more money is available for perpetuating well-established and effective conservation areas. Hence, nature conservation efforts benefit the environment and can be continued through tourism (R3). On the contrary, if the situation is the reverse and protected areas are less well-established and effective, this can have negative consequences for both the environment and tourism, leading to a downward spiral.
However, isolated analysis of this feedback loop may be misleading since other interlinkages also influence the variables concerned. The negative feedback loop B1 has a balancing effect on the situation, for instance. The more well-established and effective conservation areas there are, the less land is available for agriculture. Moreover, relocating farmers from their already existing fields may be necessary in the course of enforcing protected areas. The literature review revealed that several studies report on evictions and resettlements of the inhabitants in order to create protected areas [29,73,74]. As a consequence, the population is required to cultivate new areas for their livelihoods, leading to an expansion of agricultural land outside protected areas. This further depletes natural vegetation, which has a balancing effect on feedback loop R3. Additionally, the concerned feedback loops are also interconnected with the feedback loops R1 and R2 described above via the factors agricultural area, natural vegetation, and ecosystem health. The two loops, R3 and B1, highlight the fact that feedback loops are not isolated sub-systems but rather influenced by the other factors interlinked within the CLD. Measures such as nature conservation, which have a positive impact on the environment in one place, can lead to negative repercussions elsewhere. Spatial analysis can clarify these interrelationships.
Table 3. References of the links within the portrayed feedback loops. The connections were identified based on the stakeholder workshop results and a region-specific literature review. An extensive table documenting the references of the entire CLD is given in Appendix A Table A1.
System
Component A
PolaritySystem
Component B
References that Substantiate Link between Component A and B
Acceleration of high and low flowsFood security[18,49,65,75,76]
Agricultural areaNatural vegetation[5,19,27,28,34,35,36,49,77]
Ecosystem health+Wildlife[17,18,21,37,38,49,76,78,79,80,81,82,83,84,85]
+Food security[21,43,49,77,86,87]
Food securityAgricultural area[38,49,73,74,88]
Natural vegetation+Ecosystem health[21,37,43,49,76,77,78,79,80,85,89]
Surface run-off[18,19,44,49,65,75,76]
Surface run-off+Acceleration of high and low flows[19,44,75,76]
Tourism+Well-established and effective conservation areas[20,49,90,91]
Well-established and effective conservation areas+Agricultural area[38,73,74,88]
+Natural vegetation[18,21,49,88,91]
Wildlife+Tourism[30,74,76,84,91]

3.2. Narratives about the Future of the Kilombero Catchment—Qualitative Scenario Development

The stakeholders’ expectations of potential future developments in the Kilombero catchment are clustered in four visions: the conservation narrative, the agricultural intensification narrative, the livestock intensification narrative, as well as the hydropower and dam narrative. The scope of this study required focusing on two spatially representable scenarios. A business-as-usual (BAU) scenario was created, expecting existing trends and policy decisions to continue without any interventions or alterations. It anticipates that the intensification and expansion of agricultural land and the respective degradation of the ecosystem continue unrestrictedly as envisioned in the stakeholders’ intensification narrative.
The second scenario was deduced from the stakeholders’ conservation narrative which was also highlighted by the CLD, where ecosystem health and well-established and effective conservation areas were identified as system main factors (Figure 3). The conservation scenario envisages that protected areas are effectively managed and well protected. It assumes that protected area regulations are enforced and accordingly, where it is legally prohibited, no further land is converted into cropland. Existing anthropogenic land uses however persist. Anthropogenic LULC conversions into wildlife corridors are expected to be reduced. In the CLD, the conservation scenario corresponds to a strong increase of the factor well-established and sustainable conservation areas. An increase in this factor directly and indirectly affects 29 of the 36 CLD system components. The concerned factors reveal the manifold and intertwined consequences a strengthening of the protection efforts in the Kilombero catchment would have. Moreover, the portrayed feedback loops (Figure 4 and Figure 5) outline some of the potential repercussions of the conservation scenario.
Both scenarios further indirectly comprise the hydropower and dam narrative since three planned dams (namely Mpaga Dam, Ruhudji Dam, and Mnyer Dam) indicated by the stakeholders during the participatory mapping exercise were also included in the scenario logics. Due to data unavailability, the livestock intensification narrative was excluded from the analysis.
The time horizon of the scenarios was set to the year 2030 since the narratives of the workshop participants referred to the next 10 to 20 years. Thereby, a 10-year period could be covered, and the outcomes are consistent with the Agenda 2030 Sustainable Development Goals timeline. The detailed underlying assumptions of the two scenarios are presented in Table 4.

3.3. LULCC Scenarios

3.3.1. Translated Quantitative Scenarios

Both the BAU and the conservation scenario assume that the planned road, dams, and irrigation schemes, which were identified by the stakeholders in the participatory mapping exercise, will act as a nucleus for anthropogenic LULCC in the future. The CLD (Figure 3) visualizes these expected developments: An increase in the factor infrastructure leads to the colonization of new agricultural areas. An increase in the factor agricultural intensification which includes irrigation schemes also unlocks new agricultural areas. The construction of dams enhances water availability for cultivation. Creating an incentives map, the value 1.2 was selected to represent these expected developments. In order to account for the nucleus effect, buffers with a radius of 1 km were drawn around the respective planned measures (Table 5).
The conservation scenario presumes that all protected areas are effectively implemented and that only anthropogenic LULCC in accordance with their legal protection status (Table 1) are allowed. Table 5 provides the constraints values assigned to the respective protected area categories. Although no GIS data exist for the Nyerere National Park, it was indirectly included in the analysis as it is located within the boundaries of the larger Selous Game Reserve (Figure 1). In addition, wildlife corridors were included with the constraints value 0.8, thus not completely preventing but reducing anthropogenic LULCC.

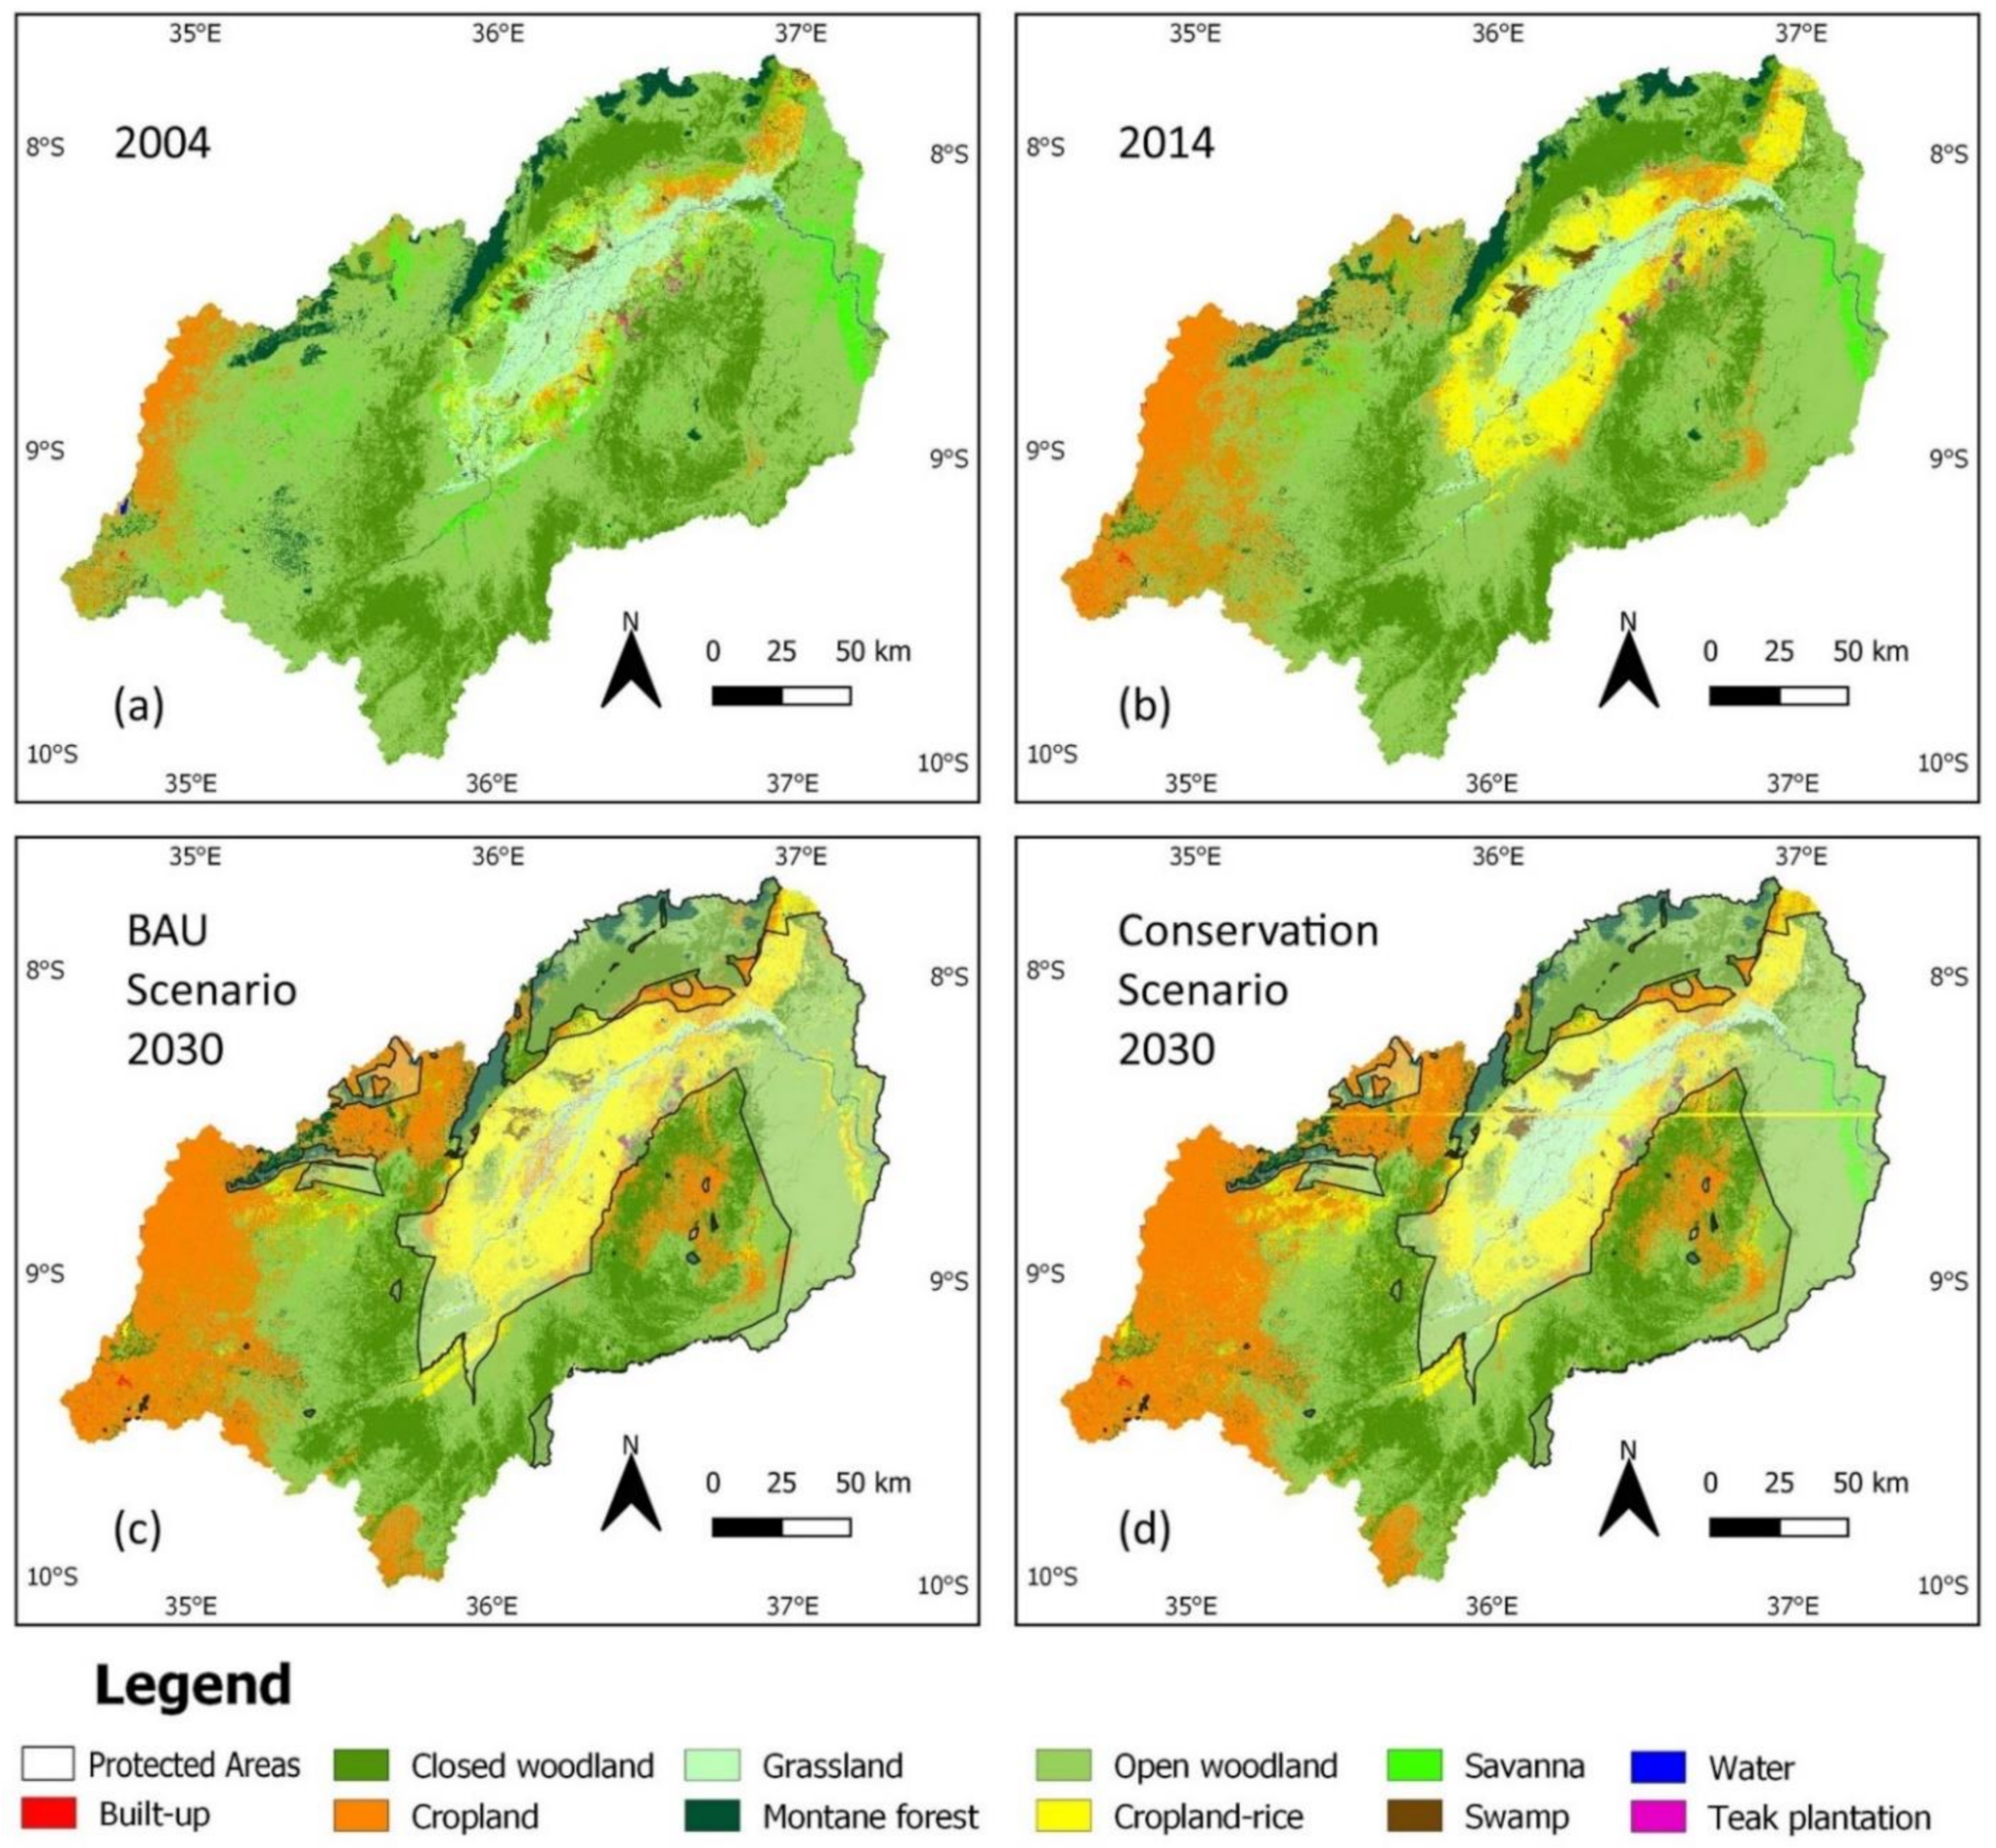
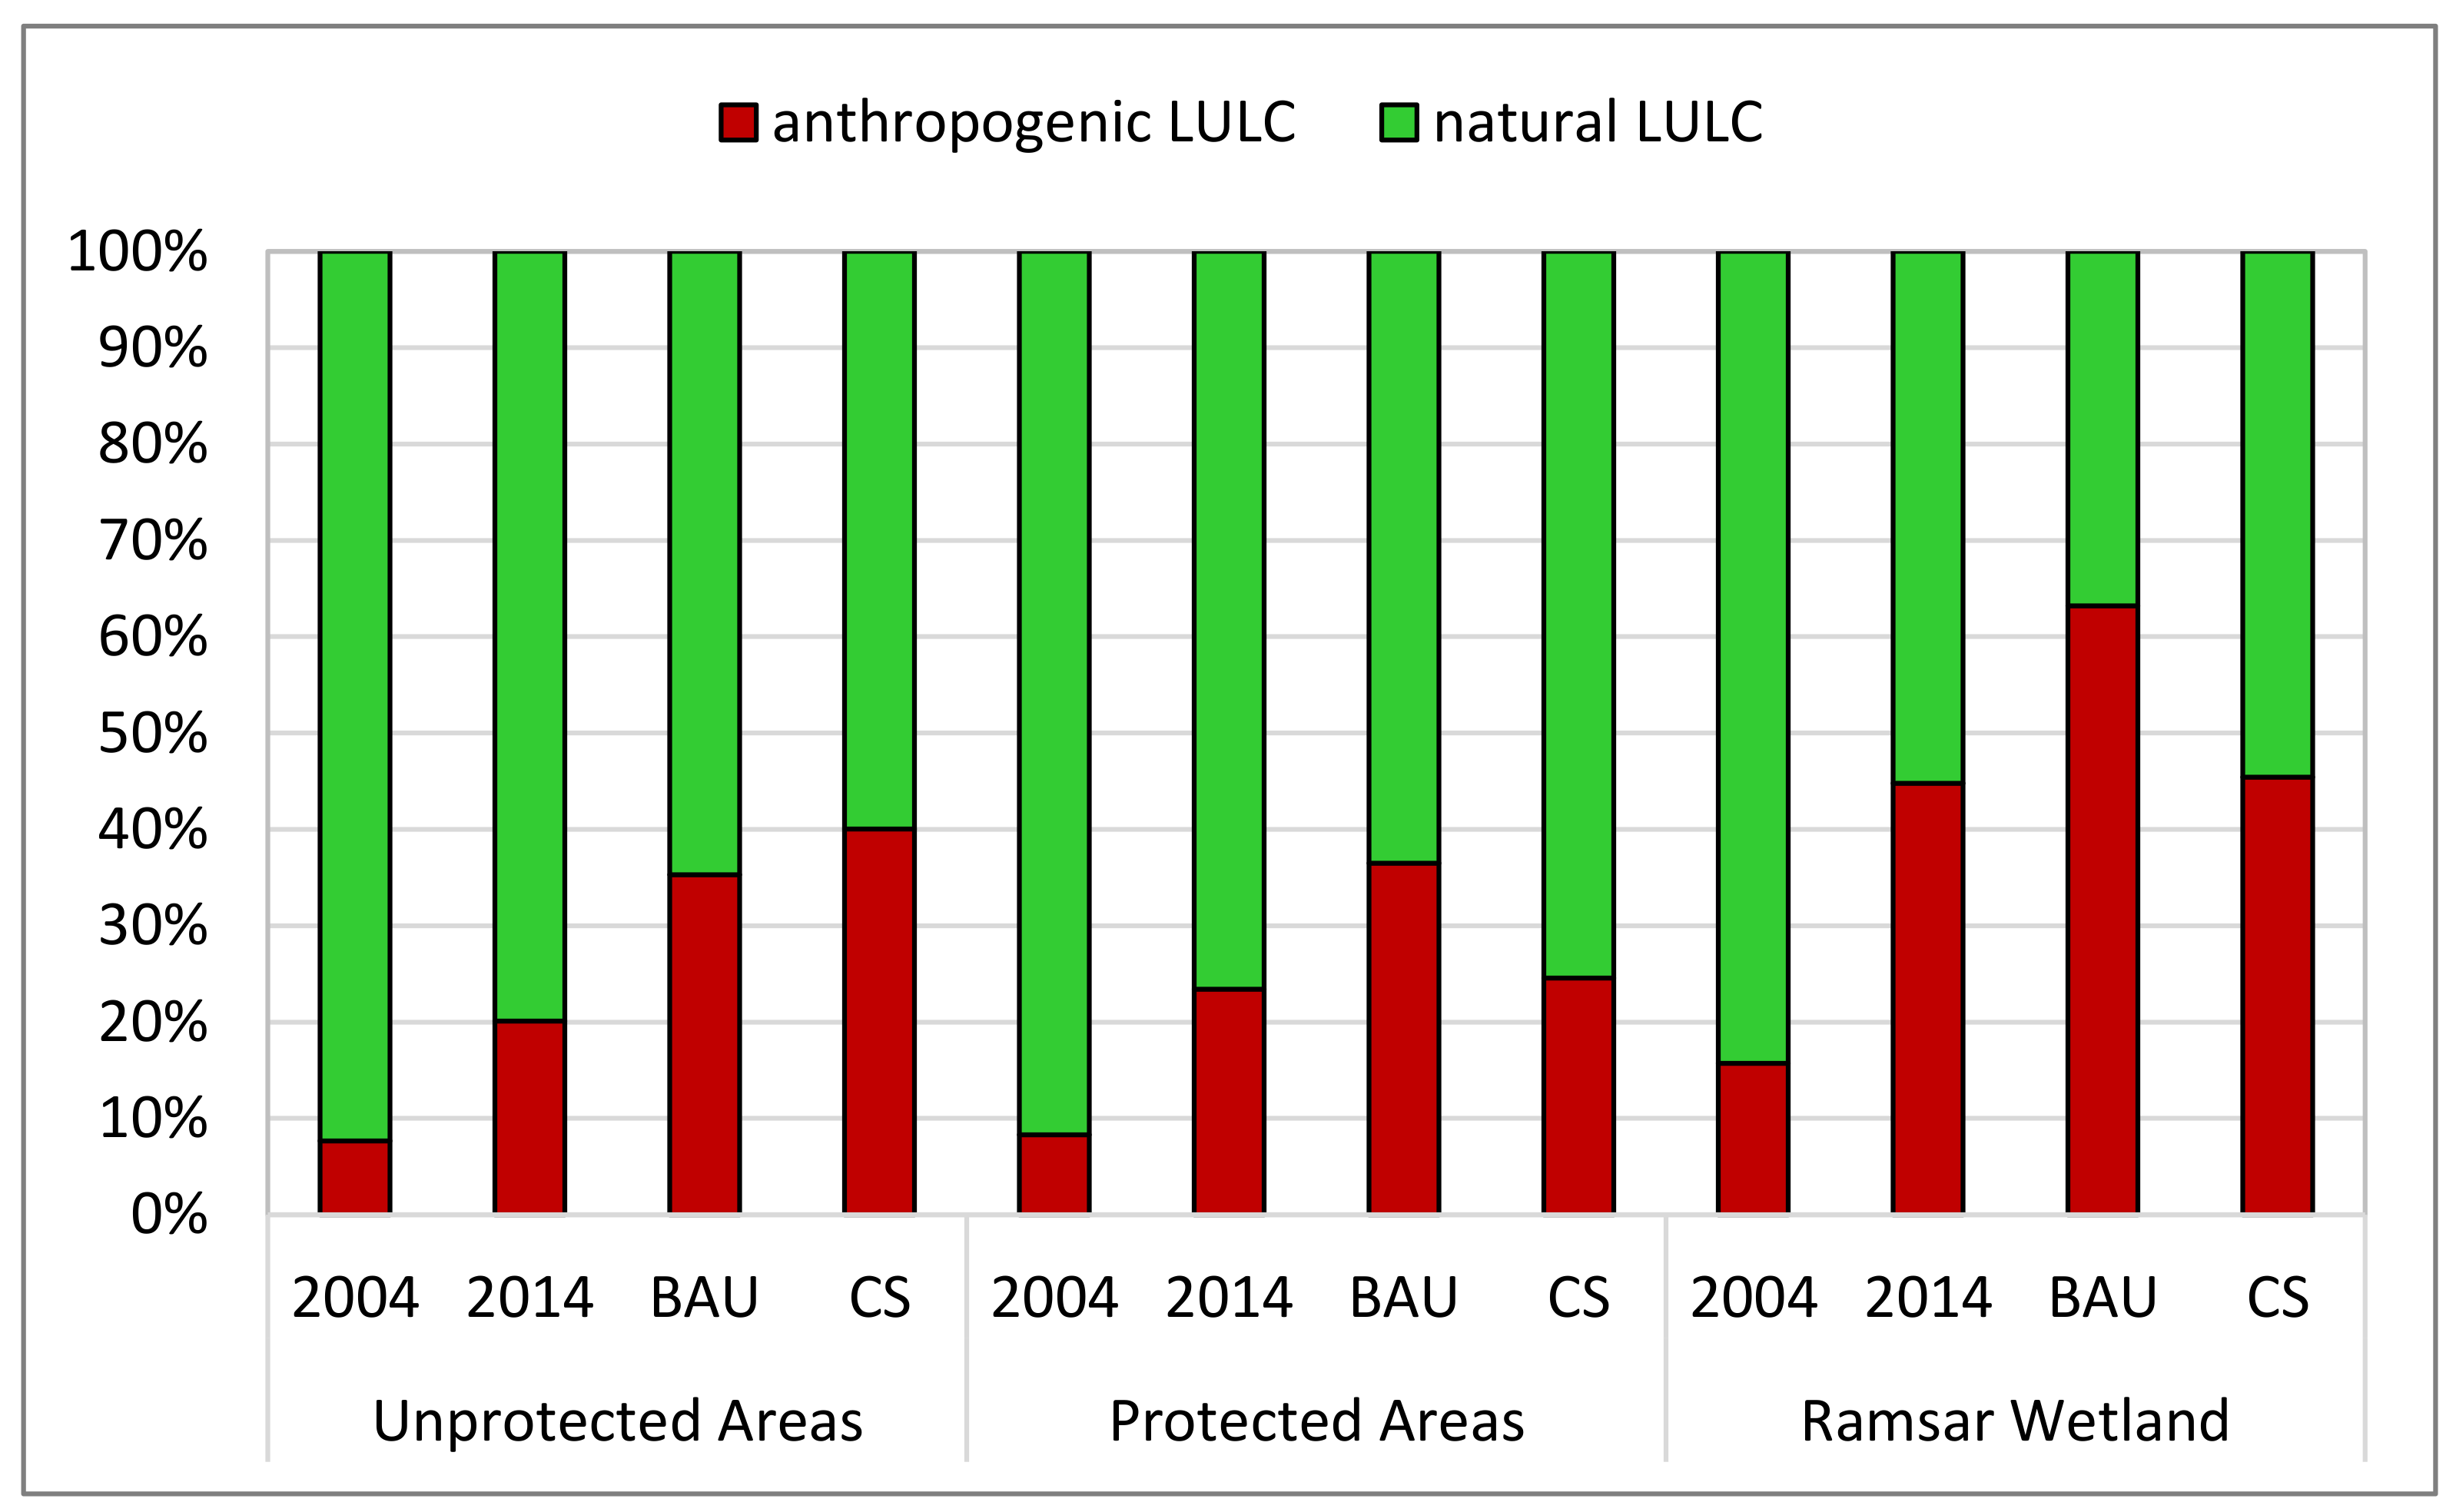
3.3.2. Simulated LULCC Scenarios for 2030

Figure 6c,d presents the results of the LCM for the 2030 scenarios. To reveal projected LULCC within protected areas, their extent is overlain with a semi-transparent layer. The LULC maps of 2004 and 2014 are also portrayed to give a historic context (Figure 6a,b).
The scenario maps highlight two hot spots of change. First, the extent and density of cropland increases in the western, central northern, and southern parts of the catchment. This applies to both scenarios, although the expansion is more pronounced in the conservation scenario. Overall, in both scenarios, cropland expands further in almost all areas where initial conversions were already visible in 2014. Second, in the BAU scenario, rice encroaches nearly the entire floodplain area. Almost 65% of the Ramsar wetland is cultivated with rice and cropland in this scenario. Solely the areas immediately adjacent to the river banks remain covered with grassland. In the conservation scenario, in contrast, the agricultural uses in the Ramsar site and in the other strictly protected areas persist on the level of 2014. For the Ramsar wetland, this corresponds to a share of almost 45% for rice and cropland. Beyond that, areas of rice expansion are noticeable in both scenarios in the northern and western parts of the catchment, partially also in the highlands. Moreover, areas in the east, located along the Kilombero River in the Selous Game Reserve, are converted to cultivated land in the BAU scenario. In the conservation scenario, in contrast, the natural vegetation in this area is not altered.
The Markov Chain analysis revealed that in 2030, land demand for cropland is expected to amount to 8921 km2. This represents an increase of 70% compared to 2014. For rice, land demand is expected to amount to 5401 km2 which corresponds to an increase of 64%. Table 6 compares the calculated land demand for the two LULC classes with the areas actually distributed in the individual scenarios. The table demonstrates that for cropland, the effectively distributed area is almost congruent with the calculated land demand. Deviations account for only −0.45% in the BAU and −2.4% in the conservation scenario. For rice, however, the areas allocated in the conservation scenario differ considerably from the calculated land demand (−14%).
The impact of LULCC on the condition of the ecosystem, biodiversity, or ecosystem services is largely determined by both the intensity of change and the resulting LULCC [18]. While changes within natural LULC classes such as transformations from closed to open woodland may have inferior impacts, conversions from natural land covers to anthropogenic land uses normally have pronounced effects. Figure 7 compares the proportion of anthropogenic and natural LULC in the different scenarios within protected areas, outside protected areas, and in wildlife corridors. Anthropogenic LULC comprises the LULC classes cropland, rice, plantations, and built-up. Montane forest, swamp, water, grassland, savanna, open woodland, and closed woodland were combined and placed in the natural LULC category.
Notably, in the conservation scenario, the share of anthropogenic LULC within protected areas remains at the 2014 level of around 23%. As a counterpart, anthropogenic LULCC in unprotected areas rises by 20% and is even more pronounced than in the BAU scenario. In the BAU scenario, in turn, the share of anthropogenic LULC increases significantly within protected areas. Figure 6c indicates that these conversions particularly concentrate on the Ramsar floodplain where the natural vegetation declines to 37% (Figure 7).
In the conservation scenario, a pixel line classified as rice and to a minor extent as cropland extends horizontally through the map. Furthermore, salt and pepper noise allocations of pixels classified as rice and cropland were observed in the background values of this scenario. An interpretation of this artifact is given in the discussion. Both, the pixel line and the scattered background pixels were excluded from further analysis of the results.

4. Discussion

4.1. Complexity of LULCC Processes

With its 36 system components and 183 links, the developed CLD highlights the complexity of LULCC processes in the Kilombero Valley. Thereby, the catchment scale, which sets the system boundary for the diagram, enables an investigation not only of the processes within the Ramsar wetland itself but also within the surrounding and interconnected socio-ecological system. This wetland-catchment approach is requested by several studies [20,44,46,92] and makes this research a new contribution to the understanding of the dynamic and non-linear driving forces of LULCC in the overall catchment. Notwithstanding the wetland-catchment approach, it must be noted that the processes portrayed do not unfold in isolation, but are in turn influenced by other multi-scalar processes [1]. For this reason, particularly influential exogenous factors are addressed by the inclusion of four ‘external factors’ in the CLD. The development of these external factors lies outside the scope of the considered system boundaries and is therefore subject to great uncertainty [56,58]. Also within the CLD’s system boundaries, many factors and interrelationships could not be included or could only be included in a simplified form. These factors and connections form subsystems for other research interests, such as market price logics [27], detailed influences of climate change [75], or electrification [30]. A compromise between clarity and level of detail had to be found, whereby only the most relevant and scientifically provable connections for this study were included. Therefore, CLDs are never complete representations of actual processes, but always a simplification of reality [57].
The investigated feedback loops R1-R2 (Figure 4) highlight the detrimental and self-reinforcing consequences agricultural expansion may have for the condition of the ecosystem and for food security in the long term. Consequently, these loops underline the necessity of analyzing LULCC trajectories for enabling environmental monitoring and supporting sustainable local and national decision-making [19,60]. Further, the CLD points out that factors and feedback processes are not isolated subsystems but rather connected to and influenced by the overall system [52]. When designing measures aimed at supporting or interrupting loops, the connections within the entire CLD have to be considered. In line with systems thinking for complexity, the dynamic effects of interventions in subsystems must be analyzed in the overall context.
The pair of feedback loops R3 and B1 (Figure 5) indicates that conservation measures may have positive and growth-producing impacts in one place, but negative or balancing effects in another. Yet it is not possible to deduce where and to what extent these effects will materialize. Consequently, this pair of loops highlights the important spatial component of LULCC processes [61] which cannot be covered by the qualitative CLD [13,53,58]. Combining the contextual strengths of the qualitative System Dynamics CLD on the one hand with a spatial LULCC modeling method on the other hand proved to be a suitable approach to build and examine coherent and robust scenarios.

4.2. LULCC Scenarios

Combining qualitative and quantitative methods, two opposing scenarios envisioning future socio-economic and ecologic development trajectories in the Kilombero catchment were analyzed. The reproducibility problem and the conversion problem as described by Alcamo (2008) [15] in integrating qualitative and quantitative scenarios were successfully addressed in this study by contextualizing the underlying scenario assumptions with the CLD. Thereby, both the reproducibility of the qualitative scenarios [15] and the conversion to a quantitative model [13,53] could be enhanced.
The modeled LULC maps for 2030 provide reasonable results. Both submodels yielded good skill measures (rice: 0.8; cropland: 0.72). The western parts of the catchment and the central northern parts constitute hot spots of future cropland expansion. In a recent study, Thonfeld et al. (2020) [18] assessed the potential suitability for anthropogenic use in the catchment area based on morphometric, topographic, and bioclimatic characteristics. They also identified the western and central northern parts as especially suitable.
The scenario LULC maps show a successful differentiation between areas of future cropland and rice production. However, in both scenarios, some rice-growing areas were allocated within the western highlands. This is rather unlikely due to unsuitable climatic conditions in the highlands and since market availability and processing tools there tend to focus on more profitable products rather than land-intensive rice cultivation [5].
Another outstanding hotspot of change in the BAU scenario is the expansion of rice in the Kilombero floodplain. This is confirmed by recent studies [5,18,64] which also highlight the Kilombero floodplain as a hotspot of future anthropogenic pressure. The simulated results suggest that under BAU conditions only 37% of the natural vegetation will be remaining in the Ramsar site until 2030 (Figure 7). The future integrity of the sensitive ecosystem and the Ramsar status are highly questionable given this setup [21]. Yet the modeled extent of the expansion of the rice cultivation area almost up to the riverbed raises questions as crops too close to the riverbed are at risk of being flooded. Cultivation in the central floodplain area would require the floods of the Kilombero River to be regulated [21,36]. This would in turn have serious negative effects on the ecosystem [93].
In the conservation scenario, it is assumed that no further anthropogenic LULCC occurs in protected areas in which it is legally prohibited. The results reveal that this assumption has been successfully implemented in the model as the shares of anthropogenic land uses within protected areas do not increase in the conservation scenario (Figure 7). Outside protected areas, however, the conversion of LULC is even more pronounced as compared to the BAU scenario. Referring to feedback loop B1 (Figure 5), here the dislocation of agricultural conversion is demonstrated. Especially in the western part of the catchment, the density and extent of cropland increase markedly more than in the BAU scenario (Figure 6c,d). This is to be considered critical since the upland areas are of great importance for the water supply of the wetland. Näschen et al. (2018) [44] (p. 20) warn that “(t)he increased share of cropland, which results in a reduced retention capacity, will influence the flow regime, with declining low flows and aggravated flooding”. Conservation areas such as the Ramsar site therefore cannot be considered as isolated systems, but are connected within the overall socio-ecologic system [52]. Hence, these observations justify the catchment-wide approach of this analysis.
With respect to the catchment-wide approach of this study, it has to be acknowledged that the observed changes between 2004 and 2014 were linearly extrapolated to 2030. Consequently, neither external forces such as changes in policies or (inter-)national market demand (Figure 3) nor tipping points or irreversible changes were included. Additionally, not all influencing driver variables of LULCC as identified within the CLD could be included in the LCM submodel calibration due to either data unavailability or because the variables could not be represented spatially. Agribusiness investments in large-scale ventures or the interactions between agricultural expansion and ecosystem health, for instance, therefore, constitute sources of uncertainty in the model. The difficulty to include socio-economic data was also highlighted by other studies [5,16,72]. However, the objective of the quantitative LULCC scenario simulation was not to make pixel-precise predictions but rather to reveal trends and future hotspots of LULCC. Additionally, even though some qualitative data cannot be transferred into the model, these qualitative data are not neglected but build the context and the quantitative results are reflected within this broader qualitative setting. Accordingly, we argue that here the relevance of combining qualitative and quantitative methods for a holistic investigation of scenarios is evident.
Although the two future scenarios differ in terms of their respective spatial distribution of LULC, their absolute amount of progressing LULCC is roughly similar (Table 6). The reason for this is that the calculated land demand (Table 6) in both scenarios is based on the extrapolated trends from 2004 to 2014. Nonetheless, in the conservation scenario, less rice (−14%) and slightly less cropland (−2.4%) was distributed than the actual land demand was calculated. This can be explained by the fact that in view of the constraints in the conservation scenario, a further expansion of agricultural areas in protected areas is not possible. Outside protected areas, however, there appears not to be enough land suitable for rice and crop cultivation. Insufficient pixels with suitable characteristics for rice or cropland are available (Table 6). This also explains the horizontal pixel line classified as rice and subordinately as cropland as well as the salt and pepper noise allocations that are spread over the LULC map of the conservation scenario. Through this over-allocation, the LCM indicates that no more applicable pixels are available [68]. Accordingly, the conservation scenario implies insufficient usable land for agriculture, even though existing farmland is not even reduced. In view of the increasing demand for agricultural products both for the growing population and for the national and international market, this raises questions regarding the future supply of the population with both food and income. The enforcement of strictly protected areas and the halting of LULCC can only be feasible if food production becomes more efficient and/or new sources of income are created in parallel. Agricultural intensification such as the application of fertilizers, pesticides, irrigation, recession cropping, or agricultural machinery has the potential to increase yields and thus enhance agricultural productivity [28,65]. Yet, these measures require careful consideration. The CLD (Figure 3) indicates that even without areal expansion, agricultural intensification may profoundly degrade the ecosystem through surface and groundwater contamination or soil degradation, for instance. Therefore intensification measures must be balanced and should follow eco-efficient and site-specific strategies [28]. For this purpose, the CLD is an excellent tool to evaluate the interdependencies and potential consequences of such measures. Targeted activation of desired self-reinforcing feedback loops on the one hand and the interruption of undesired feedback effects on the other can support the identification of appropriate strategies.

5. Conclusions

The study shows the relevance of understanding the interconnectedness of the coupled socio-economic and ecological system of LULCC and its dynamic and diverging future consequences for designing and implementing sustainable development measures and policies. In line with systems thinking for complexity, the developed Causal Loop Diagram provides a unique level of insight into the non-linear interplay of the manifold interdependent push and pull factors and feedback structures leading to and affected by LULC transformations in the Kilombero catchment. Combining the contextual strengths of the qualitative System Dynamics CLD with participatory narratives on future trajectories in the Kilombero catchment and a spatial LULCC modeling method proved to be a suitable approach to transparently build and examine coherent and robust scenarios. Thereby, the integration of participatory inputs and normative visions in the CLD and scenario building process enabled the inclusion of both bottom-up and top-down perspectives. The two scenarios examined represent diverging paths into the future. Given the BAU assumption of a continuation of all current trends in the future, a collapse of the Kilombero wetland is likely. In this setup, rice encroaches almost the entire Ramsar site, leaving only 37% of natural vegetation. Strict enforcement of protected areas as envisioned in the conservation scenario could halt the degradation of the wetland but exacerbate land scarcity and leave insufficient suitable land for agricultural production. Apart from the expansion of rice, the western part of the catchment is confronted with an immense expansion of cropland areas in both scenarios which is expected to substantially alter hydrological processes in the overall catchment. Both scenarios represent two extremes among a multitude of possible development paths. Which hypotheses will translate into reality depends on the complex interplay of the numerous interlinked factors at play in the Kilombero catchment. However, targeted policy interventions and initiatives can strategically influence future development. The study produced qualitative, quantitative, and spatial outputs that can be used as a basis for such decision-making. Our results build a starting point for further research on the impacts of the different LULCC scenarios on biodiversity, hydrological processes, or livelihoods, thereby supporting the identification of intervention priorities and the development of adapted and sustainable future strategies.

Author Contributions

Conceptualization, K.P., M.E., B.H., and K.N.; methodology, M.E., B.H., K.N., and K.P.; formal analysis, K.P.; investigation, M.E., B.H., K.N., M.C.E., J.S., A.M., and F.M.; writing—original draft preparation, K.P.; writing—review and editing, all authors; visualization, K.P.; supervision, M.E., B.H., and K.N. All authors have read and agreed to the published version of the manuscript.

Funding

This research was funded by the German Research Foundation (DFG) under the CRC/Transregio 228: Future Rural Africa: Future-making and social-ecological transformation (Project Number: 328966760).

Informed Consent Statement

Oral informed consent was obtained from all workshop participants involved in the study.

Data Availability Statement

The data presented in this study are available in the article and Appendix A Table A1.

Acknowledgments

We gratefully acknowledge the participants of our workshop for their contributions. We appreciate that they shared their time, expertise, and experience during the collaborative workshop exercises.

Conflicts of Interest

The authors declare no conflict of interest. The funders had no role in the design of the study; in the collection, analyses, or interpretation of data; in the writing of the manuscript, or in the decision to publish the results.

Appendix A

Table A1. The table explains each system factor of the CLD (Figure 3) and provides the references for the outgoing arrows of each factor. Thus, all arrows are substantiated with literature.
System
Component A
PolaritySystem
Component B
References That Substantiate the Link between Component A and B
Acceleration of high and low flowsFood security[18,49,65,75,76]
Ecosystem health[30,49,65,75]
Agribusiness investments+Large-scale farming[31,33,35,49,90,94,95,96]
+Agricultural intensification[31,36,94,97,98]
Agricultural areaNatural vegetation[5,19,27,28,34,35,36,49,77]
+Water demand[21,65,99]
+Food security[28,32]
+Social conflicts about land availability [20,73,100]
Agricultural intensificationEcosystem health[21,36,42,86,89,101,102]
+Water demand[21,49,94,101,102]
Water quality[21,30,42,86,101,102]
+Agricultural area[27,49,65,103]
+Surface run-off[19,21,49,88]
+Food security[28,32,49,64,65,76,104]
Climate change+Acceleration of high and low flows[5,49,75,76]
DamsEcosystem health[36,49,105,106,107,108,109]
+Water resources availability[20,36,49,105,107]
Acceleration of high and low flows[21,49,93,105,106,107]
Demand for wood, timber and foodFood security[20,38,43,49,64,65,94,110]
+Plantations[20,35,49,88]
+Livestock farming[16,49,78,85]
Ecosystem health+Wildlife[17,18,21,37,38,49,76,78,79,80,81,82,83,84,85]
+Food security[21,43,49,77,86,87]
+Natural vegetation[21,34,36,49,77,80,109]
+Water quality[21,30,43,49,78,86,88,101]
+Well-established and effective conservation areas[18,21,30,79]
Education level+Livelihood opportunities[85,111,112,113]
+Ecosystem health[21,34,49,76,85,88,114]
+Well-established and effective conservation areas[21,34,47,49,76,85,88,114]
-Poverty[85,111,112,113]
Food securityAgricultural area[38,49,73,74,88]
Good governance & law enforcementSocial conflicts about land availability [49,76,96,100,115]
+Well-established and effective conservation areas[21,42,47,49,76,85,88,90]
Immigration+Population growth[38,49,73,74,78,111]
Infrastructure+Agricultural area[20,27,36,49,113,116]
+Agribusiness investment[20,31,49,73]
+Tourism[20,49,84,91]
(Inter)national market demand+Demand for wood, timber and food[18,27,49,94]
Intact wildlife corridors+Wildlife[18,19,22,23,37,38,47,64,83,91]
+Well-established and effective conservation areas[17,18,21,22,91,117]
Large-scale farmingSmall scale farming[38,96,118]
+Agricultural area[35,36,38,78]
+Agricultural intensification[21,35,43,90,98,110]
+Livelihood opportunities[33,38,73,96,115,118,119,120]
+Social conflicts about land availability [38,73,74,84,88,96,111,115,118,119,120,121]
Livelihood opportunitiesSmall-scale farming[38,49,100,112,115,118]
+Immigration[65,84,85,113]
Poverty level[49,85,112,121,122,123]
Livestock farmingNatural vegetation[27,28,34,49,77,82,109,124]
Wildlife[21,34,79,81,85]
+Food security[49,85]
+Social conflicts about land availability [20,33,49,78,85,88,119]
Natural vegetation+Intact wildlife corridors[17,18,19,37,38,64,125]
+Ecosystem health[21,37,43,49,76,77,78,79,80,85,89]
Surface run-off[18,19,44,49,65,75,76]
PlantationsNatural vegetation[18,19,35,38,83,88]
+Water demand[18]
Political goals of the current legislative periodSAGCOT plans[20,73,95,96,115]
+Infrastructure[20,96,105,126,127]
+Dams[20,49,105,126]
Population growth+Settlement area[20,27,49,76,85]
+Water demand[49,99]
+Demand for wood, timber and food[20,27,38,49,64,65,76,85,128]
Poverty levelEducation level[111]
Food security[76,111,118]
Agricultural intensification[36,113,122]
SAGCOT Agriculture Green Growth plans+Infrastructure[31,32,111,129]
+Agribusiness investment[31,32,49,95,96,98,129]
Settlement areaNatural vegetation[5,18,19,27,34,35,38,49]
Small-scale farming+Agricultural area[27,35,38]
Social conflicts about land availability Agribusiness investment[20,33,96]
Soil erosionWater quality[21,29,30,49]
+Climate change[21,64,130]
Ecosystem health[21,27,29,49,110]
Suitable soils and topography for farming+Agricultural area[18,19,27,49]
+Immigration[73,100,111,113]
Surface run-off+Soil erosion[19,27,88,101,110]
+Acceleration of high and low flows[19,44,75,76]
Tourism+Well-established and effective conservation areas[20,49,90,91]
+Livelihood opportunities[20,49,76,84,90,91]
Water demandWater resources availability[21,44,99,101]
Water quality+Ecosystem health[30,42,49,86,101]
Water resources availability+Ecosystem health[44,65,92,101,109]
+Agricultural area[21,36,49,65,107,131]
Well-established and effective conservation areas+Social conflicts about land availability [20,33,38,49,73,74,76,88,91,111,132,133]
+Agricultural area[38,73,74,88]
+Natural vegetation[18,21,49,88,91]
+Wildlife[21,47,49,79,88,91,134]
Wildlife+Tourism[30,74,76,84,91]
+Well-established and effective conservation areas[21,79,88,91]
+Ecosystem health[21,30,80,82]

References

  1. Lambin, E.F.; Meyfroidt, P. Global land use change, economic globalization, and the looming land scarcity. Proc. Natl. Acad. Sci. USA 2011, 108, 3465–3472. [Google Scholar] [CrossRef] [Green Version]
  2. Ellis, E.C.; Goldewijk, K.K.; Siebert, S.; Lightman, D.; Ramankutty, N. Anthropogenic transformation of the biomes, 1700 to 2000. Glob. Ecol. Biogeogr. 2010, 19, 589–606. [Google Scholar] [CrossRef]
  3. Intergovernmental Panel on Climate Change. Climate Change and Land: An IPCC Special Report on Climate Change, Desertification, Land Degradation, Sustainable Land Management, Food Security, and Greenhouse Gas Fluxes in Terrestrial Ecosystems. Available online: https://www.ipcc.ch/site/assets/uploads/2019/11/SRCCL-Full-Report-Compiled-191128.pdf (accessed on 23 November 2020).
  4. Kopittke, P.M.; Menzies, N.W.; Wang, P.; McKenna, B.A.; Lombi, E. Soil and the intensification of agriculture for global food security. Environ. Int. 2019, 132, 105078. [Google Scholar] [CrossRef] [PubMed]
  5. Näschen, K.; Diekkrüger, B.; Evers, M.; Höllermann, B.; Steinbach, S.; Thonfeld, F. The Impact of Land Use/Land Cover Change (LULCC) on Water Resources in a Tropical Catchment in Tanzania under Different Climate Change Scenarios. Sustainability 2019, 11, 7083. [Google Scholar] [CrossRef] [Green Version]
  6. Newbold, T.; Hudson, L.N.; Hill, S.L.L.; Contu, S.; Lysenko, I.; Senior, R.A.; Börger, L.; Bennett, D.J.; Choimes, A.; Collen, B.; et al. Global effects of land use on local terrestrial biodiversity. Nature 2015, 520, 45–50. [Google Scholar] [CrossRef] [Green Version]
  7. Foley, J.A.; Defries, R.; Asner, G.P.; Barford, C.; Bonan, G.; Carpenter, S.R.; Chapin, F.S.; Coe, M.T.; Daily, G.C.; Gibbs, H.K.; et al. Global consequences of land use. Science 2005, 309, 570–574. [Google Scholar] [CrossRef] [PubMed] [Green Version]
  8. Rounsevell, M.D.A.; Pedroli, B.; Erb, K.-H.; Gramberger, M.; Busck, A.G.; Haberl, H.; Kristensen, S.; Kuemmerle, T.; Lavorel, S.; Lindner, M.; et al. Challenges for land system science. Land Use Policy 2012, 29, 899–910. [Google Scholar] [CrossRef]
  9. Verburg, P.H.; Kok, K.; Pontius, R.G.; Veldkamp, A. Modeling Land-Use and Land-Cover Change. In Land-Use and Land-Cover Change: Local Processes and Global Impacts; Lambin, E.F., Geist, H., Eds.; Springer: Berlin, Heidelberg, 2006; pp. 117–135. ISBN 978-3-540-32201-6. [Google Scholar]
  10. Amer, M.; Daim, T.U.; Jetter, A. A Review of Scenario Planning. Futures 2013, 46, 23–40. [Google Scholar] [CrossRef]
  11. Alcamo, J.; Henrichs, T. Chapter Two: Towards Guidelines for Environmental Scenario Analysis. In Environmental Futures: The Practice of Environmental Scenario Analysis; Alcamo, J., Ed.; Elsevier: Amsterdam, The Netherlands; Boston, MA, USA, 2008; pp. 13–35. ISBN 9780444532930. [Google Scholar]
  12. Dong, C.; Schoups, G.; van de Giesen, N. Scenario development for water resource planning and management: A review. Technol. Forecast Soc. Chang. 2013, 80, 749–761. [Google Scholar] [CrossRef]
  13. Mallampalli, V.R.; Mavrommati, G.; Thompson, J.; Duveneck, M.; Meyer, S.; Ligmann-Zielinska, A.; Druschke, C.G.; Hychka, K.; Kenney, M.A.; Kok, K.; et al. Methods for translating narrative scenarios into quantitative assessments of land use change. Environ. Model Softw. 2016, 82, 7–20. [Google Scholar] [CrossRef] [Green Version]
  14. Van Notten, P. Scenario development: A typology of approaches. In Think Scenarios, Rethink Education; Organisation for Economic Co-operation and Development—OECD: Paris, France, 2006. [Google Scholar]
  15. Alcamo, J. Chapter Six: The SAS Approach: Combining Qualitative and Quantitative Knowledge in Environmental Scenarios. In Environmental Futures: The Practice of Environmental Scenario Analysis; Alcamo, J., Ed.; Elsevier: Amsterdam, The Netherlands; Boston, MA, USA, 2008; pp. 123–150. ISBN 9780444532930. [Google Scholar]
  16. Capitani, C.; Mukama, K.; Mbilinyi, B.; Malugu, I.O.; Munishi, P.K.T.; Burgess, N.D.; Platts, P.J.; Sallu, S.M.; Marchant, R. From local scenarios to national maps: A participatory framework for envisioning the future of Tanzania. Ecol. Soc. 2016, 21, 4. [Google Scholar] [CrossRef] [Green Version]
  17. Rovero, F.; Jones, T. Wildlife Corridors in the Udzungwa Mountains of Tanzania. Ecol. Restor. 2012, 30, 282–285. [Google Scholar] [CrossRef]
  18. Thonfeld, F.; Steinbach, S.; Muro, J.; Hentze, K.; Games, I.; Näschen, K.; Kauzeni, P.F. The impact of anthropogenic land use change on the protected areas of the Kilombero catchment, Tanzania. ISPRS J. Photogramm. Remote Sens. 2020, 168, 41–55. [Google Scholar] [CrossRef]
  19. Leemhuis, C.; Thonfeld, F.; Näschen, K.; Steinbach, S.; Muro, J.; Strauch, A.; López, A.; Daconto, G.; Games, I.; Diekkrüger, B. Sustainability in the Food-Water-Ecosystem Nexus: The Role of Land Use and Land Cover Change for Water Resources and Ecosystems in the Kilombero Wetland, Tanzania. Sustainability 2017, 9, 1513. [Google Scholar] [CrossRef] [Green Version]
  20. Ministry of Natural Resources and Tourism. Integrated Management Plan for the Kilombero Valley Ramsar Site: Foundation Document. Available online: https://kilomberovalley.files.wordpress.com/2019/02/kvrs-imp_foundation-2018-09.pdf (accessed on 9 June 2020).
  21. Wilson, E.; McInnes, R.; Mbaga, D.P.; Ouedraogo, P. Ramsar Advisory Mission Report: Kilombero Valley, United Republic of Tanzania, Ramsar Site No. 1173. Available online: https://www.ramsar.org/sites/default/files/documents/library/ram83_kilombero_valley_tanzania_2016_e.pdf (accessed on 9 July 2020).
  22. Jones, T.; Caro, T.; Davenport, T.R.B. Wildlife Corridors in Tanzania; Tanzania Wildlife Research Insitute (TAWIRI): Arusha, Tanzania, 2009. [Google Scholar]
  23. Kilombero and Lower Rufiji Wetlands Ecosystem Management Project, Project Implementation Unit. Technical Advisory Services for Biodiversity Conservation and Wetland Management in Kilombero Valley Ramsar Site: Land Diagnostic Study. Available online: https://kilomberovalley.files.wordpress.com/2018/09/kilorwemp-cgmett-survey-mission-report-2015-04-17-final.pdf (accessed on 23 November 2020).
  24. ArcGIS Hub. World Countries (Generalized). Available online: https://hub.arcgis.com/datasets/2b93b06dc0dc4e809d3c8db5cb96ba69_0?geometry=-33.047%2C-89.382%2C33.047%2C86.054 (accessed on 17 December 2020).
  25. Protected Planet. Protected Area Profile for United Republic of Tanzania from the World Database of Protected Areas (WDPA). Available online: https://www.protectedplanet.net/country/TZA (accessed on 14 July 2020).
  26. Lehner, B.; Verdin, K.; Jarvis, A. New Global Hydrography Derived From Spaceborne Elevation Data. Eos Trans. AGU 2008, 89, 93–104. [Google Scholar] [CrossRef]
  27. Msofe, N.K.; Sheng, L.; Lyimo, J. Land Use Change Trends and Their Driving Forces in the Kilombero Valley Floodplain, Southeastern Tanzania. Sustainability 2019, 11, 505. [Google Scholar] [CrossRef] [Green Version]
  28. Kwesiga, J.; Grotelüschen, K.; Neuhoff, D.; Senthilkumar, K.; Döring, T.F.; Becker, M. Site and Management Effects on Grain Yield and Yield Variability of Rainfed Lowland Rice in the Kilombero Floodplain of Tanzania. Agronomy 2019, 9, 632. [Google Scholar] [CrossRef] [Green Version]
  29. Mombo, F.; Speelman, S.; Phillip, D.; van Huylenbroeck, G. Modelling the value of wetlands in the Kilombero Valley, Tanzania, using community preferences. In Ecosystems and Sustainable Development VIII; Brebbia, C.A., Esteve, Y.V., Eds.; WIT Press: Ashurst, UK, 2011; pp. 27–39. [Google Scholar]
  30. WREM International Inc. Rufiji IWRMDP Final Report, Volume VIII: Executive Summary. Report prepared for the United Republic of Tanzania, Ministry of Water; Wrem International Inc.: Atlanta, GA, USA, 2015. [Google Scholar]
  31. Southern Agricultural Growth Corridor of Tanzania. Southern Agricultural Growth Corridor of Tanzania: Investment Blueprint. Available online: http://sagcot.co.tz/index.php/mdocs-posts/invest-blueprint-sagcot_high/ (accessed on 7 July 2020).
  32. Milder, J.C.; Buck, L.E.; Hart, A.K.; Scherr, S.J.; Shames, S. A Framework for Agriculture Green Growth. Greenprint for the Southern Agricultural Growth Corridor of Tanzania (SAGCOT); SAGOT Centre: Dar es Salaam, Tanzania, 2013. [Google Scholar]
  33. West, J.; Haug, R. Polarised narratives and complex realities in Tanzania’s Southern Agricultural Growth Corridor. Dev. Pract. 2017, 27, 418–431. [Google Scholar] [CrossRef]
  34. Seki, H.A.; Shirima, D.D.; Mustaphi, C.J.C.; Marchant, R.; Munishi, P.K.T. The impact of land use and land cover change on biodiversity within and adjacent to Kibasira Swamp in Kilombero Valley, Tanzania. Afr. J. Ecol. 2018, 56, 518–527. [Google Scholar] [CrossRef]
  35. Munishi, S.; Jewitt, G. Degradation of Kilombero Valley Ramsar wetlands in Tanzania. Phys. Chem. Earth Parts 2019, 112, 216–227. [Google Scholar] [CrossRef]
  36. Thonfeld, F.; Steinbach, S.; Muro, J.; Kirimi, F. Long-Term Land Use/Land Cover Change Assessment of the Kilombero Catchment in Tanzania Using Random Forest Classification and Robust Change Vector Analysis. Remote Sens. 2020, 12, 1057. [Google Scholar] [CrossRef] [Green Version]
  37. Jones, T.; Bamford, A.J.; Ferrol-Schulte, D.; Hieronimo, P.; McWilliam, N.; Rovero, F. Vanishing Wildlife Corridors and Options for Restoration: A Case Study from Tanzania. Trop. Conserv. Sci. 2012, 5, 463–474. [Google Scholar] [CrossRef]
  38. Johansson, E.L.; Isgren, E. Local perceptions of land-use change: Using participatory art to reveal direct and indirect socioenvironmental effects of land acquisitions in Kilombero Valley, Tanzania. Ecol. Soc. 2017, 22, 3. [Google Scholar] [CrossRef] [Green Version]
  39. United Nations Development Programme. Enhancing the Forest Nature Reserves Network for Biodiversity Conservation in Tanzania. Project Document. 2015. Available online: http://nature-reserves.go.tz/attachments/Nature%20Forest%20Reserve(NFR)%20Signed%20Prodoc.pdf (accessed on 19 July 2020).
  40. Ministry of Natural Resources and Tourism. The Tanzania Wildlife Management Authority Act. Principal Legislation. 2013. Available online: https://sherloc.unodc.org/res/cld/document/wildlife-management-authority-act--2013_html/Wildlife_Management_Authority_Act_2013.pdf (accessed on 23 November 2020).
  41. Namtumbo District Council & Mbarang’andu Authorized Association. Resource Zone Management Plan (2009–2013) for the Mbarang’andu Pilot Wildlife Management Area. Available online: https://www.ucl.ac.uk/pima/docs/reference/28_mbarangandu_rzmp.pdf (accessed on 15 July 2020).
  42. Materu, S.F.; Urban, B.; Heise, S. A critical review of policies and legislation protecting Tanzanian wetlands. Ecosyst. Health Sustain. 2018, 4, 310–320. [Google Scholar] [CrossRef]
  43. Msofe, N.K.; Sheng, L.; Li, Z.; Lyimo, J. Impact of Land Use/Cover Change on Ecosystem Service Values in the Kilombero Valley Floodplain, Southeastern Tanzania. Forests 2020, 11, 109. [Google Scholar] [CrossRef] [Green Version]
  44. Näschen, K.; Diekkrüger, B.; Leemhuis, C.; Steinbach, S.; Seregina, L.; Thonfeld, F.; van der Linden, R. Hydrological Modeling in Data-Scarce Catchments: The Kilombero Floodplain in Tanzania. Water 2018, 10, 599. [Google Scholar] [CrossRef] [Green Version]
  45. Pollard, S.; Du Toit, D. The emergence of a systemic view for the sustainable governance and use of wetlands in complex and transforming environments. In Wetlands Management and Sustainable Livelihoods in Africa; Wood, A., Dixon, A., McCartney, M., Eds.; Taylor and Francis: Hoboken, NJ, USA, 2013; pp. 112–137. ISBN 9781849714112. [Google Scholar]
  46. Gabiri, G.; Burghof, S.; Diekkrüger, B.; Leemhuis, C.; Steinbach, S.; Näschen, K. Modeling Spatial Soil Water Dynamics in a Tropical Floodplain, East Africa. Water 2018, 10, 191. [Google Scholar] [CrossRef] [Green Version]
  47. Jones, T.; Hawes, J.E.; Norton, G.W.; Hawkins, D.M. Effect of protection status on mammal richness and abundance in Afromontane forests of the Udzungwa Mountains, Tanzania. Biol. Conserv. 2019, 229, 78–84. [Google Scholar] [CrossRef]
  48. Tanzania National Parks National Policy Committee. National Policies for National Parks in Tanzania. Available online: https://www.tanzania.go.tz/egov_uploads/documents/National_Parks_Policy_sw.pdf (accessed on 18 December 2020).
  49. Höllermann, B.; Näschen, K.; Evers, M. Stakeholder Workshop on “Dynamics of Human-Water Interactions in the Kilombero Catchment”(19.02.–20.02.2019). Workshop Review, 2019, Unpublished. Metadata. Available online: https://www.trr228db.uni-koeln.de/search/view.php?dataID=175 (accessed on 6 June 2021).
  50. Dewitte, O.; Jones, A.; Spaargaren, O.; Breuning-Madsen, H.; Brossard, M.; Dampha, A.; Deckers, J.; Gallali, T.; Hallett, S.; Jones, R.; et al. Harmonisation of the soil map of Africa at the continental scale. Geoderma 2013, 211–212, 138–153. [Google Scholar] [CrossRef] [Green Version]
  51. Geofabrik. Download OpenStreetMap data for this Region: Tanzania. Available online: http://download.geofabrik.de/africa/tanzania.html (accessed on 27 July 2020).
  52. Bosch, O.; Maani, K.; Smith, C. Systems thinking: Language of complexity for scientists and Managers. In Improving the Triple Bottom Line Returns from Small-Scale Forestry, Proceedings from an International Conference, Ormoc, Philippines, 18–21 June 2007; Harrison, S., Bosch, A., Herbohn, J., Eds.; The University of Queensland: St Lucia, Australia, 2007; pp. 57–66. [Google Scholar]
  53. Kelly, R.A.; Jakeman, A.J.; Barreteau, O.; Borsuk, M.E.; ElSawah, S.; Hamilton, S.H.; Henriksen, H.J.; Kuikka, S.; Maier, H.R.; Rizzoli, A.E.; et al. Selecting among five common modelling approaches for integrated environmental assessment and management. Environ. Model Softw. 2013, 47, 159–181. [Google Scholar] [CrossRef]
  54. Forrester, J.W. Industrial Dynamics; MIT Press: Cambridge, MA, USA, 1961. [Google Scholar]
  55. Richardson, G.P.; Pugh, A.L. Introduction to System Dynamics Modeling with Dynamo; Productivity Press: Cambridge, MA, USA, 1981. [Google Scholar]
  56. Coyle, R.G. System Dynamics Modelling. A Practical Approach, 1st ed.; Chapman & Hall: London, UK, 1996; ISBN 9780412617102. [Google Scholar]
  57. Sterman, J.D. Business Dynamics, Systems Thinking and Modeling for a Complex World; Irwin/McGraw-Hill: Boston, MA, USA, 2000; ISBN 0072311355. [Google Scholar]
  58. Zomorodian, M.; Lai, S.H.; Homayounfar, M.; Ibrahim, S.; Fatemi, S.E.; El-Shafie, A. The state-of-the-art system dynamics application in integrated water resources modeling. J. Environ. Manag. 2018, 227, 294–304. [Google Scholar] [CrossRef]
  59. Höllermann, B.; Evers, M. Coping with uncertainty in water management: Qualitative system analysis as a vehicle to visualize the plurality of practitioners’ uncertainty handling routines. J. Environ. Manag. 2019, 235, 213–223. [Google Scholar] [CrossRef] [PubMed]
  60. Nguyen, H.H.; Dargusch, P.; Moss, P.; Aziz, A.A. Land-use change and socio-ecological drivers of wetland conversion in Ha Tien Plain, Mekong Delta, Vietnam. Land Use Policy 2017, 64, 101–113. [Google Scholar] [CrossRef]
  61. Dang, A.N.; Kawasaki, A. Integrating biophysical and socio-economic factors for land-use and land-cover change projection in agricultural economic regions. Ecol. Modell 2017, 344, 29–37. [Google Scholar] [CrossRef]
  62. Ventana Systems. Vensim: Home. 2015. Available online: www.vensim.com/ (accessed on 28 July 2020).
  63. Powell, J.H.; Mustafee, N.; Chen, A.S.; Hammond, M. System-focused risk identification and assessment for disaster preparedness: Dynamic threat analysis. Eur. J. Oper. Res. 2016, 254, 550–564. [Google Scholar] [CrossRef] [Green Version]
  64. Meijer, J.; Giesen, P.; Shames, S.; Scherr, S.J. Spatial Scenario Modelling to Support Integrated Landscape Management in the Kilombero Valley Landscape in Tanzania. In A Case study on Landscape Strategies to Achieve the Sustainable Development Goals. Background Report; PBL Netherlands Environmental Assessment Agency and EcoAgriculture Partners: The Hague, The Netherlands, 2018. [Google Scholar]
  65. International Institute for Sustainable Development. The Sustainable Asset Valuation of the Souther Agricultural Growth Corridor of Tanzania (SAGCOT) Initiative: A Focus on Irrigation Infrastructure. Available online: https://www.iisd.org/system/files/publications/savi-tanzania-sagcot-initiative.pdf (accessed on 23 October 2020).
  66. Eastman, J.R. TerrSet Tutorial. Geospatial Monitoring and Modeling System; Clark University: Worcester, MA, USA, 2016. [Google Scholar]
  67. Clark Labs. TerrSet Geospatial Monitoring and Modeling Software, Version 18.31; Clark University: Worcester, MA, USA, 2017. [Google Scholar]
  68. Clark Labs. TerrSet Help System; Clark University: Worcester, MA, USA, 2017. [Google Scholar]
  69. Khoi, D.D.; Murayama, Y. Forecasting Areas Vulnerable to Forest Conversion in the Tam Dao National Park Region, Vietnam. Remote Sens. 2010, 2, 1249–1272. [Google Scholar] [CrossRef] [Green Version]
  70. Hasan, S.; Shi, W.; Zhu, X.; Abbas, S.; Khan, H.U.A. Future Simulation of Land Use Changes in Rapidly Urbanizing South China Based on Land Change Modeler and Remote Sensing Data. Sustainability 2020, 12, 4350. [Google Scholar] [CrossRef]
  71. Martínez-Vega, J.; Díaz, A.; Nava, J.M.; Gallardo, M.; Echavarría, P. Assessing Land Use-Cover Changes and Modelling Change Scenarios in Two Mountain Spanish National Parks. Environments 2017, 4, 79. [Google Scholar] [CrossRef] [Green Version]
  72. Islam, K.; Rahman, M.F.; Jashimuddin, M. Modeling land use change using Cellular Automata and Artificial Neural Network: The case of Chunati Wildlife Sanctuary, Bangladesh. Ecol. Indic. 2018, 88, 439–453. [Google Scholar] [CrossRef]
  73. Bergius, M.; Benjaminsen, T.A.; Maganga, F.; Buhaug, H. Green economy, degradation narratives, and land-use conflicts in Tanzania. World Dev. 2020, 129, 104850. [Google Scholar] [CrossRef]
  74. Nindi, S.J.; Maliti, H.T.; Bakari, S.; Kija, H.; Machoke, M. Conflicts over Land and Water Resources in the Kilombero Valley Floodplain, Tanzania. Afr. Study Monogr. 2014, 50, 173–190. [Google Scholar]
  75. Näschen, K.; Diekkrüger, B.; Leemhuis, C.; Seregina, L.; van der Linden, R. Impact of Climate Change on Water Resources in the Kilombero Catchment in Tanzania. Water 2019, 11, 859. [Google Scholar] [CrossRef] [Green Version]
  76. Wrem International Inc. Rufiji Iwrmdp Final Report, Volume I: Rufiji IWRMD Plan. Report prepared for the United Republic of Tanzania; Ministry of Water; Wrem International Inc.: Atlanta, GA, USA, 2015.
  77. Andrew, S.M.; Moe, S.R.; Totland, Ø.; Munishi, P.K.T. Species composition and functional structure of herbaceous vegetation in a tropical wetland system. Biodivers. Conserv. 2012, 21, 2865–2885. [Google Scholar] [CrossRef]
  78. Mombo, F.; Cunliffe, R.; Nyanghura, Q.; Mariki, S.; Technical Advisory Services for Biodiversity Conservation and Wetland Management in Kilombero Valley Ramsar Site, Integrated Management Plan. Ngapemba “Conservation Area” Planning: Socio-Economic Assessment. 2018. Available online: http://www.suaire.sua.ac.tz:8080/xmlui/bitstream/123456789/2504/1/Felister%20Mombo%2014%20social%20assessment%20-%20final%20report%20-May%2015%20%281%29.pdf (accessed on 28 July 2020).
  79. Bonnington, C.; Weaver, D.; Fanning, E. Livestock and large wild mammals in the Kilombero Valley, in southern Tanzania. Afr. J. Ecol. 2007, 45, 658–663. [Google Scholar] [CrossRef]
  80. Ntongani, W.A.; Andrew, S.M. Bird species composition and diversity in habitats with different disturbance histories at Kilombero Wetland, Tanzania. Open J. Ecol. 2013, 3, 482–488. [Google Scholar] [CrossRef] [Green Version]
  81. Jenkins, R.K.B.; Maliti, H.T.; Corti, G.R. Conservation of the puku antelope (Kobus vardoni, Livingstone) in the Kilombero Valley, Tanzania. Biodivers. Conserv. 2003, 12, 787–797. [Google Scholar] [CrossRef]
  82. Rannestad, O.T.; Tsegaye, D.; Munishi, P.K.T.; Moe, S.R. Bird Abundance, Diversity and Habitat Preferences in the Riparian Zone of a Disturbed Wetland Ecosystem–the Kilombero Valley, Tanzania. Wetlands 2015, 35, 521–532. [Google Scholar] [CrossRef]
  83. Bonnington, C.; Weaver, D.; Fanning, E. The use of teak (Tectona grandis) plantations by large mammals in the Kilombero Valley, southern Tanzania. Afr. J. Ecol. 2009, 47, 138–145. [Google Scholar] [CrossRef]
  84. Bamford, A.J.; Ferrol-Schulte, D.; Wathan, J. Human and wildlife usage of a protected area buffer zone in an area of high immigration. Oryx 2014, 48, 504–513. [Google Scholar] [CrossRef] [Green Version]
  85. Kilombero and Lower Rufiji Wetlands Ecosystem Management Project, Project Implementation Unit. Technical Advisory Services for Biodiversity Conservation and Wetland Managament in Kilombero Valley Ramsar Site: Pastoralism Diagnostic Study. Available online: https://kilomberovalley.files.wordpress.com/2019/02/kilorwemp-2017-pastoralism-diagnostic-study.pdf (accessed on 23 November 2020).
  86. Materu, S.F.; Heise, S. Eco-toxicity of water, soil, and sediment from agricultural areas of Kilombero Valley Ramsar wetlands, Tanzania. Ecosyst. Health Sustain. 2019, 5, 256–269. [Google Scholar] [CrossRef] [Green Version]
  87. CDM Smith. Environmental Flows in Rufiji River Basin assessed from the Perspective of Planned Development in Kilombero and Lower Rufiji Sub-Basins. Technical Assistance to Support the Development of Irrigation and Rural Roads Infrastructure Project. Report to the United States Agency for International Development. 2016. Available online: https://pdf.usaid.gov/pdf_docs/pa00mkk4.pdf (accessed on 22 October 2020).
  88. Mombo, F.; Speelman, S.; van Huylenbroeck, G.; Hella, J.; Munishi, P.; Stein, M. Ratification of the Ramsar convention and sustainable wetlands management: Situation analysis of the Kilombero Valley wetlands in Tanzania. J. Agric. Ext. Rural Dev. 2011, 3, 153–164. [Google Scholar]
  89. Beuel, S.; Alvarez, M.; Amler, E.; Behn, K.; Kotze, D.; Kreye, C.; Leemhuis, C.; Wagner, K.; Willy, D.K.; Ziegler, S.; et al. A rapid assessment of anthropogenic disturbances in East African wetlands. Ecol. Indic. 2016, 67, 684–692. [Google Scholar] [CrossRef]
  90. Government of Tanzania. Southern Agricultural Growth Corridor of Tanzania (SAGCOT): Environmental and Social Management Framework (ESMF). Available online: http://documents.worldbank.org/curated/en/253081468313229504/pdf/E30750v10REVISED0AFR0ESMF0P125728.pdf (accessed on 20 June 2020).
  91. Ministry of Natural Resources and Tourism. Environmental and Social Management Framework for the Resilient Natural Resources Management for Tourism and Growth Project. Environmental and Social Management Framework (ESMF). 2017. Available online: http://www.maliasili.go.tz/uploads/P150523-PPA-C07_ESMF_final_03082017.pdf (accessed on 7 July 2020).
  92. Leemhuis, C.; Amler, E.; Diekkrüger, B.; Gabiri, G.; Näschen, K. East African wetland-catchment data base for sustainable wetland management. Int. Assoc. Hydrol. Sci. 2016, 374, 123–128. [Google Scholar] [CrossRef]
  93. Duvail, S.; Mwakalinga, A.B.; Eijkelenburg, A.; Hamerlynck, O.; Kindinda, K.; Majule, A. Jointly thinking the post-dam future: Exchange of local and scientific knowledge on the lakes of the Lower Rufiji, Tanzania. Hydrol. Sci. J. 2014, 59, 713–730. [Google Scholar] [CrossRef]
  94. Ngcobo, S.; Jewitt, G. Multiscale drivers of sugarcane expansion and impacts on water resources in Southern Africa. Environ. Dev. 2017, 24, 63–76. [Google Scholar] [CrossRef]
  95. Hartmann, G.; Mwaka, I.; Dannenberg, P. Large investments, small farmers: A financialisation perspective on value chains in a development corridor. Dev. S. Afr. 2020, 1–17. [Google Scholar] [CrossRef]
  96. Sulle, E. Bureaucrats, investors and smallholders: Contesting land rights and agro-commercialisation in the Southern agricultural growth corridor of Tanzania. J. East Afr. Stud. 2020, 14, 332–353. [Google Scholar] [CrossRef] [Green Version]
  97. Milder, J.C.; Hart, A.K.; Buck, L.E. Applying an Agriculture Green Growth Approach in the SAGCOT Clusters. In Challenges and Opportunities in Kilombero, Ihemi and Mbarali; SAGCOT Centre Limited: Dar es Salaam, Tanzania, 2013. [Google Scholar]
  98. Southern Agricultural Growth Corridor of Tanzania. Launch of Kilombero Cluster: Stronger Partnerships with Greener and Prosperous Agricultural Value Chains–SAGCOT. Available online: http://sagcot.co.tz/index.php/launch-of-kilombero-cluster-stronger-partnerships-with-greener-and-prosperous-agricultural-value-chains/ (accessed on 28 June 2020).
  99. Kirimi, F.; Thiong’o, K.; Gabiri, G.; Diekkrüger, B.; Thonfeld, F. Assessing seasonal land cover dynamics in the tropical Kilombero floodplain of East Africa. J. Appl. Rem. Sens. 2018, 12, 026027. [Google Scholar] [CrossRef] [Green Version]
  100. Kangalawe, R.Y.M.; Liwenga, E.T. Livelihoods in the wetlands of Kilombero Valley in Tanzania: Opportunities and challenges to integrated water resource management. Phys. Chem. Earth 2005, 30, 968–975. [Google Scholar] [CrossRef]
  101. Burghof, S.; Hydrogeology and Water Quality of Wetlands in East Africa. Case Studies of A Floodplain and a Valley Bottom Wetland. 2017. Available online: http://hss.ulb.uni-bonn.de/2017/4866/4866.pdf (accessed on 20 June 2020).
  102. Burghof, S.; Gabiri, G.; Stumpp, C.; Chesnaux, R.; Reichert, B. Development of a hydrogeological conceptual wetland model in the data-scarce north-eastern region of Kilombero Valley, Tanzania. Hydrogeol. J. 2018, 26, 267–284. [Google Scholar] [CrossRef]
  103. Kato, F. Development of a major rice cultivation area in the Kilombero Valley, Tanzania. Afr. Study Monogr. 2007, 36, 3–18. [Google Scholar]
  104. Alavaisha, E. Agricultural Expansion Impacts on Wetland Ecosystem Services from Kilombero Valley, Tanzania; Stockholm University: Stockholm, Sweden, 2020. [Google Scholar]
  105. World Wide Fund For Nature. The True Cost of Power. In The Facts and Risks of Building Stieglers Gorge Hydropower Dam in Selous Game Reserve, Tanzania; WWF International: Gland, Switzerland, 2017. [Google Scholar]
  106. Duvail, S.; Hamerlynck, O. The Rufiji River flood: Plague or blessing? Int. J. Biometeorol. 2007, 52, 33–42. [Google Scholar] [CrossRef] [PubMed]
  107. International Union for Conservation of Nature. Independent Technical Review of the “Strategic Environmental Assessment for the Rufiji Hydropower Project” in Selous Game Reserve World Heritage site, Tanzania; IUCN: Gland, Switzerland, 2019; Available online: https://portals.iucn.org/library/sites/library/files/documents/2019-044-En.pdf (accessed on 16 April 2020).
  108. Dinesen, L. Kilombero Valley Floodplain (Tanzania). In The Wetland Book II: Distribution, Description, and Conservation; Finlayson, C.M., Milton, G.R., Prentice, R.C., Davidson, N.C., Eds.; Springer: Dordrecht, The Netherlands, 2019; pp. 1–8. ISBN 978-94-007-6173-5. [Google Scholar]
  109. Andrew, S.M.; Totland, Ø.; Moe, S.R. Spatial variation in plant species richness and diversity along human disturbance and environmental gradients in a tropical wetland. Wetl. Ecol. Manag. 2015, 23, 395–404. [Google Scholar] [CrossRef]
  110. Msofe, N.K.; Sheng, L.; Li, Z.; Lyimo, J.; Lingyan, W. Influence of Agricultural Land Use Change on the Selected Physico-Chemical Soil Properties in Kilombero Valley Floodplain, Southeastern Tanzania. Int. J. Environ. Sci. Nat. Res. 2019, 21, 556074. [Google Scholar] [CrossRef]
  111. United Republic of Tanzania-Prime Minister’s Office. Southern Agricultural Growth Corridor of Tanzania (SAGCOT) Investment Project. To the SAGCOT Environmental and Social Management Framework. Updated Vulnerable Groups Planning Framework. 2016. Available online: http://documents.worldbank.org/curated/en/684491468165274986/pdf/SFG1663-REVISED-EA-P125728-Box396313B-PUBLIC-Disclosed-10-4-2016.pdf (accessed on 19 August 2020).
  112. Msinde, J.; Urassa, J.K.; Nathan, I. Off-farm Employment and Income Poverty in Favourable Agro-climatic Areas of Tanzania: Evidence from Kilombero Valley. Job Demand Control Support 2016, 6, 47–60. [Google Scholar]
  113. Paavola, J. Livelihoods, vulnerability and adaptation to climate change in Morogoro, Tanzania. Environ. Sci. Policy 2008, 11, 642–654. [Google Scholar] [CrossRef]
  114. Jew, E.; Bonnington, C. Socio-demographic factors influence the attitudes of local residents towards trophy hunting activities in the Kilombero Valley, Tanzania. Afr. J. Ecol. 2011, 49, 277–285. [Google Scholar] [CrossRef]
  115. Chome, N.; Gonçalves, E.; Scoones, I.; Sulle, E. ‘Demonstration fields’, anticipation, and contestation: Agrarian change and the political economy of development corridors in Eastern Africa. J. East Afr. Stud. 2020, 3, 1–19. [Google Scholar] [CrossRef] [Green Version]
  116. Monson, J. Africa’s Freedom Railway, How a Chinese Development Project Changed Lives and Livelihoods in Tanzania; Indiana University Press: Bloomington, IN, USA, 2011; ISBN 0253223229. [Google Scholar]
  117. Gizachew, B.; Rizzi, J.; Shirima, D.D.; Zahabu, E. Deforestation and Connectivity among Protected Areas of Tanzania. Forests 2020, 11, 170. [Google Scholar] [CrossRef] [Green Version]
  118. Mongula, B.; Schiavoni, C.M.; Twomey, H. A Right to Food Perspective: Impacts of Large-Scale Agricultural Investments on Small-Scale Farmers in the Southern Highlands of Tanzania. Available online: https://www.misereor.de/fileadmin/publikationen/study-a-right-to-food-perspective-2015.pdf (accessed on 31 July 2020).
  119. National Land Use Planning Commission, Tanzania. Status of Land Use Planning, Land Tenure and Biodiversity Conservation: A Focus of Udzungwa-Magombera-Selous Landscape and Mngeta Corridor in Kilombero District. Available online: http://www.abcg.org/action/document/show?document_id=935 (accessed on 30 July 2020).
  120. Sulle, E. Social Differentiation and the Politics of Land: Sugar Cane Outgrowing in Kilombero, Tanzania. J. S. Afr. Stud. 2017, 43, 517–533. [Google Scholar] [CrossRef] [Green Version]
  121. Herrmann, R.T. Large-Scale Agricultural Investments and Smallholder Welfare: A Comparison of Wage Labor and Outgrower Channels in Tanzania. World Dev. 2017, 90, 294–310. [Google Scholar] [CrossRef]
  122. Gebrekidan, B.H. Modeling Farmers Intensification Decisions with a Bayesian Belief Network: The Case of the Kilombero Floodplain in Tanzania. In Proceedings of the 30th International Conference of Agricultural Economists, Vancouver, BC, Canada, 28 July–2 August 2018. [Google Scholar]
  123. Gebrekidan, B.H.; Heckelei, T.; Rasch, S. Characterizing Farmers and Farming System in Kilombero Valley Floodplain, Tanzania. Sustainability 2020, 12, 7114. [Google Scholar] [CrossRef]
  124. Johansson, E.L.; Abdi, A.M. Mapping and quantifying perceptions of environmental change in Kilombero Valley, Tanzania. Ambio 2020, 49, 557–568. [Google Scholar] [CrossRef] [Green Version]
  125. Kilombero and Lower Rufiji Wetlands Ecosystem Management Project, Project Implementation Unit. Technical Advisory Services for Biodiversity Conservation and Wetland Managament in Kilombero Valley Ramsar Site: The Kilombero Fishery Diagnostic Study. Available online: https://kilomberovalley.files.wordpress.com/2019/02/kilorwemp-2017-fisheries-diagnostic-study.pdf (accessed on 23 November 2020).
  126. Poulton, C. APRA Policy Processes and Political Economy: Tanzania Country Review: APRA Working Paper 5, Future Agricultures Consortium. Available online: https://eprints.soas.ac.uk/26529/1/APRA%20W.P.%20number%205%20web.pdf (accessed on 7 July 2020).
  127. Ministry of Finance and Planning, Tanzania. National Five Year Development Plan 2016/17-2020/21. Nurturing Industrialization for Economic Transformation and Human Development. Available online: https://mof.go.tz/mofdocs/msemaji/Five%202016_17_2020_21.pdf (accessed on 9 August 2020).
  128. Lusambo, L.P. Household Energy Consumption Patterns in Tanzania. J. Ecosys. Ecogr. 2016, 5, 1–20. [Google Scholar] [CrossRef] [Green Version]
  129. Steffens, V.; Hartmann, G.; Dannenberg, P. Eine neue Generation von Wachstumskorridoren als Entwicklungsmotor in Afrika? Standort 2019, 43, 2–8. [Google Scholar] [CrossRef]
  130. Alavaisha, E.; Manzoni, S.; Lindborg, R. Different agricultural practices affect soil carbon, nitrogen and phosphorous in Kilombero-Tanzania. J. Environ. Manag. 2019, 234, 159–166. [Google Scholar] [CrossRef] [PubMed]
  131. Alavaisha, E.; Lyon, S.; Lindborg, R. Assessment of Water Quality Across Irrigation Schemes: A Case Study of Wetland Agriculture Impacts in Kilombero Valley, Tanzania. Water 2019, 11, 671. [Google Scholar] [CrossRef] [Green Version]
  132. Benjaminsen, T.A.; Bryceson, I. Conservation, green/blue grabbing and accumulation by dispossession in Tanzania. J. Peasant. Stud. 2012, 39, 335–355. [Google Scholar] [CrossRef]
  133. Bluwstein, J.; Lund, J.F.; Askew, K.; Stein, H.; Noe, C.; Odgaard, R.; Maganga, F.; Engström, L. Between dependence and deprivation: The interlocking nature of land alienation in Tanzania. J. Agrar. Chang. 2018, 18, 806–830. [Google Scholar] [CrossRef]
  134. Riggio, J.; Jacobson, A.P.; Hijmans, R.J.; Caro, T. How effective are the protected areas of East Africa? Glob. Ecol. Conserv. 2019, 17, e00573. [Google Scholar] [CrossRef]
Figure 1. Study area and its location in Tanzania. Protected areas and wildlife corridors considered in this study. Some protected areas overlap. Data sources: [18,22,23,24,25,26].
Sustainability 13 06552 g001
Figure 2. Conceptual framework outlining the multi-method scenario approach.
Sustainability 13 06552 g002
Figure 3. Causal Loop Diagram of the socio-ecological system of land use and land cover change in the Kilombero catchment, Tanzania. Blue arrows indicate positive links between factors; orange arrows indicate negative links between factors. System main factors are bold, external factors are in a rectangular shape, factors that are represented spatially in the subsequent GIS modeling process are underlined. All system components and connecting arrows are supported by stakeholder knowledge and/or region-specific literature as documented in Appendix A Table A1.
Sustainability 13 06552 g003
Figure 4. Reinforcing consequences of agricultural expansion.
Sustainability 13 06552 g004
Figure 5. Contrasting consequences of conservation measures.
Sustainability 13 06552 g005
Figure 6. LULC maps for the business-as-usual scenario (c) and the conservation scenario (d) for the year 2030 as modeled by the Land Change Modeler. The historic LULC maps of 2004 (a) and 2014 (b) are portrayed for comparison.
Sustainability 13 06552 g006
Figure 7. Comparison of shares of natural and anthropogenic LULC within protected areas, outside protected areas, and the Ramsar wetland in 2004, 2014 and the BAU scenario (BAU) and conservation scenario (CS). Anthropogenic LULC includes the LULC classes cropland, rice, plantations, and built-up. Natural LULC includes montane forest, swamp, water, grassland, savanna, open woodland, and closed woodland.
Sustainability 13 06552 g007
Table 2. Spatial data used in this study and their sources.
Spatial Data SetData Source
LULC maps of 2004 and 2014Thonfeld et al. 2020 [36]
Digital elevation model (DEM)Shuttle Radar Topography Mission (SRTM) [26]
Soil mapFAO: Harmonized World Soil Database [50]
RoadsOpen Street Map [51]
Conservation areasIUCN World Database of Protected Areas [25]
Wildlife corridorsLocation and extent of the Nyanganje and Rupia corridors were retrieved from data provided by [18] and smented by literature [22,23,37]. The Mngenta Corridor was digitized from [22] (p. 49) and [23] (p. 58).
Planned irrigation schemes, planned dams, planned roadResults from the participatory mapping exercise conducted during the stakeholder workshop [49]
Table 4. Scenario assumptions for the BAU and conservation scenarios. Each category in the left column as well as words in italics refer to system factors of the CLD.
BAU ScenarioConservation Scenario
ConservationNo enforcement or expansion of existing protected areas. The encroachment of the Kilombero Ramsar Site and GCA as well as other protected area categories through cultivation and livestock keeping continues. All conservation areas are managed and protected effectively according to their legal protection status. Anthropogenic uses are limited to the activities permitted in the respective protected area categories.
Population growth and settlement areasFollowing the current trend, the expected high rate of population growth leads to an expansion of settlement areas and a rising demand for natural resources.Population grows similarly to the BAU scenario. However, settlement areas are successfully prevented to expand into protected areas where the regulations prohibit such activities.
Agricultural
areas
Agricultural food production continues to increase consistently with population growth. The extension of agricultural areas follows the observed trends of the last decades, thereby continuing the unrestricted expansion of cultivated land at the expense of natural vegetation. The demand for agricultural land corresponds to that in the BAU scenario. However, the enforcement of conservation measures prevents a further expansion of cultivated land in protected areas. Existing agricultural fields remain in place and are not restored, but no new areas are converted.
Ecosystem
condition
and wildlife
The continuation of current activities leads to the ongoing degradation of the ecosystem and loss of ecosystem services. Consequently, food insecurity rises, habitats degrade, and wildlife declines.Effective conservation measures mitigate ecosystem degradation and preserve important ecosystem services. Wildlife populations recover.
TourismThe ongoing conversion of the landscape to agricultural land and the degradation of the ecosystem lead to decreasing attractiveness of the catchment and hamper its potential for tourism.Well-managed protected areas with high wildlife populations attract tourism. Tourism in turn has a positive impact on the macroeconomy thus lowering the general poverty level. Entrance fees support the maintenance of effective protected areas.
Agricultural
intensification
Agricultural intensification follows recent trends. Agribusiness investments fuel the establishment of, for example, new irrigation schemes. In the participatory mapping exercise, four planned irrigation schemes were located.Same as BAU, but in protected areas where no agricultural activities are allowed, agricultural intensification measures such as the construction of planned irrigation schemes are prohibited to be realized.
Social conflictsSocial conflicts about land availability between large-scale farmers, small-scale farmers, conservationists, and pastoralists continue.The enforcement of protected areas intensifies land pressure and social conflicts about land availability even more than the BAU scenario.
Wildlife corridorsThe expansion of anthropogenic land uses (e.g. cultivated land, grazing, settlements) continues without restrictions. Wildlife connectivity is further degraded. Protected areas remain as isolated patches in a fragmented landscape.A further expansion of agricultural land in the important wildlife corridors Mngeta, Nyanganje, and Rupia is minimized to facilitate human-wildlife co-existence. This maintains wildlife connectivity at the current, albeit low, level.
Infrastructure
development
Infrastructure and the associated accessibility of new areas act as a nucleus for anthropogenic activities such as agricultural expansion as well as tourism. In the participatory mapping exercise, a planned trunk road connecting the southern part of the catchment was expected to have a significant impact on the surrounding areas.Same as BAU, but LULCC is restricted in protected areas.
DamsNew dams are constructed for hydropower generation and flood regulation. Dams also lead to more water resources availability which in turn leads to a further expansion of agricultural areas. In the participatory mapping exercise, the location of three planned dams (namely Mpaga Dam, Ruhudji Dam, and Mnyer Dam) was indicated.Same as BAU.
Table 5. Results of the scenario quantification. To include the scenario assumptions in the modeling process, the constraints and incentives maps were multiplied with the individual transition potential maps in the course of the change prediction process. Consequently, a value above 1 creates an incentive while a value below 1 creates a constraint.
Constraints/
Incentives Map
Input ShapefilesDescription BAU
Scenario
Conservation ScenarioValue
IncentivesPlanned irrigation schemesPlanned projects as indicated in the participatory mapping exercise. Assumption of 1 km buffer to include nucleus effect.XX1.2
IncentivesPlanned damsXX1.2
IncentivesPlanned roadXX1.2
ConstraintsNational ParksStrong anthropogenic use restrictions, no further expansion of agricultural areas permitted. X0
Game Reserve X0
Forest Nature Reserves X0
Ramsar Site X0
Game Controlled Area X0
Wildlife Management Area X0
ConstraintsWildlife CorridorsFurther agricultural use not prohibited but reduced. X0.8
ConstraintsForest ReserveRegulations not consistent, therefore minor constraints value. X0.9
Table 6. Land demand (in km2) for the LULC classes cropland and rice as calculated by the Markov Chain Analysis compared to the effectively allocated areas in the BAU and conservation scenario. For the conservation scenario values, the horizontal stripe and the salt and pepper noise allocations were excluded.
Calculated
Land Demand
Allocated Area
BAU Scenario
Allocated Area
Conservation Scenario
Cropland8921.14 km28880.41 km28711.66 km2
Rice5401.46 km25398.84 km24641.83 km2
Publisher’s Note: MDPI stays neutral with regard to jurisdictional claims in published maps and institutional affiliations.

