
A Profit Distribution Model of Reverse Logistics Based on Fuzzy DEA Efficiency—Modified Shapley Value


School of Economics and Management, China University of Petroleum, Qingdao 266580, China
*
Authors to whom correspondence should be addressed.
Sustainability 2021, 13(13), 7354; https://doi.org/10.3390/su13137354
Submission received: 31 May 2021
/
Revised: 25 June 2021
/
Accepted: 26 June 2021
/
Published: 30 June 2021
(This article belongs to the Special Issue Supply Chain Innovation and Logistics Collaboration under Shared Economy)
Abstract
:Reverse logistics is an important way to realize sustainable production and consumption. With the emergence of professional third-party reverse logistics service providers, the outsourcing model has become the main mode of reverse logistics. Whether the distribution of cooperative profit among multiple participants is fair or not determines the quality of the implementation of the outsourcing mode. The traditional Shapley value model is often used to distribute cooperative profit. Since its distribution basis is the marginal profit contribution of each member enterprise to different alliances, it is necessary to estimate the profit of each alliance. However, it is difficult to ensure the accuracy of this estimation, which makes the distribution lack of objectivity. Once the actual profit share deviates from the expectation of member enterprise, the sustainability of the reverse logistics alliance will be affected. This study considers the marginal efficiency contribution of each member enterprise to the alliance and applies it to replace the marginal profit contribution. As the input and output data of reverse logistics cannot be accurately separated from those of the whole enterprise, they are often uncertain. In this paper, we assume that each member enterprise’s input and output data are fuzzy numbers and construct an efficiency measurement model based on fuzzy DEA. Then, we define the characteristic function of alliance and propose a modified Shapley value model to fairly distribute cooperative profit. Finally, an example comprising of two manufacturing enterprises, one sales enterprise, and one third-party reverse logistics service provider is put forward to verify the model’s feasibility and effectiveness. This paper provides a reference for the profit distribution of the reverse logistics.
1. Introduction
In recent years, with the continuous development of the world economy and the acceleration of industrialization and urbanization, the consumption of resources has gradually increased. The problems of resource waste and environmental pollution have become increasingly serious, which has attracted great attention of the international community. In January 2016, the United Nations proposed 17 sustainable development goals in the 2030 Agenda for Sustainable Development, of which the 12th is to ensure sustainable consumption and production patterns [1]. Reverse logistics (RL) is an effective way to achieve this goal. It is a kind of logistics activity including product return, material replacement, waste disposal, reprocessing, and maintenance and remanufacturing [2]. Great importance has been attached to RL by various countries since it was proposed by Stock in 1992. For example, the United States has successively passed the Resource Conservation and Recovery Act, the Comprehensive Environmental Response, Compensation and Liability Act and The Superfund Recycling Equity Act. All of these regulations highlight requirements for resource recovery and waste disposal. As an important member of the European Union, Germany is actively participating in the RL construction. It innovatively established the Duales System Deutschland (DSD) [3], and greatly promoted the recycling of packaging waste in Germany. In order to improve the quality of the entire logistics and social environment and solve the problems of waste, inefficiency and inequality, Japan proposed some measures about the transport vehicles in the fifth newly formulated Integrated Logistics Policy Outline [4]. As the largest developing country, China also attaches great importance to the development of RL. In 2008, China promulgated the Circular Economy Promotion Law, which aims to reduce resource consumption and waste generation, convert waste into resources and improve the recycling rate of waste. In 2012, China formulated the Notice on Further Doing a Good Job in the Construction of a Waste Commodity Recycling System, emphasizing the importance of constructing a waste commodity recycling system.
As governments in various countries increase their support for RL, more and more manufacturers are realizing that RL can bring wealth to enterprises. Through RL activities such as recycling products and waste materials, enterprises can reduce operating costs, create a green image, and increase profit. Due to the complexity and professionalism of the RL process, a new type of enterprise—the third-party reverse logistics (TPRL) service provider—has emerged. The TPRL service provider can provide professional RL services, so that enterprises can focus on building their own core competitiveness. Especially in the Internet era, the rapid development of e-commerce makes shopping more convenient, leading to increased waste of resources and further promoting RL development.
At present, RL mainly includes three operating modes: (A) self-operation mode, in which the production enterprise independently builds its own RL system; (B) joint operation mode, in which multiple production enterprises jointly build a RL system; and (C) outsourcing mode, in which enterprise contracts the RL business to a TPRL service provider and accepts the RL service through payment [5]. RL has the characteristics of high complexity, multiple links, and uncertainty, and requires specialized workflow and infrastructure as well as professional skills [6]. In the outsourcing mode, the TPRL service provider can complete the RL business professionally, while other enterprises do not need to invest in RL and can concentrate on forming their own core competitiveness. Therefore, outsourcing mode is the ideal RL mode [7]. In the outsourcing mode, the RL system contains multiple stakeholders, and whether the profit distribution is fair or not determines the sustainability and quality of RL. Scholars mostly use the traditional Shapley value method to explore the profit distribution, which assumes that the profit of each alliance composed of different participants is certain. However, in practice, the profit of an alliance is often uncertain, and may even deviate greatly from the estimated value, which makes the allocation scheme based on the estimation unreasonable. In order to solve the above problem, it is necessary to consider an alternative method that does not need to estimate the profit of each alliance. In this paper, we propose an alternative method, mainly entailing three aspects of contributions. Firstly, we calculate the marginal efficiency contribution of each member enterprise through a set of DEA models and use it to replace the marginal profit contribution in the traditional Shapley value model. Secondly, considering that the input and output data specially used for RL are often fuzzy, we establish a fuzzy DEA model to measure efficiency. Thirdly, because the input–output indexes of different industries are different, we propose an RL efficiency measure index screening method based on a rough set.
The other parts of this study are structured as follows: in Section 2, we give a literature review, analyze the deficiency of the existing research and determine the position of this paper. In Section 3, we briefly describe the problem of profit distribution of RL, and make the necessary assumptions for establishing the model. In Section 4, we describe the modeling and solving steps of profit distribution in detail. Section 5 provides a special numerical example to verify the validity of the model. Section 6 summarizes the conclusions of this study.
2. Literature Review
At present, collaboration strategy has been widely used in the field of logistics. Scholars have carried out much research on collaborative logistics [8,9,10], and some scholars have carried out in-depth analyses on specific logistics forms such as refined oil [11,12,13]. Ahmed et al. [14] and Xu et al. [15] studied the truck assignment problem in a collaborative logistics network. Croce et al. [16] studied the choice of cooperative logistics freight vehicles. Xu et al. [17] studied the oil-gas recovery problem in refined oil distribution. With the introduction of the concept of RL, scholars have carried out more research on the profit distribution problem. As this problem can be regarded as a cooperative game problem, scholars mostly used cooperative game methods to study it. Focusing on the distribution of cooperative profit, scholars have proposed Nash negotiation, the Stackelberg game, Shapley value, and other methods.
The Li et al. [18] considered the combination of vertical and horizontal cooperation and constructed an interest coordination mechanism for R&D cooperation based on Nash equilibrium theory. Sheu et al. [19] studied the influence of bargaining power under government intervention on negotiating the reverse supply chain. Kato et al. [20] considered the unequal power between retailers and suppliers in the negotiation process and designed a general negotiation solution and a general evaluation function based on the Nash negotiation model. Jiang et al. [21] developed a Nash bargaining model for the profit distribution between a manufacturer and multiple retailers in a two-level VMI supply chain. Atay and Solymosi [22] studied a supplier–company–buyer three-sided matching model and found that the non-empty core was consistent with the classic bargaining set and the Mas-Colell bargaining set.
Zhu et al. [23] constructed a dual-channel closed-loop supply chain model and applied the Stackelberg model to compare the profits under centralized decision-making, decentralized decision-making, and contract coordination modes. Gong et al. [24] applied the Stackelberg game model to discuss the cooperative profit distribution of a three-level reverse supply chain and put forward the Nash negotiation model. Wei et al. [25] constructed a revenue-sharing contract Stackelberg game model in the carbon emission reduction supply chain. Based on the Stackelberg game, Panda et al. [26] proposed a contract negotiation method to solve the distribution of residual profits among channel members. Anwar [27] regarded the competition between a single manufacturer and a single retailer as a two-level programming problem and analyzed its Stackelberg–Nash equilibrium.
Li et al. [28] used the Shapley value method to solve the distribution problem of cooperative income among universities, enterprises, and intermediary organizations. Wang et al. [29] used the Shapley value and another three methods to allocate the profit of the cooperative logistics network. Wang et al. [30] analyzed the profit distribution results of the core, nucleus, and Shapley value methods, and found that the Shapley value method was the most reasonable. Considering that profit distribution also involves risk sharing and other factors, scholars have modified the traditional Shapley value method to achieve a more fair and reasonable distribution. Jin [31] introduced the risk correction factors into the Shapley value model to distribute the profit among supply chain financing members. Guo et al. [32] proposed an improved Shapley value profit distribution model considering the difference of risk-bearing to allocate the transmission cost in cross-provincial power transactions. Gan et al. [33] took satisfaction and contribution into account and proposed a modified interval Shapley value profit distribution method. Zhou [34] modified the traditional Shapley value model based on factors such as risk, willingness to cooperate and quality input, so as to improve the rationality of profit distribution of the agricultural products supply chain. Huang et al. [35] introduced influencing factors such as resource contribution, status effect, risk-taking, additional subsidies, implementation level, and innovation efforts, and built a modified Shapley value model for the profit distribution of green supply chain collaboration.
The Shapley value model has been widely used in profit distribution due to its fairness in distribution results and calculation simplicity. However, both traditional and modified Shapley value models need to estimate the profit of each alliance. When there is a big deviation between the estimated value and the actual value, the rationality of these models will be greatly reduced. According to the Shapley value models, the greater the marginal contribution of a participant to the alliance’s profit, the more profit it should receive. Similarly, the more marginal contribution a participant makes to the efficiency of the alliance, the more profit it should receive. DEA is a good tool to measure the input–output efficiency of each object in a group of evaluation objects [36,37]. Through the combination of DEA technology and Shapley value, the marginal contribution of participants can be measured. Yang et al. [38] proposed a resource allocation model based on DEA and modified Shapley value. An et al. [39] studied the problem of resource sharing and payoff allocation in a three-stage system by integrating network DEA with the Shapley value method. Liu et al. [40] proposed a modified Shapley value model based on the preference DEA and used it to distribute the profit in the green supply chain.
The literature review shows that scholars mainly used Shapley value to study profit distribution, and some scholars combined Shapley value with DEA to allocate resources. However, the existing research has some deficiencies, which include: firstly, there is little literature on profit distribution based on DEA modified Shapley value model; secondly, the input and output data in DEA were assumed to be certain, but in reality, they may not be precise; thirdly, there is a lack of discussion on the selection of input and output indexes. In order to compensate for the above deficiencies, we first discuss the selection of RL input–output indexes, then construct a fuzzy DEA model to measure the efficiency in a fuzzy environment, and finally propose an improved Shapley value model based on fuzzy DEA efficiency to distribute RL profit.
3. Problem Description and Model Assumptions
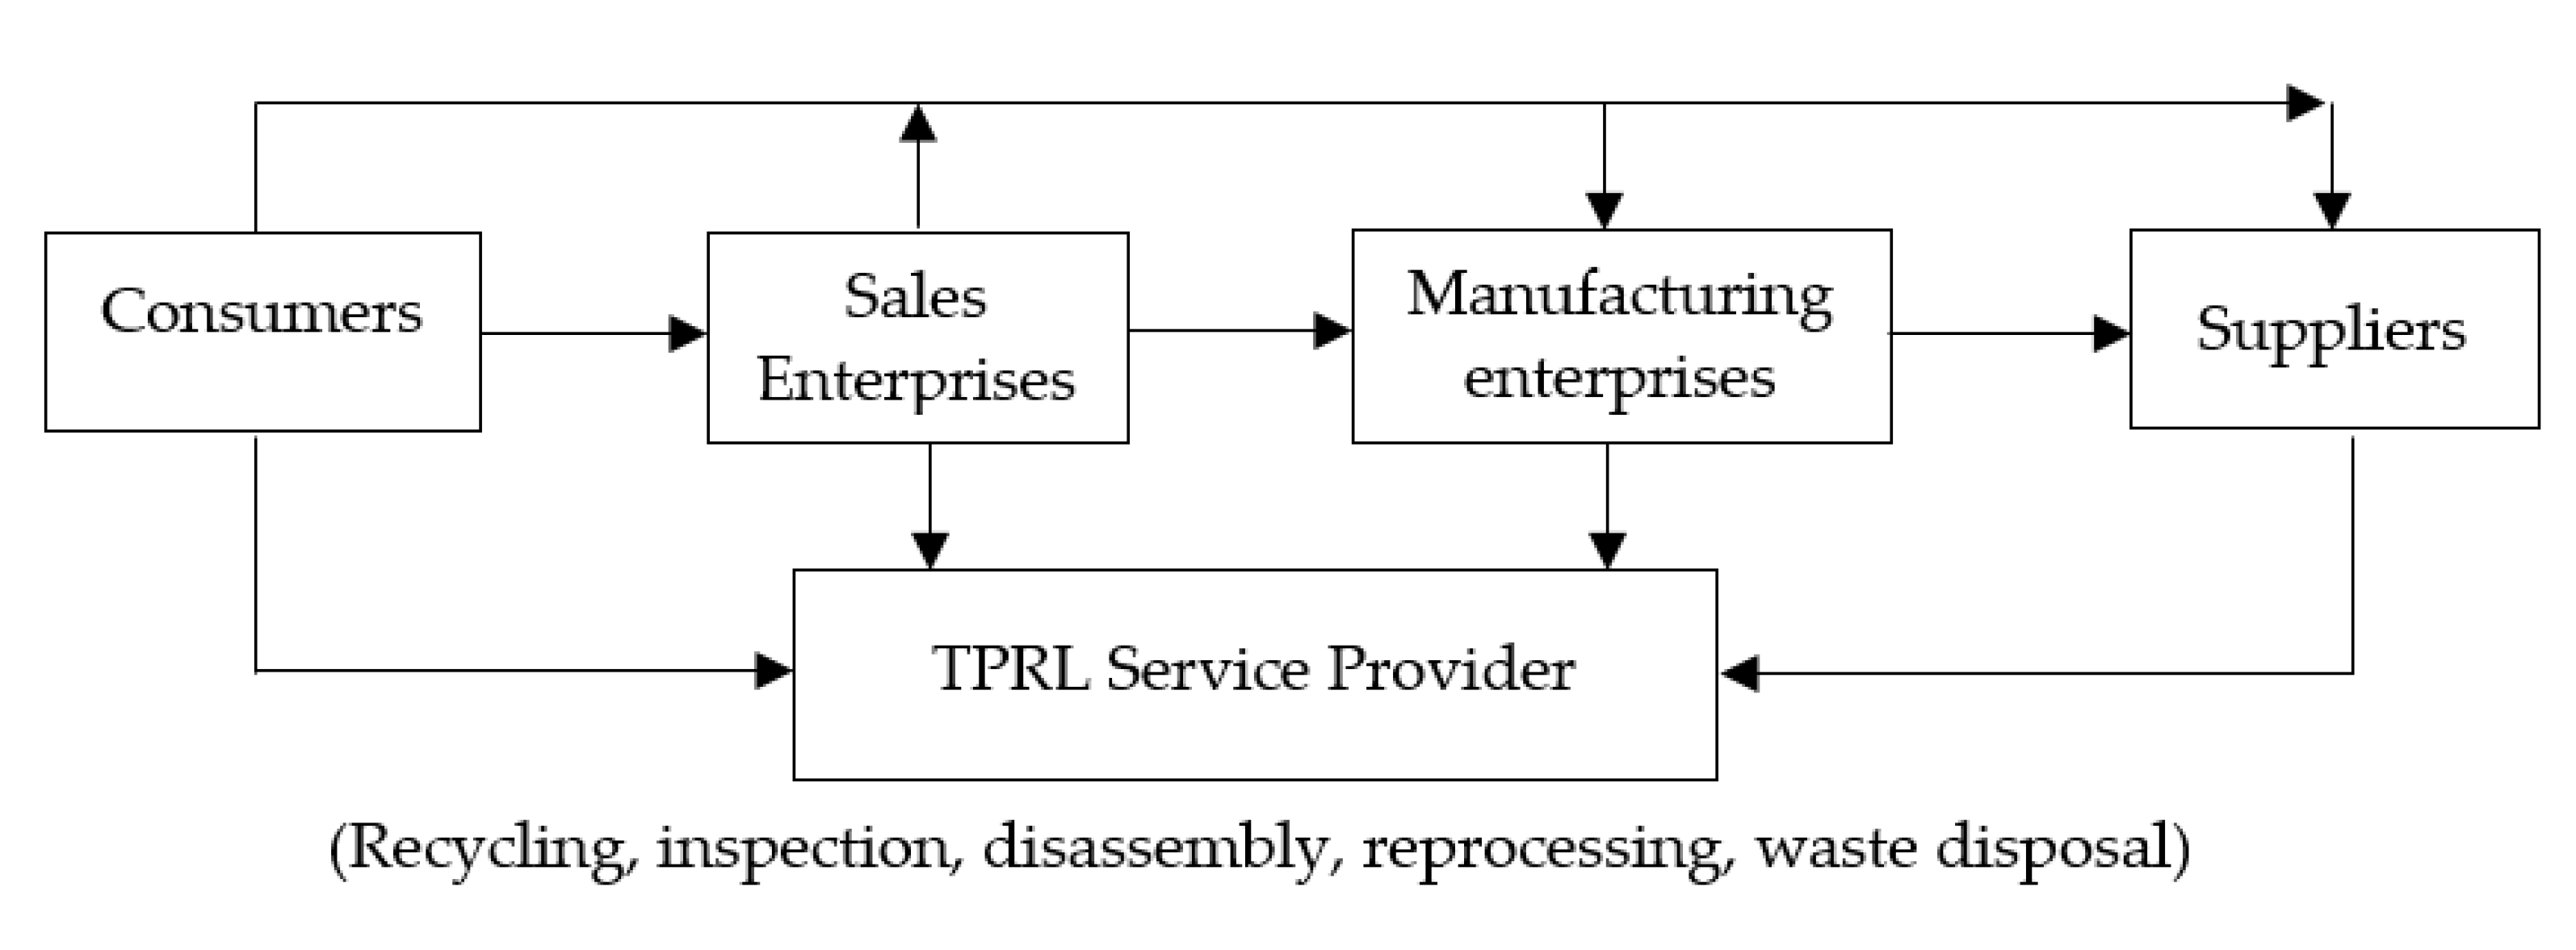
In the RL outsourcing mode, the TPRL service provider has mature and professional technologies in transportation, storage, inspection, separation, and reprocessing, and has a high-quality RL business team, so it is conducive to the improvement of RL operation efficiency and the increase of profit. At the same time, the information system of the TPRL service provider is relatively perfect, and the information feedback is timely and accurate, which can help the manufacturing and sales enterprises to grasp product dynamics, improve product quality and enhance customer satisfaction. The outsourcing mode is considered to be the most ideal RL mode. A complete RL system consists of suppliers, manufacturing enterprises, sales enterprises, consumers, and TPRL service providers, and its business process is shown in Figure 1. The TPRL service provider is the core of the whole system, undertaking the main business work of RL, including recycling, inspection, disassembly, reprocessing, and waste disposal.
Manufacturing enterprises, sales enterprises and the TPRL service provider together constitute the main body of the RL system, and their main responsibilities are as follows:
- Manufacturing enterprises: deliver the abandoned inventory, waste products, waste materials, or defective returned products to the TPRL service provider.
- Sales enterprises: deliver defective returned products, outdated inventory, or waste packaging to TPRL service provider.
- TPRL service provider: deliver the recycled raw materials or the reprocessed semi-finished products to the manufacturing enterprises and deliver the reprocessed products or packaging to the sales enterprises.
Due to technology complementarity and scale economy, tripartite cooperation will improve the RL operation efficiency, and the profit of cooperative alliance is often higher than the sum of the profits of individual participants. Each member enterprise hopes to obtain a higher profit equal to or greater than its contribution to the alliance. Therefore, it is necessary to provide a reasonable profit distribution scheme. In order to avoid estimating the profits of different alliances, we use the fuzzy DEA model to measure the efficiency and then propose a modified Shapley value model based on marginal efficiency contribution. To ensure that the above ideas are scientific, we make the following assumptions:
Assumption 1.
All the member enterprises are rational participants who are willing to form a cooperative alliance to implement RL business and accept fair profit distribution.
Assumption 2.
In order to ensure the implementation of the distribution scheme, each member enterprise assigns a certain number of representatives to form a distribution team. Team members jointly determine the indexes and data of input and output and the value of decision-making parameters.
Assumption 3.
When the same input and output indexes of RL are selected, different participants are homogeneous, and their relative efficiency is comparable.
According to the above assumptions, the overall process of RL profit distribution in this study is as follows: firstly, the distribution team organizes experts to screen the input–output indexes by using a rough set method; secondly, the fuzzy input–output data used by each participant for RL are determined jointly; thirdly, the input–output data are input into the fuzzy DEA model to obtain the efficiency of different alliances; finally, the modified Shapley value model is constructed to calculate the marginal contribution of different participants, and the profit distribution is carried out accordingly.
4. The Establishment and Solution of Model
4.1. Fuzzy DEA Model
There are many methods to measure efficiency. For example, per capita output, unit investment return or unit equipment output can reflect the input–output efficiency of a certain resource. Of course, by weighting the above indexes, we can obtain the comprehensive input–output efficiency of a variety of resources. DEA is a comprehensive efficiency evaluation method, which is suitable for the situation of multi-input and multi-output and does not need to set the weight. In 1978, Charnes, Cooper and Rhodes first proposed a DEA model—namely, the CCR model [41]. They defined the evaluation object as the decision-making unit (DMU) and assumed that each DMU was in the fixed return to scale situation, establishing a mathematical programming model to measure the efficiency.
4.1.1. Input and Output Index Screening Based on Rough Set
The input and output indexes for evaluating the RL efficiency of different industries are not the same. Hammes et al. [42] proposed 12 RL efficiency evaluation indexes of civil construction, including discard capacity, availability of skilled labor, customer satisfaction, recovery efficiency ratio and so on. Bottani et al. [43] evaluated the RL efficiency in waste electrical and electronic equipment by using the operating cost, investment cost, production of recycled goods, inventory control, and other indexes. Wang et al. [44] selected fixed assets, employees, and revenue as the DEA indexes for RL efficiency measurement in the end-of-life vehicles industry. A rough set method can not only reflect the experts’ understanding of the importance of each index but can also reflect the understanding of the importance of efficiency measurement itself. At the same time, it can realize the reduction of multiple indexes. Therefore, we select the rough set method to screen the efficiency measurement index.
Taking the input index screening as an example: suppose we have obtained m initial DEA input indexes by means of team discussion or literature survey; then, we invite p RL domain experts to evaluate the importance of these indexes and the importance of efficiency measurement. Here, we use Likert’s five-level scale method, i.e., the numbers from 1 to 5 represent unimportant, general, important, very important, and especially important, respectively. We can obtain the decision table as shown in Table 1, where conditional attributes are the jth input index, j = 1,2,…,m; decision attribute D represents RL efficiency measurement; and are the evaluation results given by ith expert.
The steps of the rough set method to screen indexes are as follows [45]:
Step1: According to the decision attribute D, divide the universe into equivalence classes of : .
Where ,,,for ; ; .
Step2: Calculate the lower approximation of the kth equivalence class with respect to the conditional attribute set :
where represents the majority containment relationship, which is defined as
At the same time, we can obtain the β-C positive region of D:
where |•| is the cardinality of the set.
Step3: Remove the attribute from C, , and calculate . If = , it indicates that the attribute is redundant relative to the decision attribute D, so we can delete it from the condition attribute set C. If , it indicates that the attribute is non-redundant; therefore, we should keep it. Finally, we can obtain the reduced conditional attribute set.
Step4: According to steps 2 and 3, check whether there are redundant attributes in the reduced condition attribute set until all attributes are non-redundant.
Using the same method, we can obtain the reduced DEA output indexes.
4.1.2. DEA Model with L-R Fuzzy Numbers
Suppose there are n decision-making units in the RL system, which are homogeneous, comparable, and independent of each other. Each DMU uses types of inputs to produce types of output , and the input and output data are fuzzy numbers. For , the input—oriented fuzzy CCR model is defined as follows:
The DEA efficiency is relative, which is determined by the reference system of DMUs. Therefore, even for the same DMU, it has different efficiency values in different reference systems. For any subset in the RL system, the efficiency measurement model of is as follows:
Definition 1.
If the membership function of fuzzy number satisfies the following conditions:
where : is continuous and strictly increasing, : is continuous and strictly decreasing, then is called left and right fuzzy number, that is fuzzy number, denoted as . Especially when and are both linear functions, is called a trapezoidal fuzzy number. When , is called a symmetric trapezoidal fuzzy number, denoted as . When , degenerates into a triangular fuzzy number, denoted as . When and , is called a symmetric triangular fuzzy number, denoted as [46].
According to the definition, fuzzy number has the following properties:
(1) The sum and difference of two fuzzy numbers are still fuzzy numbers.
(2) The product of a fuzzy number and a non-zero real number is still an fuzzy number.
Theorem 1.
Suppose there are two fuzzy numbers and , where , is a real number, ; then, the sufficient and necessary condition for satisfying is as follows:
Theorem 2.
If and have bounded support sets and , then the sufficient condition for can be derived as follows:
Suppose all the input and data of n DMUs are the same type of fuzzy numbers:
where
Then the model (5) can be transformed into the following model:
4.1.3. Transformation of Fuzzy DEA Model
The input and output data in the RL system can be estimated in a variety of fuzzy number representations. If the input and output data of each member enterprise are all trapezoidal fuzzy numbers, denoted as , then as a special case of fuzzy number, are linear functions,. Given the confidence level , model (9) can be transformed into the following model:
Furthermore, if the input and output data are symmetric trapezoidal fuzzy numbers, then , denoted as . If the input and output data are triangular fuzzy numbers, then , denoted as . If the input and output data are symmetric triangular fuzzy numbers, then , denoted as .
According to model (10), . When , it means that DMUk is DEA efficient. When , it means that DMUk is not DEA efficient. The smaller the , the lower the efficiency of DMU and the smaller its contribution to the alliance. In order to use the efficiency value to indicate the contribution of each DMU to the alliance, we construct a characteristic function related to the efficiency value and establish a modified Shapley value model for profit distribution.
4.2. Modified Shapley Value Model
4.2.1. Traditional Shapley Value Model
Shapley proposed a model for resource distribution in a cooperative game in 1953. Different from the traditional egalitarian distribution method, this model distributes resource according to each member’s contribution to the alliance. The Shapley value model has been widely used because of its scientific distribution and simple calculation. Suppose there is a set containing participants—that is, —then some participants may form an alliance , . Let represent the characteristic function of alliance , satisfying super-additivity:. In other words, the sum of the profits of two disjoint alliances acting alone is not larger than that of two alliances acting together. Therefore, the profit of the whole alliance will not decrease because of the increase of the number of participants, and the cooperation among participants will not damage the inherent interests of individual participants. When all participants cooperate together, the profit of the whole alliance reaches the maximum. Let represent the profit that the ith participant should share in cooperation in the alliance ; the traditional Shapley value is defined as:
where is the number of participants in the alliance , is the characteristic function of , represents the probability that the alliance appears in the set , represents the marginal contribution of the ith participant to alliance .
It can be seen from the above model that the determination of Shapley value is closely related to the characteristic function. The characteristic function should satisfy super-additivity. Based on the efficiency value of fuzzy DEA, we define the characteristic function as
It is not difficult to prove that the characteristic function under this definition is super-additive.
Proof.
According to the above definition, the following formula holds:
Suppose the set . For the input-oriented DEA model (9), the objective function is to minimize the efficiency value. With the expansion of feasible region, the optimal value does not decrease. Therefore, given the confidence level α, the fuzzy DEA efficiency value of the same DMU will be monotonous and not decrease with the number of DMUs in the alliance; that is,
Thus,. The characteristic function is proved to be super-additive. □
4.2.2. A Modified Shapley Value Model Based on Fuzzy DEA
Assuming that the input and output data of DMUs are all fuzzy numbers, the modified Shapley value at a given confidence level is an n-dimensional vector , where
Similar to the traditional Shapley value model, represents the probability of the appearance of alliance . represents the influence degree of the kth member enterprise on the efficiency of original alliance. The larger is, the more influence the kth member enterprise has on the other participants, and the greater its contribution to alliance . represents the efficiency change degree of the kth member enterprise before and after joining the alliance. The smaller the , the more efficient the kth member enterprise is, and vice versa. Therefore, represents the contribution of the kth member enterprise to the alliance . With the change of the member enterprises in the alliance , represents the average contribution of the kth member enterprise to the whole alliance .
When there is only one member enterprise in the RL system, at any confidence level , always holds, so the Formula (13) can be reduced to the following form:
Since is the average contribution of a member enterprise, the Shapley value reflects only its relative contribution degree to the alliance rather than the actual contribution value. Therefore, the relative contribution degree should be converted into the relative contribution ratio:
If the total profit generated by the RL system is , the profit that each member enterprise should share is as follows:
In summary, the steps for a complete profit distribution among the different member enterprises of an RL system are as follows:
Step1: Invite several experts in the field of RL to evaluate the importance of the indexes and screen the evaluation indexes according to the rough set index selection steps in Section 4.1.1.
Step2: List all alliances that may be formed by member enterprises in the RL system.
Step3: According to the input and output data of member enterprises, with a given confidence level, use model (9) to calculate the fuzzy efficiency value of each member enterprise in different alliances.
Step4: According to the efficiency values of each member enterprise in different alliances, use the modified Shapley value model (14) to calculate the Shapley value of each member enterprise.
Step5: On the basis of the average contribution of each member enterprise in step 4, use Formula (15) to obtain the relative contribution ratio of each member enterprise to the alliance.
Step6: Use Formula (16) to calculate the distribution of the total profit in each member enterprise.
5. Numerical Example
In this section, the profit distribution among the RL member enterprises is analyzed through specific numerical example.
5.1. The Basic Numerical Example
Assume that the RL system includes two manufacturing enterprises A and B, one sales enterprise C, and one TPRL service provider D.
The first step is to screen the evaluation indexes. By conducting a questionnaire survey of RL domain experts with high theoretical levels and practical experience, we obtained 11 initial indexes, including six input indexes—i.e., the number of employees, total employee wages, fixed asset investment, investment in R&D, storage cost and management cost—and five output indexes—i.e., net profit, cost savings, revenue from resource reuse, reputation, and customer satisfaction. The statistical scope of the above index is only limited to the part of the enterprise related to the RL business. In order to simplify the calculation of the model, we used the rough set index to filter the above indexes. The decision tables given by 10 experts are shown in Table 2 and Table 3.
Rosetta software is a tabular logic data analysis toolkit based on the rough set theoretical framework [50]. By using Rosetta software to perform the reduction of the indexes, we obtain two reduction results: {storage cost, fixed asset investment} and {total employee wages, fixed asset investment, investment in R&D}. According to the experts’ suggestion, we choose a longer reduction result {total employee wages, fixed asset investment, investment in R&D}. At the same, we obtain the reduced result of output indexes: {resource reuse income, customer satisfaction}. Therefore, input indexes of the DEA model include total employee wages, fixed asset investment, investment in R&D, and the output indexes include resource reuse income, customer satisfaction.
In the second step, all the alliances that the four member enterprises in the RL system may form are {A}, {B}, {C}, {D}, {A, B}, {A, C}, {A, D}, {B, C}, {B, D}, {C, D}, {A, B, C}, {A, B, D}, {A, C, D}, {B, C, D}, {A, B, C, D}.
In the third step, we obtain the input and output data of each member enterprise as shown in Table 4. The total employee wages and customer satisfaction are symmetrical triangular fuzzy numbers, the fixed asset investment is a symmetrical trapezoidal fuzzy number, investment in R&D is a trapezoidal fuzzy number, and resource reuse income is a triangular fuzzy number.
The total profit distributed in the RL system consisting of four member enterprises is assumed as $1,000,000. Taking the confidence level of 0.5 as an example, we calculate the fuzzy efficiency value of each member enterprise in different alliances by using the model (10). The result is shown in Table 5.
In the fourth step, based on the data in Table 5, we use the modified Shapley value model (14) to calculate the Shapley value of each member enterprise. Then, use Formula (15) to calculate the relative contribution of each member enterprise to the RL alliance. We thereby use Formula (16) to calculate the profit that each member enterprise should share.
Taking member enterprise as an example, the calculation process of its Shapley value is shown in Table 6 when .
When , the Shapley values of the four member enterprises are 0.814, 0.738, 0.742, and 0.733, respectively. The profits distributed to A, B, C and D are 26.891, 24.381, 24.513 and 24.215, respectively.
5.2. Comparison with Other Models
This section consists of the comparative analysis of other models. Assuming that all the member enterprises take part in the RL alliance with their own input–output efficiency, then the profit can be distributed according to their efficiency. In the first model, we use the fuzzy DEA efficiency value of each member enterprise in the whole alliance as the basis of distribution. By normalizing the data in the last row of Table 5, we obtain the profit distribution scheme, as shown in Table 7.
In the second model, we use the output per unit input as the efficiency index and obtain six efficiency indexes from three input indexes and two output indexes. When , the expected values of the input and output data of each enterprise are shown in Table 8, where the trapezoidal fuzzy number has an expected value , and the triangular fuzzy number has an expected value [51].
The values of the six efficiency indexes are shown in Table 9. By using the entropy value method, we obtain the objective weights of six indexes, which are 0.108, 0.096, 0.200, 0.202, 0.149 and 0.244. For comparison, we use the average method to weigh the indexes subjectively; that is, the weights of the six indexes are 1/6.
The efficiency and profit distribution values of each member enterprise under the two weighting methods are shown in Table 10.
It can be seen that the results of the two weighting methods are different, which shows that the weighting method has a significant impact on the distribution results. Comparing the results in Table 7 and Table 10, we find that the selection of the efficiency index has a great impact on the allocation results. Furthermore, the DEA efficiency-based method only considers the relative efficiency of each member enterprise in the whole alliance and cannot identify the marginal contribution after joining the alliance. Therefore, compared with the distribution based on efficiency only, the modified Shapley method based on DEA efficiency does not need to consider the index weights, and takes efficiency and fairness into account.
5.3. Sensitivity Analysis
5.3.1. On Confidence Level
The confidence level refers to the probability that the statistical value of the sample falls within a specific positive–negative interval of the parameter value. It indicates the degree to which a specific individual believes in the authenticity of a specific proposition. Different levels of confidence can reflect the member enterprises’ preference for risk. With the change of confidence, the profit of each member enterprise changes correspondingly. According to the degree of risk preference, decision-makers can be divided into risk preference, risk neutrality, and risk aversion. When the confidence level is 0.25, 0.5, and 0.75, the RL profit distribution scheme is shown in Table 11.
As can be seen from Table 11, the efficiency value of member enterprises B, C and D do not change along with different confidence, which is a constant 1. However, the distributed profits of B, C and D are related to the confidence level. It can be concluded that the profit distribution of the modified Shapley value model is not based on the efficiency value, but on the efficiency marginal contribution. The modified Shapley value model can ensure the fairness and rationality of the profit distribution scheme.
On the other hand, it can be seen from Table 11 that as the increment of confidence level increased from 0.25 to 0.75, the efficiency value of enterprise A gradually decreased based on the input-oriented DEA model, while enterprises B, C and D are always DEA efficient. This indicates that with the increase of confidence, the contributions of member enterprises B, C and D to the RL system become lower, which can be proved by the diminishing profits they share. However, the efficiency value of enterprise A decreases with the increase of confidence degree. The relative efficiency of A becomes higher, and its share of profit gradually increases. In addition, confidence can be seen as an indicator of policymakers’ appetite for risk. Thus, decision-makers can choose the profit distribution scheme under the corresponding confidence level according to their actual risk preferences.
5.3.2. On the Number of Member Enterprises
We change the number of member enterprises by increasing sales enterprise E and calculate the profit of each member enterprise to verify the effectiveness of the model. The input and output data of A, B, C, and D are the same as the calculation example in Section 5.1. The input and output data of sales enterprise E are shown in Table 12.
All the possible alliances of five member enterprises and the fuzzy efficiency values of each member enterprise in different alliances are shown in Table 13.
According to the profit distribution steps in Section 4, when the confidence level is 0.5, the profit distribution scheme of the RL alliance is shown in Table 14.
As can be seen from Table 14, even if the input–output data of A, B, C and D remain unchanged after E joins the alliance, the addition of E has a significant impact on the marginal contribution of each enterprise. Moreover, the relationship in which C receives the most profit, followed by D, with B receiving the least profit, is broken. Therefore, the modified Shapley value model based on Fuzzy DEA is in accordance with the objective reality and has important practical application value in the profit distribution of RL.
6. Conclusions and Discussion
A scientific and reasonable profit distribution is conducive to attract more enterprises into the RL industry. At the same time, it can increase the enthusiasm of member enterprises to participate in cooperation, thereby improving the stability and continuity of the operation of the RL alliance. On the other hand, it can also encourage enterprises to carry out technological innovation, improve their competitiveness, and promote the recovery and reuse of resources. What is more, forming an RL alliance may be a potential approach to alleviate the environmental pollution and resource shortage. Therefore, research on the profit distribution of RL alliance has great practical significance for the sustainable development of society and the harmonious coexistence between man and nature.
With the widespread concern for environmental protection, RL has developed rapidly. We investigate the profit distribution among manufacturing enterprises, sales enterprises, and TPRL service providers in RL alliance when each member enterprise’s input and output data are fuzzy numbers. The Shapley value reflects the contribution of each member enterprise to the whole alliance, and the DEA efficiency value can reflect its relative effectiveness. It is more practical to consider the input and output data of each member enterprise as fuzzy numbers than the accurate real numbers. In this study, we present a modified Shapley value model by introducing the characteristic function related to the input-oriented DEA efficiency. We attempt to supply a reference to solve the problem that traditional Shapley value model needs to evaluate the cooperative profit of different alliance subsets. Taking an RL system including two manufacturing enterprises, a sales enterprise, and a TPRL service provider as an example, we testify the calculability and effectiveness of the proposed model. The profit distribution result is consistent with the contribution degree of each member enterprise, which is in line with the actual situation. As the outsourcing mode is the most promising RL operation mode, we study the profit distribution among member enterprises on this mode. Actually, the model proposed in this paper can also be applied to the profit distribution under the joint operation mode.
The profit distribution model proposed in this paper has some defects. Firstly, it only considers the case that the input and output data are L-R fuzzy numbers. Secondly, it only considers the profit distribution among manufacturing enterprises, sales enterprises, and TPRL service providers. If the government as a policymaker participates in the RL alliance, government subsidies and other factors will impact the profit distribution scheme. Therefore, the future research directions mainly include the following aspects: first, in addition to L-R fuzzy number, other fuzzy DEA models or stochastic DEA models can be considered to measure RL efficiency in uncertain environments; second, the impact of government participation or the correlation between different parties on RL profit distribution can be discussed.
Author Contributions
Conceptualization, J.S.; methodology, J.S.; writing—original draft preparation, X.M.; writing—review and editing, J.S., R.C. and X.M. All authors have read and agreed to the published version of the manuscript.
Funding
This research was funded by Fundamental Research Funds for the Central Universities, grant number 20CX04003B.
Institutional Review Board Statement
This paper does not contain any studies with human or animal participants performed by the author.
Informed Consent Statement
This paper does not contain any studies with human or animal participants performed by the author.
Data Availability Statement
The data used to support the findings of this study are available from the corresponding author upon request.
Acknowledgments
The authors are grateful to anonymous reviewers and editors for their comments and suggestions on this paper.
Conflicts of Interest
The authors declare no conflict of interest.
References
- Li, Y.J.; Feng, L.P.; Zhao, X.K.; Xu, F.C. Overview on RL management research in new era of operations management. Syst. Eng. Theory Pract. 2020, 40, 2008–2022. [Google Scholar]
- Stock, J.R. Reverse Logistics; Council of Logistics Management: OAK Brook, IL, USA, 1992; Volume 2. [Google Scholar]
- Zhang, T.; Yu, X.M. Analysis and reference on the experience of foreign RL development. Pract. Foreign Econ. Relat. Trade 2015, 9, 86–88. [Google Scholar]
- Ke, J.L.; Jiang, W.J.; Yang, X.R. Comparison of the development gap of green logistics between China and Japan and experience reference. Pract. Foreign Econ. Relat. Trade 2018, 12, 87–91. [Google Scholar]
- Dong, R. Discuss how to choose RL operation mode in manufacturing enterprises. China Bus. Trade 2013, 27, 115–116. [Google Scholar]
- Gan, J.W.; Luo, L.; Kou, R. Progress and prospects of sustainable RL network design. Control Decis. 2020, 35, 2561–2577. [Google Scholar]
- Li, J. Analysis on the operation mode of enterprise RL. Mark. Mod. 2006, 34, 140. [Google Scholar]
- Karam, A.; Tsiulin, S.; Reinau, K.H.; Eltawil, A. An Improved Two-Level Approach for the Collaborative Freight Delivery in Urban Areas, LISS2019; Zhang, J., Dresner, M., Zhang, R., Hua, G., Shang, X., Eds.; Springer: Singapore, 2020; pp. 775–787. [Google Scholar] [CrossRef]
- Azab, A.; Karam, A.; Eltawil, A. Impact of Collaborative External Truck Scheduling on Yard Efficiency in Container Terminals. In Operations Research and Enterprise Systems. ICORES 2017. Communications in Computer and Information Science; Parlier, G., Liberatore, F., Demange, M., Eds.; Springer: Cham, Switzerland, 2017. [Google Scholar] [CrossRef]
- Xu, X.F.; Hao, J.; Zheng, Y. Multi-objective artificial bee colony algorithm for multi-stage resource leveling problem in sharing logistics network. Comput. Ind. Eng. 2020, 142, 106338. [Google Scholar] [CrossRef]
- Xu, X.F.; Wei, Z.F.; Ji, Q.; Wang, C.L.; Gao, G.W. Global renewable energy development: Influencing factors, trend predictions and countermeasures. Resour. Policy 2019, 63, 63. [Google Scholar] [CrossRef]
- Xu, X.F.; Lin, Z.R.; Li, X.; Shang, C.J. Multi-objective robust optimisation model for MDVRPLS in refined oil distribution. Int. J. Prod. Res. 2021, 5, 1–21. [Google Scholar]
- Xu, X.F.; Lin, Z.R.; Zhu, J. DVRP with limited supply and variable neighborhood region in refined oil distribution. Ann. Oper. Res. 2020, 1–25. [Google Scholar] [CrossRef]
- Ahmed, K.; Awady, A.E. Integrating collaborative and outsourcing strategies for yard trucks assignment in ports with multiple container terminals. Int. J. Logist. Manag. 2019, 32, 3–4. [Google Scholar]
- Xu, X.F.; Hao, J.; Yu, L.; Deng, Y.R. Fuzzy optimal allocation model for task-resource assignment problem in collaborative logistics network. IEEE. Trans. Fuzzy Syst. 2019, 27, 1112–1125. [Google Scholar] [CrossRef]
- Croce, A.I.; Musolino, G.; Rindone, C.; Vitetta, A. Route and path choices of freight vehicles: A case study with floating car data. Sustainability 2020, 12, 8557. [Google Scholar] [CrossRef]
- Xu, X.F.; Wang, C.L.; Zhou, P. GVRP considered oil-gas recovery in refined oil distribution: From an environmental perspective. Int. J. Prod. Econ. 2021, 235, 108078. [Google Scholar] [CrossRef]
- Li, W.H.; Chen, Q.; Wang, Q. R&D cooperation and profit coordination between upstream and downstream firms based on NASH negotiation model. JIEM 2012, 26, 65–71. [Google Scholar]
- Sheu, J.B.; Gao, X.Q. Alliance or no alliance—Bargaining power in competing reverse supply chains. Eur. J. Oper. Res. 2014, 233, 313–325. [Google Scholar] [CrossRef]
- Kato, W.; Arizono, I.; Takemoto, Y. A proposal of bargaining solution for cooperative contract in a supply chain. J. Intell. Manuf. 2018, 29, 559–567. [Google Scholar] [CrossRef]
- Jiang, N.; Zhang, L.L.; Yu, Y. Optimizing cooperative advertizing, profit sharing, and inventory policies in a VMI Supply chain: A Nash bargaining model and hybrid algorithm. IEEE. Trans. Eng. Manag. 2015, 62, 449–461. [Google Scholar] [CrossRef]
- Atay, A.; Solymosi, T. On bargaining sets of supplier-firm-buyer games. Econ. Lett. 2018, 167, 99–103. [Google Scholar] [CrossRef] [Green Version]
- Zhu, X.D.; Wang, J.; Tang, J. Recycling pricing and coordination of WEEE dual-channel closed-loop supply chain considering consumers’ bargaining. Int. J. Environ. Res. Public Health 2017, 14, 1578. [Google Scholar] [CrossRef] [Green Version]
- Gong, W.W.; Ge, C.C.; Chen, J.X.; Pan, J.G. Division models of profit in three-echelon reverse supply chain cooperation based on Nash models. Ind. Eng. Manag. 2011, 16, 16–21. [Google Scholar]
- Wei, G.X.; Huang, X.Y.; Qin, Y.H. Carbon emission reduction of supply chain based on revenue sharing contract and Nash bargaining fairness. Ecol. Econ. 2017, 33, 63–68. [Google Scholar]
- Panda, S.; Modak, N.M.; Basu, M.; Goyal, S.K. Channel coordination and profit distribution in a social responsible three-layer supply chain. Int. J. Prod. Econ. 2015, 168, 224–233. [Google Scholar] [CrossRef]
- Mahmoodi, A. Stackelberg-Nash equilibrium of pricing and inventory decisions in duopoly supply chains using a nested evolutionary algorithm. Appl. Soft Comput. 2019, 86, 105922. [Google Scholar] [CrossRef]
- Li, B.Z.; Luo, X.F. Study on profit allocation of enterprise’s original innovation with an industry-university-research cooperative mode based on the Shapley value. Oper. Res. Manag. Sci. 2013, 22, 220–224. [Google Scholar]
- Wang, Y.; Yuan, Y.Y.; Assogba, K.; Gong, K.; Wang, H.Z.; Xu, M.Z.; Wang, H.Y.; Ibeas, A. Design and profit allocation in two-echelon heterogeneous cooperative logistics network optimization. J. Adv. Transport. 2018, 2018, 4607493. [Google Scholar] [CrossRef] [Green Version]
- Wang, X.; Zhang, P.W.; Sun, H. Research on profit distribution plan of supply chain alliance based on resource input. Stat. Decis. 2018, 34, 55–59. [Google Scholar]
- Jin, B. Construction of game model of supply chain financing income distribution. Stat. Deci. 2013, 5, 51–54. [Google Scholar]
- Guo, H.W.; Zhao, R.; Pu, L.; Wu, J.; Tan, Z.F. The improved Shapley model of multi-party cooperation profit distribution in trans-provincial power transactions. Math. Pract. Theory 2019, 49, 46–53. [Google Scholar]
- Gan, M.; Yang, S.; Li, D.D.; Wang, M.F.; Chen, S.; Xie, R.H.; Liu, J.Y.; Gershenson, C. A novel intensive distribution logistics network design and profit allocation problem considering sharing economy. Complexity 2018, 2018, 4678358. [Google Scholar] [CrossRef] [Green Version]
- Zhou, Y.F. Profit distribution mechanism of agricultural products supply chain based on improved Shapley value model. Stat. Decis. 2017, 23, 52–54. [Google Scholar]
- Huang, X.M.; Yang, S. The research on profit allocation strategy of cooperative green supply chain—Application of modified Shapley value based on blockchain. J. Econ. Manag. Strat. 2020, 8, 14–19. [Google Scholar]
- Russo, F.; Corrado, R. Data Envelopment Analysis (DEA) For Evacuation Planning. In Proceedings of the 7th International Conference on Computer Simulation in Risk Analysis & Hazard Mitigation, Algarv, Portugal, 13–15 September 2010. [Google Scholar]
- Musolino, G.; Rindone, C.; Vitetta, A. Evaluation in transport Schemening: A comparison between data envelopment analysis and multi criteria decision making methods. In Proceedings of the 31st European Simulation and Modelling Conference, Lisbon, Portugal, 25–27 October 2017. [Google Scholar]
- Yang, Z.H.; Zhang, Q.W. Resource allocation based on DEA and modified Shapley value. Appl. Math. Comput. 2015, 263, 280–286. [Google Scholar] [CrossRef]
- An, Q.; Wen, Y.; Ding, T.; Li, Y. Resource sharing and payoff allocation in a three-stage system: Integrating network DEA with the Shapley value method. Omega 2019, 85, 16–25. [Google Scholar] [CrossRef]
- Liu, P.; Gao, G.J. P-DEA and Shapley value models based on green supply chain profit distribution. J. Railw. Sci. Eng. 2018, 15, 2448–2454. [Google Scholar]
- Charnes, A.; Cooper, W.W.; Rhodes, E. Measuring the efficiency of decision making units. Eur. J. Oper. Res. 1978, 2, 429–444. [Google Scholar] [CrossRef]
- Hammes, G.; Souda, E.D.D.; Rodriguez, C.M.T.; Millan, R.H.R.; Herazo, J.C.M. Evaluation of the RL performance in civil construction. J. Clean. Prod. 2020, 248, 119212. [Google Scholar] [CrossRef]
- Bottani, E.; Montanari, R.; Rinaldi, M. Simulation and performance improvement of a RL system for waste electrical and electronic equipment: A case study in Italy. Int. J. Simul. Process Model. 2019, 14, 308–323. [Google Scholar] [CrossRef]
- Wang, Z.; Hao, H.; Gao, F.; Zhang, Q.; Zhang, J.; Zhou, Y. Multi-attribute decision making on RL based on DEA-TOPSIS: A study of the Shanghai End-of-life vehicles industry. J. Clean. Prod. 2019, 214, 730–737. [Google Scholar] [CrossRef]
- Slowinski, R.; Vanderpooten, D. A generalized definition of rough approximations based on similarity. IEEE. Trans. Knowl. Data Eng. 2000, 12, 331–336. [Google Scholar] [CrossRef]
- Ramík, J.; Ímánek, J. Inequality relation between fuzzy numbers and its use in fuzzy optimization. Fuzzy Sets Syst. 1985, 16, 123–138. [Google Scholar] [CrossRef]
- Tanaka, H.; Ichihashi, H.; Asai, K. A formulation of fuzzy linear programming problem based on comparison of fuzzy numbers. Control. Cybern. 1984, 13, 41–52. [Google Scholar]
- Wang, M.Q.; Liang, L.; Li, Y.J. Fuzzy super-efficiency DEA model. Chin. J. Manag. Sci. 2009, 17, 117–124. [Google Scholar]
- Yang, Z.H.; Zhang, Q.W. Resource allocation among decision making units with fuzzy data—Based on DEA and Shapley value. Syst. Eng. Theory Pract. 2016, 36, 719–725. [Google Scholar]
- Xu, X.; Liu, Y.B.; Fan, X.X. Data mining with rough set based on fuzzy toolbox and ROSETTA. Microcomput. Inf. 2007, 23, 174–175. [Google Scholar]
- Liu, B.; Zhao, R.; Wang, G. Uncertain Programming with Applications; Tsinghua University Press: Beijing, China, 2003. [Google Scholar]
Figure 1.
RL business process in outsourcing mode.

Table 1.
Decision table of input index evaluation.
| Expert Serial Number | Conditional Attributes | Decision Attributes | |||
|---|---|---|---|---|---|
| … | D | ||||
| 1 | … | ||||
| 2 | … | ||||
| p | … | ||||
Table 2.
Input indexes selection decision.
| Expert Serial Number | Number of Employees | Total Employee Wages | Fixed Asset Investment | Investment in R&D | Storage Cost | Management Cost | Efficiency |
|---|---|---|---|---|---|---|---|
| 1 | 5 | 5 | 2 | 2 | 5 | 3 | 3 |
| 2 | 4 | 4 | 3 | 2 | 5 | 4 | 5 |
| 3 | 4 | 5 | 3 | 2 | 4 | 4 | 4 |
| 4 | 3 | 4 | 2 | 3 | 4 | 3 | 3 |
| 5 | 4 | 4 | 4 | 2 | 4 | 4 | 4 |
| 6 | 5 | 4 | 3 | 3 | 5 | 3 | 5 |
| 7 | 5 | 5 | 2 | 3 | 5 | 4 | 3 |
| 8 | 4 | 4 | 3 | 4 | 4 | 4 | 4 |
| 9 | 5 | 4 | 2 | 3 | 5 | 3 | 3 |
| 10 | 3 | 5 | 3 | 4 | 3 | 5 | 4 |
Table 3.
Output indexes selection decision.
| Expert Serial Number | Net Profit | Amount of Cost Savings | Resource Reuse Income | Reputation | Customer Satisfaction | Efficiency |
|---|---|---|---|---|---|---|
| 1 | 4 | 4 | 5 | 4 | 3 | 3 |
| 2 | 5 | 5 | 4 | 3 | 5 | 5 |
| 3 | 5 | 4 | 4 | 3 | 4 | 4 |
| 4 | 4 | 5 | 4 | 4 | 2 | 3 |
| 5 | 4 | 4 | 4 | 2 | 3 | 4 |
| 6 | 5 | 4 | 5 | 4 | 4 | 5 |
| 7 | 4 | 4 | 4 | 2 | 3 | 3 |
| 8 | 5 | 4 | 4 | 4 | 4 | 4 |
| 9 | 5 | 4 | 5 | 4 | 5 | 3 |
| 10 | 3 | 4 | 4 | 3 | 4 | 4 |
Table 4.
Input and output data for four member enterprises.
| Member Enterprises | A | B | C | D |
|---|---|---|---|---|
| Total Employee Wages/104$ | (79.8, 9.1) | (57.2, 2.1) | (87.6, 6.9) | (81.5, 7.3) |
| Fixed Asset Investment/104$ | (41.2, 44.5, 3.3) | (29.3, 33.6, 2.1) | (31.1, 35.2, 3.7) | (45.6, 47.5, 2.1) |
| Investment in R&D/104$ | (51.5, 54.3, 2.3, 2.5) | (43.3, 45.4, 2.1, 1.9) | (21.2, 24.5, 1.3, 0.7) | (57.6, 62.3, 3.7, 2.5) |
| Resource Reuse Income/104$ | (81.2, 2.5, 4.7) | (69.5, 3.3, 2.5) | (51.3, 1.5, 3.7) | (113.7, 5.3, 2.1) |
| Customer Satisfaction/% | (74.5, 5.1) | (80.3, 6.2) | (85.7, 2.3) | (87.2, 3.4) |
Table 5.
The efficiency value of four member enterprises (confidence α = 0.50).
| S | A | B | C | D |
|---|---|---|---|---|
| — | — | — | — | |
| {A} | 1.000 | — | — | — |
| {B} | — | 1.000 | — | — |
| {C} | — | — | 1.000 | — |
| {D} | — | — | — | 1.000 |
| {A, B} | 0.993 | 1.000 | — | — |
| {A, C} | 1.000 | — | 1.000 | — |
| {A, D} | 0.994 | — | — | 1.000 |
| {B, C} | — | 1.000 | 1.000 | — |
| {B, D} | — | 1.000 | — | 1.000 |
| {C, D} | — | — | 1.000 | 1.000 |
| {A, B, C} | 0.962 | 1.000 | 1.000 | — |
| {A, B, D} | 0.891 | 1.000 | — | 1.000 |
| {A, C, D} | 0.915 | — | 1.000 | 1.000 |
| {B, C, D} | — | 1.000 | 1.000 | 1.000 |
| {A, B, C, D} | 0.856 | 1.000 | 1.000 | 1.000 |
Table 6.
The Shapley value calculation process of member enterprise A.
| {} | 0 | 1.000 | = 0.814 | |
| {B} | 0.993 | |||
| {B, C} | 0.962 | |||
| {B, C, D} | 0.856 | |||
| {C}, {D}, {B, D}, {C, D} | ||||
Table 7.
Profit distribution scheme according to the fuzzy DEA efficiency value.
| Member Enterprises | A | B | C | D |
|---|---|---|---|---|
| Efficiency Value | 0.856 | 1.000 | 1.000 | 1.000 |
| Normalized ratio | 0.222 | 0.259 | 0.259 | 0.259 |
| Distribution of Profit | 22.199 | 25.934 | 25.934 | 25.934 |
Table 8.
The expected values of input and output data.
| Indexes | A | B | C | D |
|---|---|---|---|---|
| Total Employee Wages/104$ | 79.8 | 57.2 | 87.6 | 81.5 |
| Fixed Asset Investment/104$ | 42.85 | 31.45 | 33.15 | 46.55 |
| Investment in R&D/104$ | 52.95 | 44.3 | 22.7 | 59.65 |
| Resource Reuse Income/104$ | 81.75 | 69.3 | 51.85 | 112.9 |
| Customer Satisfaction/% | 74.5 | 80.3 | 85.7 | 87.2 |
Table 9.
The values of six efficiency indexes.
| Indexes | A | B | C | D |
|---|---|---|---|---|
| Resource Reuse Income per Total Employee Wage | 1.024 | 1.212 | 0.592 | 1.385 |
| Resource Reuse Income per Fixed Asset Investment | 1.908 | 2.203 | 1.564 | 2.425 |
| Resource Reuse Income per Investment in R&D | 1.544 | 1.564 | 2.284 | 1.893 |
| Customer Satisfaction per Total Employee Wage | 0.934 | 1.404 | 0.978 | 1.070 |
| Customer Satisfaction per Fixed Asset Investment | 1.739 | 2.553 | 2.585 | 1.873 |
| Customer Satisfaction per Investment in R&D | 1.407 | 1.813 | 3.775 | 1.462 |
Table 10.
Profit distribution scheme according to the fuzzy DEA efficiency value.
| Weighting Method | Member Enterprises | A | B | C | D |
|---|---|---|---|---|---|
| Entropy | Efficiency Value | 0.098 | 0.549 | 0.612 | 0.387 |
| Normalized ratio | 0.059 | 0.333 | 0.372 | 0.235 | |
| Distribution of Profit | 5.928 | 33.346 | 37.198 | 23.527 | |
| Average | Efficiency Value | 0.157 | 0.614 | 0.516 | 0.491 |
| Normalized ratio | 0.089 | 0.345 | 0.290 | 0.276 | |
| Distribution of Profit | 8.852 | 34.541 | 29.015 | 27.592 |
Table 11.
Profit distribution schemes at different levels of confidence.
| Confidence Degree | Member Enterprises | A | B | C | D |
|---|---|---|---|---|---|
| Efficiency Value | 0.865 | 1.000 | 1.000 | 1.000 | |
| Shapley Value | 0.808 | 0.739 | 0.743 | 0.734 | |
| Distribution of Profit | 26.719 | 24.439 | 24.570 | 24.272 | |
| Efficiency Value | 0.856 | 1.000 | 1.000 | 1.000 | |
| Shapley Value | 0.814 | 0.738 | 0.742 | 0.733 | |
| Distribution of Profit | 26.891 | 24.381 | 24.513 | 24.215 | |
| Efficiency Value | 0.847 | 1.000 | 1.000 | 1.000 | |
| Shapley Value | 0.821 | 0.738 | 0.741 | 0.731 | |
| Distribution of Profit | 27.087 | 24.349 | 24.447 | 24.117 |
Table 12.
Input and output data for five member enterprises.
| Member Enterprises | E |
|---|---|
| Total Employee Wages/104$ | (90.3, 5.4) |
| Fixed Asset Investment/104$ | (42.5, 47.9, 6.4) |
| Investment in R&D/104$ | (29.7, 35.2, 3.2, 2.7) |
| Resource Reuse Income/104$ | (56.7, 6.9, 5.8) |
| Customer Satisfaction/% | (87.6, 3.2) |
Table 13.
The efficiency value of five member enterprises (confidence α = 0.50).
| S | A | B | C | D | E |
|---|---|---|---|---|---|
| — | — | — | — | — | |
| {A} | 1.000 | — | — | — | — |
| {B} | — | 1.000 | — | — | — |
| {C} | — | — | 1.000 | — | — |
| {D} | — | — | — | 1.000 | — |
| {E} | — | — | — | — | 1.000 |
| {A, B} | 0.993 | 1.000 | — | — | — |
| {A, C} | 1.000 | — | 1.000 | — | — |
| {A, D} | 0.994 | — | — | 1.000 | |
| {A, E} | 1.000 | — | — | — | 1.000 |
| {B, C} | — | 1.000 | 1.000 | — | — |
| {B, D} | — | 1.000 | — | 1.000 | — |
| {B, E} | 1.000 | — | — | 1.000 | |
| {C, D} | — | — | 1.000 | 1.000 | — |
| {C, E} | — | — | 1.000 | — | 1.000 |
| {D, E} | — | — | — | 1.000 | 1.000 |
| {A, B, C} | 0.962 | 1.000 | 1.000 | — | — |
| {A, B, D} | 0.891 | 1.000 | — | 1.000 | — |
| {A, B, E} | 0.984 | 1.000 | — | — | 1.000 |
| {A, C, D} | 0.915 | — | 1.000 | 1.000 | — |
| {A, C, E} | 1.000 | — | 1.000 | — | 1.000 |
| {A, D, E} | 0.938 | — | — | 1.000 | 1.000 |
| {B, C, D} | — | 1.000 | 1.000 | 1.000 | — |
| {B, C, E} | — | 1.000 | 1.000 | — | 0.942 |
| {B, D, E} | — | 1.000 | 1.000 | — | 1.000 |
| {C, D, E} | — | — | 1.000 | 1.000 | 0.989 |
| {A, B, C, D} | 0.856 | 1.000 | 1.000 | 1.000 | — |
| {A, B, C, E} | 0.962 | 1.000 | 1.000 | — | 0.942 |
| {A, B, D, E} | 0.874 | 1.000 | — | 1.000 | 1.000 |
| {A, C, D, E} | 0.915 | — | 1.000 | 1.000 | 0.989 |
| {B, C, D, E} | — | 1.000 | 1.000 | 1.000 | 0.938 |
| {A, B, C, D, E} | 0.856 | 1.000 | 1.000 | 1.000 | 0.938 |
Table 14.
Profit distribution scheme of five member enterprises (confidence α = 0.50).
| Member Enterprises | A | B | C | D | E |
|---|---|---|---|---|---|
| Efficiency Value | 0.856 | 1.000 | 1.000 | 1.000 | 0.938 |
| Shapley Value | 0.811 | 0.738 | 0.764 | 0.940 | 0.7705 |
| Distribution of Profit | 20.156 | 18.342 | 18.988 | 23.363 | 19.151 |
Publisher’s Note: MDPI stays neutral with regard to jurisdictional claims in published maps and institutional affiliations. |
© 2021 by the authors. Licensee MDPI, Basel, Switzerland. This article is an open access article distributed under the terms and conditions of the Creative Commons Attribution (CC BY) license (https://creativecommons.org/licenses/by/4.0/).
Share and Cite
MDPI and ACS Style
Song, J.; Ma, X.; Chen, R. A Profit Distribution Model of Reverse Logistics Based on Fuzzy DEA Efficiency—Modified Shapley Value. Sustainability 2021, 13, 7354. https://doi.org/10.3390/su13137354
AMA Style
Song J, Ma X, Chen R. A Profit Distribution Model of Reverse Logistics Based on Fuzzy DEA Efficiency—Modified Shapley Value. Sustainability. 2021; 13(13):7354. https://doi.org/10.3390/su13137354
Chicago/Turabian StyleSong, Jiekun, Xiaoping Ma, and Rui Chen. 2021. "A Profit Distribution Model of Reverse Logistics Based on Fuzzy DEA Efficiency—Modified Shapley Value" Sustainability 13, no. 13: 7354. https://doi.org/10.3390/su13137354
Note that from the first issue of 2016, this journal uses article numbers instead of page numbers. See further details here.