
Bounded Rationality, Social Capital and Technology Adoption in Family Farming: Evidence from Cocoa-Tree Crops in Ivory Coast

1
Economics of Mutuality Solutions SA, Maison de la Paix, Chemin Eugène-Rigot 2, 1202 Genève, Switzerland
2
UMR Développement & Sociétés, Sorbonne Institute of Development Studies (IEDES), Université Paris 1 Panthéon Sorbonne, 75231 Paris, France
*
Author to whom correspondence should be addressed.
Sustainability 2021, 13(13), 7483; https://doi.org/10.3390/su13137483
Submission received: 26 March 2021
/
Revised: 28 May 2021
/
Accepted: 10 June 2021
/
Published: 5 July 2021
(This article belongs to the Special Issue Social Capital as an Input of Social Sustainability in Rural and Agricultural Cooperatives)
Abstract
:In this paper, we allege that the hypothesis in favor of bounded rationality is a plausible explanation when it comes to better understanding the sluggish pace of adoption of best available tree crop farming techniques in poor small-scale rural communities. Our research builds on data collection and analysis of cocoa farming in Ivory Coast. Firstly, we find that the cognitive scarcity under which smallholder farmers make their decisions, in particular, satisficing behavior and fast and frugal heuristics, outweigh the scarcity of financial and human resources. Secondly, we show that the structure of the environment measured through various dimensions of social capital influences human rationality and decision-making. On the one hand, the greater smallholder farmers’ civic capital (solidarity, reciprocity, trustworthiness, cooperation), the more likely they are to modify their farming practices (p < 0.05) and, more specifically, to exchange information, learn, and eventually revise these practices. On the other hand, the greater the number of organizations the farmers participate in, the greater the probability of modifying their practices (p < 0.01). Information about farming techniques disseminates through weak bridging ties built within agricultural organizations (e.g., cooperatives, extension services) rather than through strong bonding ties between family or diaspora members.
Keywords:
bounded rationality; cognitive capability; social capital; technology adoption; family farmingJEL Classification:
O13; 030; Q12; Q161. Introduction
Why are cash crops yields, such as those of the cocoa tree, three to five times below what they could be? (In fact, we observe that productivity is stagnant. Yields are about 500 kg/ha on average, while they can go up to 1500 up to 2500 kg/ha in on-farm trials. See, for example, Aneani and Ofori-Frimpong [1] and Wessel and Foluke Quist-Wessel [2].) More generally, how to understand the failure by smallholder farmers in sub-Saharan Africa to substantially increase export-oriented tree-crop productivity and the sluggish pace towards the technology frontier? The first answer that springs to mind is that they usually do not implement the most efficient agronomic practices. What is less obvious is the reason for such behavior. What hinders the diffusion and implementation of best available agricultural technologies? The barriers to agricultural technology adoption most often considered in the economic development literature are external constraints such as credit, input and output, land and labor market imperfections, and informational inefficiencies. (See, for instance, the literature reviews by Jack [3] and Mwangi and Kariuki [4].)
In this paper, we put the emphasis on decision-making. Our analysis takes a close look at what Nobel Laureate Herbert Simon [5,6] called bounded rationality considering both individual cognitive capabilities and the influence of the social environment, which are the two blades of the same pair of scissors to borrow the metaphor used by Simon [6]. The first blade concerns cognitive scarcity, whereas the second blade concerns the structure of the environment (e.g., agents with whom a farmer interacts). Gigerenzer and Selten [7] outline that studies referring to bounded rationality usually focus on the first blade, but neglect the second one. However, when individuals face alternatives for which they lack information and/or cognitive abilities to make a decision, closer cooperation and interaction between actors of the same group may facilitate access to information and provide training and skill enhancement. By examining both blades of the scissors, this article is therefore related to two strands of literature that address technology adoption in family farming. Firstly, it is grounded in the field of behavioral economics. (The literature review by Kremer et al. [8] offers a comprehensive state-of-the-art overview of these topics. Datta and Mullainathan [9] is another which focuses on how to take advantage of behavioral economics in designing development programs and policies. See also the World Development Report: Mind, Society, and Behavior [10].) Secondly, it is also related to the literature devoted to social capital, which on the one hand emphasizes learning through participation in networks or village organizations in order to overcome informational inefficiencies (Munshi [11]), and on the other hand refers to one’s perception about community members’ solidarity, fairness, and trustworthiness, and about each member’s willingness to live by the norms of the community (see, among others, Coleman [12]; Bowles and Gintis [13]; and Guiso et al. [14]). (The collection of articles compiled in Social Capital, a Multifaceted Perspective [15] and its overview by Dasgupta provide an insightful assessment of the concept by leading sociologists, economists, and political scientists. Literature reviews in the field of economics are also available in Durlauf and Fafchamps [16] and Fehr [17], among others, whereas Portes [18] reviews origins and definitions of social capital in the sociological literature.) Our analysis thus echoes the seminal contribution of Granovetter [19] who makes it very clear that economic behavior is embedded in a given social environment. (See also the more recent essay by Demeritt and Hoff [20].)
We argue that bounded rationality is key to explaining barriers to the adoption of best agricultural practices. To this end, we placed a set of questions dealing with agronomic practices as a module in a 2014 survey implemented in the field by ENSEA (Abidjan, Ivory Coast). (The École nationale supérieure de statistique et d’économie appliquée is an institute of statistics and applied economics, whose main missions and activities are to train senior statistician-economists and to carry out research and provide expertise in statistics.) This survey covers smallholder farmers from various villages in the Southwestern region of Ivory Coast, the world’s largest and historic producer of cocoa. Firstly, the module explicitly asks farmers whether they have modified their farming practices over the last two years. Secondly, it includes an open-ended question asking why farmers have modified their agronomic practices or not, letting them give their own explanation. Thirdly, a set of questions aimed at eliciting each farmer’s perception of other village members in terms of expected behavior (e.g., solidarity and cooperation) and belief and opinion (e.g., reciprocity and trustworthiness). Fourthly, the survey includes a set of questions that addresses the issue of group membership and networks, together with the type of information exchanged within each group. (Our survey is largely inspired by the World Bank’s integrated questionnaire for the measurement of social capital (see Grootaert and Van Bastelaer [21]; Grootaert et al. [22]). We made some modifications consistently with the local context.)
The open-ended question allows us to identify the underlying reasons that have led most farmers to proceed with business as usual. The answers show that cognitive scarcity play a prominent role in farmers’ status quo bias, while external constraints are less frequently mentioned. Specifically, we show that almost half of the farmers who have not changed their farming practices over the last two years, who represent 70% of the global sample, claim that they are satisfied with their practices, or that they produce in sufficiently large quantities. They appear to have adopted a “satisficing” farming practice, in the sense of Simon [23], a portmanteau of the words “satisfying” and “sufficing.” (“Evidently, organisms adapt well enough to ‘satisfice’; they do not, in general, ‘optimize’.” Simon ([6], p. 129).) When farmers reach a level of production that they consider good enough, they do not try to adopt or even look for new agronomic practices. In other words, they cannot be called optimizers. (At this stage, it is noteworthy that if a farmer continues with business as usual, for example, just because of the habit, it does not necessarily mean that his preferences for traditional practices are not rational. By definition, individual preferences are rational as long as they are complete and transitive. As shown by Rubinstein [24], individual preferences described by a satisficing procedure are complete and transitive. Thus, bounded rationality is not irrationality.) More generally, the status quo in adopting new technology prevails and appears significant in decision-making; satisficing, conservatism, habits, and a fear of the unfamiliar are the most frequent answers reported to explain inertia. Three quarters of the farmers (only 24% of the total sample) who have modified their farming practices report that they did so to enhance their productivity. This wording may suggest that these smallholder farmers have focused on maximizing performance. Yet, farmers may proceed with the goal of satisficing rather than maximizing, and at the same time modify their farming practices anyway, to eventually reach the yield that they aspire to. Therefore, our empirical evidence is likely to provide only a lower bound of bounded rationality.
Regarding the second blade of the scissors, we show that it is a key factor when it comes to adopting technology. The greater smallholder farmers’ social capital, the more likely they are to exchange information, learn, and eventually revise their farming practices. In line with the seminal work of Granovetter [25], this knowledge about farming practices spreads more through weak bridging ties established inside farmers’ organizations and via extension services than through strong family and/or diaspora linkages.
Last but not least, our reason for choosing to focus on a cash crop such as cocoa is rooted in the association between the life cycle of the tree and its productivity, which is inverted U-shaped, as is the case with the farmer’s investment decisions (Bros et al. [26]). (In Bros et al.’s [26] study, a change in agricultural practices may present a risk that the farmer is willing to take at the beginning or near the end of the tree’s life cycle, but not when the tree reaches maturity and enters into full productivity.) Inherent intertemporal choices in such an activity compel us to take into consideration that this type of crop requires farmers to be forward-looking. As a consequence, the level of poverty among the smallholder farmers together with the amount of time it takes to eventually reap uncertain and far-off benefits of their efforts and labor may indeed lessen their motivation and ability to fine-tune their practices (see, among others, Haushofer and Fehr [27]; Schilbar et al. [28]). Moreover, in contrast to subsistence farming, tree crops are care-intensive (Guirkinger et al. [29]), which makes the processing of information and its dissemination among quite a small farming community particularly complex and costly. This does not necessarily lead farmers to be irrational, but presumably to limit their aspirations. We argue that the study of the puzzling issue of a low adoption rate in best up-to-date farming practices in West Africa must distinguish between tree crops and other crops. (See, among others, Takahashi et al. [30] for food crops, in particular, corn and rice.)
As such, our study differs in purpose from related studies aimed at assessing the role of networks in learning and social capital, a club good that stimulates the exchange of information, in the successful adoption of high-yielding seed varieties (Foster and Rosenzweig [31]; Shiferaw et al. [32]), new crops (Bandiera and Razul [33]; Conley and Udry [34]), or improved farmland management practices (Wossen et al. [35]), among many others. Our methodology and analysis is based on a quantitative and qualitative (i.e., non-directive versus structured interviews) survey of smallholder households. It thus also differs from the increasingly used randomized control trials in field experiments like, for example, Duflo et al. [36] and Hanna et al. [37]. (See also the literature review on field experiments in developing country agriculture by De Janvry et al. [38].)
The rest of the paper is organized as follows. Section 2 presents the survey along with descriptive statistics on yield, productivity growth, inputs, and decision-making over the life cycle of the tree for each of the two categories of farmers, those who have changed their farming practices in the last two years and those who have not. Section 3 provides a behavioral diagnosis on decision-making; that is, reasons why farmers have decided to change their farming practices or not. In Section 4, a map of social capital is built using a Multiple Correspondence Analysis (MCA) where the farmers are assigned two principal coordinates, thereby providing a bivariate continuous distribution of social capital. This section also examines the information exchanged within various village organizations, as identified in the field (e.g., cooperatives, diaspora, etc.). In Section 5, we estimate the marginal impact of social capital on the decision-making regarding the adoption of new agronomic practices. Section 6 concludes.
2. Context and Preliminary Raw Data on Yield, Inputs, Productivity Growth, and the Tree Life Cycle
2.1. Data
We administered the household survey in September 2014. Our social capital and agronomic practice survey covers five villages across three sub-prefectures (Grand Zattry, Méagui, and Oupoyo) located in the South-West Nawa region of Ivory Coast. It comprises more than twelve hundred (n = 1262) smallholder cocoa producers, who were interviewed face to face by trained and experienced surveyors.
The survey provides information on the smallholder farmers’ characteristics: indigenous people resident versus internal or external migrants, age, the village where they were born, education, whether they hold administration rights, (For a comprehensive analysis about the crucial role played by the absence of formal property rights on both tenure security and investment incentives for indigenous residents versus migrants in Ivory Coast and, more generally, West Africa, see Fenske ([39,40], respectively)), their household size, and the number of male adults involved in farming. The size and age of the main plantation are also reported.
Both a farmer’s need for information and social capital are difficult to pin down. For instance, the need for information cannot be observed directly but only through the smallholder farmer’s actions. What is observable and measurable is the action or, on the contrary, the status quo that is maintained with respect to agronomic practices. We interpret such a bias in favor of the status quo as a resistance to change, which can be understood as a mental attitude that views novelty as more costly than beneficial and induces a behavioral bias that curtails the farmer’s decision-making freedom. Thus, we explicitly asked farmers about a zero-one decision “Have you modified your farming practices over the last two years?” and “why?”, an open-ended question type, which allows us to make a behavioral diagnosis (see Section 3).
Social capital is measured at the micro level in its structural form, such as networks for instance, and in its cognitive form, such as solidarity, reciprocity, trustworthiness, and cooperation. In order to derive our social capital variables, we build on the World Bank’s Integrated Questionnaire for the Measurement of Social Capital (Grootaert et al. 2004 [22]) as further detailed in Section 4.
Our data exhibit some heterogeneity in the productivity as the average yield is found to be 442.7 kg/ha, yet it ranges from 354.5 kg/ha in the least productive village to 583.9 kg/ha in the most productive village. In any event, even the highest yield falls short of what it could have been had the most efficient practices been adopted. Indeed, only 30% of the farmers declared that they had changed their farming practices, while 70% said that they stuck to the status quo. These proportions are in line with what has been observed in decision-making experiments (Samuelson and Zeckhauser [41]).
The challenge is to better understand the attachment of such a large share of farmers to the status quo. At this stage, it should be underlined that the farmers who constitute our sample and are included in our calculations already use inputs (fertilizers, pesticides, and fungicides) and pay special attention to shade, which aims at protecting the fruit against the sun and regulates temperature and humidity levels. More than 80% reported that they used pesticides and fungicides during the year preceding the survey, and nearly all of them took care of the trees by removing suckers. The only reservation is that only slightly more than half of them applied fertilizer.
2.2. Changes in Farming Practices, Yield, and Productivity Growth
The nonparametric kernel-based density estimates of smallholder farmers’ plantation yields standardized at the village level, together with their 95% confidence intervals, are displayed in Figure 1. Although the yield distribution of farmers who made changes (red line) is located to the right of the distribution of those who did not (blue line), the density functions with the red and blue confidence intervals clearly show that the two distributions are very similar. They are not statistically different at the 95% confidence level, and the statistical modes are not dissimilar. There is one small exception: the top ten most productive farmers are proportionally more likely to have modified their farming practices.
As a consequence, it is easier to understand why local farmers who look at the plantations around them and the afferent farming techniques implemented might not reach unequivocal conclusive inferences based on their own observations.
It should also be noted that the productivity level of just over 70% of farmers (i.e., n = 919) remained steady over the past three years (see Table 1). This 70% whose productivity stayed unchanged does not, however, match the 70% of farmers who did not modify their agricultural practices. This scenario applies approximately to more than two-thirds (68.13%) of the farmers who changed their practices and to close to three-quarters (74.97%) of those who did not. Among the 30% of farmers who reported having modified their farming practices, only one-fourth (24.09%) experienced an increase in productivity. The number of those farmers whose productivity decreased regardless of the strategy implemented represents a mere 6.42%. Finally, the two groups of farmers whose productivity growth either increased or decreased are fairly evenly distributed: a good third of them (35.63% and 37.04%, respectively) changed their practices and close to two-thirds did not (64.37% and 62.96%, respectively).
Clearly, prima facie evidence suggests that modified practices do not result in markedly different yields or paths of productivity growth compared to the business-as-usual case. At this stage, it seems reasonable to assume that the relatively small size of the village community and the size of small-scale plantations lead farmers more often than not to draw hasty conclusions based on limited evidence (see Tversky and Kahneman [42]).
2.3. Changes in Farming Practices and the Life Cycle of the Tree
The propensity to adopt new farming practices may also hinge on the production stage of cocoa plantations. The density functions of the plantation age since the most recent regeneration with red and blue 95% confidence intervals are reported in Figure 2. They correspond to the yes- and no-modification groups, respectively. Firstly, there is a clear bimodal distribution, with a higher proportion (slightly more than 70%) of either young plantations under the age of 10 or quite old plantations aged 30 years or more. The median is just over twenty years old. Secondly, despite having quite similar twin peak distributions, the density functions are statistically different at the 5% level in the middle of the distributions. The amount of mass appears to be larger in the middle of the distribution where there is a greater proportion of farmers who did not change their farming practices.
This result appears to confirm the key influence of the life cycle of the tree on our variable of interest: the decision to modify farming techniques or not in the past two years. We provide a more detailed discussion of this matter in the multivariate analysis section (see Section 5 below).
How can such inertia both in agricultural practices and the outcome achieved be explained? Below, we further explore the empirical evidence addressing this key issue related to factors determining the adoption of up-to-date agricultural technology. Specifically, we consider individual cognitive scarcity, paying special attention to social capital.
3. Preliminary Evidence for a Status Quo Bias in Decision-Making
3.1. External Constraints versus Cognitive Scarcity
In this section, following recommendations from Datta and Mullainathan [9], we provide a behavioral diagnosis, which allows us to gain perspective on potential psychological bottlenecks versus the explanation for the lack of adoption of efficient agronomic practices, which is more often than not attributed to the scarcity of financial and material resources. It is useful to recall that farmers who did not make any changes to their farming practices were asked why they had made that decision via an open-ended question, so that they were free to mention either type of constraint. (Equivocal answers were almost never given in practice.)
3.1.1. External Constraints: Lack of Resources and Informational Inefficiencies
Two main kinds of external constraints, which can be related to a lack of resources on the one hand and to informational inefficiency on the other, have been identified.
On the one hand, among farmers who did not modify their farming practices (n = 876, which is 70% of the total sample), between a fifth and a fourth (22.2%) reported that they had not modified them because they lacked financial means, time, labor force, income, or equipment. For example, “lack of resources” and “lack of time” are the reasons given by Farmers #7 and #125, respectively.
On the other hand, there are two types of information constraints. Firstly, 8.1% did so because they complied with the instructions of the extension services to do nothing, or because they did not receive any specific guidelines to change their practices. For example, Farmer #694 answered: “Comply with the instructor’s guidelines.” For Farmer #214, it is because “the extension service did not mention any other techniques to him,” etc. Secondly, only 10.5% of respondents claimed that they lacked knowledge/skills/information on other practices. This is a case of informational inefficiency, associated with a lack of knowledge or information, which is acknowledged by the farmer. In connection with our focus on bounded rationality, this second category of farmers facing information constraints illustrates (though without proving it) the idea of heuristics as discussed in Gigerenzer [43], where fast and frugal stopping rules for search do not involve optimization. Put together, this may explain the disappointing results obtained by agricultural extension programs that focus on improving skills and increasing the efficiency of the family farm, and are formulated to bring about changes in small-scale farming practices (Anderson and Feder [44]; Cunguara and Moder [45]).
3.1.2. Limited Cognitive Capabilities: Satisficing, Tradition, Habit, and Imitation
Slightly less than half of the farmers (45.5%) who did not modify their farming practices can be described as satisficers (i.e., one-third of the total sample). These farmers did not consider it necessary to revise their practices or they already deemed them satisfactory. The striking feature within this group is that a large majority of them state that they are “satisfied” with their practices in the light of their knowledge and/or outcome. At the very least, they do not express any dissatisfaction. Note that this differs from the informational inefficiency mentioned above, in which the farmer is aware of a lack of information. Others reported that their achieved level of output was “good” (Farmer #696), or that they already implemented “good” practices (Farmer #639), or that they produced in “sufficient” quantity (Farmer #450).
They therefore seem inclined to adopt sufficiently good rather than optimal tree-crop farming practices, which refers to Simon’s [46,47,48] concept of bounded rationality. Put differently, for any of the farmers, there is a tendency to express regrets, which in light of Schwartz et al.’s [46] results, provides us with a reasonable degree of statistical confidence about rejecting the null hypothesis that smallholder farmers, on average, are rational seekers of optimal outcomes mostly facing external constraints.
For just over one-tenth of these farmers (11.3%), traditional practices are to be preferred to modern practices. In most cases, we encountered farmers who answered: “That is how we have always done it”; or who expressed their “preference” for traditional practices, for example, those passed down from generation to generation. For others, it is simply a matter of “habit.” Finally, a few farmers also recognized that moving away from traditional practices could be considered as a “risk.” These behaviors are examples of judgment biases such as, for instance, the anchoring bias. For these farmers, it seems pointless in any event to overcome business-as-usual. They tend to overvalue tradition, thus showing an anti-innovation bias.
Finally, if bounded rationality includes imitation, such farmers remain very rare as they account for a mere 2.4% of the total sample.
3.2. Reasons for Adopting a Proactive Behavior
The modification of farmers’ agricultural practices over the past two years is largely motivated by the determination to increase their productivity (76.4%), that is to say economic incentives. There are two other main explanations for modifying their practices: the regeneration of their plantation (12.7%), which shows a forward-looking strategy, and recommendations made by the extension services (8.3%).
These proactive farmers are not necessarily optimizers searching for the best possible technology, unlike the researchers and agronomists who test the efficiency of new technologies in various on-farm trials. Thus, we cannot reject the idea that they are satisficers whose aspirations have not been met yet (Simon [23]).
A synthetic view of all the sub-categories identified with their proportion in the total sample is provided in Figure 3.
3.3. Farmers’ Socioeconomic Characteristics, Plantation Size and Yield, and the Status Quo
Are there differences in behavior between indigenous residents and internal (mostly Baoulé) and external (mostly from Burkina Faso and Mali) migrants? Do the latter have a particular propensity to change their farming practices relative to indigenous residents? Can it be inferred that indigenous residents are more conservative? Indigenous residents seem more inclined to favor the status quo compared to migrants. The null hypothesis of independence is rejected at the 1% significance level. Farmers who claim to have administration rights for their plantations are significantly more prone to have made adjustments in their farming practices over the past two years. The null hypothesis of independence between on the one hand “having changed practices over the last two years” and age (i.e., hands-on experience) and on the other hand educational background (i.e., human capital) cannot be rejected. More experienced or educated farmers do not behave on average differently from others (see Table 2).
When considering plantation size, it appears that farmers working a relatively small plantation (≤2 ha) are more in favor of maintaining the status quo (¾ versus ⅔), while those in the upper quartile have a proactive behavior. Thus, a native farmer working a small plantation whose productivity is below 500 kg/ha and who does not have administration rights over it might be expected to exhibit a strong resistance to change in year-to-year agricultural practices; a null hypothesis is tested in the multivariate analysis in Section 5.
3.4. External Constraints, Cognitive Scarcity, and Productivity
Are satisficing or reluctance to change inferior decision strategies in terms of individual relative productivity? A question that comes to mind is whether farmers who resist change in their agronomic practices, as a priori they might be subject to cognitive biases, fare better or, on the contrary, worse than their village neighbors. As stated earlier, farmers do not reach their decision-making regardless of what they can perceive in the environment around them. We present standardized productivity at the village level for each of the sub-categories selected and discussed above. They are ranked by increasing order of productivity (see Figure 4).
Farmers who have not made any changes in their cultivation practices because of so-called internal constraints (i.e., satisficing, tradition, habit, and herd behavior) display levels of productivity that are not significantly different from the village-level average. They perform almost as well as their village average, but by no means better or worse. Only the farmers who modified their practices in order to improve their yield have a significantly higher productivity compared to their village’s mean. On the contrary, only those who said that they lacked resources to justify their inaction exhibit a negative relative productivity which is significantly different from zero. Together, these two groups are still a minority in our total sample, 24% and 15%, respectively (see Figure 3 above).
Last but not least, none of the identified sub-categories obtain an average yield that differs significantly from the others. In particular, satisficers and traditional/business-as-usual farmers obtain average yields that are not significantly different from farmers who are proactive in the quest for improved productivity. Hence, neither satisficing nor business-as-usual strategies should be regarded as inferior decision strategies, at least from a smallholder farmer’s perspective, which eventually leads to a self-reinforcing system with trees that are not at full production.
As already suggested, farmers may simply not have as much evidence as they need within their community to encourage them to change their farming practices. Acknowledging these field conditions and the paucity of available information, it is therefore not really surprising that 70% of smallholder farmers choose the status quo. Such a pattern of behavior may be assimilated to the so-called representativeness heuristic, in which the actors consider occurrences similar to familiar experiences as more likely (Kahneman and Tversky [47]).
4. Civic Capital, Group Membership, and Information Exchange
How can this resistance to change be further explained or, on the contrary, how can the proactive behavior towards technology adoption be justified? We now come to the second blade of the pair of scissors. Specifically, what part does the social environment play, since along with the cognitive scarcities outlined above, it might be a complementary source of smallholder farmers’ bounded rationality? In this section, we explore the role of both civic capital and group membership, and we examine the substance of the information exchanged within various groups (e.g., agricultural organization versus diaspora) which may lead farmers to revise their agronomic practices.
4.1. Civic Capital Space: Solidarity, Reciprocity, Trustworthiness, and Cooperation
We use questions about how smallholder farmers in a community perceive other community members in terms of expected behavior (e.g., solidarity and cooperation), and belief and opinion (e.g., reciprocity and trustworthiness). (In the definition of individual civic capital, we follow Guiso et al. [14].) We then perform a Multiple Correspondence Analysis (see Le Roux and Rouanet [49]) to obtain principal components, which we interpret as dimensions of the civic capital space within which each farmer is located through coordinates relative to the others. (See Bourdieu [50], for a well-known application of this data analysis technique.) In such a social space where farmers make their decisions, we observe the locus of points representing the relationship among farmers both within and across villages, as well as endogenously selected features that describe how farmers take stock of civic behaviors and attitudes within their community. Thus, we obtain a continuous multivariate distribution of civic capital, which aims at describing the external informative data structure at least partially. In Bourdieu’s words [51]:
“The social world can be represented as a space (with several dimensions) constructed on the basis of principles of differentiation or distribution constituted by the set of properties active within the social universe in question. [...] Agents and groups of agents are thus defined by their relative positions within that space.”
Just like in the physical space, farmers occupy positions in the civic capital space, which are identified through the set of coordinates in the reference frame of the MCA’s principal components. The closer the farmers are in the space, the more features used to build the civic capital space they have in common. These individual coordinates provide a multidimensional continuous distribution of civic capital: a less noisy measure of individual trust than the usual discrete variables such as “in general, one can trust people.”
From our analysis, the first two orthogonal dimensions that emerge from the data represent 74% of total variance, respectively, 54% and 20%. The questions and their associated modalities, which contribute to each dimension with specific weights, represent their relative contribution to the variance of each dimension (see Table 3). Our civic capital space reflects the relationships among farmers with respect to the themes used to organize the questions classified in decreasing order (see Table 4): (i) solidarity (e.g., “most of the time, people try to help”); (ii) reciprocity (e.g., “people try to take advantage”); (iii) trustworthiness (e.g., “most people can be trusted”); and (iv) cooperation (e.g., “how often did you take part in a collective action with others over the past three years?”).
Firstly, smallholder farmers are located in the two-dimensional civic capital space as depicted in Figure 5. Those located in the northeast quadrant tend to see people in their community as trustworthy, fair, and caring. They are also more actively involved in community actions. By contrast, farmers located in the southwest quadrant are distrustful and suspicious of other people in their community. Note that, similarly to results obtained across countries or for regions belonging to the same country, there is a great degree of diversity across villages, even though they do not lie very far apart from each other geographically. Thus, Villages 4 and 5 are characterized by the highest mean civic capital. Incidentally, they are also the most productive ones, which suggests that it may be useful to consider village-specific fixed effects: a check about the relative importance of inter- versus intra-variability.
Secondly, in terms of the categories of smallholder farmers as discussed in Section 3, Figure 6 highlights that the farmers who made the decision to modify their practices or not following the recommendations of extension services are those with the highest average level of civic capital. It is even significantly higher than the sample mean. At the bottom of the civic capital distribution, we find farmers who maintained the status quo for reasons linked to tradition and habits. Then, there are those who claimed that they lacked either financial or time resources. In the middle of the distribution, it is noteworthy that satisficers and yield enhancers do not significantly differ in terms of their average level of civic capital. The latter are positive and significantly different from zero, whereas for those smallholder farmers who remain tied to their production habits and traditions and lack resources, the level of civic capital is significantly different from zero and negative. More generally, most farmers who did modify their practices are concentrated on the right of the distribution of civic capital, while the distribution of farmers who did not adjust their practices is skewed to the left.
Therefore, there is a clear relationship between both blades of the scissors, where civic capital and cognitive capabilities are related, complementary key factors that influence decision-making. This suggests that the availability of extension services and the training delivered through them on the one hand, and the farmer-to-farmer interactions that they entail on the other, have an impact on farmers’ aspiration levels, which in turn influences their decision-making in terms of technology adoption.
4.2. Structural Social Capital: Group Membership and Information Sharing
Measures of structural social capital are generated through two sources. Firstly, following many predecessors, we take into account whether or not farmers belong to one or more village organizations and how long they have been members. We then identify the type of organization (see Table 5), distinguishing between the most important (group 1) and those with a subordinate role (group 2). Consistent with previous surveys administered in the region, we observe a high rate of participation of farmers in existing village organizations: 90% belong to at least one group and less than one hundred farmers belong to more than two groups. For two-thirds (67%) of them, the group that they would consider the most important is an agricultural organization (e.g., cooperative or “groupe d’intérêt économique”). It is followed by religious organizations and diaspora for 13% and 6%, respectively. The groups are ranked as follows in descending order: diaspora (30%), agricultural organization, and other (e.g., traditional chiefdoms) with 19% each.
Secondly, another valuable piece of information specific to our survey is related to what is shared within a given organization. We aim here at referencing Granovetter’s (1973) seminal article about the strength of weak versus strong ties. (See also Thuo et al. [52] who find that weak ties with external support like extension agents influence the acquisition of information about new seed varieties among groundnut farmers in Uganda and Kenya.) We distinguish between two sets of information: the exchange of personal information and the exchange of information related to farming activities. We then associate this with the organization within which the exchange took place (see Table 6). Note that the exchange of personal information as a self-reported benefit of group membership mostly takes place within the family: 100% and 95% in groups 1 and 2, respectively. Then comes diaspora: 88% and 94% in groups 1 and 2, respectively. By contrast, the exchange and learning of agricultural information take place more readily in agricultural organizations: 91% and 75% in groups 1 and 2, respectively.
5. Social Capital and Status Quo versus Proactive Behavior
In this section, we aim at testing the following null hypothesis: farmers’ social capital had no impact on their decisions to revise their farming practices over the last two years. In other words, we assume that a rather optimistic belief about community members’ trustworthiness (compared to rather pessimistic beliefs) should lead farmers to be more proactive in seeking information and trusting those who possess it, such as representatives and members of agricultural organizations, and family or diaspora members, eventually leading farmers to revise their current farming practices. This type of presumption refers to the widespread understanding that membership in networks or particular social groups can facilitate the exchange of information and at least partially solve information problems. Put differently, should social capital be expected to influence cognitive functioning, and in turn, a smallholder farmer’s decision-making process as suggested by bounded rationality models?
Empirically, the revision of farming practices is a discrete choice. We perform an estimation using a model specification in which the dependent variable y is the qualitative dichotomous variable reflecting whether a smallholder farmer answered either “yes” (=1) or “no” (=0) to our central question: “Have you changed your farming practices over the last two years?” Specifically, we estimate the following logit model (see, for example, Wooldridge [53]):
where G is the standard logistic function with 0 < G(z) < 1 for all real numbers z, and xβ = β1x1 +…+ βkxk. Such a model is derived from an underlying latent variable model, where y* is a latent (i.e., continuous unobservable) variable, which satisfies
with ι(.) the indicator function, which takes on the value one if the event in parentheses is true (i.e., y* > 0), and 0 otherwise, and ε is assumed to be independent of x and logistically distributed.
P(y = 1 | x) = G(β0 + xβ)
y* = β0 + xβ + ε, with y = ι (y* > 0)
Concerning the explanatory variables (x), they include the smallholder farmer’s attributes as discussed in Section 2: internal or external migrant versus Indigenous people resident (binary), whether the farmer was born in the village (binary), age (entered in quadratic form), education (binary), administration rights (binary), household size (continuous), and the number of males over 18 who work in farming (continuous). Secondly, it contains information about the size (quartile) and age (quadratic form) of the plantation. Thirdly, the set of explanatory variables also includes both civic and structural social capital variables as measured and discussed in Section 4. The civic capital variables produced by the MCA are standardized at the village level. At this point, it is important to be aware that our social capital variables should remain steady over the period under consideration (2–3 years). Finally, the model is estimated with village fixed effects, which allow us to control for unobserved heterogeneity (e.g., original land-cover composition, age of the village, and village governance and leadership) at a level that directly affects farming practices.
We test two different econometric models to estimate the effect of social capital on the decision to revise agronomic practices. We first test the relationship between the adoption rate and the membership in agricultural organizations versus that in non-farmer organizations. The second model distinguishes between the types of information shared within the organization that the smallholder farmer belongs to. The results—coefficient estimates and their robust standard errors—are reported in Table 7. (Following Abadie et al. [54] with regard to when standard errors should be adjusted for clustering if the regression already includes fixed effects, we choose to adjust standard errors for clustering neither at the village level, nor at the origin level (native versus either internal or external migrant).)
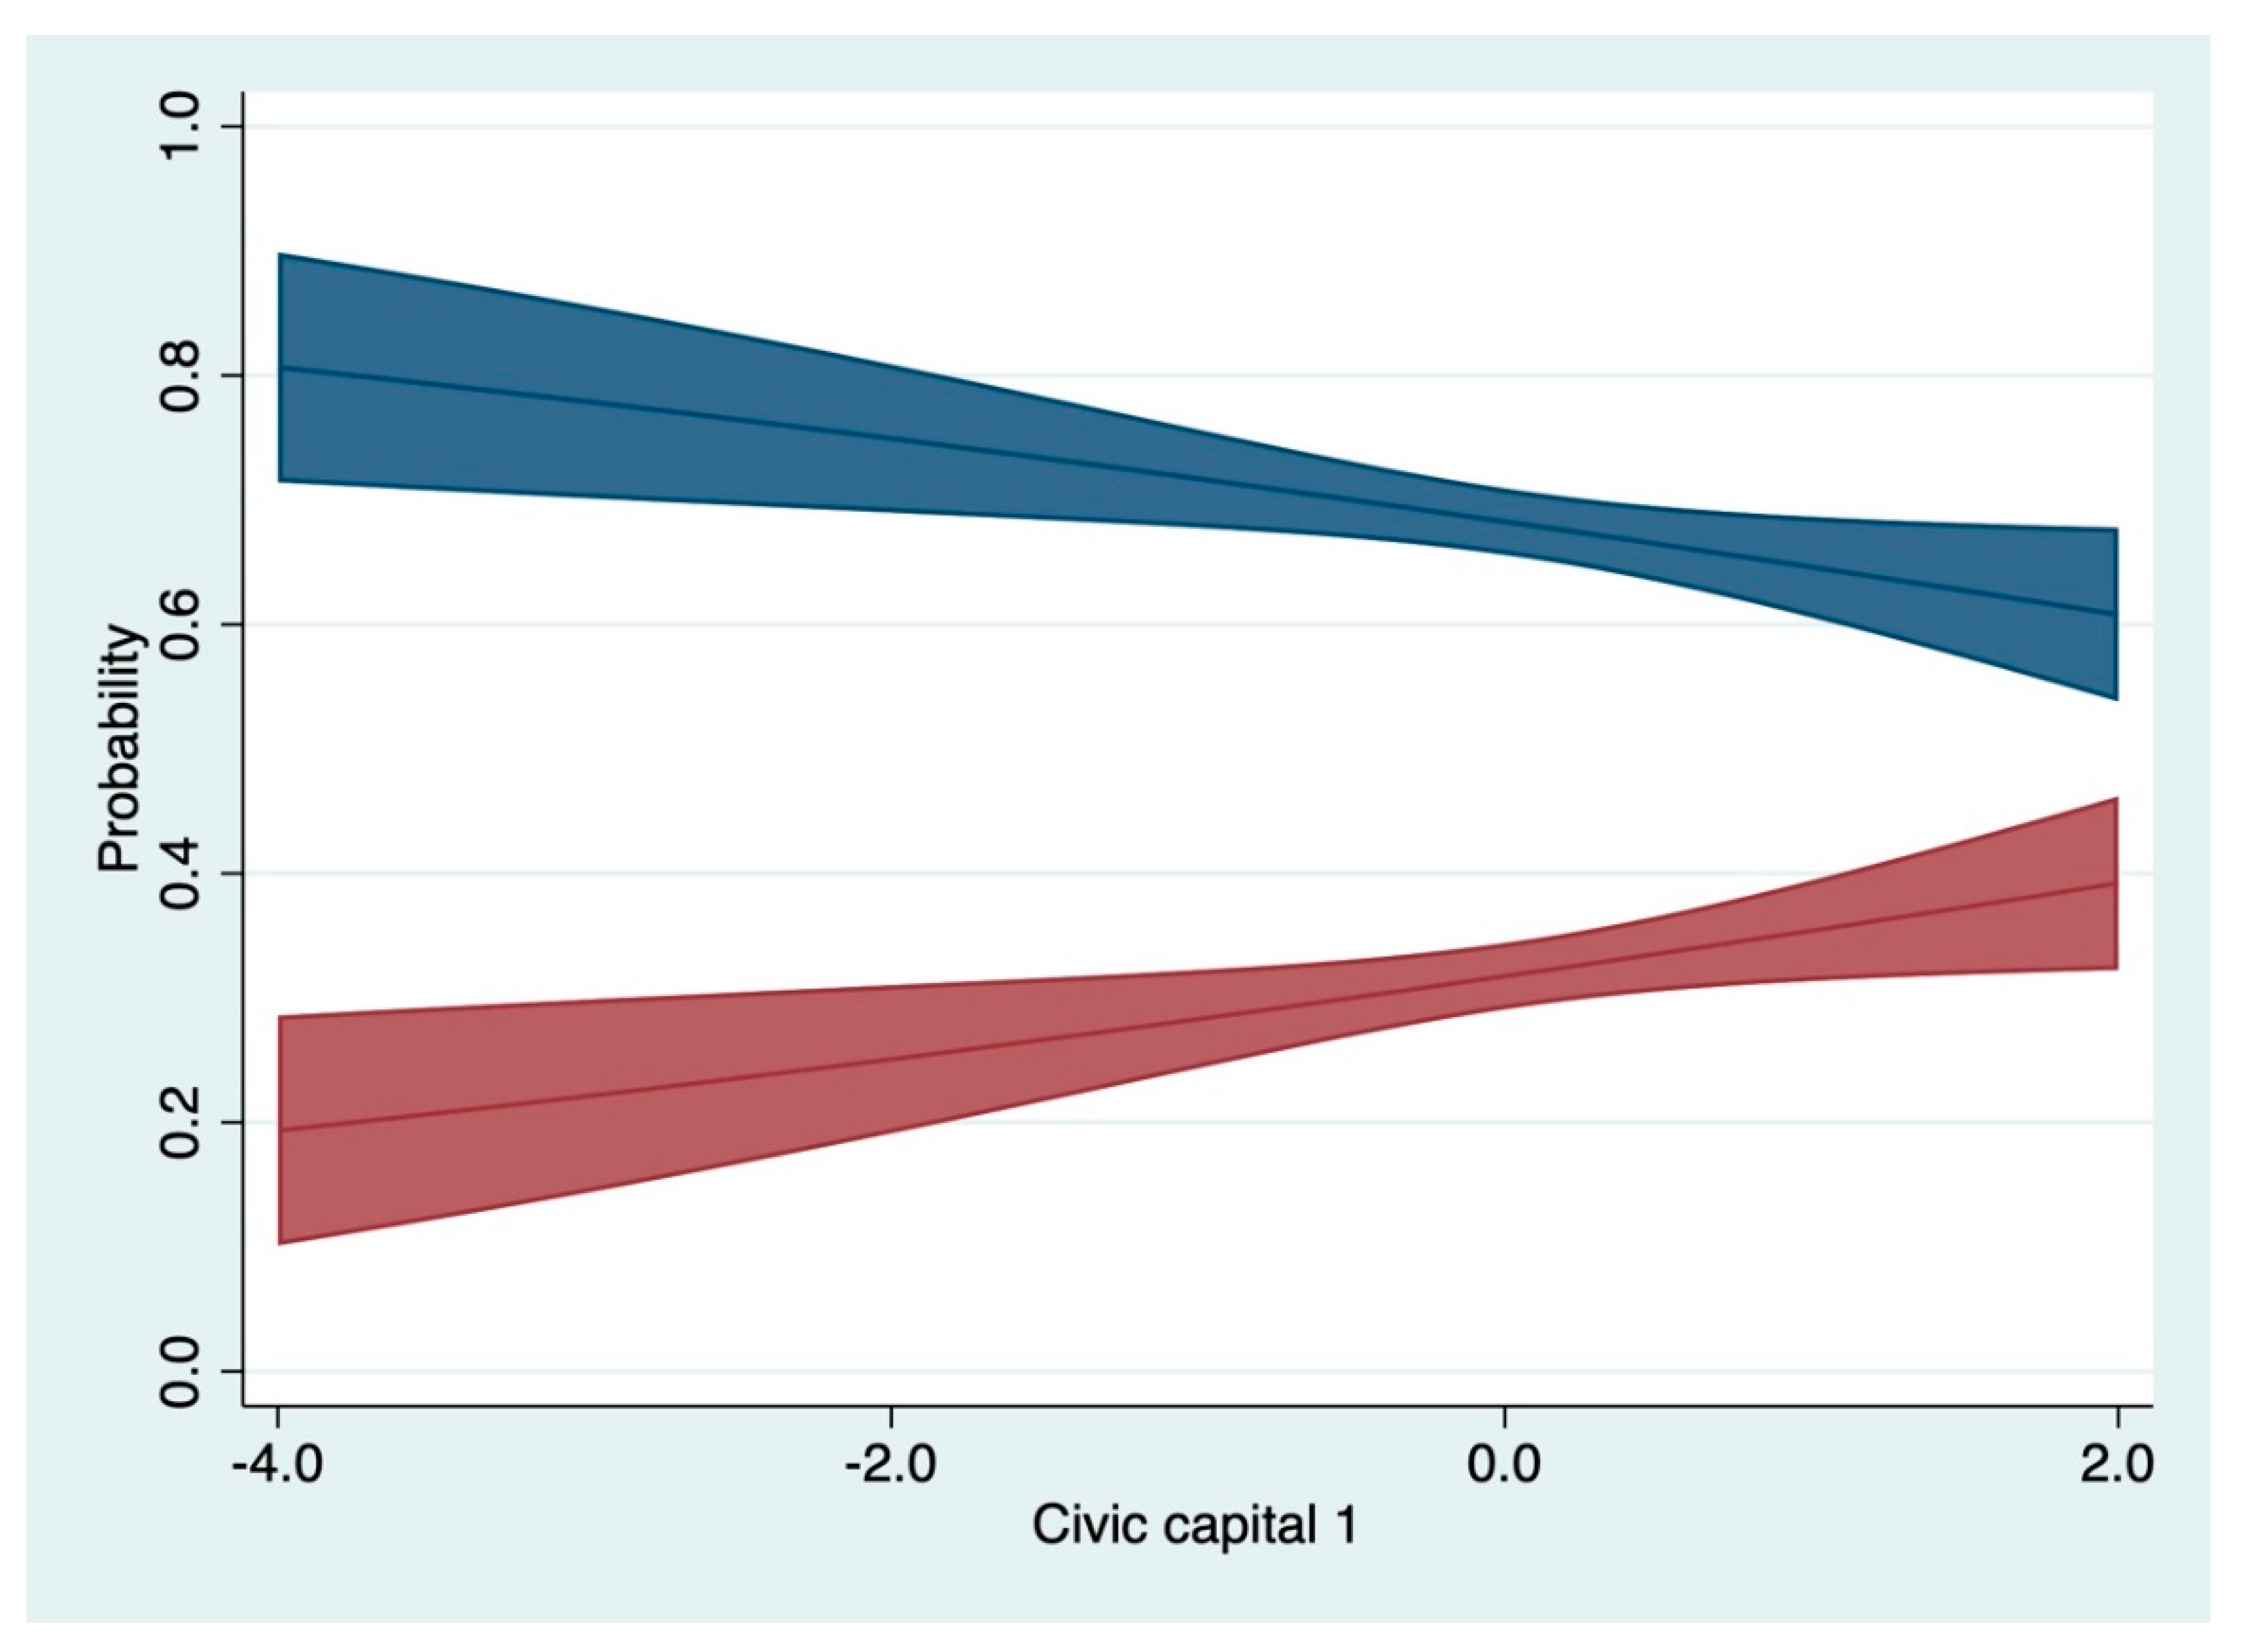
First and foremost, a farmer’s civic capital is positively and significantly associated with agricultural technology adoption even after controlling for group membership, smallholder characteristics, plantation size, and the life cycle of trees: it exhibits a significant U-shaped relationship with the response variable. In all cases, the observed statistical significance level remains below 5%. Both models tell a quantitatively similar story about the impact of civic capital on the probability of having changed farming practices P (y = 1 I x). More precisely, the probability that farmers modified their farming practices over the last two years increases monotonically from 20% up to 40% with civic capital as measured by the first axis obtained from the MCA. In Figure 7, we present the predicted probabilities—holding all other variables in the model at their means—of civic capital on a farmer’s decision to change (red) or not (blue) farming practices for different levels of individual civic capital.
Whatever the model, it should also be noted that the greater the number of organizations the farmers participate in, the greater the probability of modifying their practices. For each model, the coefficients are substantial and found to be statistically significant at the 1% level. Beyond the type of organization in which the farmers participate (see columns (1) and (2) of Table 7), it is the nature of the information shared within it that matters (see column (3) of Table 7).
Other factors explain changes in agronomic practices. Compared to indigenous residents, internal and external migrants are more likely to have changed their farming practices. Calculating odds ratios from the regression coefficients, it appears that internal migrants are more than twice as likely as indigenous residents to have modified their practices over the past two years. The number of males over 18 years of age within the current household is likewise positively and significantly correlated with the probability of revising practices. Farmers who indicate that they have administration rights to their plantation are also more likely to have changed their farming techniques. The odds are about 50% higher. Finally, we cannot reject the null hypothesis that village-specific fixed effects are jointly statistically equal to zero at the conventional 5% significance level.
These relationships between farmers’ civic capital and the decision to make changes in their farming practices with the life cycle of trees are intriguing. In our view, this should lead one to wonder about the different spheres of knowledge, in this case, the traditional agricultural knowledge (i.e., popular-practical) and the more technical-scientific knowledge, which must effectively be relayed through farmers via their social networks and/or experts and scientists who most often come from international organizations or Northern academic institutions (Olivier de Sardan [55]). Such an argument is closely related to the concept of bounded rationality proposed originally by Simon [6].
6. Conclusions
To our knowledge, our study is the first to assess the relevance of models of bounded rationality to family farming by considering both cognitive scarcity and the structure of the environment, in particular, their complementary role in decision-making with regard to technology adoption. While clear and compelling evidence in favor of a status quo bias and satisficing behavior emerges from our survey, it also appears that community members’ social capital is positively associated with the benefits they derive from interacting with their peers within farming organizations and/or from being exposed to agricultural extension. This eventually leads them to revise and fine-tune their farming practices. To this end, the weak ties existing across members of farming organizations are more conducive to both information exchange and new technology adoption than the stronger ties among family or diaspora members.
More generally, this study highlights the need to further investigate the role of judgment biases in the poor agricultural performance of sub-Saharan Africa. It also stresses the role of the social environment to counteract the status quo, the latter being more often than not the rule rather than the exception. Admittedly, we must remain humble in light of our results, which draw on the descriptive statistical analysis of raw data in which we let the farmers speak for themselves. The findings are promising, but they do not provide a full assessment of the topic yet. Specifically, if this concept of bounded rationality as a model for decision-making in family farming can be given credence to, we recommend that future research efforts be focused on a more in-depth comprehension of farmers’ aspirations, in particular, how they are shaped and impact the changes introduced by farmers. Furthermore, to the extent that groups are more rational than individuals (Kugler et al. [48]), the subfield of behavioral development economics that has emerged over the past decade may help us, first, to close the knowledge gap about how social capital influences human rationality and decision making and, second, to address an important topic such as bounded rationality in family farming in a more structured and causal way.
Author Contributions
Conceptualization, methodology, validation, formal analysis, investigation, resources, data curation, writing (original draft preparation, review, and editing); project administration: F.C. and A.D. All authors have read and agreed to the published version of the manuscript.
Funding
This study received funding from Catalyst, former Mars, Incorporated’s internal think tank.
Institutional Review Board Statement
Not applicable.
Informed Consent Statement
Informed consent was obtained from all subjects involved in the study.
Data Availability Statement
The data presented in this study are available on request from the corresponding author. The data are not publicly available due to privacy reasons.
Acknowledgments
We are indebted to ENSEA (École nationale supérieure de statistique et d’économie appliquée, Abidjan, Côte d’Ivoire). In particular, we wish to warmly acknowledge the participation of Hugues Kouadio, its director, and Nahoua Soro, who supervised the implementation of the surveys in the field. We are also grateful to the organizers, Alain De Janvry, Karen Macours, and Elisabeth Sadoulet, and participants of the workshop “Learning for adopting: technology adoption in developing country agriculture,” where we were able to present and discuss a very preliminary version of this work (FERDI, Clermont-Ferrand, 2016). We would also like to extend our heartfelt thanks to Catherine Bros, Victor Cordonnier, and Fabian Gouret.
Conflicts of Interest
The funding sponsor had no role in the collection, analyses, or interpretation of data; in writing of the manuscript, and the decision to publish the result. At the time of funding the study, Francesco Cordaro was affiliated with Catalyst and Alain Desdoigts was an independent external expert.
References
- Aneani, F.; Ofori-Frimpong, K. An analysis of yield gap and some factors of cocoa (Theobroma cacao) yields in Ghana. Sustain. Agric. Res. 2013, 2, 117–127. [Google Scholar]
- Wessel, M.; Foluke Quist-Wessel, P.M. Cocoa production in West Africa, a review and analysis of recent developments. NJAS Wagening. J. Life Sci. 2015, 74–75, 1–7. [Google Scholar] [CrossRef] [Green Version]
- Jack, B.K. Market Inefficiencies and the Adoption of Agricultural Technologies in Developing Countries; CEGA White Papers: Berkeley, CA, USA, 2013. [Google Scholar]
- Mwangi, M.; Kariuki, S. Factors determining adoption of new agricultural technology by smallholder farmers in developing countries. J. Econ. Sustain. Dev. 2015, 6, 208–216. [Google Scholar]
- Simon, H.A. A behavioral model of rational Choice. Q. J. Econ. 1955, 69, 99–118. [Google Scholar] [CrossRef]
- Simon, H.A. Rational choice and the structure of the environment. Psychol. Rev. 1956, 63, 129–138. [Google Scholar] [CrossRef] [Green Version]
- Gigerenzer, G.; Selten, R. Rethinking rationality. In Bounded Rationality: The Adaptive Toolbox; Gigerenzer, G., Selten, R., Eds.; The MIT Press: Cambridge, MA, USA, 2001. [Google Scholar]
- Kremer, M.; Rao, G.; Schilbach, F. Behavioral development economics. In Handbook of Behavioral Economics; Bernheim, D., Della Vigna, S., Laibson, D., Eds.; Elsevier: Amsterdam, The Netherlands, 2019; Volume 2. [Google Scholar]
- Datta, S.; Mullainathan, S. Behavioral design: A new approach to development policy. Rev. Income Wealth 2014, 60, 7–35. [Google Scholar] [CrossRef]
- World Development Report. Mind, Society, and Behavior; World Bank Group: Washington, DC, USA, 2015. [Google Scholar]
- Munshi, K. Community networks and the process of development. J. Econ. Perspect. 2014, 28, 49–76. [Google Scholar] [CrossRef] [Green Version]
- Coleman, J.S. Social capital in the creation of human capital. Am. J. Sociol. 1988, 94, S95–S120. [Google Scholar] [CrossRef]
- Bowles, S.; Gintis, H. Social capital and community governance. Econ. J. 2002, 112, F419–F436. [Google Scholar] [CrossRef]
- Guiso, L.; Sapienza, P.; Zingales, L. Civic capital as the missing link. In Handbook of Social Economics; Benhabib, J., Bisin, A., Jackson, M.O., Eds.; Elsevier: Amsterdam, The Netherlands, 2011. [Google Scholar]
- Dasgupta, P. Economic progress and the idea of social capital. In Social Capital: A Multifaceted Perspective; Dasgupta, P., Serageldin, I., Eds.; The World Bank: Washington DC, USA, 2000. [Google Scholar]
- Durlauf, S.N.; Fafchamps, M. Social capital. In Handbook of Economic Growth; Aghion, P., Durlauf, S.N., Eds.; Elsevier: Amsterdam, The Netherlands, 2005. [Google Scholar]
- Fehr, E. On the economics and biology of trust. J. Eur. Econ. Assoc. 2009, 7, 235–266. [Google Scholar] [CrossRef] [Green Version]
- Portes, A. Social capital: Its origins and applications in modern sociology. Annu. Rev. Sociol. 1998, 24, 1–24. [Google Scholar] [CrossRef] [Green Version]
- Granovetter, M.S. Economic action and social structure: The problem of embeddedness. Am. J. Sociol. 1985, 91, 481–510. [Google Scholar] [CrossRef]
- Demeritt, A.; Hoff, K. The making of behavioral development economics. Hist. Political Econ. 2018, 50, 303–322. [Google Scholar] [CrossRef]
- Grootaert, C.; Van Bastelaer, T. Understanding and Measuring Social Capital; The World Bank: Washington, DC, USA, 2002. [Google Scholar]
- Grootaert, C.; Narayan, D.; Jones, V.N.; Woolcock, M. Measuring Social Capital: An Integrated Questionnaire; World Bank Working Paper No. 18; World Bank: Washington, DC, USA, 2004. [Google Scholar]
- Simon, H.A. Models of Man, Social and Rational: Mathematical Essays in on Rational Human Behaviour; Wiley: New York, NY, USA, 1957. [Google Scholar]
- Rubinstein, A. Modeling Bounded Rationality; The MIT Press: Cambridge, MA, USA, 1998. [Google Scholar]
- Granovetter, M.S. The strength of weak ties. Am. J. Sociol. 1973, 78, 1360–1380. [Google Scholar] [CrossRef] [Green Version]
- Bros, C.; Desdoigts, A.; Kouadio, H. Land tenure insecurity as an investment incentive: The case of migrant cocoa farmers and settlers in Ivory Coast. J. Afr. Econ. 2019, 28, 147–175. [Google Scholar] [CrossRef]
- Haushofer, J.; Fehr, E. On the psychology of poverty. Science 2014, 344, 862–867. [Google Scholar] [CrossRef] [PubMed]
- Schilbar, F.N.; Schofield, H.; Mullainathan, S. The psychological lives of the poor. Am. Econ. Rev. 2016, 106, 435–440. [Google Scholar] [CrossRef] [Green Version]
- Guirkinger, C.; Platteau, J.-P.; Goetghebuer, T. Productive inefficiency in extended agricultural households: Evidence from Mali. J. Dev. Econ. 2015, 116, 17–27. [Google Scholar] [CrossRef]
- Takahahi, K.; Muraoka, R.; Otsuka, K. Technology adoption, impact, and extension in developing countries’ agriculture: A review of the recent literature. Agric. Econ. 2020, 51, 31–45. [Google Scholar] [CrossRef]
- Foster, A.D.; Rosenzweig, M.R. Learning by doing and learning from others: Human capital and technical change in agriculture. J. Political Econ. 1995, 103, 1176–1209. [Google Scholar] [CrossRef]
- Shiferaw, B.; Kebede, T.; Kassie, M.; Fisher, M. Market imperfections, access to information and technology adoption in Uganda: Challenges of overcoming multiple constraints. Agric. Econ. 2015, 46, 475–488. [Google Scholar] [CrossRef]
- Bandiera, O.; Razul, I. Social networks and technology adoption in Northern Mozambique. Econ. J. 2006, 116, 869–902. [Google Scholar] [CrossRef] [Green Version]
- Conley, T.; Udry, C. Learning about a new technology: Pineapple in Ghana. Am. Econ. Rev. 2010, 100, 35–69. [Google Scholar] [CrossRef] [Green Version]
- Wossen, T.; Berger, T.; Di Falco, S. Social capital, risk preference and adoption of improved farm land management practices in Ethiopia. Agric. Econ. 2015, 46, 81–97. [Google Scholar] [CrossRef]
- Duflo, E.; Kremer, M.; Robinson, J. Nudging farmers to use fertilizer: Evidence from Kenya. Am. Econ. Rev. 2011, 101, 2350–2390. [Google Scholar] [CrossRef] [Green Version]
- Hanna, R.; Mullainathan, S.; Schwartzstein, J. Learning through noticing: Theory and evidence from a field experiment. Q. J. Econ. 2014, 129, 1311–1353. [Google Scholar] [CrossRef] [Green Version]
- De Janvry, A.; Sadoulet, E.; Suri, T. Field experiments in developing country agriculture. In Handbook of Field Experiments; Banerjee, A.V., Duflo., E., Eds.; Elsevier: Amsterdam, The Netherlands, 2017; Volume 2. [Google Scholar]
- Fenske, J. L’Étranger: Status, property rights, and investment incentives in Côte d’Ivoire. Land Econ. 2010, 86, 621–644. [Google Scholar] [CrossRef]
- Fenske, J. Land tenure and investment incentives: Evidence from West Africa. J. Dev. Econ. 2011, 95, 137–156. [Google Scholar] [CrossRef]
- Samuelson, W.; Zeckhauser, R. Status quo bias in decision making. J. Risk Uncertain. 1988, 1, 7–59. [Google Scholar] [CrossRef]
- Tversky, A.; Kahneman, D. Belief in the law of small numbers. Psychol. Bull. 1971, 76, 105–110. [Google Scholar] [CrossRef] [Green Version]
- Gigerenzer, G. The adaptive toolbox. In Bounded Rationality: The Adaptive Toolbox; Gigerenzer, G., Selten, R., Eds.; The MIT Press: Cambridge, MA, USA, 2001. [Google Scholar]
- Anderson, J.; Feder, G. Agricultural extension. In Handbook of Agricultural Economics, 3rd ed.; Evenson, R., Pingali, P., Eds.; Elsevier: Amsterdam, The Netherlands, 2007. [Google Scholar]
- Cunguara, B.; Moder, K. Is agricultural extension helping the poor? Evidence from rural Mozambique. J. Afr. Econ. 2011, 20, 562–595. [Google Scholar] [CrossRef]
- Schwartz, B.; Ward, A.; Lyubomirsky, S.; Monterosso, J.; White, K.; Lehman, D.R. Maximizing versus satisficing: Happiness is a matter of choice. J. Personal. Soc. Psychol. 2002, 83, 1178–1197. [Google Scholar] [CrossRef]
- Kahneman, D.; Tversky, A. On the psychology of prediction. Psychol. Rev. 1973, 80, 237–251. [Google Scholar] [CrossRef] [Green Version]
- Kugler, T.; Kausel, E.; Kocher, M. Are groups more rational than individuals? A review of interactive decision making in groups. Wiley Interdiscip. Rev. Cogn. Sci. 2012, 3, 471–482. [Google Scholar] [CrossRef] [PubMed] [Green Version]
- Le Roux, B.; Rouanet, H. Geometric Data Analysis; Kluwer Academic Publishers: Dordrecht, The Nederlands, 2004. [Google Scholar]
- Bourdieu, P. La Distinction; Les Éditions de Minuit: Paris, France, 1979. [Google Scholar]
- Bourdieu, P. The social space and the genesis of groups. Inf. Int. Soc. Sci. Counc. 1985, 24, 195–220. [Google Scholar] [CrossRef]
- Thuo, M.; Bell, A.A.; Bravo-Ureta, B.E.; Lachaud, M.A.; Okello, D.K.; Okoko, E.N.; Kidula, N.L.; Deom, C.M.; Puppala, N. Effects of social network factors on information acquisition and adoption of improved groundnut varieties: The case of Uganda and Kenya. Agric. Hum. Values 2014, 31, 339–353. [Google Scholar] [CrossRef]
- Wooldridge, J.M. Introductory Econometrics: A Modern Approach, 5th ed.; South-Western, Cengage learning: Mason, OH, USA, 2012. [Google Scholar]
- Abadie, A.; Athey, S.; Imbens, G.W.; Wooldridge, J. When Should You Adjust Standard Errors for Clustering? NBER Working Paper 24003; NBER: Cambridge, MA, USA, 2017. [Google Scholar]
- Olivier de Sardan, J.-P. Anthropologie et Développement; Karthala: Paris, France, 1995. [Google Scholar]
Figure 1.
Kernel density estimates of plantation yields standardized at the village level for both subsamples of farmers (yes—red line, no—blue line) and 95% confidence intervals using an Epanechnikov kernel and the-rule-of-thumb bandwidth. Vertical lines report 10th, 50th, and 90th percentiles for the no-modification (blue) distribution.
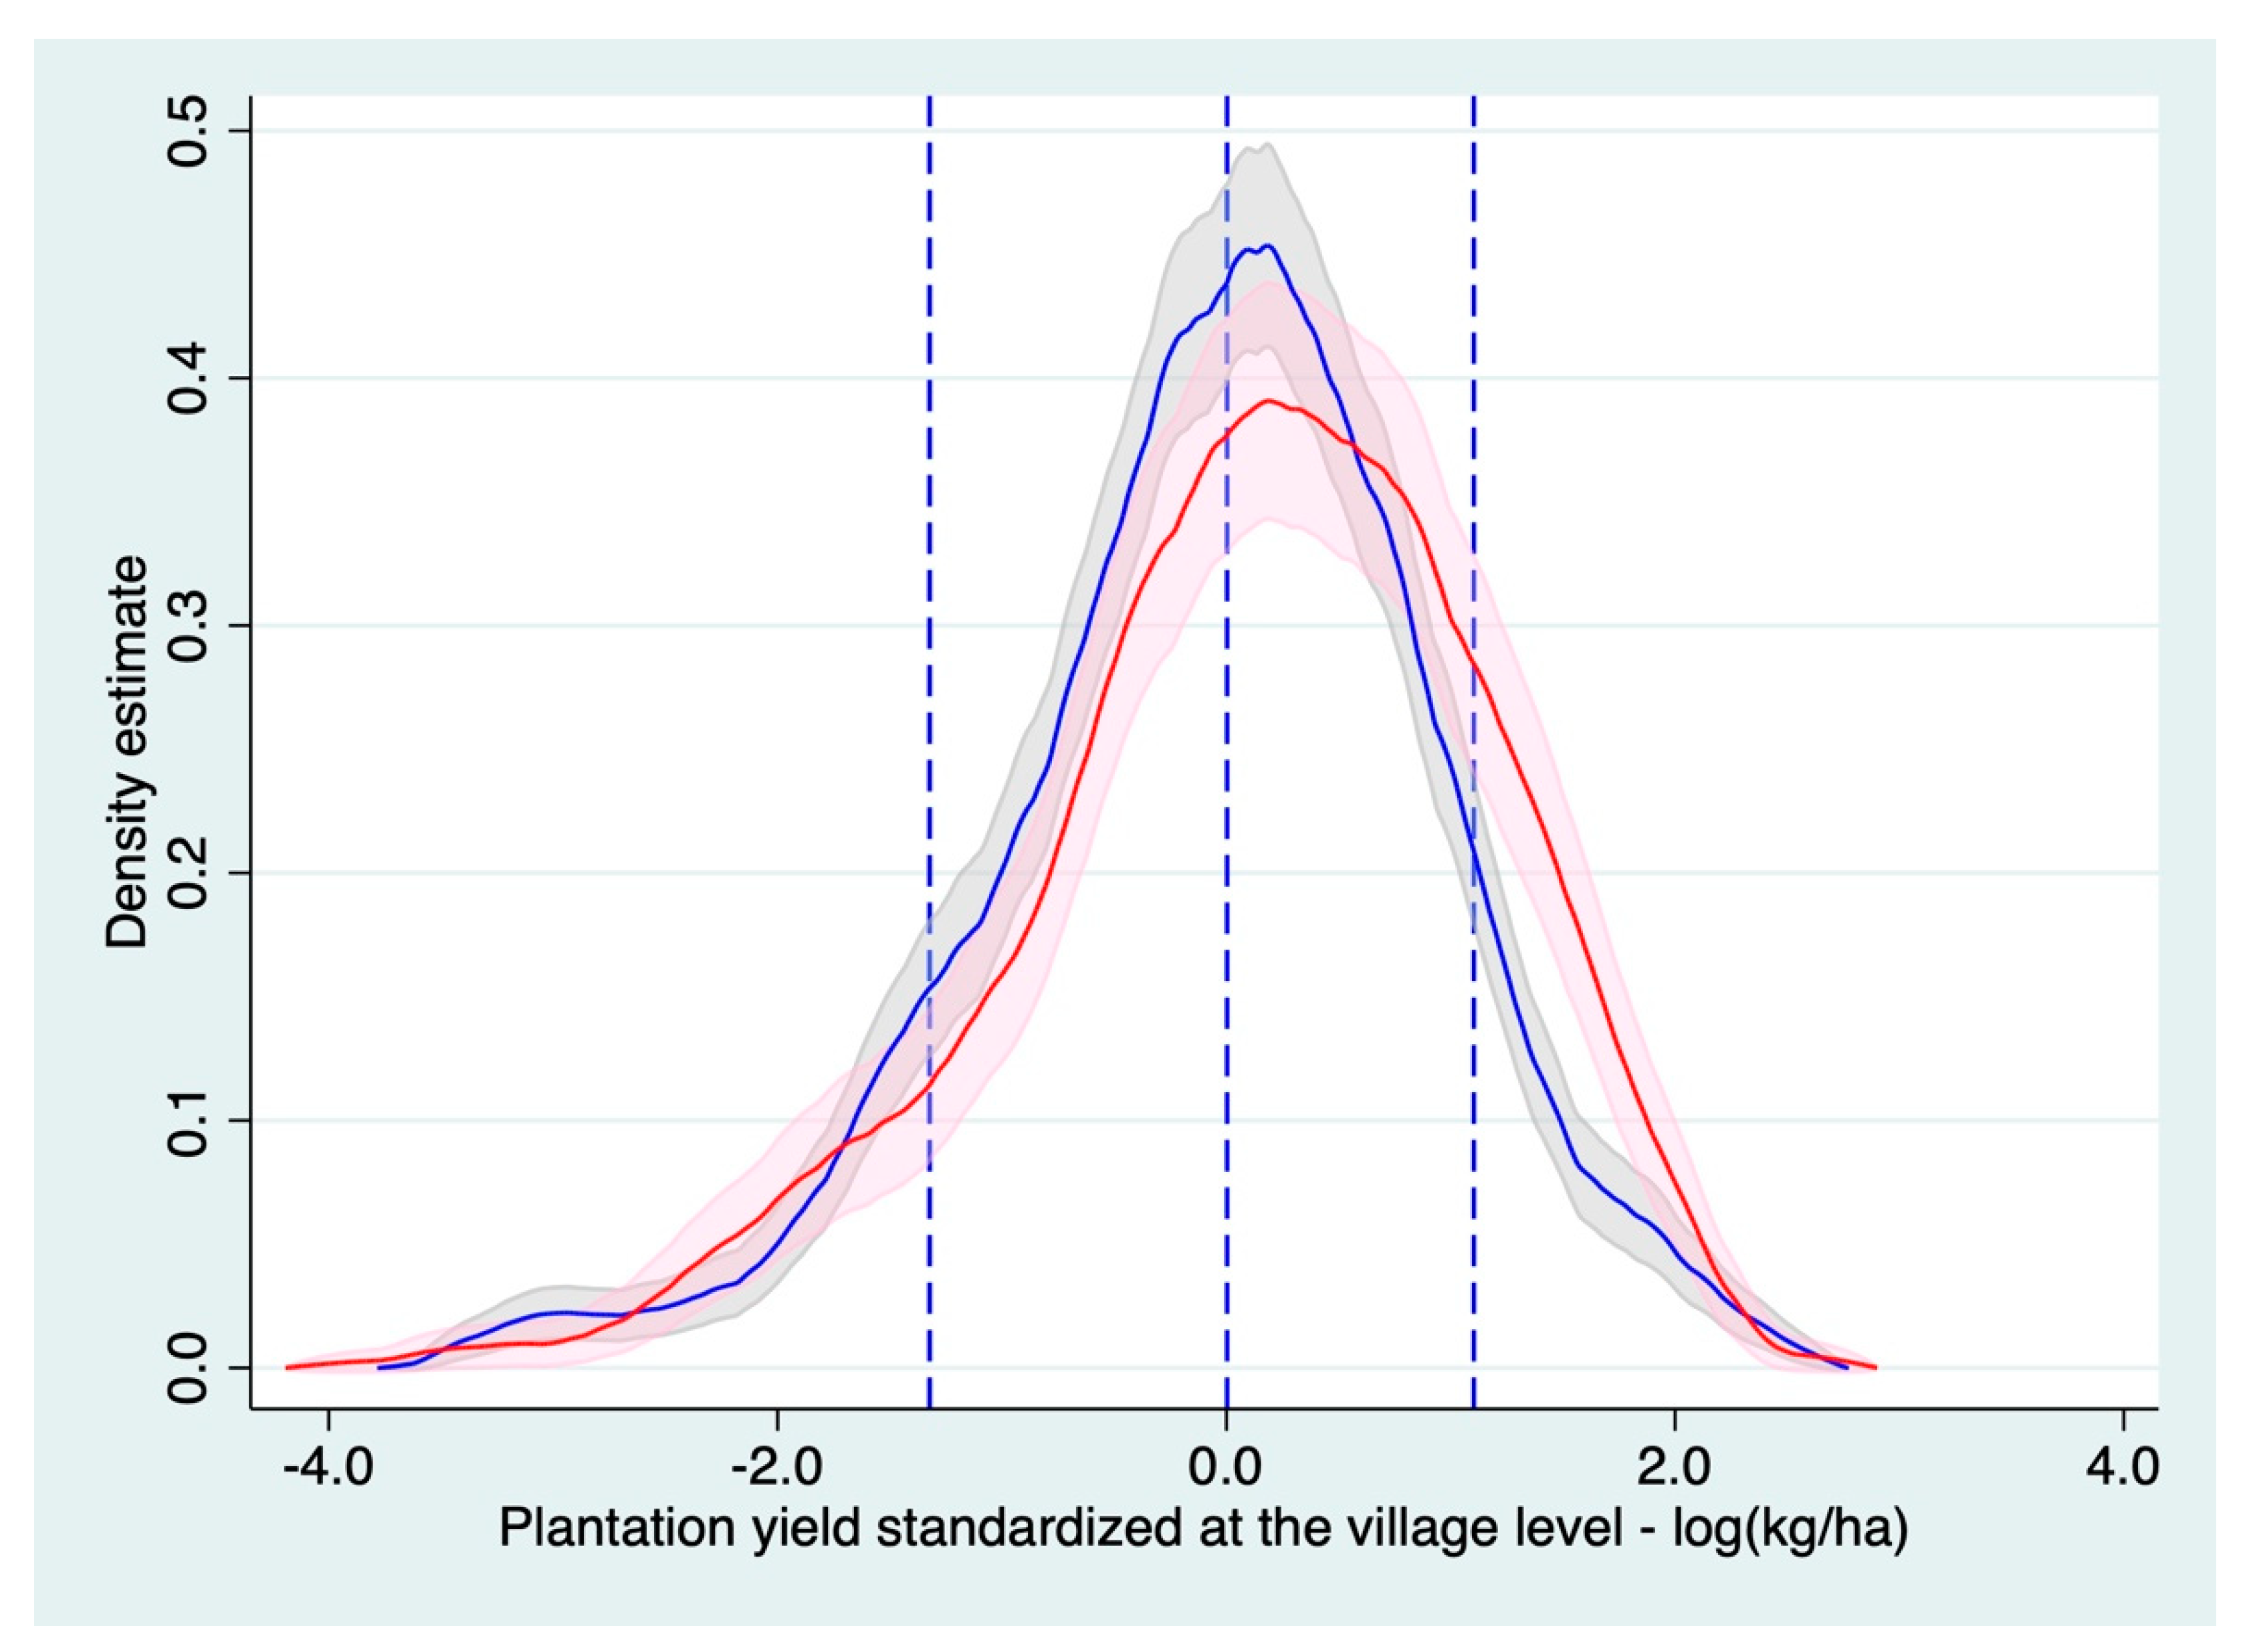
Figure 2.
Kernel density estimates of the age of the plantation since the last regeneration for both subsamples of farmers (yes—red line, no—blue line) and 95% confidence intervals using an Epanechnikov kernel and the rule-of-thumb bandwidth. Vertical lines report 40th, 50th, and 60th percentiles for the no-modification (blue) distribution.
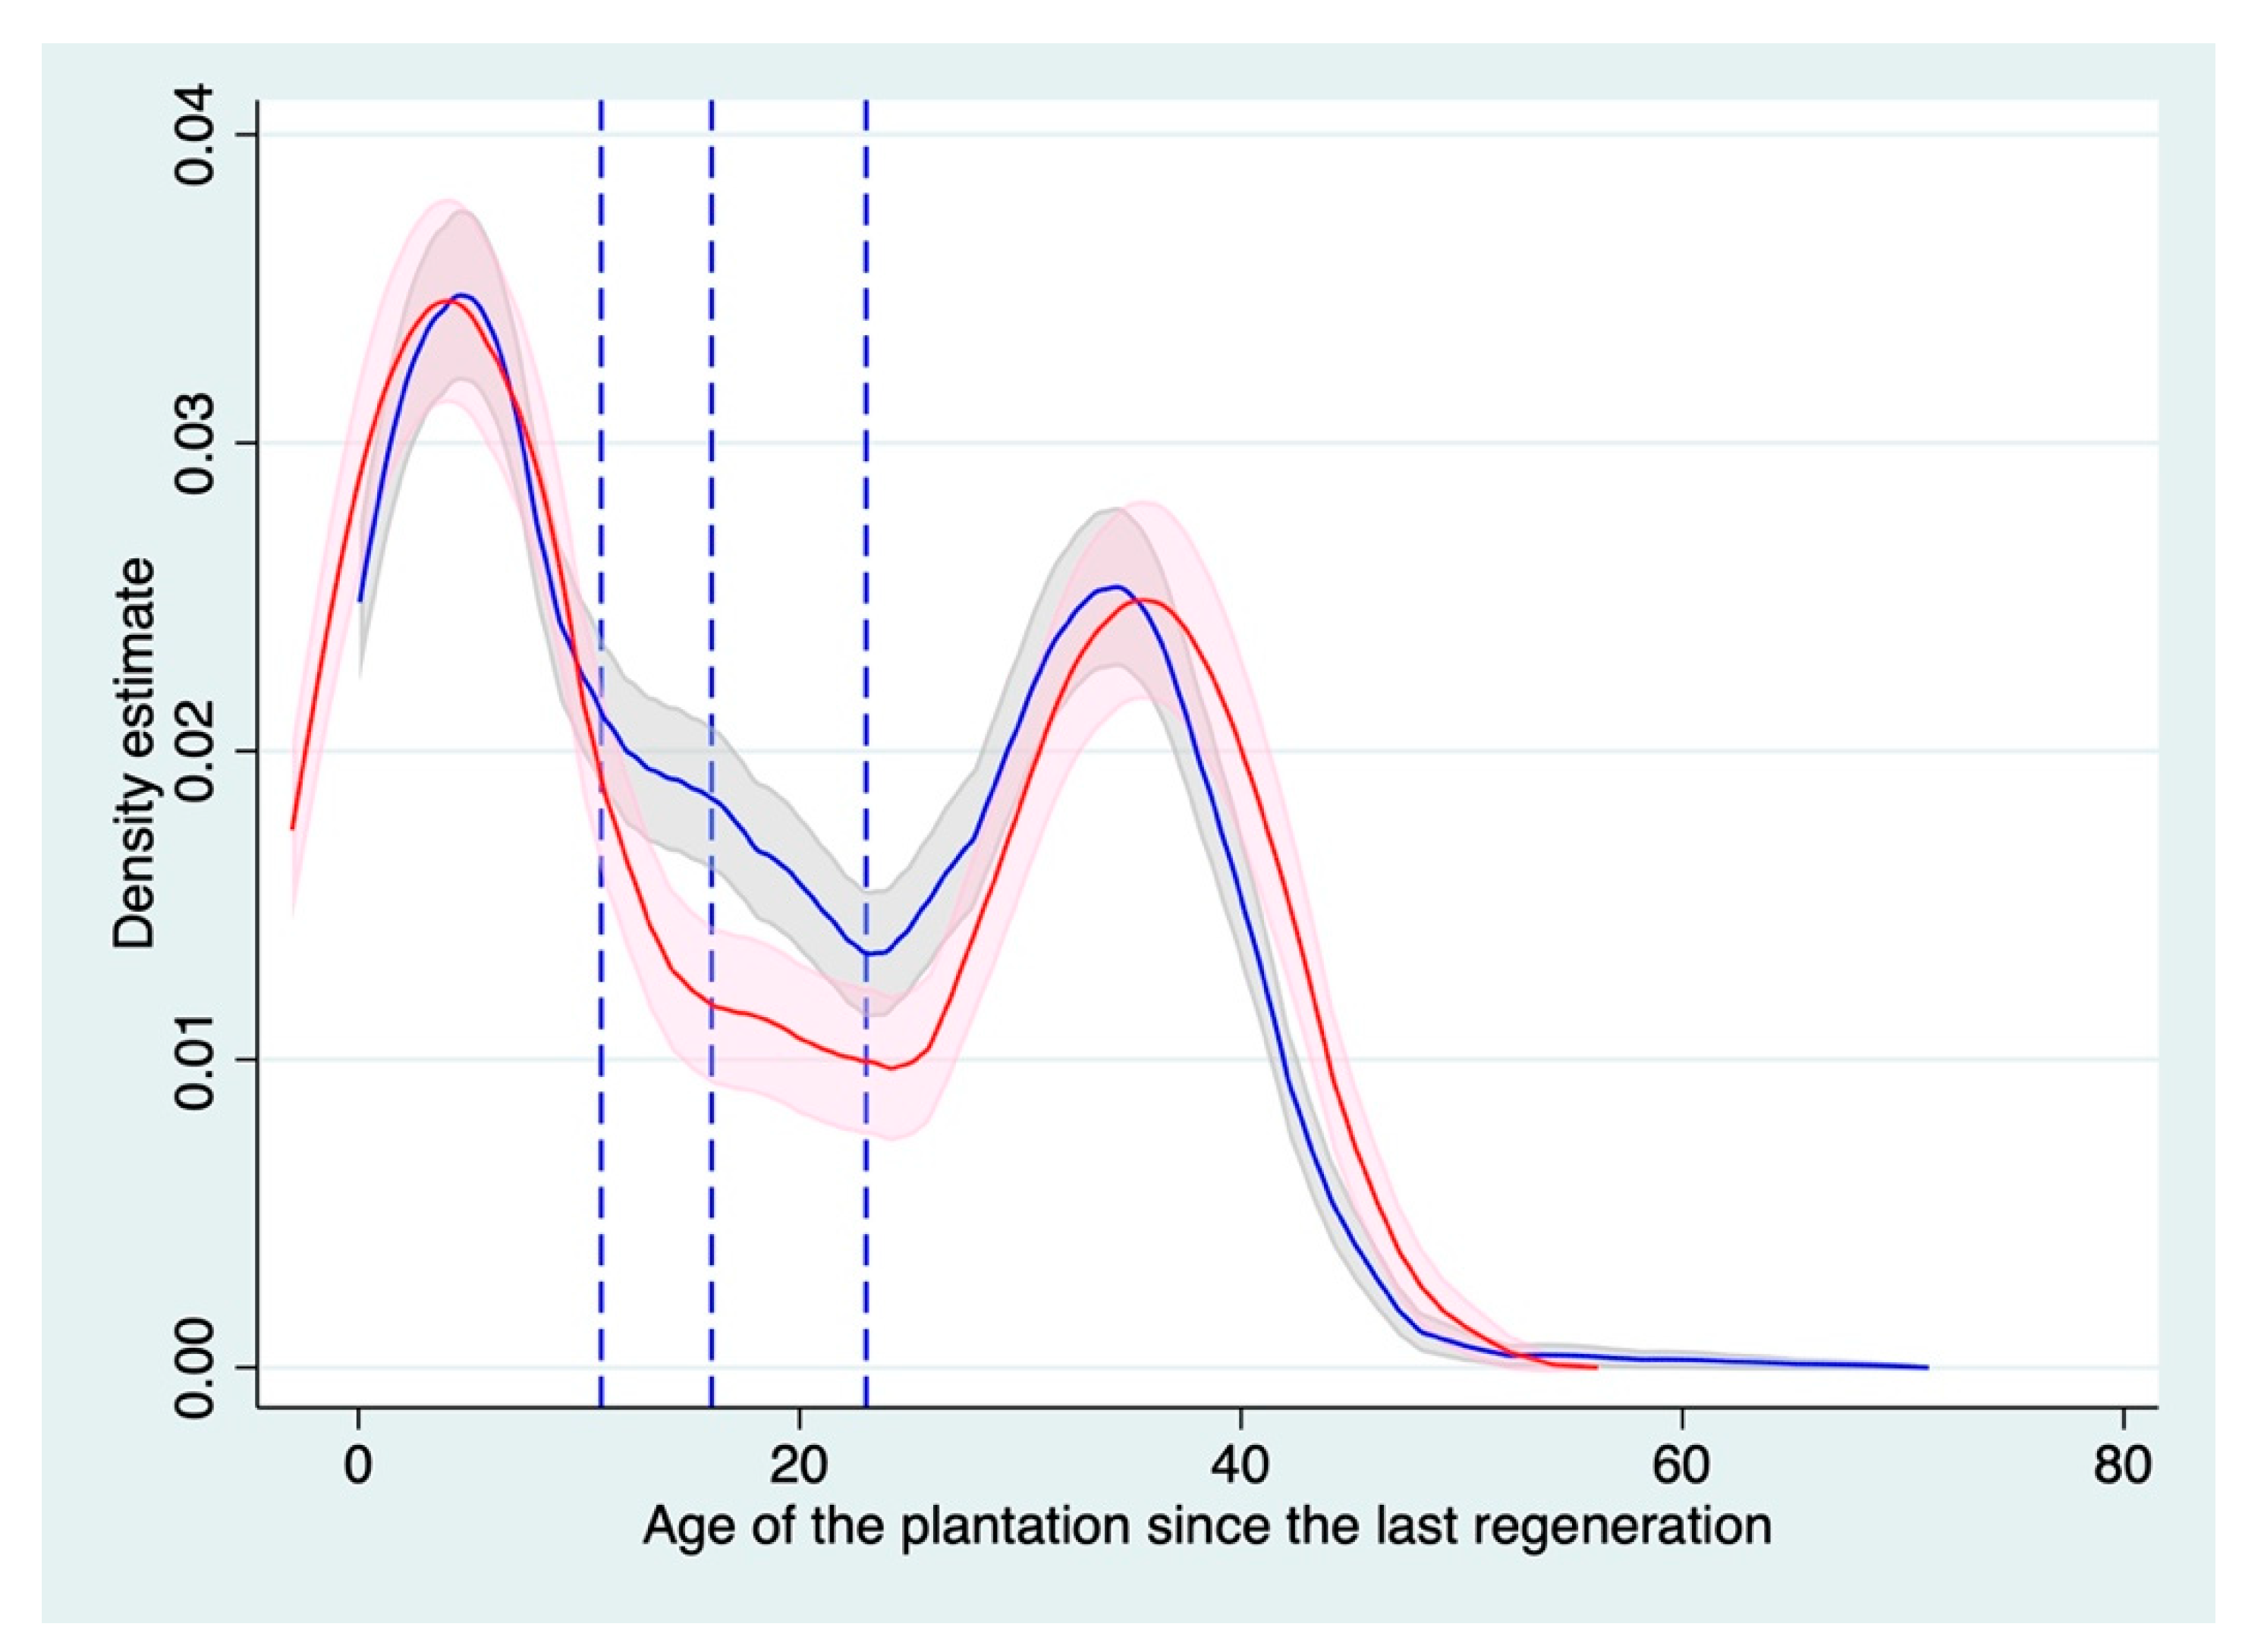
Figure 3.
Reasons reported by farmers explaining why they either modified their farming practices or were constrained by resource shortfalls or limited cognitive abilities (bounded rationality).
Figure 3.
Reasons reported by farmers explaining why they either modified their farming practices or were constrained by resource shortfalls or limited cognitive abilities (bounded rationality).
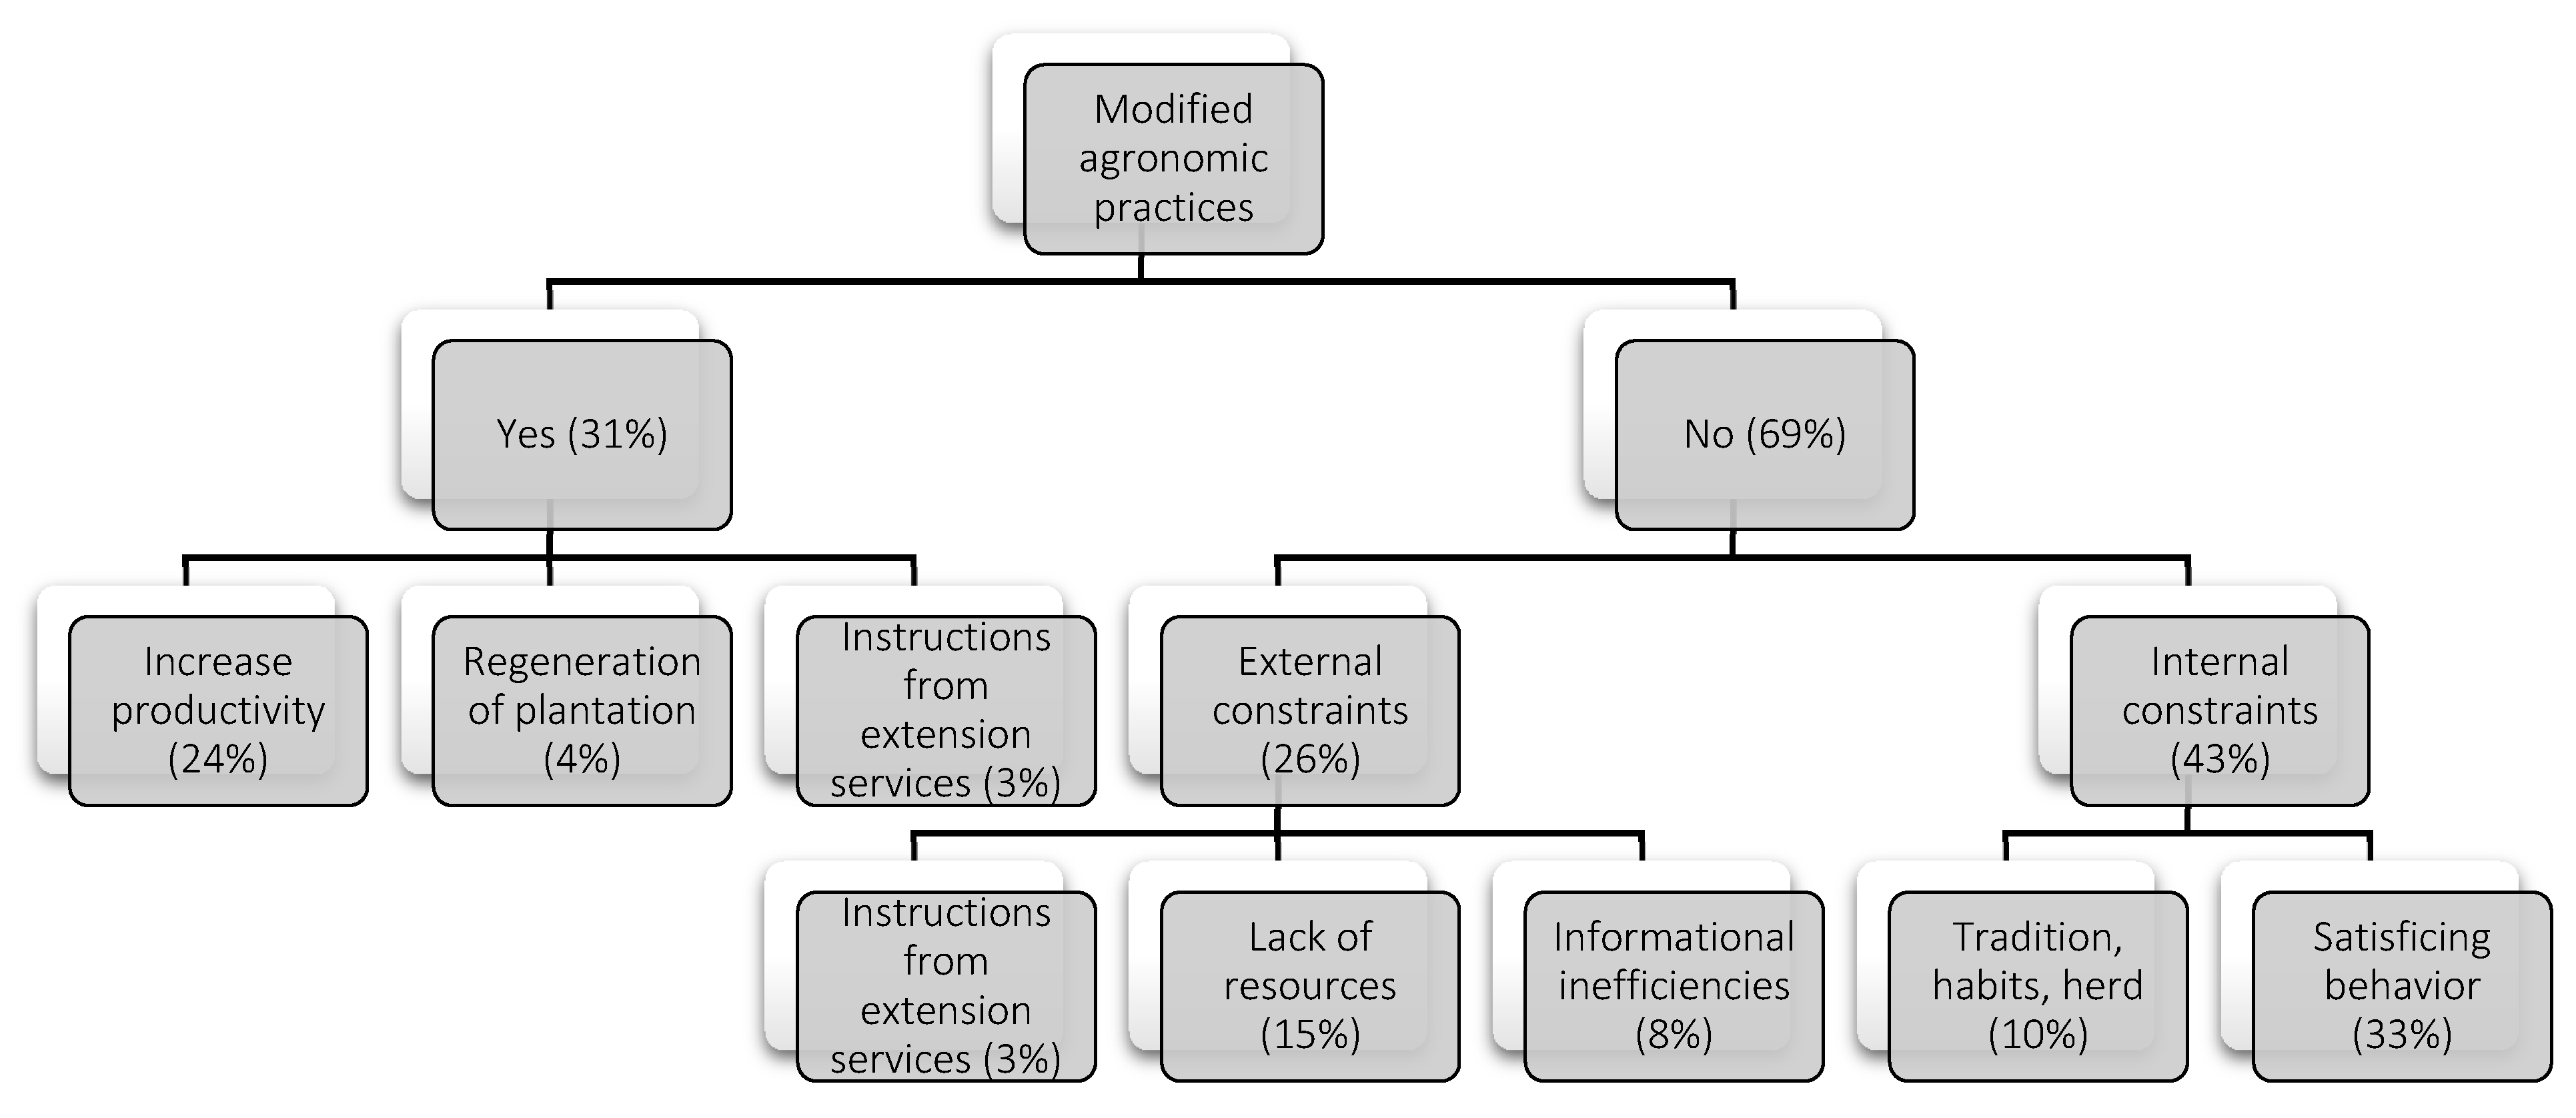
Figure 4.
Yield standardized at the village level ranked by increasing order for the range of reasons that motivated farmers to either modify (red) or not (blue) their farming techniques over the past two years. (Mean = 0, s.d. = 1, and 95% confidence intervals).
Figure 4.
Yield standardized at the village level ranked by increasing order for the range of reasons that motivated farmers to either modify (red) or not (blue) their farming techniques over the past two years. (Mean = 0, s.d. = 1, and 95% confidence intervals).
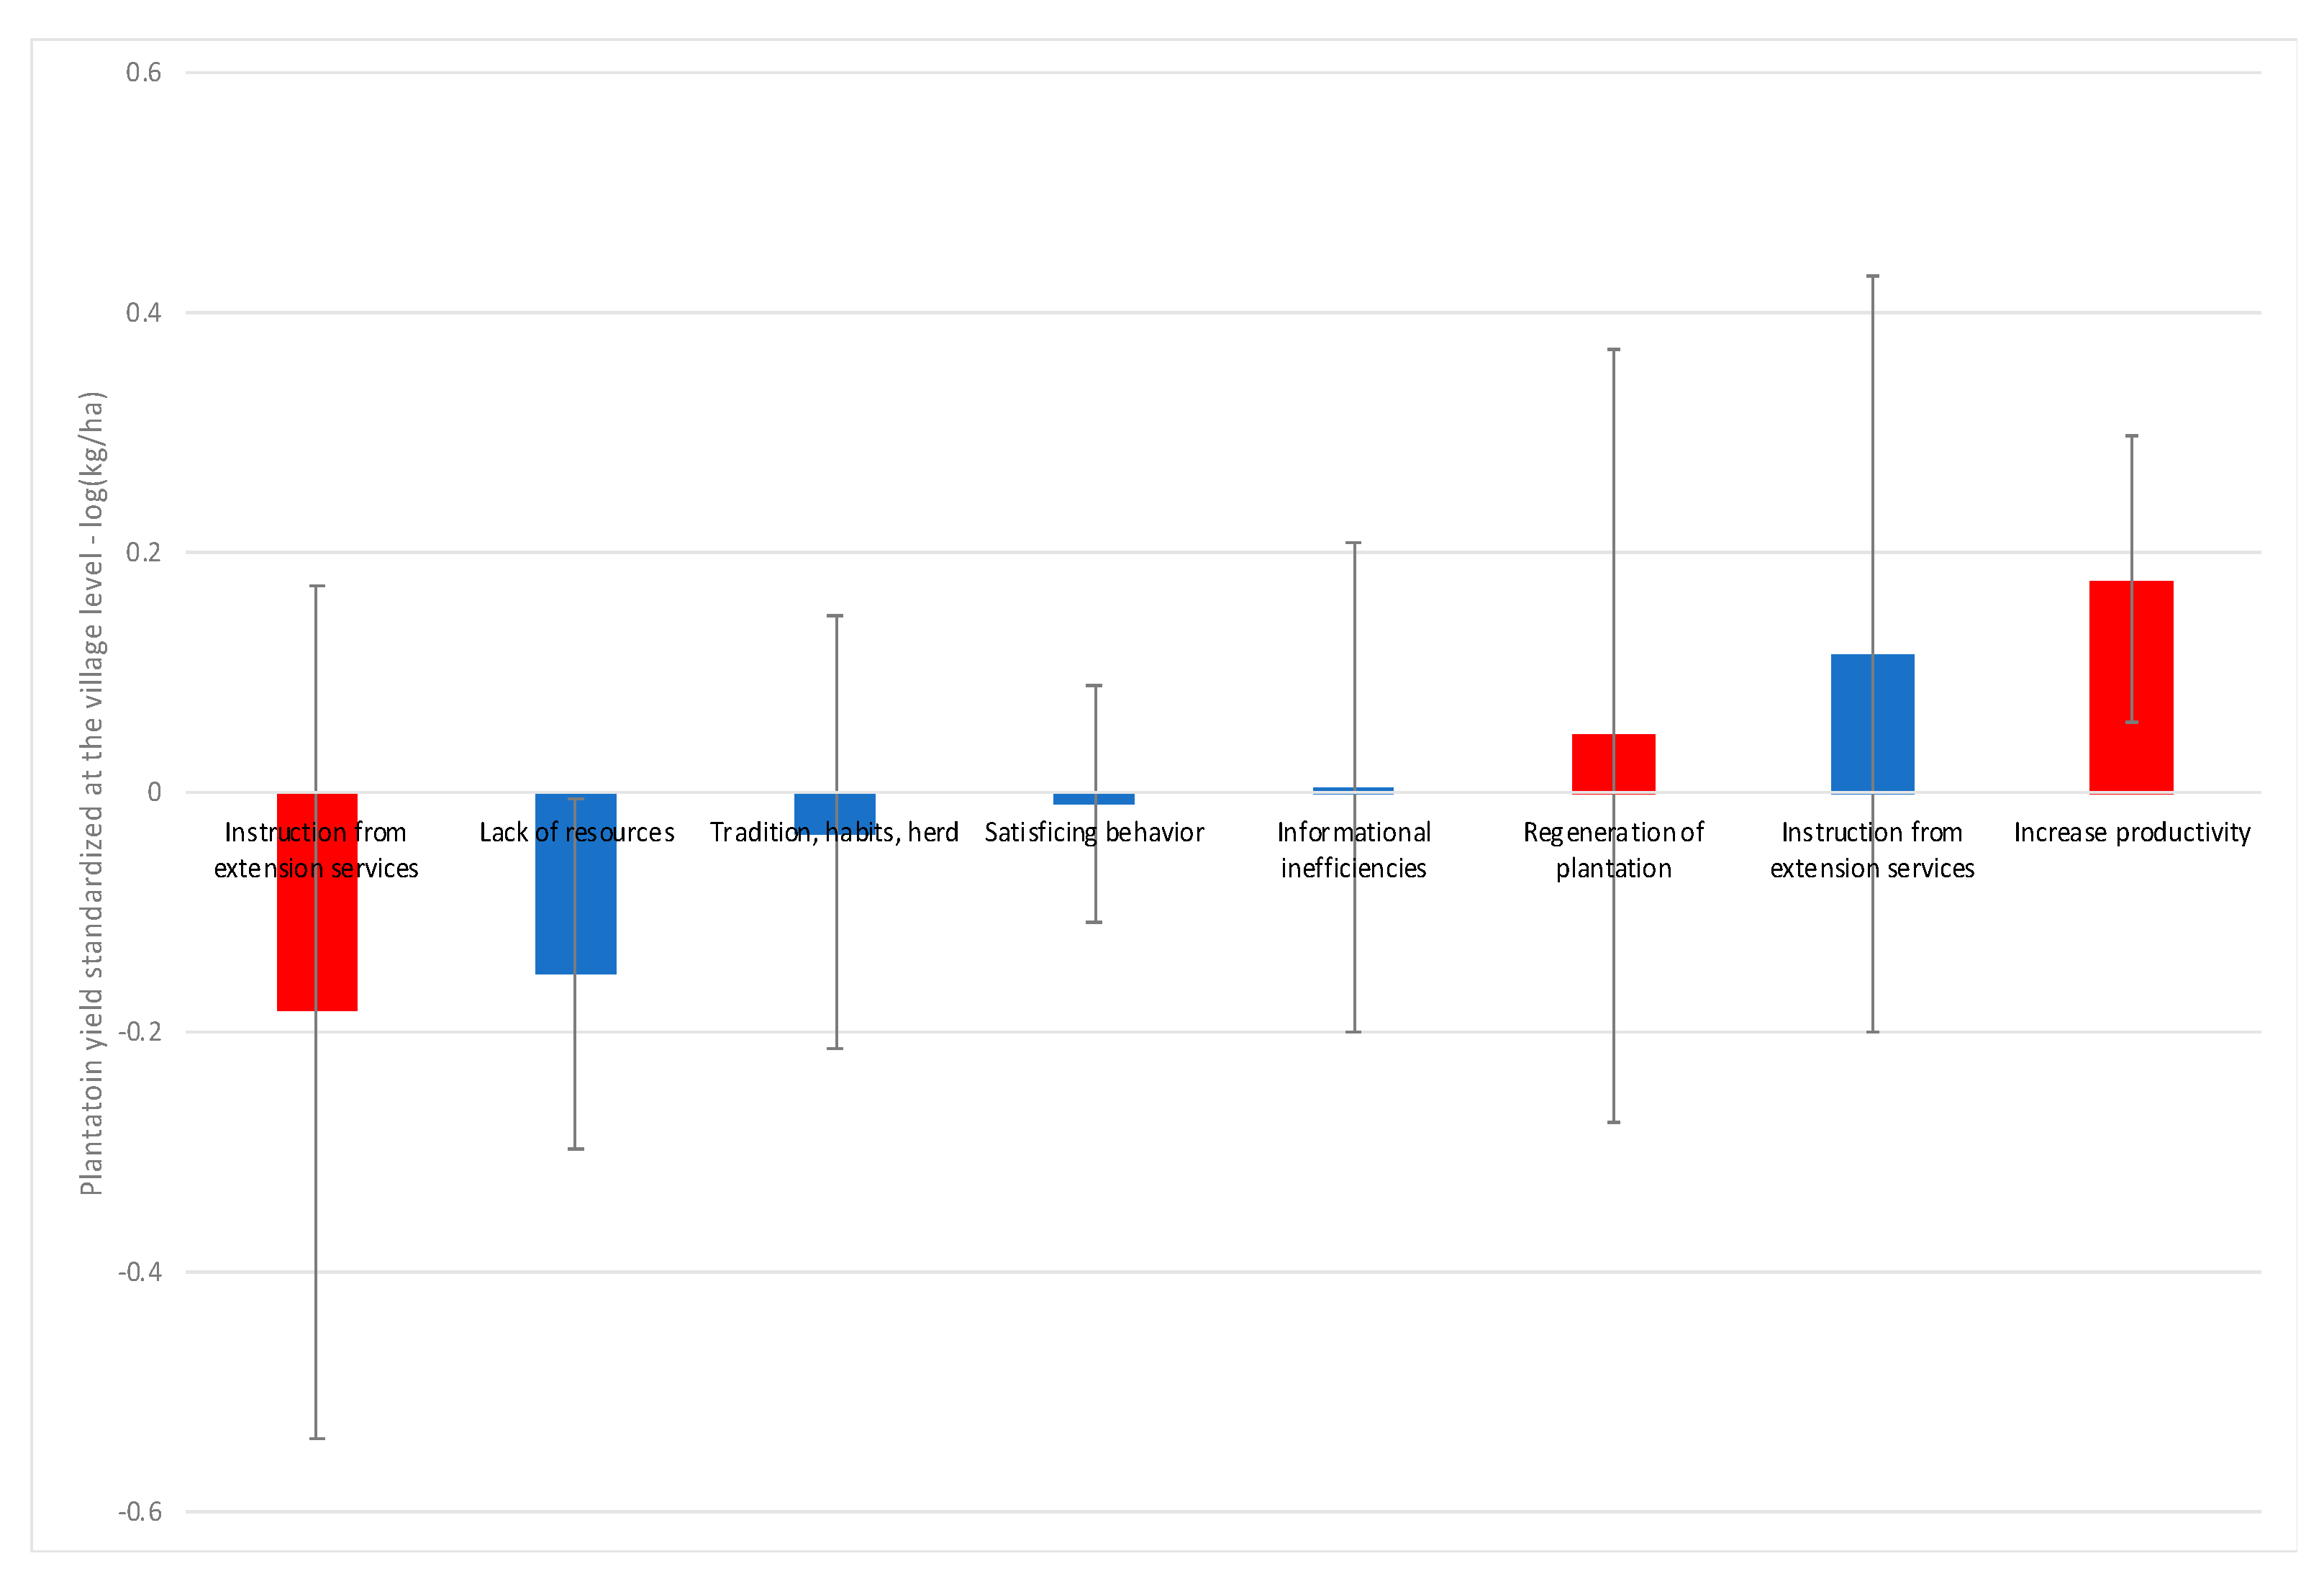
Figure 5.
Cloud of farmers across villages and representative farmers for each village (mean level and 95% confidence ellipse) in the 2D civic capital space.
Figure 5.
Cloud of farmers across villages and representative farmers for each village (mean level and 95% confidence ellipse) in the 2D civic capital space.

Figure 6.
Average civic capital (and 95% confidence intervals) by increasing order for the different sub-categories of farmers depending on whether they modified (red) or not (blue) their agricultural practices over the past two years.
Figure 6.
Average civic capital (and 95% confidence intervals) by increasing order for the different sub-categories of farmers depending on whether they modified (red) or not (blue) their agricultural practices over the past two years.
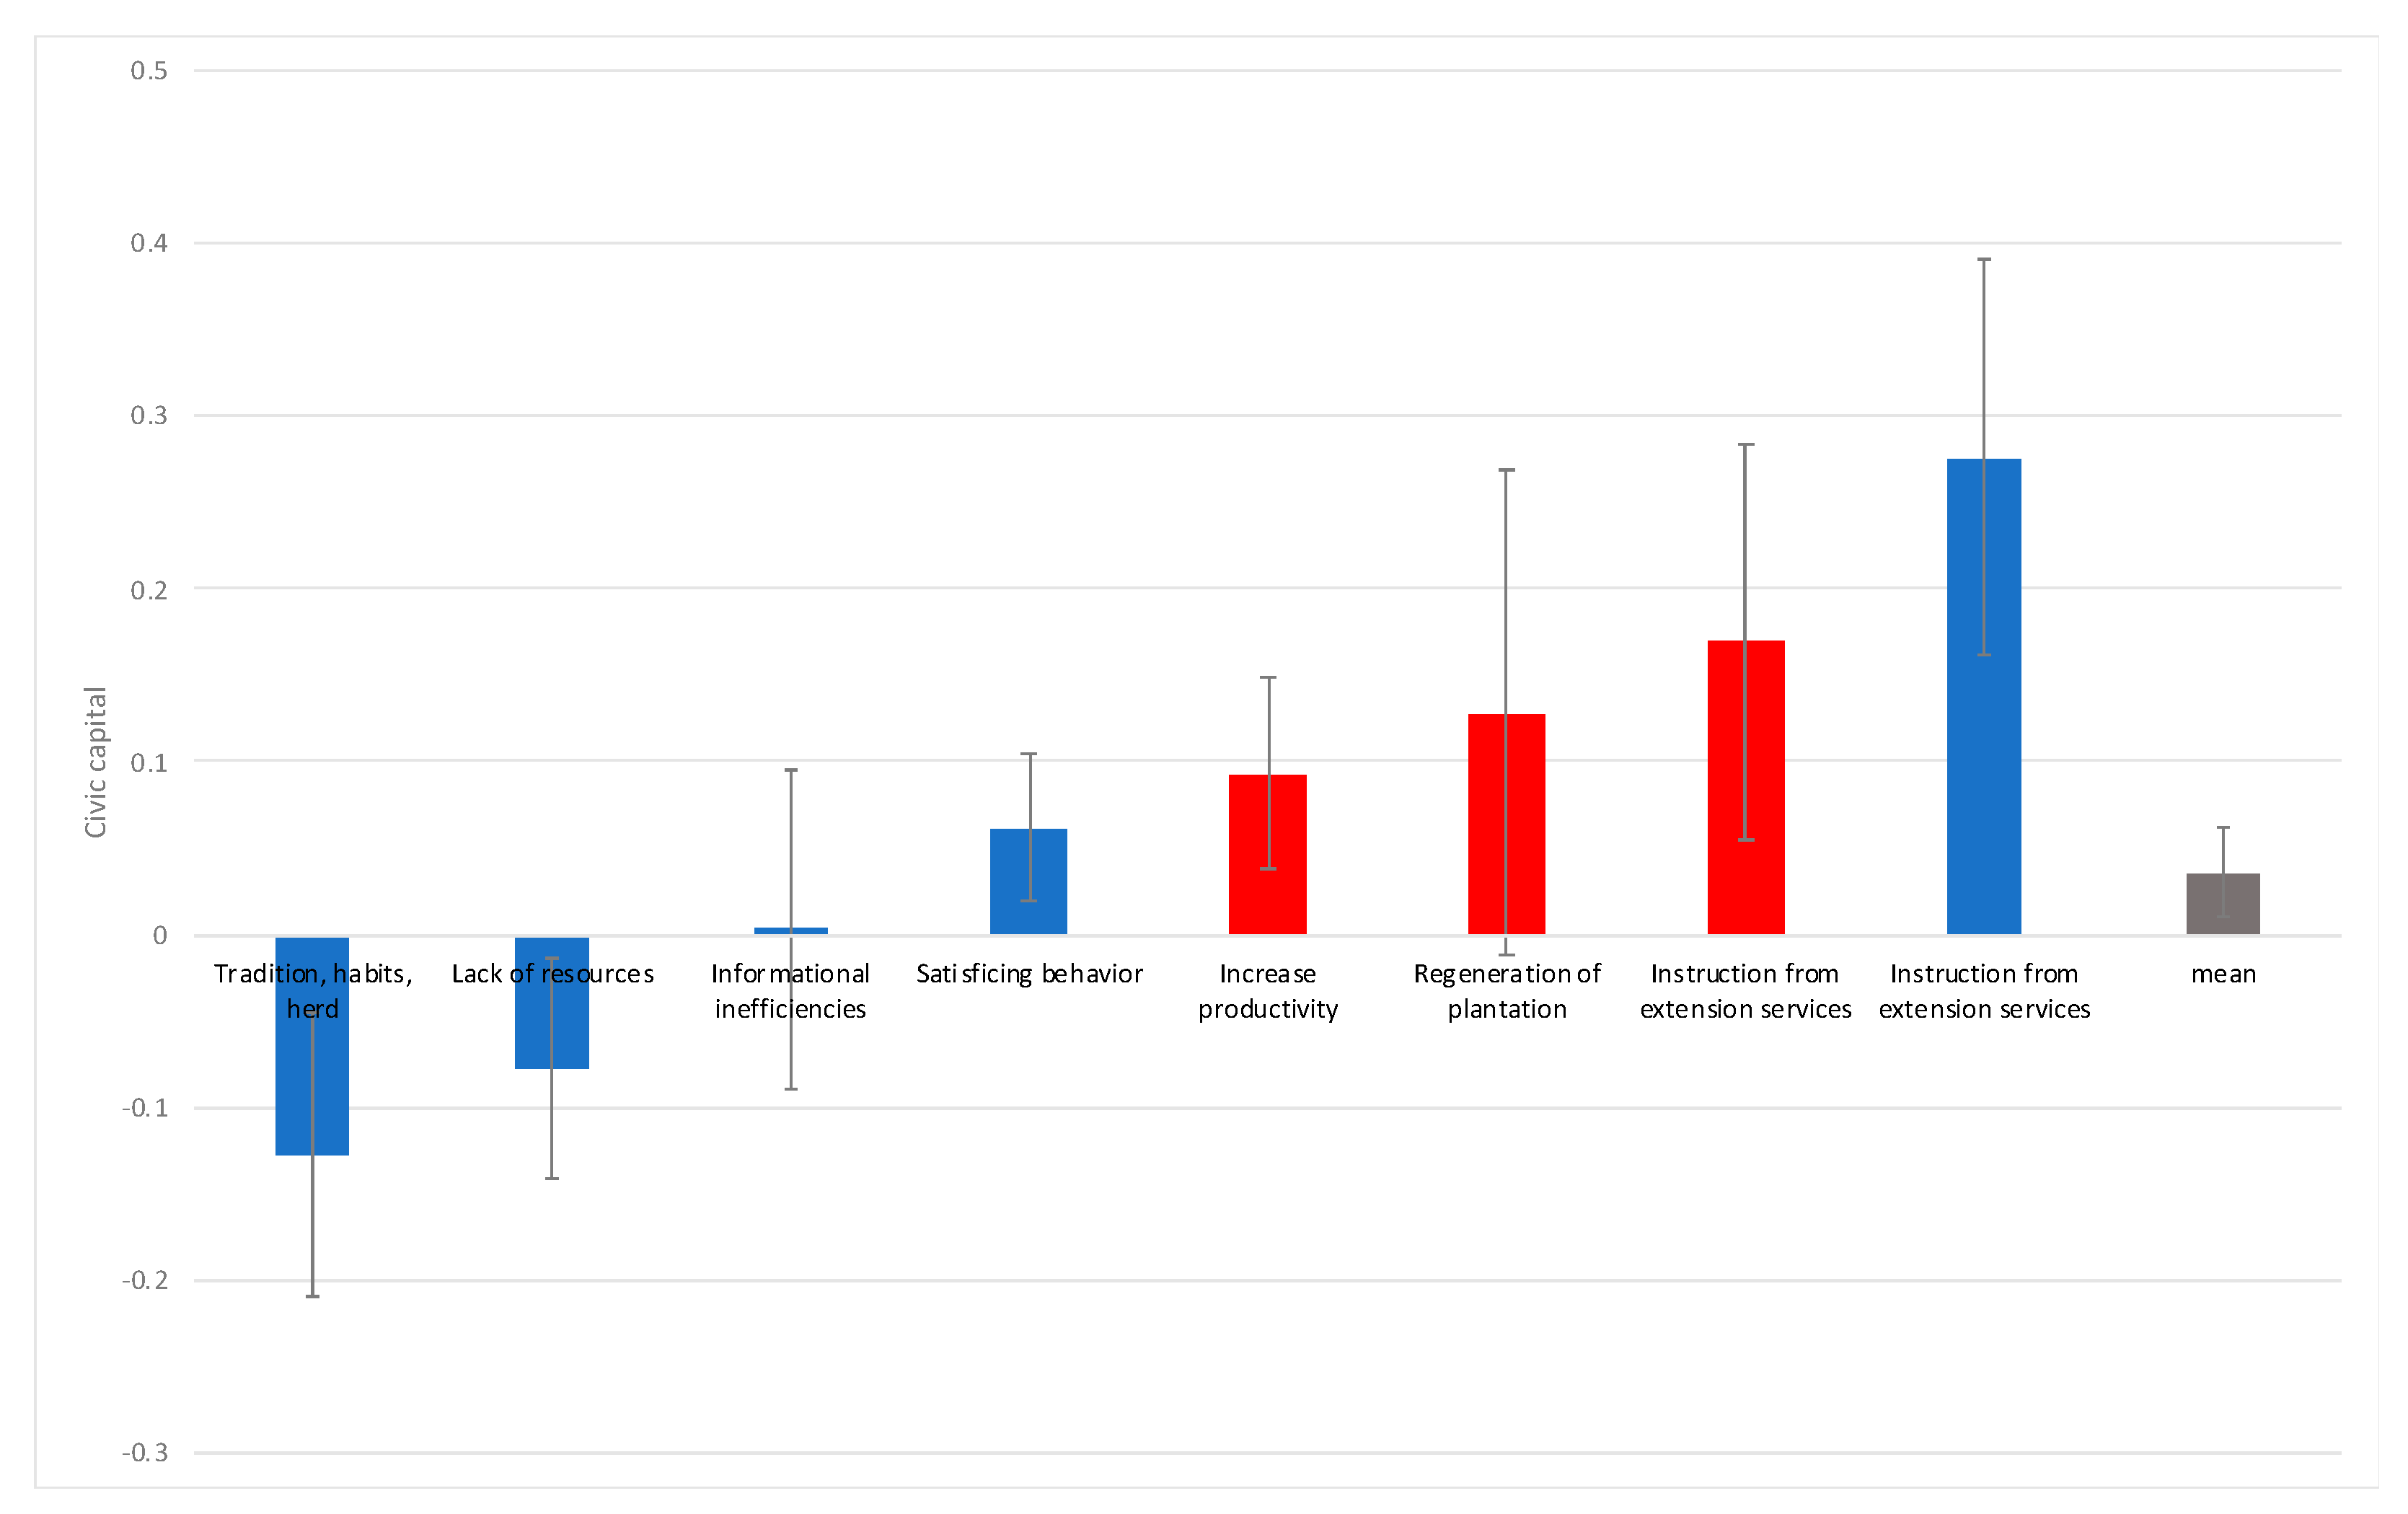
Figure 7.
Predicted probabilities for various levels of civic capital (1st component on the x-axis) on modifying (red) or not (blue) farming practices (y-axis) and 95% confidence intervals, holding all other variables in Model (3) of Table 7 at their means.
Figure 7.
Predicted probabilities for various levels of civic capital (1st component on the x-axis) on modifying (red) or not (blue) farming practices (y-axis) and 95% confidence intervals, holding all other variables in Model (3) of Table 7 at their means.

Table 1.
Paths of productivity growth (increased, steady, decreased) over the past three years for farmers who either have or have not modified their agricultural practices.
Table 1.
Paths of productivity growth (increased, steady, decreased) over the past three years for farmers who either have or have not modified their agricultural practices.
| Modification of Agricultural Practices | ||||||
|---|---|---|---|---|---|---|
| Paths of Productivity Growth | No | Yes | Total | |||
| Increased | 64.37% | 35.63% | 100% | |||
| n = 261 | 19.20% | 24.09% | - | 20.70% | ||
| Steady | 71.38% | 28.62% | 100% | |||
| n = 919 | 74.97% | 68.13% | - | 72.88% | ||
| Decreased | 62.96% | 37.04% | 100% | |||
| n = 81 | 5.83% | 7.77% | - | 6.42% | ||
| Total | 100% | 100% | 100% | |||
| n = 1261 | ||||||
Table 2.
Percentage of farmers who did not modify their farming practices over the past two years.
| Farmer’s Characteristics | No (%) | Chi2 |
| Origins | ||
| Indigenous resident | 86.1 | n = 1262 *** |
| Internal migrant | 63.7 | |
| External migrant | 71.6 | |
| Age (quartile) | ||
| <33 | 68.6 | n = 1262 H0 |
| (33–42) | 70.4 | |
| (43–53) | 71.1 | |
| >53 | 67.1 | |
| Education | ||
| Schooling | 69.2 | n = 1262 H0 |
| No schooling | 69.6 | |
| Administration rights | ||
| Yes | 67.6 | n = 1262 *** |
| No | 76.2 | |
| Born in village | ||
| Yes (24%) | 74.8 | n = 1262 ** |
| No (76%) | 67.7 | |
| Plantation characteristics | No (%) | Chi2 |
| Size (quartile) | ||
| ≤2 ha | 75.2 | n = 1262 ** |
| )2–3) ha | 67.0 | |
| )3–5) ha | 68.6 | |
| >5 ha | 65.0 | |
| Yield (quartile) | ||
| ≤240 kg/ha | 75.3 | n = 1262 *** |
| )240–400) kg/ha | 71.0 | |
| )400–570) kg/ha | 71.5 | |
| >570 kg/ha | 59.6 |
Note: *** significant at 1%, ** significant at 5%.
Table 3.
Key features of the two-dimensional civic capital space (see Guiso et al. [14]).
Table 3.
Key features of the two-dimensional civic capital space (see Guiso et al. [14]).
| Civic Capital Space | Axis 1 (54%) | Axis 2 (20%) |
|---|---|---|
| Solidarity | Contribution | Contribution |
| If a community project does not directly benefit your neighbor but has benefits for others in the village, then do you think your neighbor would contribute time for this project? | 0.0774 | 0.0066 |
| If a community project does not directly benefit your neighbor but has benefits for others in the village, then do you think your neighbor would contribute money for this project? | 0.0795 | 0.0197 |
| If I have a problem, there is always someone to help me. | 0.0692 | 0.1479 |
| Most people in this village are willing to help if you need it. | 0.0861 | 0.1460 |
| If you lose an animal, someone in the village would help look for it or would return it to you. | 0.0473 | 0.0938 |
| Overall, how do you rate the spirit of participation, i.e., the willingness and propensity to participate and be useful, in this village? | 0.0378 | 0.0311 |
| Total | 0.3973 | 0.4451 |
| Reciprocity | ||
| Do most adults in this community work hard? That is, are most people self-reliant and disciplined? | 0.0068 | 0.0713 |
| To what extent do most people in this community believe that they are responsible for their own words and actions? | 0.0748 | 0.0484 |
| If people in this village violate social norms, e.g., insults, rubbish someone, stealing, do they try to remedy their moral transgressions? | 0.0735 | 0.0407 |
| People are always interested only in their own welfare. | 0.0828 | 0.0134 |
| I do not pay attention to the opinions of others in the village. | 0.0523 | 0.0339 |
| Total | 0.2902 | 0.2077 |
| Trustworthiness | ||
| Do you think that in this village people generally trust one another in matters of lending and borrowing? | 0.0621 | 0.0298 |
| Most people in this village are basically honest and can be trusted. | 0.0786 | 0.0907 |
| In this village, one has to be alert or someone is likely to take advantage of you. | 0.0291 | 0.0071 |
| Total | 0.1698 | 0.1277 |
| Cooperation | ||
| Over the past three years, how many times has the village community taken collective action with administrative authorities and elected politicians to develop the village? | 0.0271 | 0.0413 |
| For the steps whose outcome is known today, have they achieved the expected result? | 0.0108 | 0.0102 |
| Have you been solicited by anyone in the last three years to participate in a class action? | 0.0400 | 0.0559 |
| How many times have you yourself participated in a collective action with other villagers in the past three years? | 0.0502 | 0.0878 |
| If so, did these actions concern the improvement of the village’s infrastructure? | 0.0146 | 0.0244 |
| Total | 0.1427 | 0.2195 |
Table 4.
Two-dimensional civic capital space with respect to the four themes (classified in decreasing order) that emerged from the MCA.
Table 4.
Two-dimensional civic capital space with respect to the four themes (classified in decreasing order) that emerged from the MCA.
| Axis 1 | Contribution (%) | Axis 2 | Contribution (%) |
|---|---|---|---|
| Solidarity | 39.7% | Solidarity | 44.5% |
| Reciprocity | 29.0% | Cooperation | 22.0% |
| Trustworthiness | 17.0% | Reciprocity | 20.8% |
| Cooperation | 14.3% | Trustworthiness | 12.8% |
| Total | 100% | Total | 100% |
Table 5.
Group membership (%) and 1st and 2nd most important group/organization.
| Group Membership n = 1137, 90% | Group 1 n = 1137 | Group 2 n = 488 |
|---|---|---|
| Agricultural organization | 67% | 19% |
| Religious organization | 13% | 14% |
| Diaspora | 6% | 30% |
| Youth/Women’s group | 4% | 9% |
| Family group | 3% | 9% |
| Other (e.g., traditional chiefdoms) | 7% | 19% |
Table 6.
Exchange of information within group/organization.
| Exchange of Personal Information | Agricultural Information Exchange and Learning | |||
|---|---|---|---|---|
| Group 1 “Yes” | Group 2 “Yes” | Group 1 “Yes” | Group 2 “Yes” | |
| Agricultural organization | 42% | 45% | 91% | 75% |
| Religious organization | 75% | 73% | 41% | 28% |
| Youth/Women’s group | 70% | 91% | 30% | 40% |
| Family group | 100% | 95% | 46% | 24% |
| Diaspora | 88% | 94% | 30% | 23% |
| Other | 77% | 80% | 45% | 39% |
| Obs. | 608/1116 | 379/480 | 821/1116 | 184/480 |
| Chi2 (p-value) | 0.00 | 0.00 | 0.00 | 0.00 |
Table 7.
Logit estimates for modifying farming techniques and social capital.
|
Dependent Variable: Modifying Farming Practices over the Past Two Years | |||
|---|---|---|---|
| Independent Variables: Smallholder Social Capital | (1) | (2) | (3) |
| Civic capital—axis 1 | 0.173 (0.077) ** | 0.167 (0.077) ** | 0.182 (0.079) ** |
| Civic capital—axis 2 | 0.089 (0.068) | 0.093 (0.068) | 0.110 (0.069) |
| Agricultural organization | 0.091 (0.171) | - | - |
| # Group memberships | 0.326 (0.076) *** | 0.319 (0.076) *** | 0.311 (0.077) *** |
| Member’s duration | 0.009 (0.012) | 0.007 (0.012) | 0.012 (0.012) |
| Youth/Women’s group | −0.545 (0.390) | ||
| Family group | −0.153 (0.501) | ||
| Diaspora | −0.129 (0.327) | ||
| Other (e.g., chiefs) | 0.290 (0.301) | ||
| Personal information | −0.043 (0.158) | ||
| Agricultural information | 0.332 (0.182) * | ||
| Smallholder’s characteristics | |||
| Internal migrant | 0.716 (0.383) * | 0.787 (0.385) ** | 0.705 (0.383) * |
| External migrant | 0.726 (0.385) * | 0.726 (0.386) * | 0.625 (0.386) |
| Age | −0.022 (0.030) | −0.022 (0.030) | −0.030 (0.031) |
| Age2 | 0.000 (0.000) | 0.000 (0.000) | 0.000 (0.000) |
| Born in village (No) | −0.249 (0.210) | −0.270 (0.211) | −0.313 (0.214) |
| Education (No schooling) | 0.030 (0.156) | 0.030 (0.156) | −0.004 (0.159) |
| Administration rights (No) | 0.404 (0.190) ** | 0.402 (0.189) ** | 0.384 (0.193) ** |
| Household size | −0.028 (0.018) | 0.030 (0.018) | −0.025 (0.018) |
| # Males (≥18) in agriculture | 0.142 (0.062) ** | 0.143 (0.061) ** | 0.144 (0.063) ** |
| Plantation’s characteristics | |||
| Plant. Size: )2–3) ha | 0.132 (0.200) | 0.138 (0.202) | 0.112 (0.202) |
| Plant. Size: )3–5) ha | −0.171 (0.213) | −0.163 (0.213) | −0.163 (0.216) |
| Plant. Size: >5 ha | −0.064 (0.206) | −0.057 (0.206) | −0.093 (0.209) |
| Plantation age | −0.045 (0.020) ** | −0.045 (0.020) ** | −0.047 (0.021) ** |
| Plantation age2 | 0.001 (0.000) ** | 0.001 (0.000) ** | 0.001 (0.001) ** |
| Observations | 1093 | 1093 | 1074 |
| Log-likelihood value | −631.244 | −629.613 | −615.802 |
| Chi2 (p-value) | 0.000 *** | 0.000 *** | 0.000 *** |
| Village FE—Chi2 (p-value) | 0.113 | 0.069 * | 0.115 |
Notes: Civic capital variables are standardized at the village level. Village fixed effects are not reported. Robust standard errors are in parentheses. *** significant at 1%, ** significant at 5%, * significant at 10%.
Publisher’s Note: MDPI stays neutral with regard to jurisdictional claims in published maps and institutional affiliations. |
© 2021 by the authors. Licensee MDPI, Basel, Switzerland. This article is an open access article distributed under the terms and conditions of the Creative Commons Attribution (CC BY) license (https://creativecommons.org/licenses/by/4.0/).
Share and Cite
MDPI and ACS Style
Cordaro, F.; Desdoigts, A. Bounded Rationality, Social Capital and Technology Adoption in Family Farming: Evidence from Cocoa-Tree Crops in Ivory Coast. Sustainability 2021, 13, 7483. https://doi.org/10.3390/su13137483
AMA Style
Cordaro F, Desdoigts A. Bounded Rationality, Social Capital and Technology Adoption in Family Farming: Evidence from Cocoa-Tree Crops in Ivory Coast. Sustainability. 2021; 13(13):7483. https://doi.org/10.3390/su13137483
Chicago/Turabian StyleCordaro, Francesco, and Alain Desdoigts. 2021. "Bounded Rationality, Social Capital and Technology Adoption in Family Farming: Evidence from Cocoa-Tree Crops in Ivory Coast" Sustainability 13, no. 13: 7483. https://doi.org/10.3390/su13137483
Note that from the first issue of 2016, this journal uses article numbers instead of page numbers. See further details here.