
Long-Term Changes in Floristic Diversity as an Effect of Transforming the Lake into a Retention Reservoir


1
Department of Hydrobiology and Protection of Ecosystems, University of Life Sciences in Lublin, 20-212 Lublin, Poland
2
Department of Biological Bases of Forestry, Institute of Soil Science and Environmental Engineering and Management, University of Life Sciences in Lublin, 20-069 Lublin, Poland
3
Department of Applied Mathematics and Computer Science, University of Life Sciences in Lublin, 20-950 Lublin, Poland
4
Department of Environmental Engineering and Geodesy, University of Life Sciences in Lublin, 20-069 Lublin, Poland
*
Author to whom correspondence should be addressed.
Sustainability 2021, 13(14), 7642; https://doi.org/10.3390/su13147642
Submission received: 14 June 2021
/
Revised: 1 July 2021
/
Accepted: 6 July 2021
/
Published: 8 July 2021
Abstract
:The Łęczna-Włodawa Lake District is one of the most valuable natural regions in Europe. It is an area of numerous lakes, peat bogs, swamps and forests, which has been undergoing intensive transformation for decades. Among the largest projects were the creation of the Wieprz Krzna Canal system along with the drainage system and the transformation of natural lakes into retention reservoirs. Among the transformed lakes is Lake Wytyckie. The land was used for analyses near the lake, and floristic and habitat analyses were carried out within the boundaries of the contemporary embankment. The studies were carried out from the 1950s, when the lake functioned as a natural reservoir, through to the 1980s (the transformation of the lake), to the 2020s. Lake Wytyckie was transformed into a retention reservoir by increasing its size and flooding the areas inhabited mainly by peat bog, meadow and forest vegetation, which contributed to the impoverishment of both species and habitat diversity of the area, while it increased the nutrient richness of the water. This was reflected both in the decline in the value of individual diversity indices as well as in the ecological index numbers. In the first period of the research, the area was dominated by wetlands, not drained, with a large variety of species that preferred good lighting conditions. Additionally, the habitat was characterized by low reaction, temperature and trophic values. In the following period, there was an increase in the depth of the water of the reservoir, characterized by high water visibility values, which contributed to the presence of protected species, as did the low moisture content of the areas within the embankment and a neutral pH. The factors currently influencing the formation of the vegetation structure are the high humidity of the entire embankment area, the increase in pH, and the significant increase in the share of built-up areas in the immediate vicinity.
1. Introduction
Vegetation is the most visible element of the environment, reflecting the variety of geological, geomorphological, hydrological and soil conditions that influence the richness of habitats. Therefore, it is a very valuable tool for diagnosing the values of the environment.
Biodiversity is the main element of life support systems on Earth, having direct socio-economic and ecological significance for humans [1,2]. Wetlands are among the ecosystems of key importance for the preservation of biodiversity and play an important role in the biosphere [3]. Wetlands cover a wide range of different types of ecosystems distinguished by hydrological and biological features: peat bogs, marshes, shallow lakes, mangroves and salt marshes. Wetland ecosystems are recognized as providing valuable functions (community services) including flood protection, water quality improvement, food chain support and carbon sequestration, enriching and maintaining biodiversity [4,5]. If wetlands are reclaimed, then part of their services will no longer be provided. Agricultural activities in the wetlands in the past and today have been conducted against the ecological nature of the wetlands and the services they provide [6,7,8,9,10]. For centuries, wetlands have been seen as wastelands associated with disease, hardship and dangers. By highlighting the negative effects and ignoring their importance, these ecosystems were identified as obstacles to progress. All over the world, wetlands have been drained and converted into agricultural land or industrial and urban areas for economic benefits. Throughout history, wetlands have been rehabilitated in many parts of the world through increasingly effective drainage activities (drainage and land amelioration).
In North America, Europe and Australia, more than 50% of the area of peatlands, depressed wetlands, coastal zones, lakeside coastal zones and flood plains was lost, mainly as a result of conversion to intensive agricultural use [11,12]. The loss of wetlands has brought countless species of animals and plants to the brink of extinction. The resulting natural wetland ecosystems have lost much of their original character, leading to a reduction in biodiversity and functions other than crop productivity [4,13,14].
While the protection of wetlands is officially a priority for countries that have ratified the Ramsar Convention (www.ramsar.org (accessed on 21 April 2021)), wetlands remain under threat of drainage and restoration.
There are places where low-intensity agriculture takes place in wetlands, under an extensive use regime without fertilizers and pesticides; the diversity of the wetlands can be large, although the species composition and setting differ significantly from its original state. This ‘secondary biodiversity’ is often worth protecting as it includes many rare and characteristic species. The twentieth-century agricultural intensification associated with the use of fertilizers and pesticides has destroyed many of these values so that many farmlands, pastures and rice fields are very poor in species. Nevertheless, many parts of the world have wetlands where low-intensity agriculture is combined with non-food ecosystem services, including biodiversity and flood containment [12].
The Łęczna-Włodawa Lake District is one of six subregions of Polesie Lubelskie, which is the western part of the Great Polesie region. The peculiarity of this area is its flatness, with a very shallow occurrence of groundwater and a dense network of surface waters in the form of lakes, swamps and peat bogs. However, although there appears to be a water richness, there are actually large water deficits here, resulting on the one hand from a low supply, and on the other, from the conditions of water retention in the rocks of the substrate. The region has an agricultural character with a significant share of forest areas, semi-natural ecosystems and water areas [15].
The desire to stimulate the economy of the region initiated anthropogenic changes in water conditions. Significant changes began in the first half of the 19th century. To overcome the stagnation of agriculture in this area, comprehensive measures were taken to regulate the water management. The construction of the Wieprz Krzna Canal system (WKC) in the years 1954–1961 was to support this management; the final drainage works continued until 1985 [16]. The construction of drainage systems resulted in lowering the groundwater table in numerous places, draining the wetlands and accelerating the spring runoff.
The water relations of the Łęczna-Włodawa Lake District have been seriously transformed, along with the nature and especially the vegetation, which was subject to far-reaching degradation. Does human interference with the ecosystem always mean contempt for habitat conditions? Lake Wytyckie is an example of a lake in which the water level has risen and is still subject to fluctuations.
Our research aimed to determine the floristic and habitat diversity of Lake Wytyckie and to assess the impact of hydro-technical activities carried out within the lake, as well as in the immediate vicinity. Analyses were performed over the last 70 years. These studies will allow assessment of the impact of these activities on the phytocenotic diversity and habitat variability of the area subjected to intense anthropopressure and will allow indication of directions of further evolution.
2. Methods and Study Area
2.1. Study Area
Polesie is a vast and flat land on the border of modern-day Belarus, Ukraine and Poland, featuring marshy plains with a dense network of surface waters [17]. In terms of the area covered with wetlands, this region is in the lead in Poland (5th place) [18]. The greatest number of peat bogs and lakes are found in the central and southern part of Polesie, including the Łęczna-Włodawa Lake District.
Among the six lakes included in the WKC system, there was Lake Wytyckie located in a depression between Krowie Bagno in the east and a chalk hill in the west, now a retention reservoir in the Wieprz-Krzna canal system. In 1953, before the drainage works, the area of the lake was 270.1 ha, the length of the shoreline was 7420 m, the maximum depth was 3.4 m, and the capacity was 3511 thousand m3. After changing to a storage reservoir, the area almost doubled to 487 ha, and the capacity to 9174 thousand m3 [16]. In 2010, the area was determined at 474.88 ha, and the length of the coastline was 9.737 km [19]. Since 1990, with the establishment of the Poleski National Park in this area, Lake Wytyckie was within the boundaries of the park’s buffer zone.
Lake Wytyckie is located in eastern Poland, in the Łęczna-Włodawa Lake District, near the village of Wytyczno in the Urszulin commune (51°25′52.59″ N, 23°13′16.20″ E). It is the largest reservoir of this type in the Łęczna-Włodawa Lake District. The lake was embanked from the north, east and west sides. Originally, the reservoir was supplied from the Wieprz-Krzna canal through the Bogdanka-Wola Wereszczyńska canal. For many years, the water supply has been impossible due to the development of mining damage in the Bogdanka coal mine. Hence, both Lake Wytyckie and the meadows of the neighboring Krowie Bagno are supplied exclusively from their catchment [20].
2.2. Cartographic Analyses
The analysis of the use structure of the area around the reservoir was based on field research and study analyses. The analyses were performed using the photo-interpretative retrospective analysis method with the use of satellite scenes from the Rapid Eye satellite (2009), as well as orthophotos (2007, 2018). The satellite scenes were accurate, but the spectral channels made it possible to more accurately distinguish different land-use forms, such as wet meadows, arable fields and peat bogs. Archival orthophotos were monochromatic, with a terrain pixel size of 0.5 m.
Due to the availability of materials, detailed analyses of land use forms were carried out analogically for all periods of the 1950s, 80s, 90s and the 2020s, in the area designated based on the range covering the oldest satellite image. Archival maps were made available by the Poleski National Park. The scale of orthophoto maps was 1:10,000. Analyses were performed using the ArcMap10.5.1 program.
2.3. Floristic Analyses
The vegetation studies were carried out within the boundaries of the current embankment. Data on the distribution and occurrence of plants in the region and Lake Wytyckie from the period before the WKC system was established in the 1950s (period I—1950–1960), obtained from the literature [21,22], supported by aerial photographs. Data from the 1980s came from the authors’ own research (period II—1977–1980). In the 2020s (period III—years 2018–2020), analogous to the 1980s, plant samples were investigated once per month (from April to October).
Phytosociological studies were carried out using the Braun–Blanquet method [23]. The phytosociological classification and nomenclature of the plant communities were based on a paper by Matuszkiewicz [24]; the vascular plant names followed those proposed by Mirek et al. [25], and the names of bryophytes were adopted from Ochyra [26]. Floristic studies were carried out using the floristic anchor and the sonar Elite no. 5 of LOWRENCE [27].
The Ellenberg index was used for the ecological characterization of the plant and vegetation habitats of the lake and its surroundings. A list of 330 species was made, which were assessed using six indicators: light L, substrate moisture F, reaction R, trophy N, temperature T and continentalism K. The ecological response of species to the six mentioned environmental features was estimated on a 9-point scale [28].
The values of ecological numbers were calculated for each decade taking into account the occurrence of species and their share, by the equation formula (Equation (1)):
where SP is the degree of coverage expressed on the Braun-Blanquet scale.
Biodiversity of each group of macrophytes was supported by the index of Shannon–Weaver (Hs) [29] (Equation (2)):
where Ni is the relative abundance of species i.
Margalef richness index [30] is used in (Equation (3)):
where S is the number of species and N is the total number of individuals, a higher value of Margalef index means higher richness and a lower value means lower richness.
We used Simpson’s diversity index to measure diversity [31] (Equation (4)):
For Simpson’s diversity index, 1 − λ = Simpson’s index (S), pi—type participation in the sample, s—number of species in the sample.
2.4. Statistical Analyses
The analyses aimed to determine the floristic and habitat diversity of Lake Wytyckie in three time periods within the last 70 years (1950–1960; 1977–1980; 2018–2020). Statistical measures of location and dispersion in particular research periods for ecological indicators (the Ellenberg index) and environmental factors were determined and described. Because the examined variables were not subject to the normal distribution (Shapiro–Wilk test), the non-parametric Friedman test was used to verify the changes occurring between the studied decades.
The distribution of the plant communities’ diversity indices (Margalef, Shannon-Wiener, Simpson) is presented in the box-whisker diagrams, at the same time indicating their significant differentiation in individual decades. The graphical presentation of the results also allowed assessing the direction of differentiation of the analyzed features between the analyzed periods. The graphical presentation of the results also allowed assessing the direction of differentiation of the analyzed features between the analyzed periods.
Based on the principal components analysis (PCA), the factors influencing the plant structure in particular research periods were identified. The correlation of the variables was determined based on the Pearson correlation coefficient. Before the PCA was performed, the data was standardized. Statistical data analysis was performed using the Statistica 13.3 program.
3. Results
3.1. Changes in the Development of the Lake Surroundings
The period of 70 years caused enormous changes in the use of the surroundings of Lake Wytyckie (Figure 1). The share of wet meadows and marshy areas decreased. The area of drained, built-up and forested areas has increased significantly. There were also numerous changes in the area of the embankment.
In the 1950s, the lake was surrounded by peat bogs, the narrowest on the south side. In the 1980s, the area between the embankments was occupied by various habitats (dry, marshy and swampy). It was only in the 1990s, when the lake waters covered the area to the embankments, that the wetlands completely disappeared, while sections of higher elevated areas overgrown with shrubs and trees remained. In the first years, they died out and then turned into floating islands with numerous shrubs. Recently, due to the decreasing water level and large fluctuations, shrubs are replacing rushes (Figure 2).
The statistical analysis of management forms of the lake surroundings confirmed that the most significant changes in subsequent periods were subject to the length of the watercourses (rivers, canals) and the area of buildings, surface waters, meadows and marshy areas (Table 1).
3.2. Vegetation Structure
In the analyzed area of research, there were a total of 69 plant communities covering 10 classes throughout the entire research period. The distinguished classes and communities were represented by a total of 330 species, the most of which occurred in the 1980s—278 species, and the least—112 species, nowadays.
Both the number of communities and their composition changed in the following decades. In the 1950s, there were no communities of Lemnetea minoris, Bidentetea tripartite and Utricularietea intermeio-mnoris classes, the communities representing Phragmitetea class were less numerous (24 phytocoenoses representing 27 species). There were numerous communities of Charetea class (four communities, including six species).
The 1980s was the period of the greatest qualitative and quantitative diversification of the communities in the area of Lake Wytyckie. Sixty-one plant communities represented all classes. There were numerous communities from the Molinio-Arrhenatheretea class (eight communities representing 82 species), the number of communities from Phragmitetea class doubled (22 communities represented by 39 species), and the share of communities from Potametea class (16 communities consisting of 25 species) also increased.
In the 1980s, the same number of plant communities was recorded as in the 1950s-41 communities-but their composition has changed. The communities of the Molinio-Arrhenatheretea, Scheuchzerio-Caricetea, and Querco-Fagetea classes have retreated, and only one community representing the Charetea class has remained. In general, there was a regression of the number of communities of all the distinguished classes concerning the 1980s, while compared to the 1950s, the transformation towards Phragmitetea and Potametea water communities was observed (Table 2).
The conducted analysis of the distribution and ranges of individual communities (presented on the transect example) indicates a clear reconstruction of the vegetation in this area. In the 1950s, in the western, extreme part of the analyzed transect, there were mainly Alnetea glutinosae communities. In the direction of the lake, there were communities of wet heaths and raised bogs, as well as meadow and pasture communities. There were numerous water communities in the lake, especially Chara. In the 1980s, the marsh and alder communities gave way, and the pores (Epilobieta angustifolii), semi-natural xerothermic pioneering communities (Agropyretea intermedio-repentis), and perennial plant communities typical of ruderal areas (Artemisietea vulgaris) appeared (Figure 2). There were also numerous communities of xerothermic grasslands (Festuco-Brometea), thermophilic fringe communities (Rhmano-Prunetea) and meadow and pasture communities (Molinio-Arrhenatheretea covering eight communities). More rush communities appeared in the water; there were Chara communities, but less diverse.
A significant increase in the water level from the 1980s resulted in impoverishment in almost all communities. Forest communities have been preserved in the form of floating islands or small coastal fragments. Extreme depletion occurred on the eastern side of the lake/transect, where only aquatic plant communities were preserved (Figure 3). Friedman’s test showed a significant differentiation in particular periods of research for the share of species in communities (p < 0.001) and the share of communities in classes (p < 0.001).
Among the 14 types of habitats identified within the analyzed area of Lake Wytyckie, all occurred in the 1980s, including three currently legally protected. Only four types of habitat have been distinguished today. The grasslands, meadows, peat bogs, riparian forests and even ecotone habitats have disappeared (Table 3). All of the above have been replaced by aquatic habitats. Reducing the diversity of habitats was closely related to the species impoverishment, and thus the floristic diversity of the studied area.
Changes in the qualitative and quantitative structure of vegetation in individual research periods also reflect the ecological and biodiversity indicators. The lowest values of all analyzed indicators of species richness, assessed both for the classes and communities inhabiting the analyzed area, occurred recently. The values of the indicators were similar in the other two study periods. The Margalef index (DMg) values were slightly higher for the 1950s, while the Shannon–Wiener (HS) and Simpson (S) indices were higher in the 1980s, both among classes and plant communities (Table 4).
The values of the plant communities’ diversity indices confirm their statistical significance in respective study periods, especially the Shannon–Wiener and Simpson index (Figure 4, Figure 5 and Figure 6). The species present in the study area represented almost the full range of indicators: L (3–9), R, N (1–9), T (2–8), K (1–8) and F (2–12). There were many edifiers of wide ecological amplitude for most of the habitat factors, especially T (94), K (70) and R (87). These species could not be considered indicative. The average value of the light index calculated for each decade indicates 20–30% shaded habitats. However, in the 1950s it was greater than in the following decades. The pH index gradually increased from moderately acidic (5.8 years 50) to slightly alkaline (6.22, 6.14 in subsequent periods). The trophic index values indicated an evolution from low-nitrogen sites through moderately nitrogenous to moderately rich in nitrogen (Table 5). The differences in the mean values of the humidity index between the individual study periods were statistically significant (Friedman’s test (p < 0.001).
The values of the indicators: light (L), continentalism (K) and trophy (N) in 1950–1960 were significantly above the average (amounting to 6.96, 4.22 and 4.88, respectively). In the subsequent analyzed periods, their decreases were observed (much greater in the period 1977–1980). The values of the temperature index (T), and reaction (R) in the years 1950–1960 were much below the average (5.46, 6.08 respectively). In the case of the temperature index (T) there was a visible increase, by far the largest in the period 2018–2020. The values of the moisture index (F) in the periods 1950–1960 and 2018–2020 were above the average (8.47) (Figure 7). All the analyzed indicators confirm the changes related to the increase in the fertility of the habitat and the dominance of typically aquatic species.
Analyzing the share of indicator species, the results of the Bray–Curtis dissimilarity index () indicate a large diversity of habitats in particular periods. Particularly high differentiation occurred in the 1980s.
- BCd (t1, t2) = 0.4539
- BCd (t1, t3) = 0.5164
- BCd (t2, t3) = 0.4073
where:
- t1: 2018–2020
- t2: 1977–1980
- t3: 1950–1960
During the 70 years of research on the floristic structure of Lake Wytyckie, in addition to the changing number of species, habitats and the values of individual indicators of floristic diversity, the share of rare and protected species in the flora of Poland has also changed. In the 1980s, the largest share of protected species was recorded—45 species (Table 6). Only eight protected species are in the area today: Chara aculeolata, Najas marina L., Hippuris vulgaris L., Nymphaea alba L., Nymphaea candida, Sparganium minimum, Carex diandra, and Nasturtium officinale W. T. Aiton, the new species for this area.
The factors that significantly changed in the subsequent periods of research included the depth of the lake and the transparency of the water in the reservoir, as well as the HS and DMg diversity indicators (Table 7).
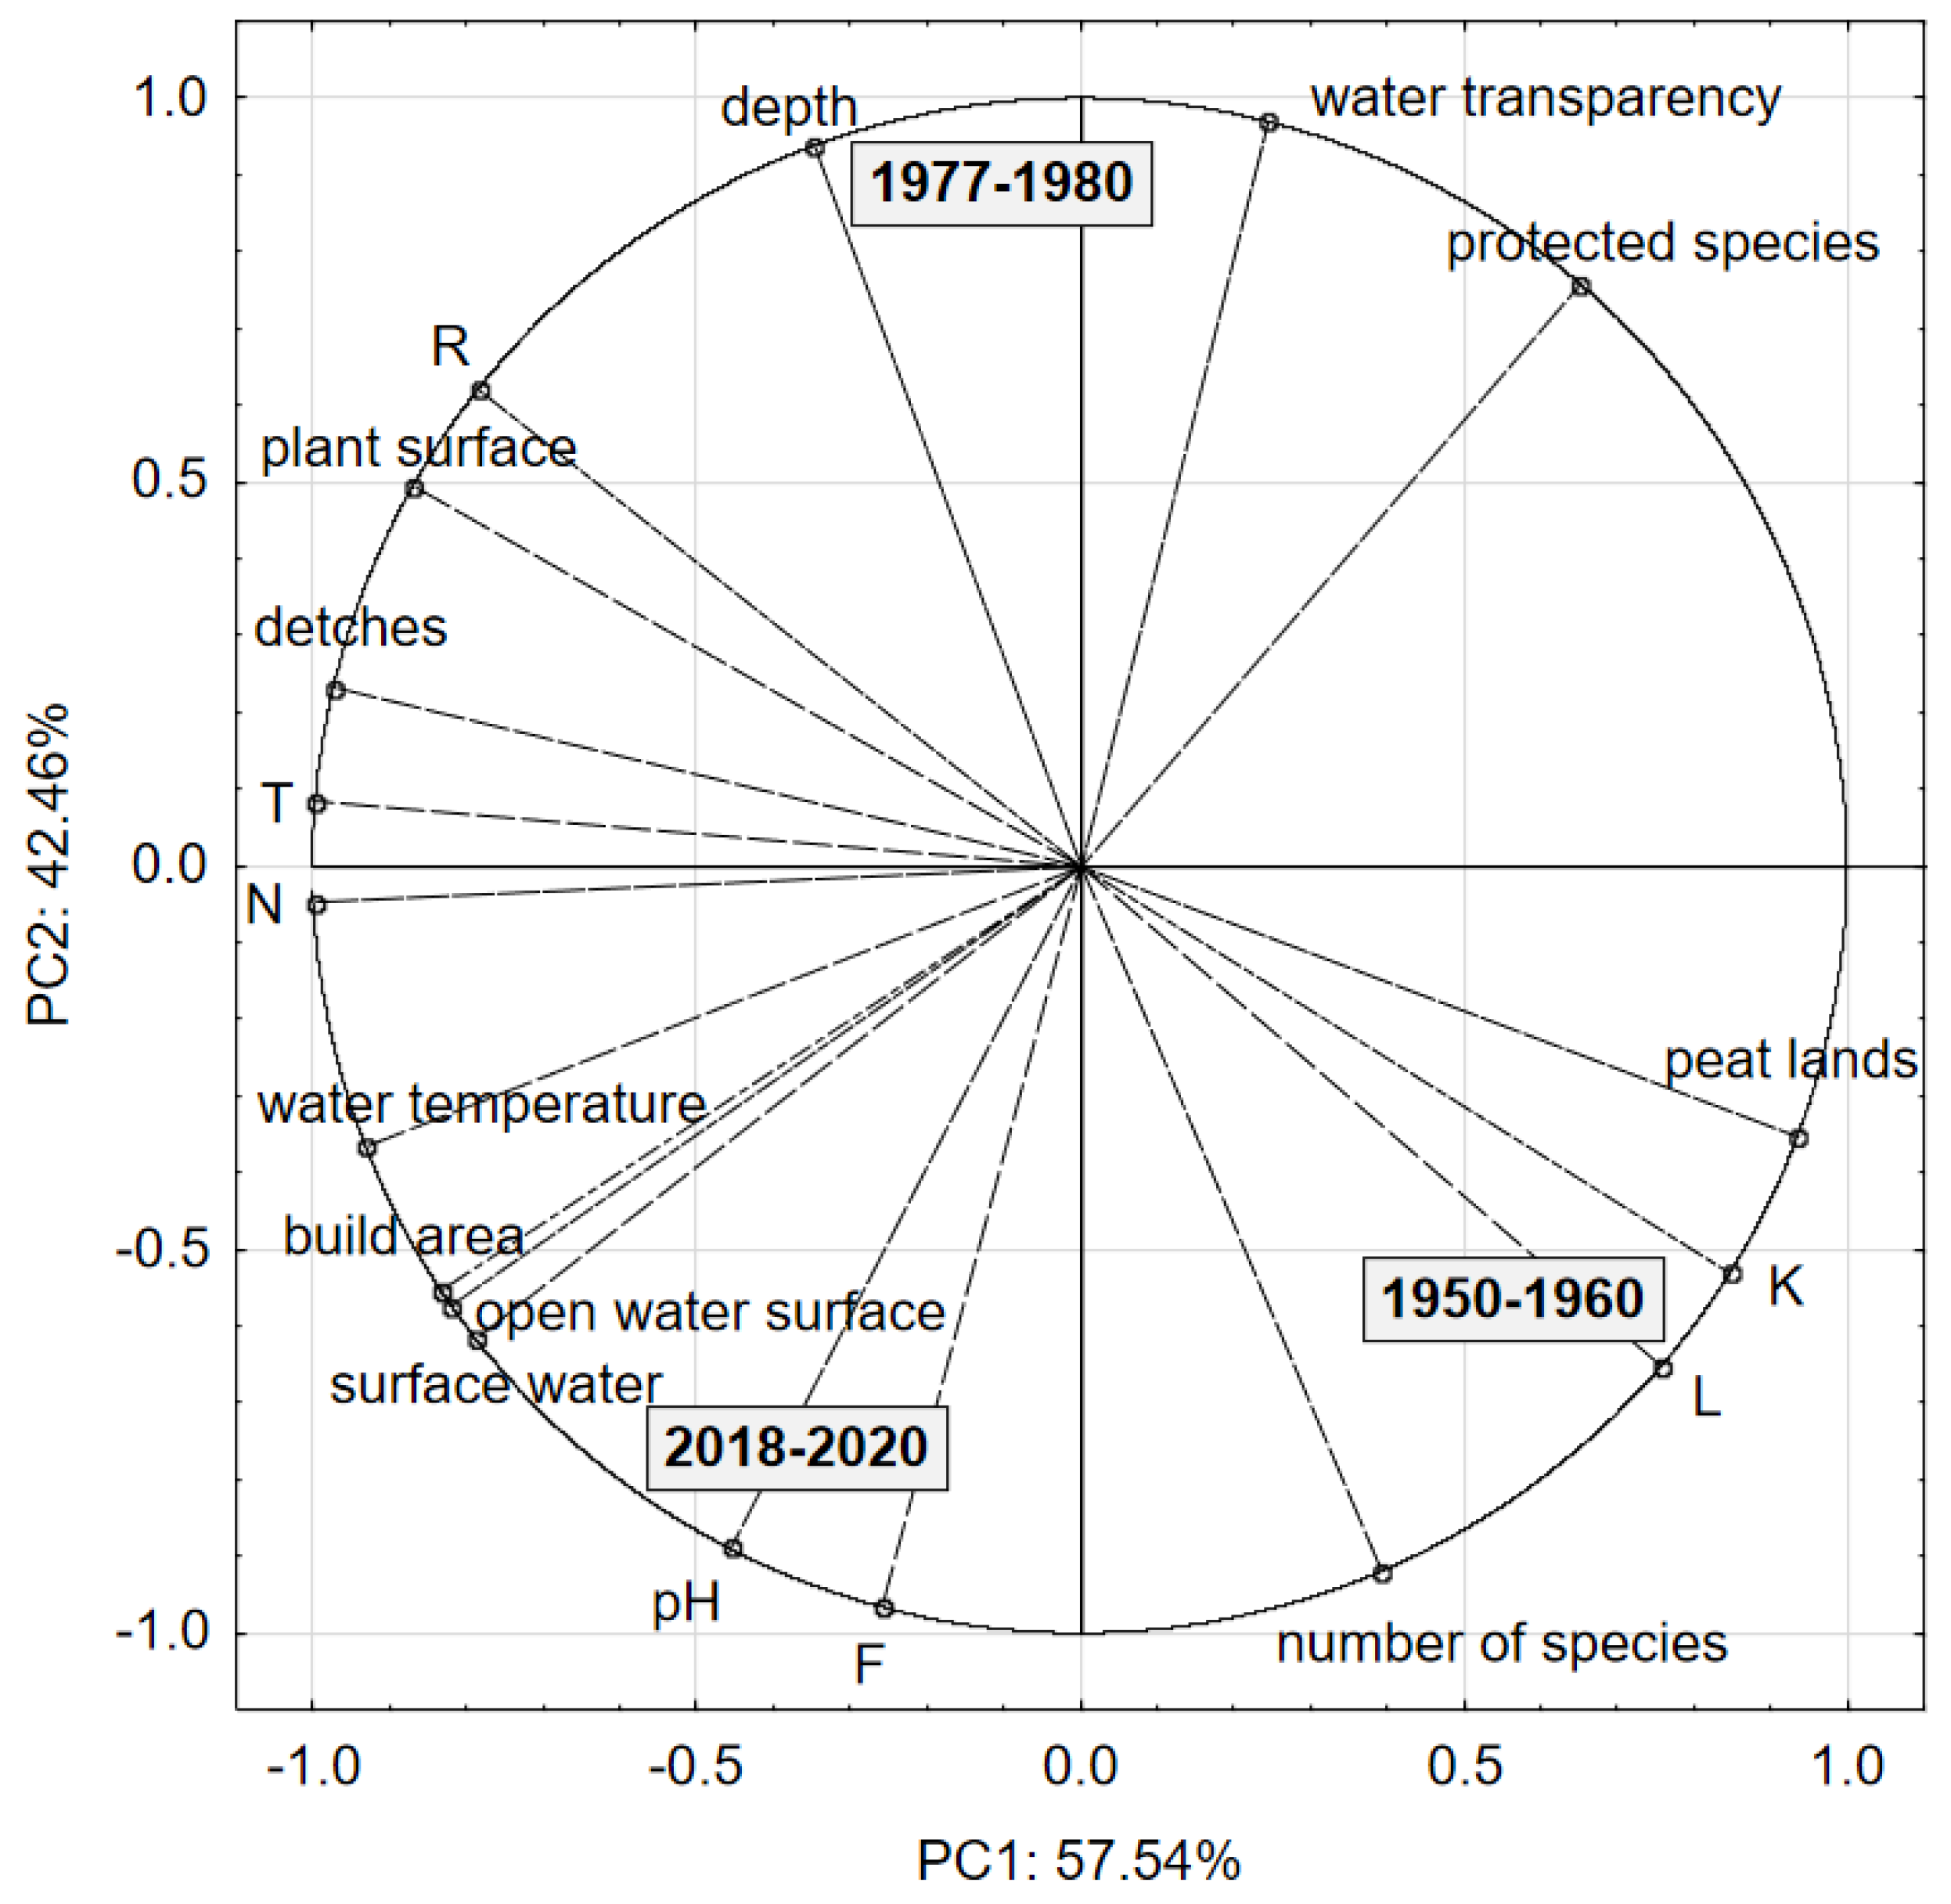
Based on the PCA analysis, it was possible to identify factors influencing the structure of plants in particular study periods (Figure 8). According to the Kaiser criterion, two eigenvalues exceeded the value of 1, and on this basis, new PC1 and PC2 components were created, explaining, respectively, 57.54% and 42.46% of the variability of the tested system. In the first period of the research, the area was dominated by wetlands, not drained, with species preferring good lighting conditions with a large variety. On the other hand, the habitat was characterized by low reaction, temperature and trophic values.
In the following period, there was an increase in the depth of the water in the lake, featuring high water visibility, which contributed to the presence of protected species, as did the low moisture content of the areas within the embankment and a neutral pH.
The group of factors currently influencing the formation of the vegetation structure are the high humidity of the entire embankment area, the increase in pH, and the immediate vicinity, a significant increase in the share of built-up areas.
4. Discussion and Conclusions
The decline in biodiversity in the world is seen as a result of the degradation of the biosphere. Hence, to preserve the natural heritage and secure the sustainability of human development, it is important to recognize what elements are most endangered and what actions should be taken to protect them. Hence, the assessment of diversity is the main determinant of changes in the environment [32]. The contemporary world is struggling with an unprecedented rate of extinction of species [33]. Among the factors determining the state and preservation of biological diversity are both natural and anthropogenic. And the latter poses an increasing threat to biological life. Among them are the threats analyzed in the paper related to changes in land use due to hydrological changes, one of the most valuable natural regions not only in Poland but also in Europe. There are still unique wetlands, lakes, peat bogs and forests here. The transformation of the hydrological conditions of the region mainly consisted of draining the wetlands through amelioration activities. Radical changes in the water conditions in this area took place in the second half of the 20th century with the implementation of large investments, especially the construction of the Wieprz-Krzna canal and the operation of the coal mine in Bogdanka. Strong anthropopressure was marked mainly by the intensification of agriculture, industrialization and the construction of a road network. The significant expansion of infrastructure in the analyzed area, including water intakes, using underground resources significantly increased the pressure on the region’s small water resources. This is reflected in the deepening losses in the water surface of lakes, including Lake Wytyckie. The modest water resources of Polesie depend mainly on the atmospheric supply [19]. Hydrotechnical activities certainly accelerated the carbon cycle. The abundance of aquatic habitats favors the accumulation of carbon in organic compounds forming the gyttja and peat layers. All activities disturbing water relations result in an increased loss of organic matter and thus a greater emission of C contained in the soil to the atmosphere. In addition, they significantly accelerate the water cycle, which leads to a lowering of the groundwater table and deepening water deficits in the region. On the other hand, supplying water from the river Wieprz to the Lake District changed the water balance of the areas covered by the irrigation system and changed the quality of water in water reservoirs.
The floristic diversity of Lake Wytyckie, assessed over the course of 70 years, is worsening. There are many reasons for this—the plants of hydrogenic habitats are, among other things, very sensitive to changes in the water level. Lowering the water level may change the range of their occurrence [34,35]. Uncovering highly humid areas through the action of atmospheric air may change the properties of sediments and facilitate the entry of shrub species. Typically, raising the water level and flooding the adjacent areas is associated with an increase in the intensity of surface runoff, leading to an increase in the fertility of these areas. The rapid increase in the water level, through increased soil erosion, contributes to changes in the properties of sediments and destruction of coastal vegetation, thus reducing species diversity [36,37,38,39]. The transformation of Lake Wytyckie into a retention reservoir by increasing its size and flooding the areas inhabited mainly by peat bog, meadow and forest vegetation contributed to the impoverishment of both species and habitat diversity of this area, but also an increase in in the nutrient richness of water. This was reflected both in the decline in the value of individual diversity indices as well as in the ecological index numbers. The disappearance of many species inhabiting the deepest zones of the lakes was associated with an increase in the water level. Chara plants are indicators most sensitive to the deteriorating light conditions in lakes, which undoubtedly took place in Lake Wytyckie after the hydrotechnical treatments applied. Plants with floating leaves, treated as the least sensitive to changes in water level [40], were represented in great numbers both in the 1950s and nowadays.
In Lake Wytyckie, as in most retention reservoirs, the water level is still subject to fluctuations. The diversity of species richness in such reservoirs has been widely described in the literature. The examples of Scandinavian reservoirs confirm that large fluctuations significantly impoverish the diversity of aquatic vegetation [41,42]. Other studies indicate that fluctuations with low dynamics and frequency increase diversity [43]. Research conducted on reservoirs in the USA, Finland and Norway indicates that any disturbances in the water level harm the floristic diversity of these reservoirs, a smaller share of rare species and a greater share of alien species [44,45].
The effect of transforming Lake Wytyckie into a retention reservoir was certainly the loss of the typical zoning of individual macrophyte groups over a large area of the reservoir. Especially in the places where these peat bogs and meadows occurred in the 1980s-the inter-embankment area. Shallow and eutrophic reservoirs, which include the Lake Wytyckie, are extremely vulnerable to rapid degradation. This may be aggravated by improper use of its surroundings as well as the lack or limitation of the development of vegetation in the littoral [37]. The development of the coastal zone of this reservoir should be carefully planned, as too dense development in the coastal zone may significantly reduce the coastal vegetation [46]. The presence of forest and wetland areas has a positive effect on the quality of the littoral zone and lake waters. Around Lake Wytyckie the share of the latter has significantly decreased, while the share of forest areas has increased.
The creation of the reservoir resulted in a landscape with microclimatic and hydrological changes in its surroundings [47]. The local raising of the water level within the bowl of Lake Wytyckie made it necessary to drain adjacent areas. On the one hand, it was a natural trend to intensify agriculture and urbanization, on the other, it caused an increase in the length of drainage channels in these areas, and nowadays also the need to collect water in various forms of surface waters.
The vegetation of the area including the contemporary Lake Wytyckie has undergone very intensive changes for the past 50 years. Due to periodic water shortages, the surfaces are exposed, which are then inhabited by plants. A similar phenomenon was analyzed in Dutch lakes, which were subject to periodic drying, followed by intensive recolonization of the reservoir after the drought period, and then the plants withdrew, and the lakes turned into a turbid state [40]. Nowadays in Lake Wytyckie, there is a period of recession rather than reconstruction. The reasons for these changes may be an increase in the nutrient richness of the reservoir’s water and reduced visibility.
The construction of dikes in old lakes contributed to cutting them off from the catchment area [48], and the introduction of foreign river waters increased the eutrophication process and resulted in a transformation of the structure of aquatic biocenoses [43,49].
In the 1980s, the created flood embankments constituted a very clear and unambiguous spatial border, which contributed to the formation of two different landscape units: the inter-embankment and the embankment located within the natural flood plain [50,51]. Anthropogenic impact—the construction of dikes in this period contributed to the overall diversity of the inter-embankment zone by increasing the number of habitats, types of communities and the total number of species. From the 1980s, the use of the inter-embankment area, in the past inhabited by meadow, forest and wetland vegetation, successively covered the water surface, the depth of which did not exceed 1 m, with local shallows. However, these changes did not increase the diversity of plants in this area. The lack of this zone and the transformation of peat bogs through their flooding resulted in the simplification of the structure of the habitat and species diversity in Lake Wytyckie. A similar phenomenon, but on a larger scale, occurs in the Zemborzycki Reservoir, where, after flooding peat bogs with the waters of the reservoir, along with the fauna and flora inhabiting them, they degrade [52,53,54,55]. Hydration of peat bogs is a process opposite to the natural transformation of reservoirs, which along with their natural evolution through shallowing, enrich their diversity [56,57,58]. The embankment fragments of the river Vistula, with a clear distinction of the embankment and inter-embankment zones, contributed to an increase in diversity, although it was simplified, concerning the original patches and change in the vegetation [59,60,61,62]. This phenomenon can be explained by the maintenance of the original character of the habitat with similar parameters.
The created replacement habitats and the phytocenoses inhabiting them, despite the passage of decades, are unstable. The reservoir has a large share of nitrophilous vegetation and species with higher trophic requirements, and the typical swamp vegetation has disappeared. The reason is the specific nature of retention reservoirs: on the one hand, they are characterized by bottom asymmetry, shallow depths, and water level variability, on the other hand, they are supplied with fertile waters that increase their susceptibility to eutrophication [63]. All these elements are superimposed on the present state of Lake Wytyckie, and in the past, it was also the degradation of the surrounding wetlands.
The occurrence of species is closely related to the habitat conditions, and as a result, the floristic composition of plant communities is a sensitive indicator of a habitat. Indicator numbers describe the most typical habitat conditions for the species. Various forms of human activity affect the parameters of the habitat, and thus the floristic composition. Due to the ecological indicative value of the plants, changes in the habitat for decades have been identified. In the research area of Lake Wytyckie, the growing values of the indicator describing the humidity of the habitat indicate the tendency of its transformation into an area completely covered with water. The habitat reaction index gradually increased; such a change demonstrates the disappearance of acidic habitat species inhabiting bogs and an increase in the fertility of newly created habitats. This may also be confirmed by another trophy index, the values of which indicated a change from low nitrogen, through moderate nitrogen, to nitrogen-rich sites. In its current form of operation, Lake Wytyckie shows much lower values than the original lake reservoir. Lake Skomielno, which is in the group of lakes transformed into retention reservoirs, featured much greater species diversity, despite the lack of a zone between the embankment and the water surface and similar supply conditions. It is probably influenced by how the surroundings are used; in the case of Lake Skomielno it is dominated by forests [27].
However, most of the lakes initially, and then the reservoirs included in the WKC system, are, unfortunately, characterized by little floristic diversity [64].
The disappearance of rare and endangered species of Lake Wytyckie is a reflection of the progressive degradation, as well as an expression of the fact that human interference reduces species diversity, and thus the natural value. An unfavorable phenomenon is also the disappearance of natural habitats, which, in the light of the regulations currently in force, would probably be a contraindication to undertaking works that could have such a negative impact on the environment. Unfortunately, until the 1980s, no research was conducted in Poland on the negative impact of various investments on the environment. Joining the EU structure has obligated the Member States to first analyze the impact of potential investments on individual components of the environment and to make the right decisions when assessing the profit and loss balance.
Author Contributions
Conceptualization, D.U. and J.S.; theoretical discussion, J.S., M.R.-B. and A.G.; methodology, J.S. and D.U.; data analysis, J.S. and M.R.-B.; writing—original draft preparation, J.S.; writing—review and editing, M.R.-B. and A.G. All authors have read and agreed to the published version of the manuscript.
Funding
This paper was co-funded by the “Excellent Science” program of the Ministry of Science and Higher Education as a part of the contract no. DNK/SP/465641/2020: “The role of agricultural engineering and environmental engineering in sustainable agriculture development”.
Institutional Review Board Statement
Not applicable.
Informed Consent Statement
Not applicable.
Data Availability Statement
All data generated or analyzed during this study are included in this published article.
Conflicts of Interest
The authors declare no conflict of interest.
References
- Dirzo, R.; Raven, P.H. Global state of biodiversity and loss. Annu. Rev. Environ. Res. 2003, 28, 137–167. [Google Scholar] [CrossRef] [Green Version]
- Gopal, B. Biodiversity in wetlands. Wetl. Handb. 2009, 2, 65–95. [Google Scholar]
- Ramsar Convention Secretariat. Global Wetland Outlook: State of the World’s Wetlands and Their Services to People; Ramsar Convention on Wetlands: Gland, Switzerland, 2018; p. 24. [Google Scholar]
- Hassan, R.; Scholes, R.; Ash, N. Ecosystems and Human Well-Being. Current State and Trends; Island Press: Washington, DC, USA, 2005. [Google Scholar]
- Maltby, E. Functional Assessment of Wetlands: Towards Evaluation of Ecosystem Services; Elsevier: Amsterdam, The Netherlands, 2009. [Google Scholar]
- De Groot, R.S.; Wilson, M.A.; Boumans, R.M. A typology for the classification, description and valuation of ecosystem functions, goods and services. Ecol. Econom. 2002, 41, 393–408. [Google Scholar] [CrossRef] [Green Version]
- Ola, O.; Benjamin, E. Preserving biodiversity and ecosystem services in west african forest, watersheds, and wetlands: A review of incentives. Forests 2019, 10, 479. [Google Scholar] [CrossRef] [Green Version]
- Zedler, J.B.; Kercher, S. Wetland resources: Status, trends, ecosystem services and restorability. Annu. Rev. Environ. Resour. 2005, 30, 39–74. [Google Scholar] [CrossRef] [Green Version]
- Zhang, C.; Wen, L.; Wang, Y.; Liu, C.; Zhou, Y.; Lei, G. Can constructed wetlands be wildlife refuges? A review of their potential biodiversity conservation value. Sustainability 2020, 12, 1442. [Google Scholar] [CrossRef] [Green Version]
- Verhoeven, J.T.; Arheimer, B.; Yin, C.; Hefting, M.M. Regional and global concerns over wetlands and water quality. Trends Ecol. Evol. 2006, 21, 96–103. [Google Scholar] [CrossRef] [PubMed]
- Gibbs, J.P. Wetland loss and biodiversity conservation. Conserv. Biol. 2000, 14, 314–317. [Google Scholar] [CrossRef] [Green Version]
- Millennium Ecosystem Assessment. Ecosystems and Human Well-Being: Wetlands and Water Synthesis; World Resources Institute: Washington, DC, USA, 2005. [Google Scholar]
- Verhoeven, J.T.A.; Setter, T.L. Agricultural use of wetlands: Opportunities and limitations. Ann. Bot. 2010, 105, 155–163. [Google Scholar] [CrossRef] [Green Version]
- Xu, T.; Weng, B.; Yan, D.; Wang, K.; Li, X.; Bi, W.; Liu, Y. Wetlands of international importance: Status, threats, and future protection. Int. J. Environ. Res. Public Health 2019, 16, 1818. [Google Scholar] [CrossRef] [PubMed] [Green Version]
- Michalczyk, Z. Położenie polesia lubelskiego. In Polesie—Środowisko, Melioracje, Polesie Polskie; Urban, D., Dobrowolski, R., Jeznach, J., Eds.; SGGW: Warsaw, Poland, 2020; Volume 3, pp. 79–84. [Google Scholar]
- Wilgat, T.; Michalczyk, Z.; Turczynski, M.; Wojciechowski, K.H. Jeziora łęczyńsko-włodawskie. Studia Ośrodka Dok. Fizjogr. 1991, 19, 100. [Google Scholar]
- Kondracki, J. Geografia Regionalna Polski; Wydawnictwo PWN: Warsaw, Poland, 2002; p. 440. [Google Scholar]
- Borowiec, J. Torfowiska Regionu lubelskiego; PWN: Warsaw, Poland, 1990; p. 348. [Google Scholar]
- Michalczyk, Z.; Chmiel, S.; Głowacki, S.; Mięsiak-Wójcik, K.; Raczyński, K.; Sposób, J.; Turczyński, M. Charakterystyka wód. In Polesie—Środowisko, Melioracje, Polesie Polskie; Urban, D., Dobrowolski, R., Jeznach, J., Eds.; SGGW: Warsaw, Poland, 2020; Volume 3, pp. 162–237. [Google Scholar]
- Łoś, M.J. Systemy melioracyjne. In Polesie—Środowisko, Melioracje, Polesie Polskie; Urban, D., Dobrowolski, R., Jeznach, J., Eds.; SGGW: Warsaw, Poland, 2020; Volume 3, pp. 892–908. [Google Scholar]
- Fijałkowski, D. The vegetation cover of lakes in the Łęczna and Włodawa area and of peat bogs adjacent to these lakes. Ann. UMCS 1959, 14, 131–206. [Google Scholar]
- Fijałkowski, D. Charakterystyka geobotaniczna kompleksu wodno-torfowiskowego koło Wytyczna w województwie lubelskim. Folia Soc. Sci. Lub. 1971, 11, 3–10. [Google Scholar]
- Braun-Blanquet, J. Pflanzensoziologie: Grundzüge der Vegetationskunde; Springer: Vienna, Austria, 2013. [Google Scholar]
- Matuszkiewicz, W. Guide to the Identification of Plant Communities in Poland; PWN: Warsaw, Poland, 2008. (In Polish) [Google Scholar]
- Mirek, Z.; Piękosz-Mirkowa, H.; Zając, A.; Zając, M. Flowering Plants and Pteridophytes of Poland. A Checklist; Szafer Institute of Botany, Polish Academy of Sciences: Kraków, Poland, 2002. [Google Scholar]
- Ochyra, R.; Zarnowiec, J.; Bednarek-Ochyra, H. Census Catalogue of Polish Mosses; Polish Academy of Sciences, Institute of Botany: Kraków, Poland, 2003. [Google Scholar]
- Sender, J. Aquatic and rush macroflora. In Lake Skomielno (Łęczna-Włodawa Lake-Land, Eastern Poland), Environmental Monograph; Kornijów, R., Buczyński, P., Eds.; Mantis: Olsztyn, Poland, 2012; pp. 83–120. [Google Scholar]
- Ellenberg, H.; Weber, H.E.; Düll, R.; Wirth, V.; Werner, W.; Paulissen, D. Zeigerwerte von pflanzen in mitteleuropa. Scripta Geobot. 1991, 28, 248. [Google Scholar]
- Shannon, C.E.; Weaver, W. The Mathematical Theory of Communication; University of Illinois Press: Urbana, IL, USA, 1949. [Google Scholar]
- Margalef, R. Information theory in ecology. Gen. Syst. 1958, 3, 36–71. [Google Scholar]
- Simpson, E. Measurement of diversity. Nature 1949, 163, 688. [Google Scholar] [CrossRef]
- Appeltans, W.; Ahyong, S.T.; Anderson, G.; Angel, M.V.; Artois, T.; Bailly, N.; Costello, M.J. The magnitude of global marine species diversity. Curr. Biol. 2012, 22, 2189–2202. [Google Scholar] [CrossRef] [PubMed] [Green Version]
- Ladle, R.J. Forecasting extinctions: Uncertainties and limitations. Diversity 2009, 1, 133–150. [Google Scholar] [CrossRef] [Green Version]
- Blindow, I.; Andersson, G.; Hargeby, A.; Johansson, S. Long-term pattern of alternative stable states in two shallow eutrophic lakes. Freshw. Biol. 1993, 30, 159–167. [Google Scholar] [CrossRef]
- López Moreira, M.G.A.; Hinegk, L.; Salvadore, A.; Zolezzi, G.; Hölker, F.; Monte Domecq, S.R.A.; Toffolon, M. Eutrophication, research and management history of the shallow Ypacaraí Lake (Paraguay). Sustainability 2018, 10, 2426. [Google Scholar] [CrossRef] [Green Version]
- Hellsten, S.; Marttunen, M.; Palomäki, R.; Riihimäki, J.; Alasaarela, E. Towards an ecologically based regulation practice in Finnish hydroelectric lakes. Regul. Rivers Res. Manag. 1996, 12, 535–545. [Google Scholar] [CrossRef]
- Soszka, H.; Pasztaleniec, A.; Koprowska, K.; Kolada, A.; Ochocka, A. Influence of hydromorphological transformations of lakes on pools of aquatic organisms—A review of the literature. Ochr. Sr. Zasobów Nat. 2012, 50, 24–52. (In Polish) [Google Scholar]
- Kutyła, S. Characteristics of water level fluctuations in Polish lakes–A review of the literature. Ochr. Sr. Zasobów Nat. 2014, 25, 27–34. [Google Scholar]
- Maihemuti, B.; Aishan, T.; Simayi, Z.; Alifujiang, Y.; Yang, S. Temporal scaling of water level fluctuations in shallow lakes and its impacts on the lake eco-environments. Sustainability 2020, 12, 3541. [Google Scholar] [CrossRef]
- Van Geest, G.J.; Coops, H.; Scheffer, M.; Van Nes, E.H. Long transients near the ghost of a stable state in eutrophic shallow lakes with fluctuating water levels. Ecosystems 2007, 10, 37–47. [Google Scholar] [CrossRef] [Green Version]
- Hellsten, S. Environmental Factors and Aquatic Macrophytes in the Littoral of Regulated Lakes: Causes, Consequences and Possibilities to Alleviate Harmful Effects; Oulun Yliopisto: Oulun, Finland, 2000. [Google Scholar]
- Rodrigo, M.A. Wetland restoration with hydrophytes: A review. Plants 2021, 10, 1035. [Google Scholar] [CrossRef] [PubMed]
- Rørslett, B. Principal determinants of aquatic macrophyte richness in northern European lakes. Aquat. Bot. 1991, 39, 173–193. [Google Scholar] [CrossRef]
- Hellsten, S.; Mjelde, M. Macrophyte responses to water level fluctuation in Fennoscandinavian lakes—Applying a common index. Int. Ver. Theor. Angew. Limnol. Verh. 2009, 30, 765–769. [Google Scholar] [CrossRef]
- Yang, Z.D.; Yuan, S.B.; Liu, X.Q.; Wang, H.Z. Water level fluctuation requirements of emergent macrophyte Typha angustifolia L. Water 2020, 12, 127. [Google Scholar] [CrossRef] [Green Version]
- Jennings, M.J.; Emmons, E.E.; Hatzenbeler, G.R.; Edwards, C.; Bozek, M.A. Is littoral habitat affected by residential development and land use in watersheds of Wisconsin lakes? Lake Reserv. Manag. 2003, 19, 272–279. [Google Scholar] [CrossRef]
- Soja, R. The influence of reservoirs on the inanimate nature of the Pieniny Mountains. Pieniny–Dam–Changes. Monogr. Pienińskie 2010, 2, 37–41. (In Polish) [Google Scholar]
- Wojciechowski, K.H. Connection of lake waters with surface and ground waters. Studia Ośrodka Dok. Fizjogr. 1991, 19, 95–101. (In Polish) [Google Scholar]
- Radwan, S.; Kornijów, R. Hydrobiological and Hydrochemical Characteristics of Surface Waters. Natural Environment in the Impact Zone of the Wieprz-Krzna Canal; AR Lublin, TWWP: Lublin, Poland, 1994; pp. 47–58. (In Polish) [Google Scholar]
- Borysiak, J. The Structure of Alluvial Land Vegetation of the Middle and Lower Warta River; UAM Poznań, sect Biologia; Wydawnictwo Naukowe Uniwersytetu im. Adama Mickiewicza: Poznan, Poland, 1994; p. 52. [Google Scholar]
- Matuszkiewicz, J.M.; Roo-Zielińska, E. Inter-Embankment of the Vistula as a Specific Natural System: (Section Pilica-Narew); Dokumentacja Geograficzna: Warsaw, Poland, 2000. [Google Scholar]
- Rodzik, J.; Dobrowolski, R.; Melke, J. Estimation of kind, amount and mechanism of sedimentation in the Zemborzyce reservoir near Lublin. Teka. Kom. Ochr. Środ. Przyr. 2009, 6, 261–276. [Google Scholar]
- Sender, J.; Jaruga, C. Water eutrophication of dam reservoirs and the role of macrophytes in this process. Inżynieria Ekol. 2017, 18, 3. [Google Scholar]
- Serafin, A.; Sender, J.; Bronowicka-Mielniczuk, U. Potential of shrubs, shore vegetation and macrophytes of a lake to function as a phytogeochemical barrier against biogenic substances of various origin. Water 2019, 11, 290. [Google Scholar] [CrossRef] [Green Version]
- Sender, J.; Kułak, A. Phytocenotic structure and physico-chemical properties of a small water body in agricultural landscape. Acta Agrobot. 2014, 67, 31–39. [Google Scholar] [CrossRef] [Green Version]
- Dembek, W. Problems of protection and restitution of wetlands in Poland. Inżynieria Ekol. 2002, 6, 68–85. [Google Scholar]
- Barabach, J.; Milecka, K. Anthropogenic Transformations of Rzęcin Mire Observed in Aerial Photos; Archiwum Fotogrametrii, Kartografii i Teledetekcji: Warsaw, Poland, 2013. [Google Scholar]
- Semeraro, T.; Giannuzzi, C.; Beccarisi, L.; Aretano, R.; De Marco, A.; Pasimeni, M.R.; Zurlini, G.; Petrosillo, I. A constructed treatment wetland as an opportunity to enhance biodiversity and ecosystem services. Ecol. Eng. 2015, 82, 517–526. [Google Scholar] [CrossRef]
- Solon, J. Anthropogenic disturbance and vegetation diversity in agricultural landscapes. Landsc. Urban Plan. 1995, 31, 171–180. [Google Scholar] [CrossRef]
- Wang, M.; Zhang, D.; Dong, J.; Tan, S.K. Application of constructed wetlands for treating agricultural runoff and agro-industrial wastewater: A review. Hydrobiologia 2018, 805, 1–31. [Google Scholar] [CrossRef]
- Gacka-Grzesikiewicz, E. Ecological Corridor of the Vistula Valley; Fundacja IUCN Poland: Warsaw, Poland, 1995. [Google Scholar]
- Kowalska, A. Influence of Embankments on the Diversity of Vegetation of the Floodplain in the Middle Vistula Valley, Mazowiecka Lowland; Prace Komisji Krajobrazu Kulturowego: Sosnowiec, Poland, 2010. [Google Scholar]
- Solis, M. The influence of the Wieprz-Krzna Canal on the physical, chemical and biological properties of water in selected retention reservoirs. Inżynieria Ekol. 2012, 29, 182–191. [Google Scholar]
- Sender, J. Impact of the drainage system on water vegetation of the lowland lakes (Eastern Poland). Turk. J. Fish. Aquat. Sci. 2018, 18, 611–622. [Google Scholar] [CrossRef]
Figure 1.
Development of area around Lake Wytyckie in the year: (a) 1950, (b) 1979, (c) 1990, (d) 2019.
Figure 1.
Development of area around Lake Wytyckie in the year: (a) 1950, (b) 1979, (c) 1990, (d) 2019.
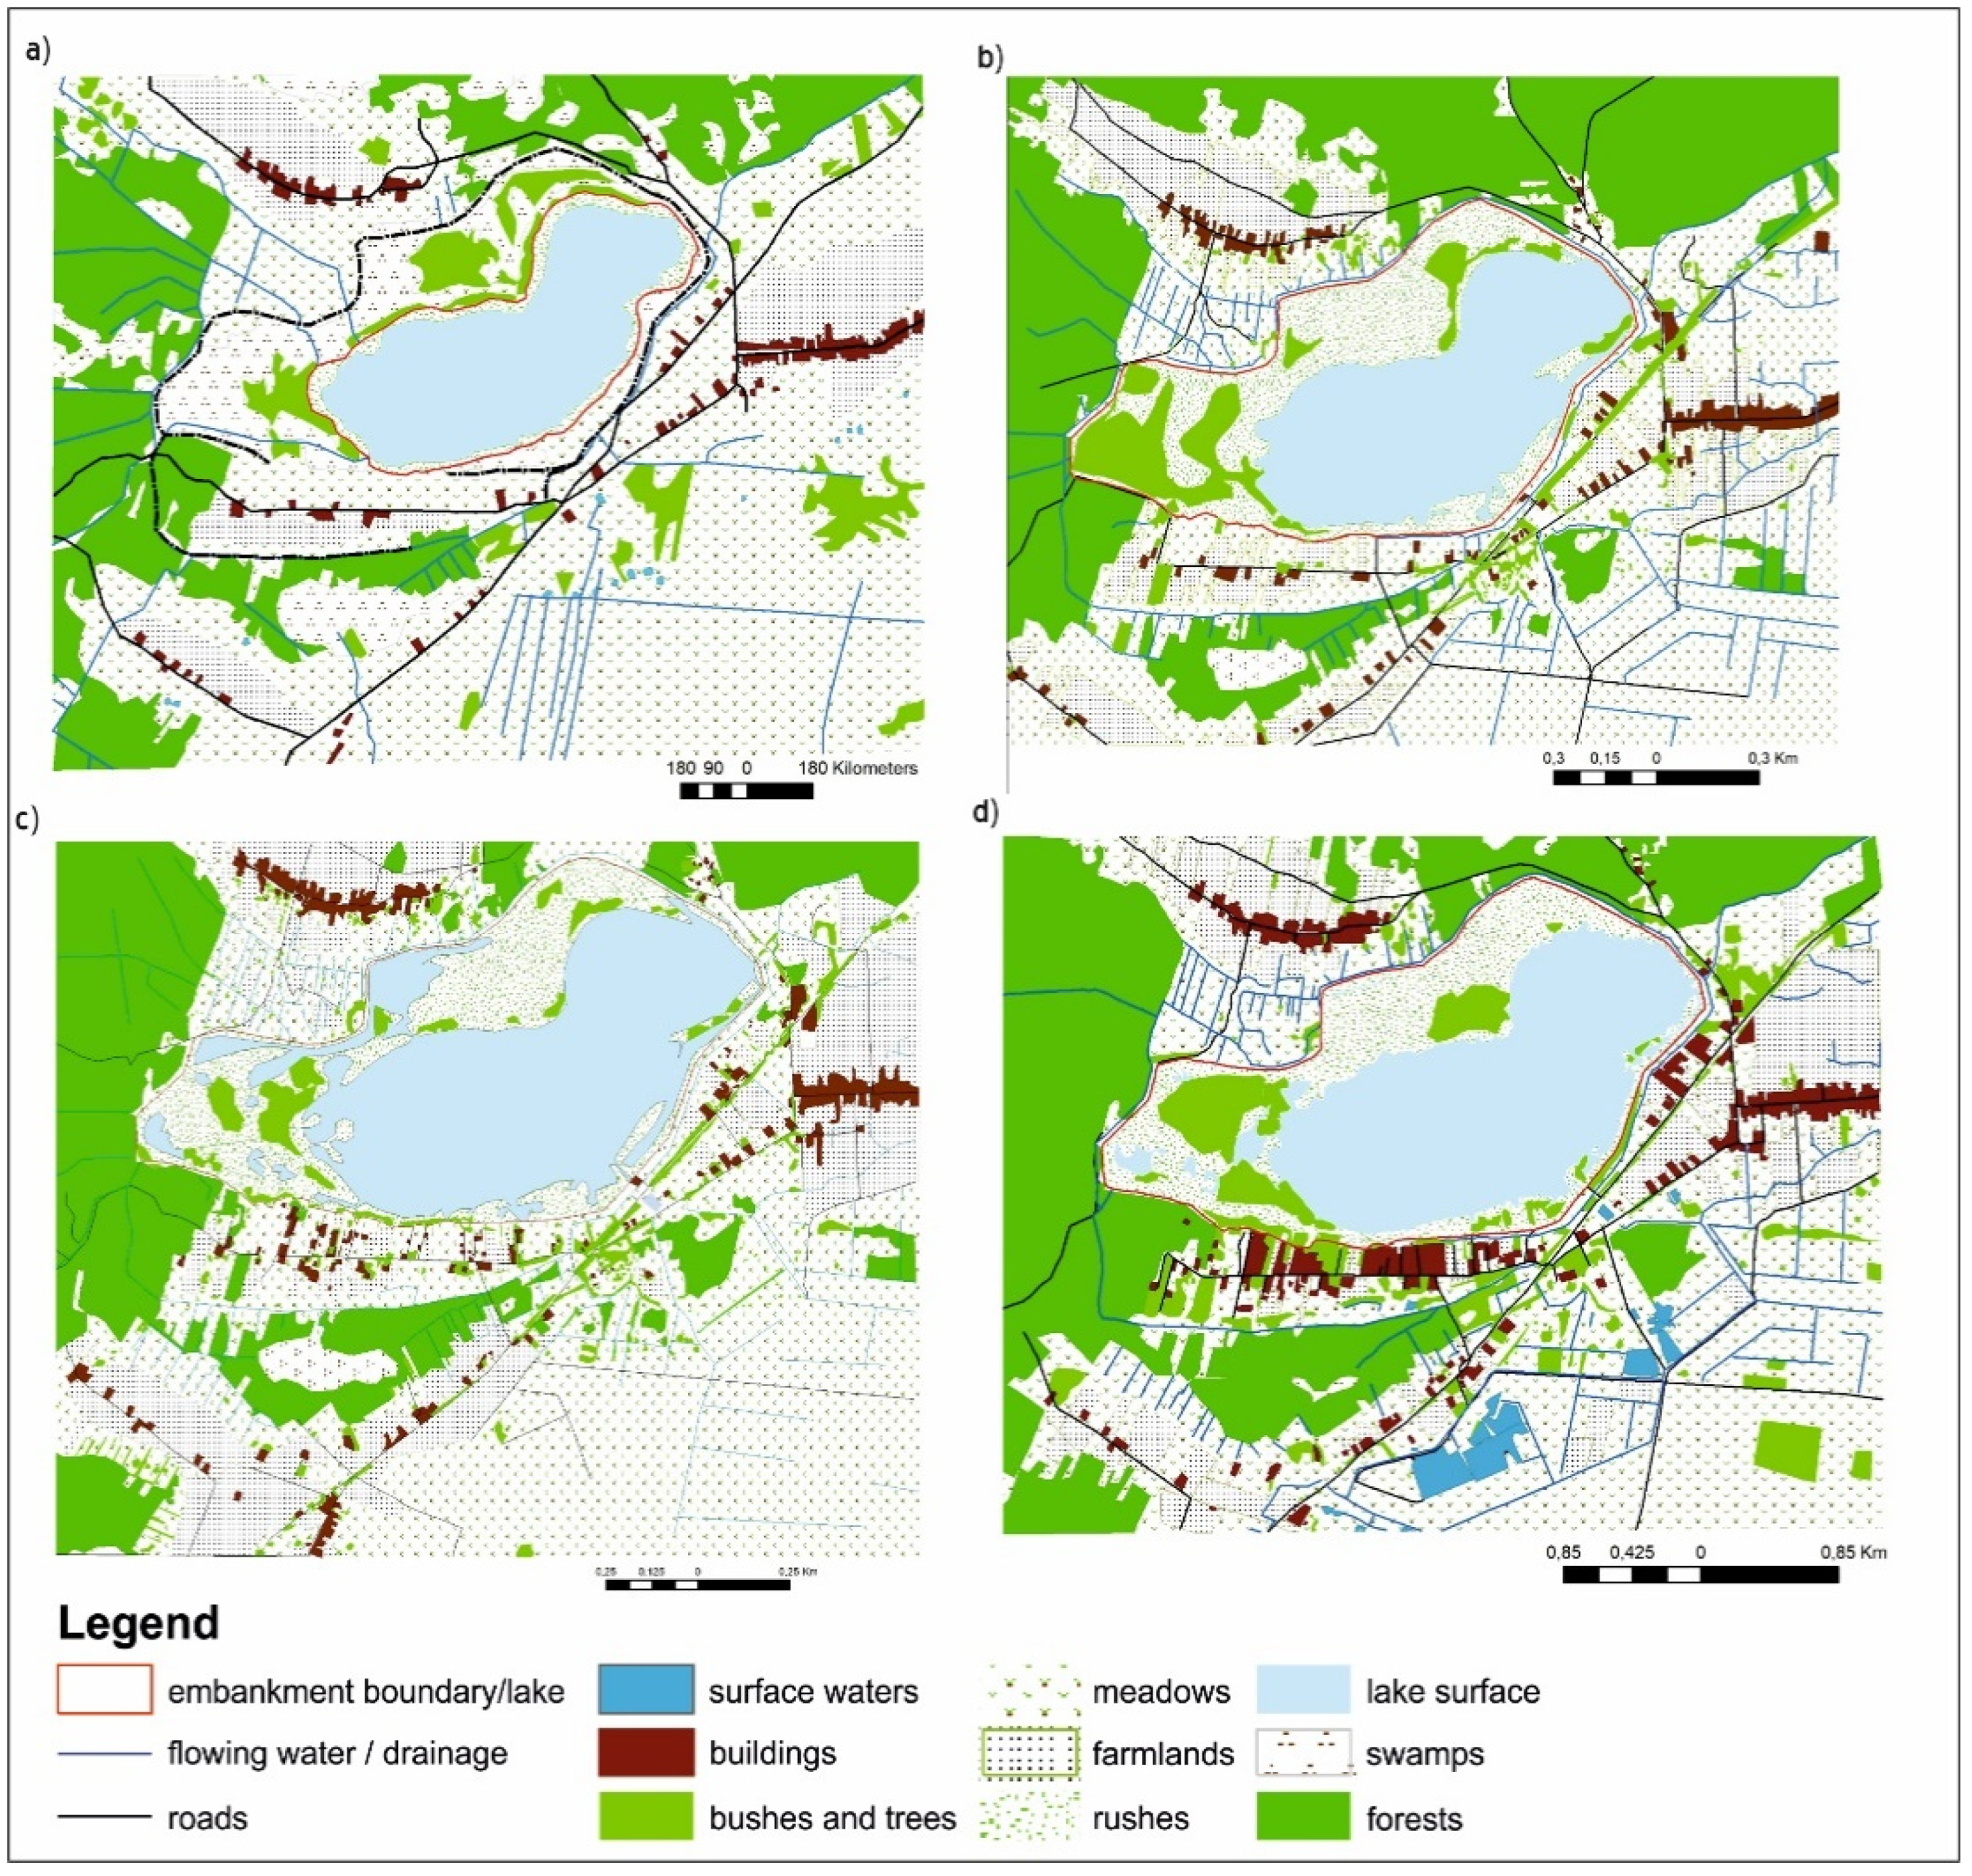
Figure 2.
Share (%) of each land use forms around Lake Wytyckie.
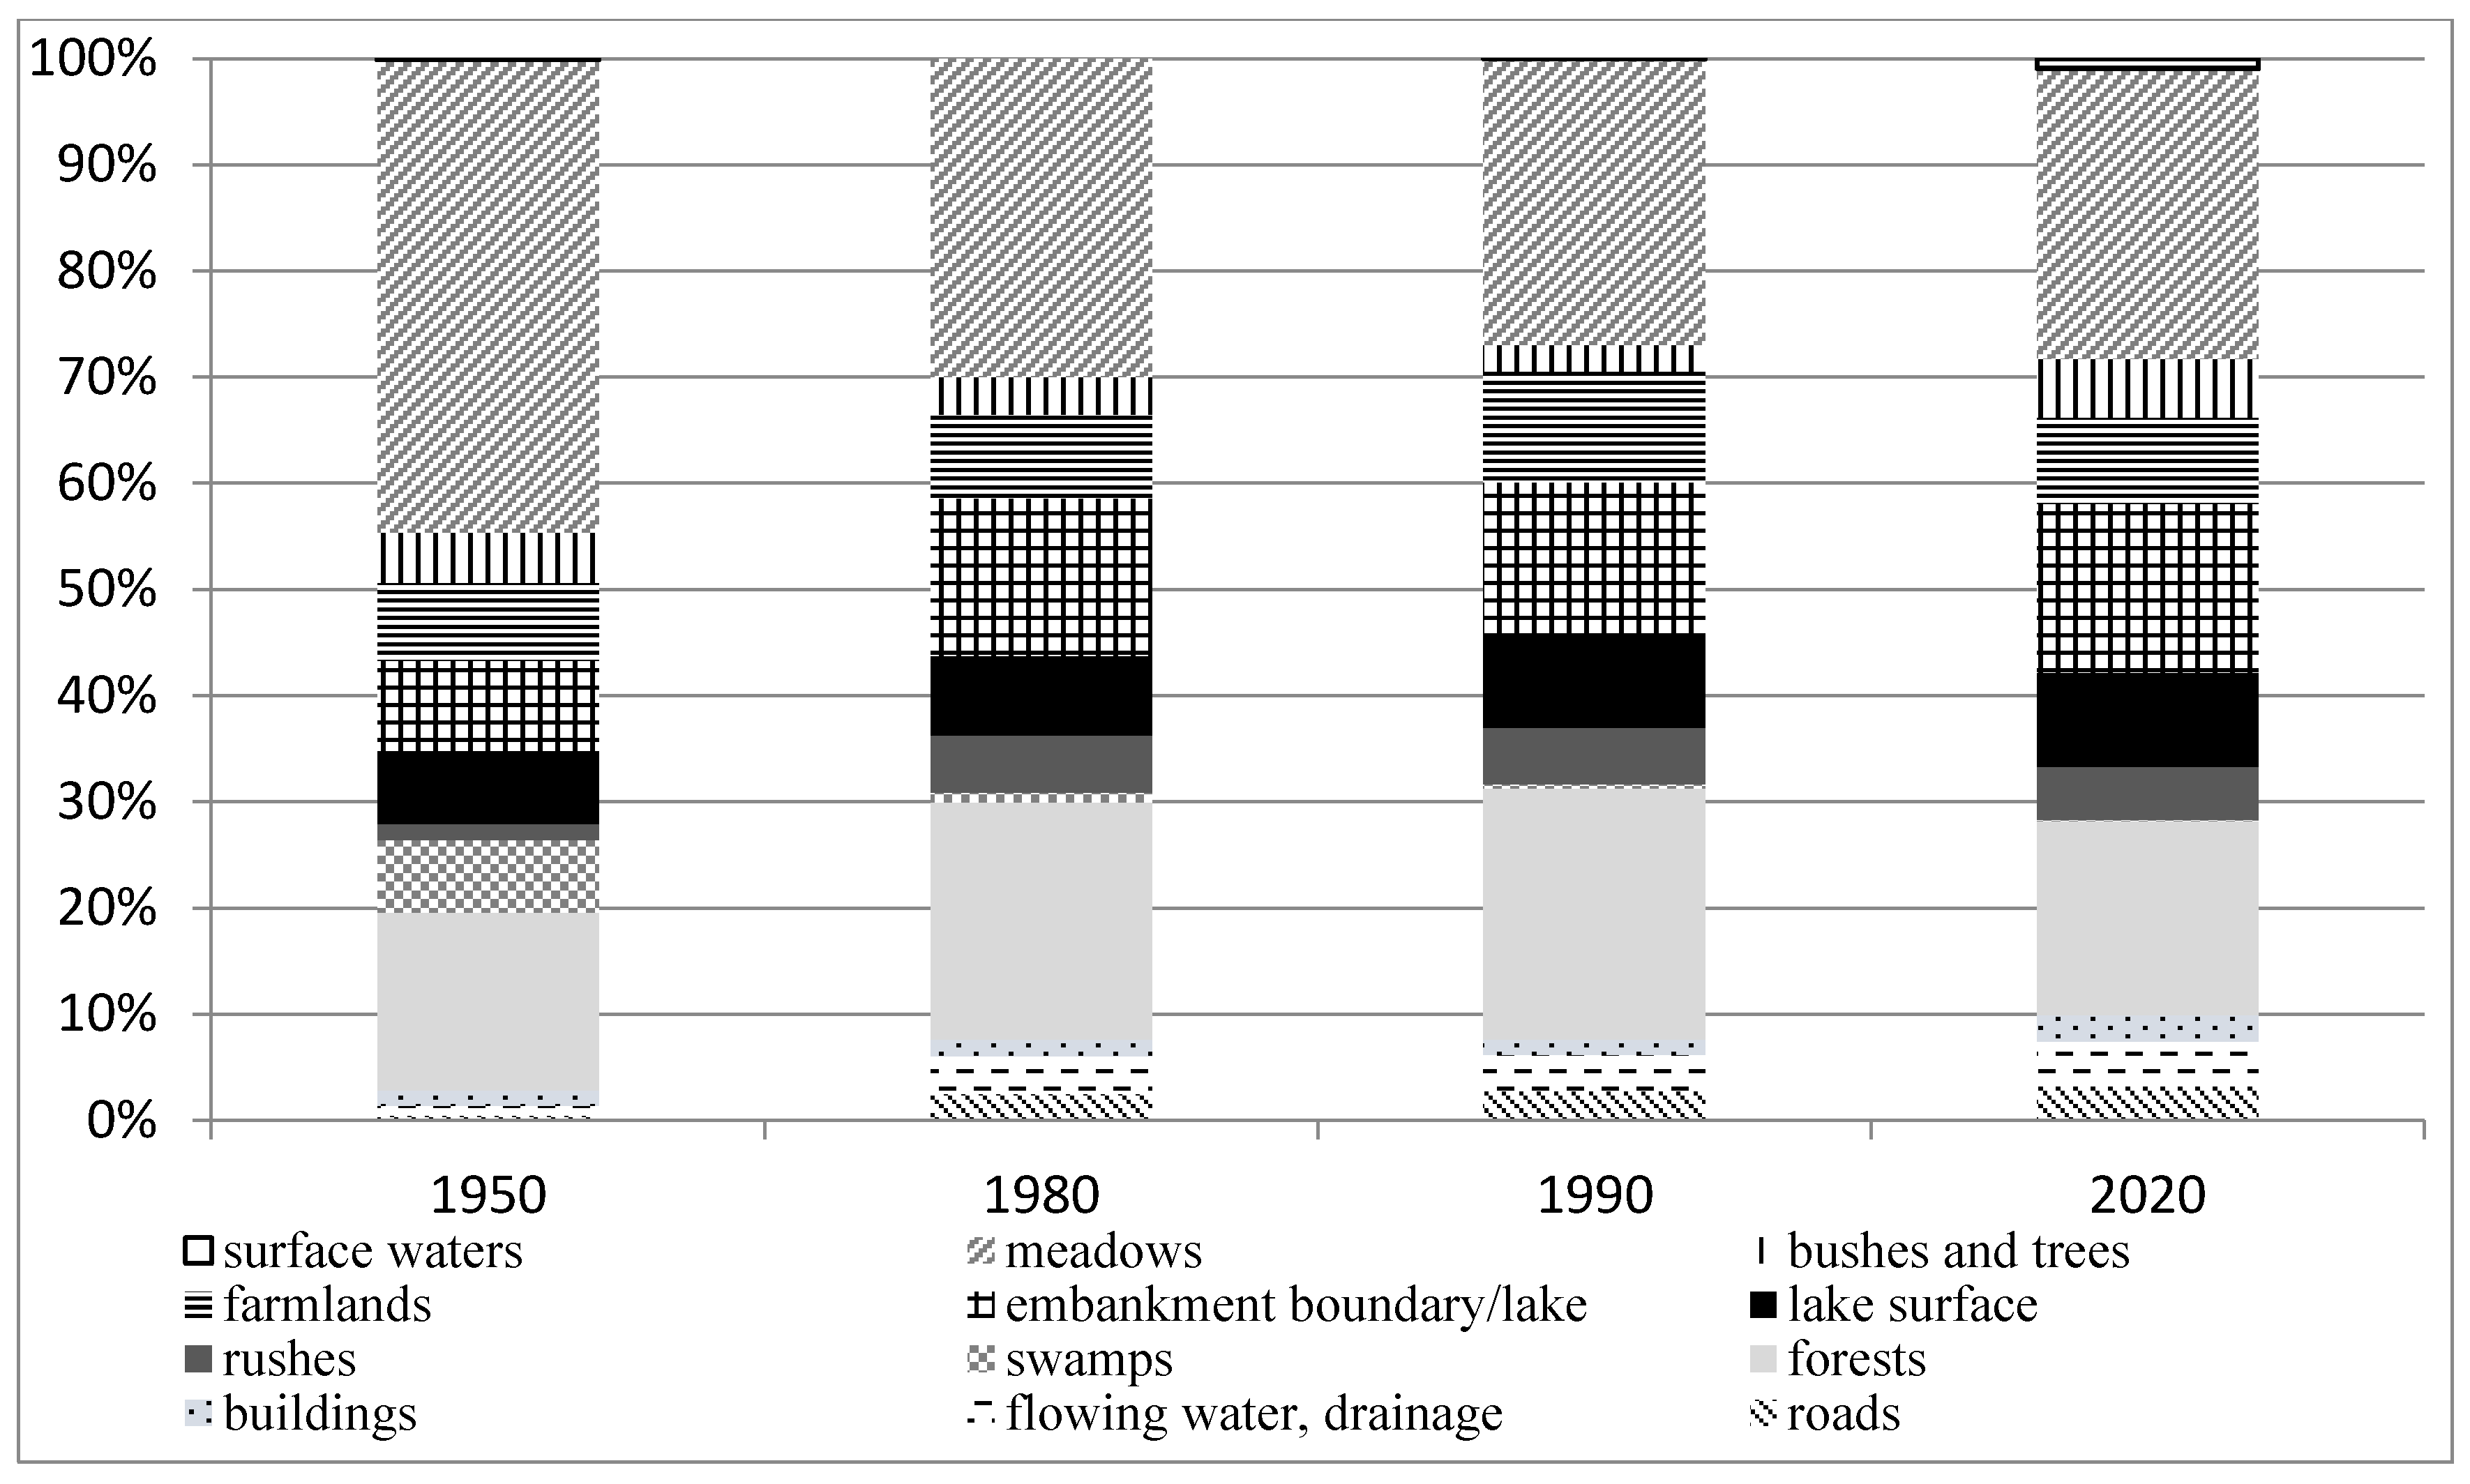
Figure 3.
Location of the transect and catena of plant communities in the transect of Lake Wytyckie in the years (a) 1959, (b) 1980, (c) 2020; number designations: 1—Alnetea glutinosae, 2—Molinio-Arrhenatheretea, 3—Oxycocco-Sphagnetea, 4—Scheuchzerio-Caricetea nigrae, 5—Phragmitetea, 6—Utricularietea intermedio-minoris, 7—Lemnetea minoris, 8—Potametea, 9—Charetea, 10—Artemisietea vulgaris, 11—Bidentea tripartiti, 12—Agropyretea intermediae-repen, 13—Epilobietea angustifolii, 14—Rhmano-Prunetea, 15—Salicitea purpureae.

Figure 4.
Distribution of Margalef index (DMg) for communities. Significant differences between the periods were verified with the Friedman test at the significance level 0.05.
Figure 4.
Distribution of Margalef index (DMg) for communities. Significant differences between the periods were verified with the Friedman test at the significance level 0.05.
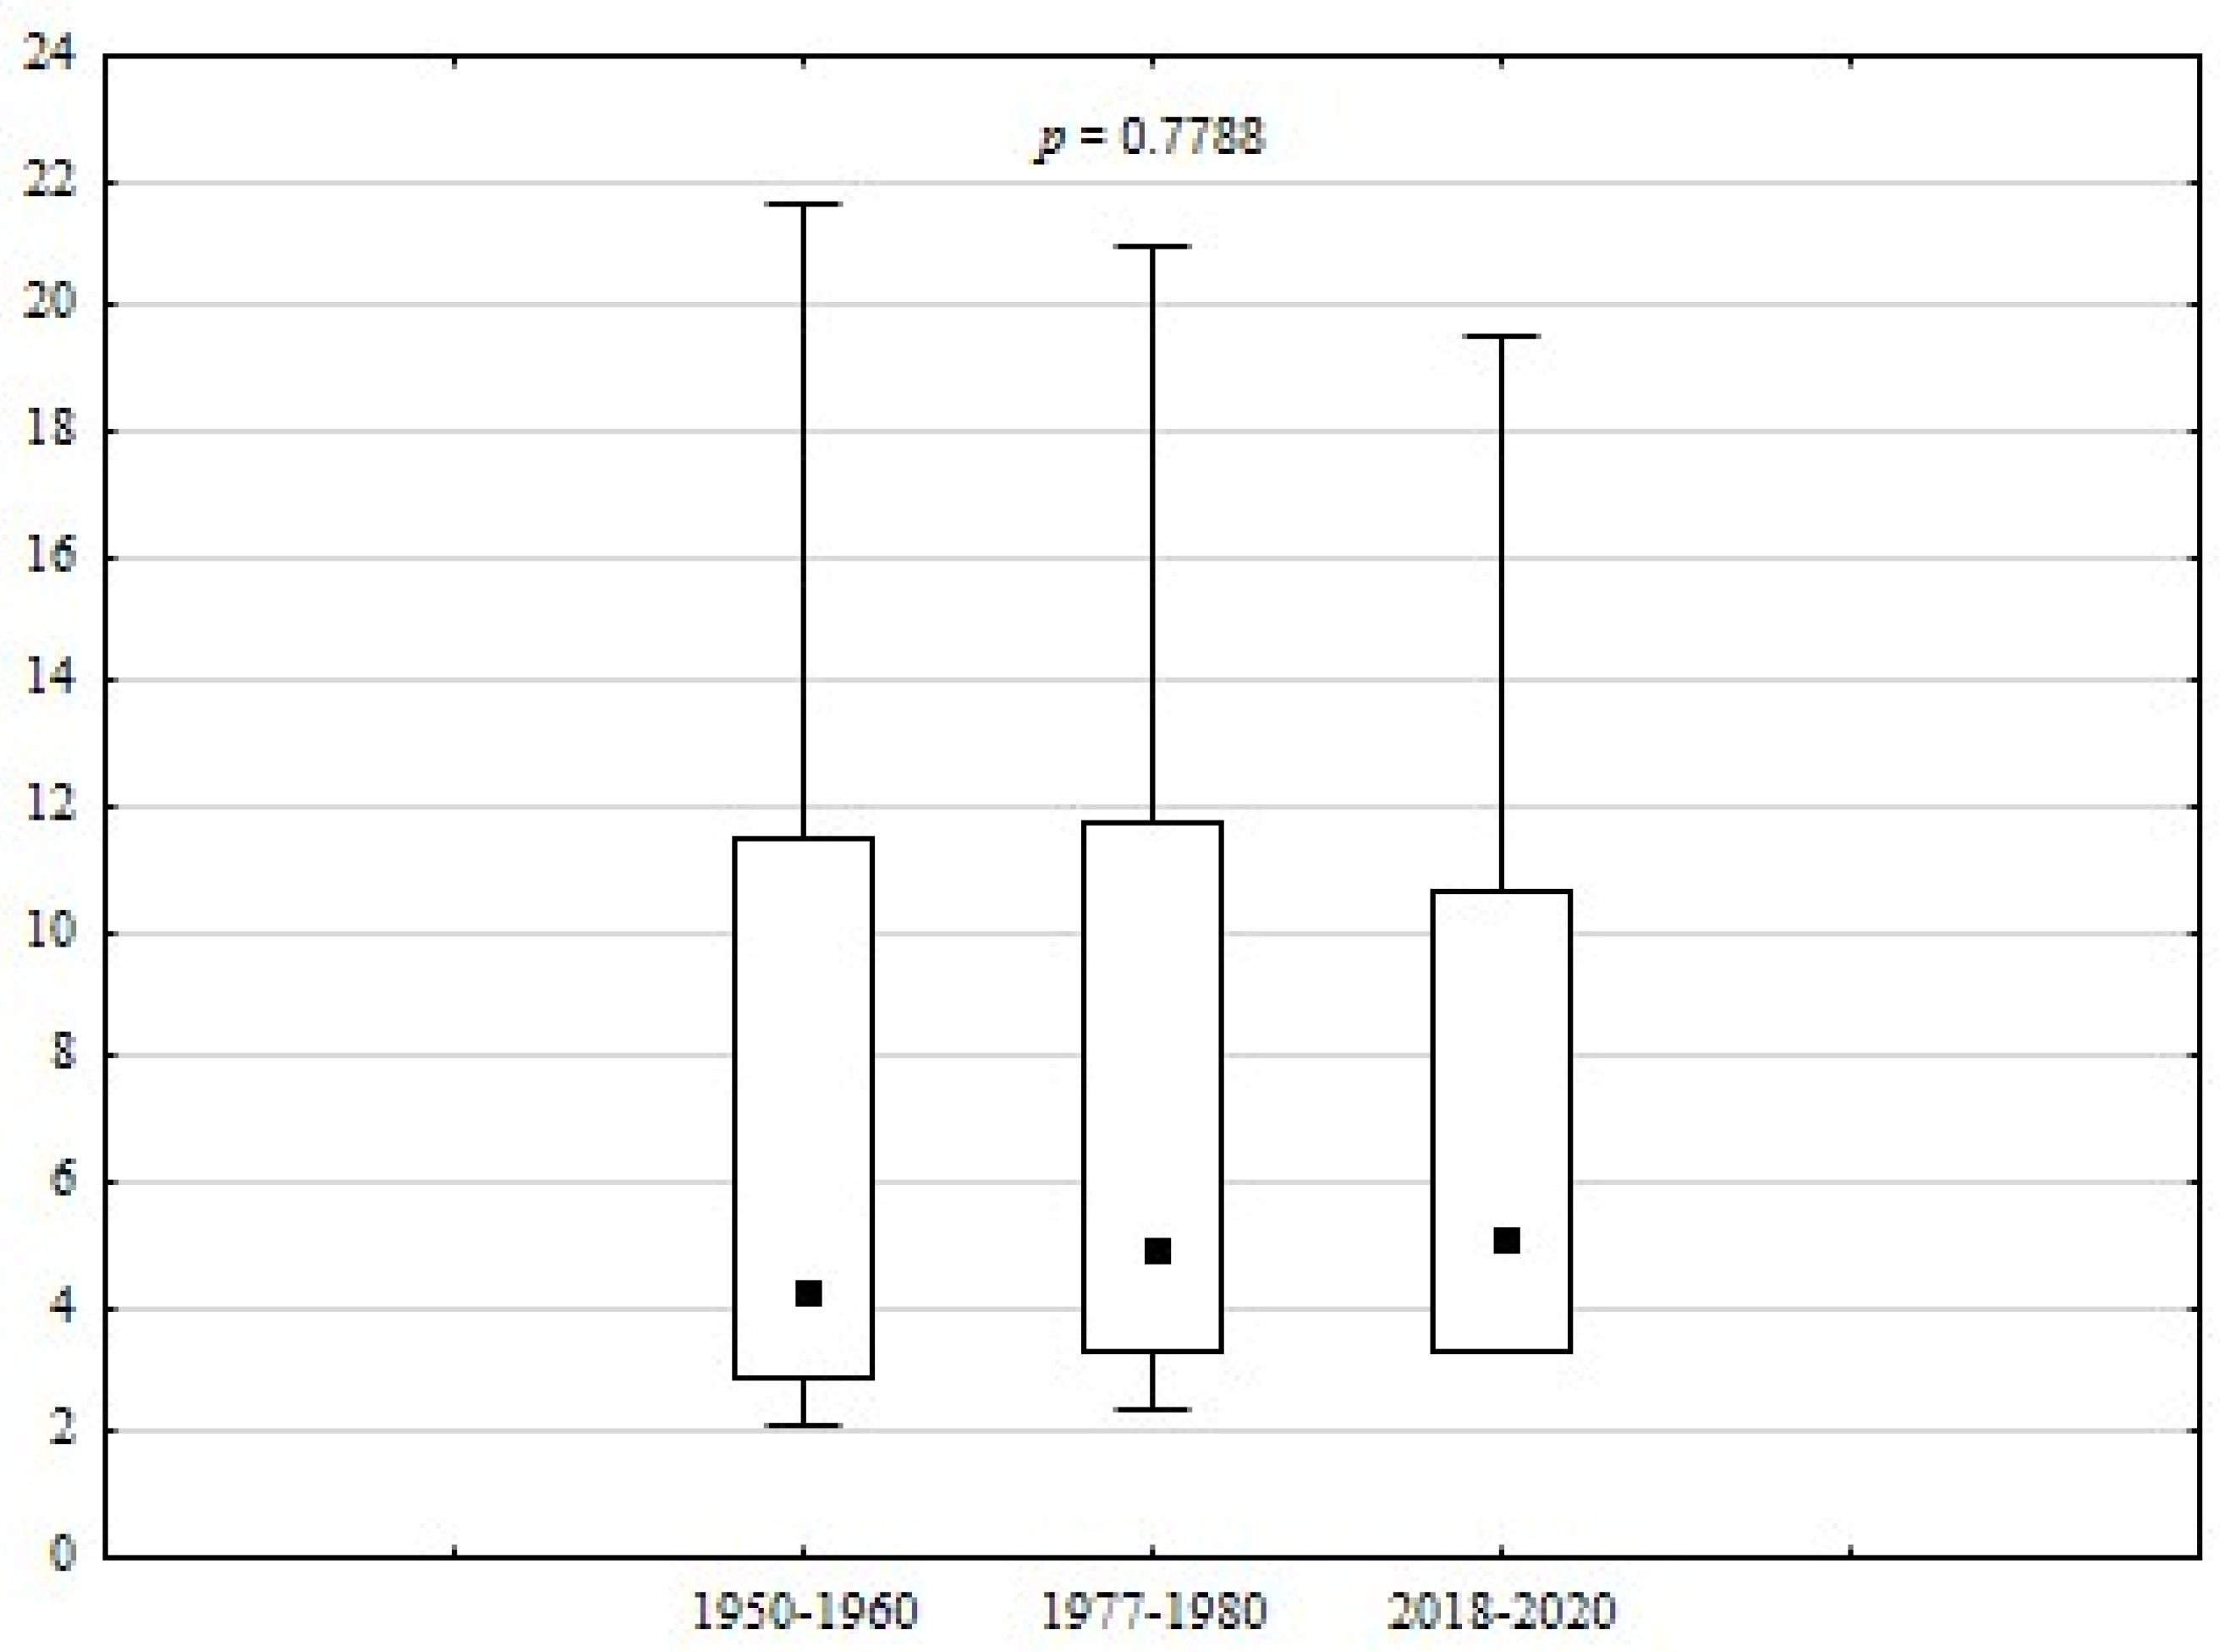
Figure 5.
Distribution of Shannon–Wiener index (HS) for communities.
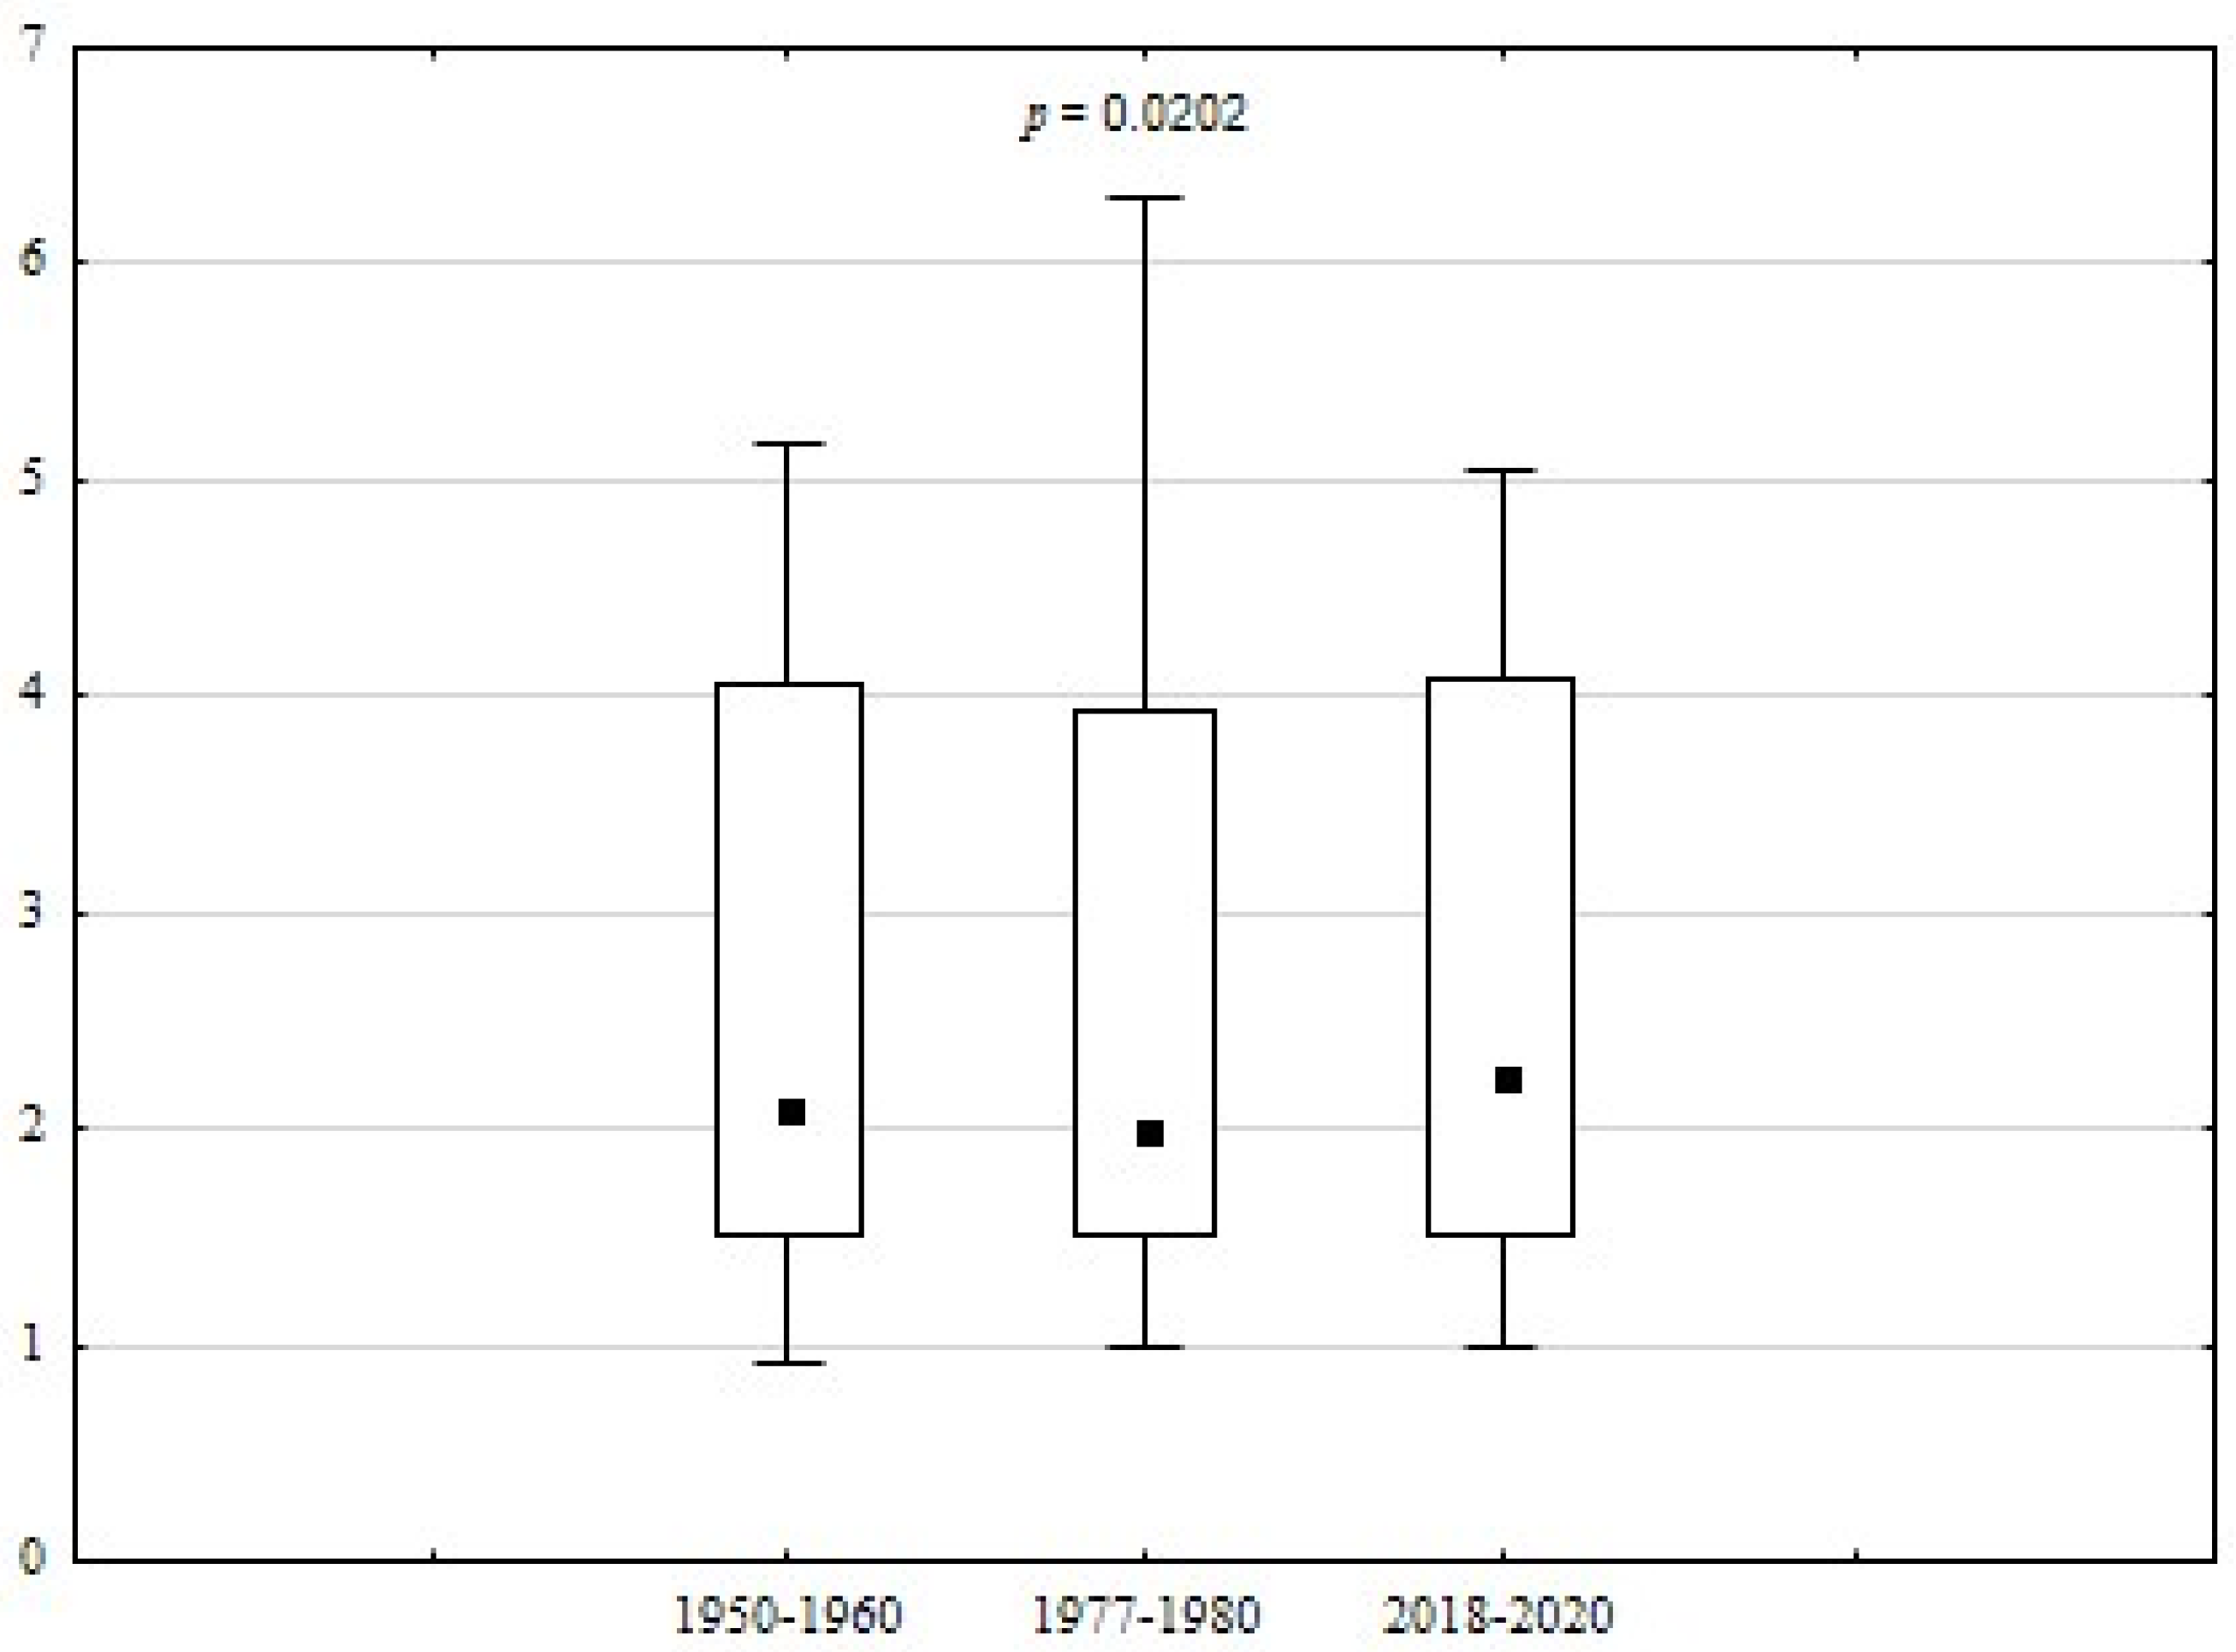
Figure 6.
Distribution of Simpson index (S) for communities.
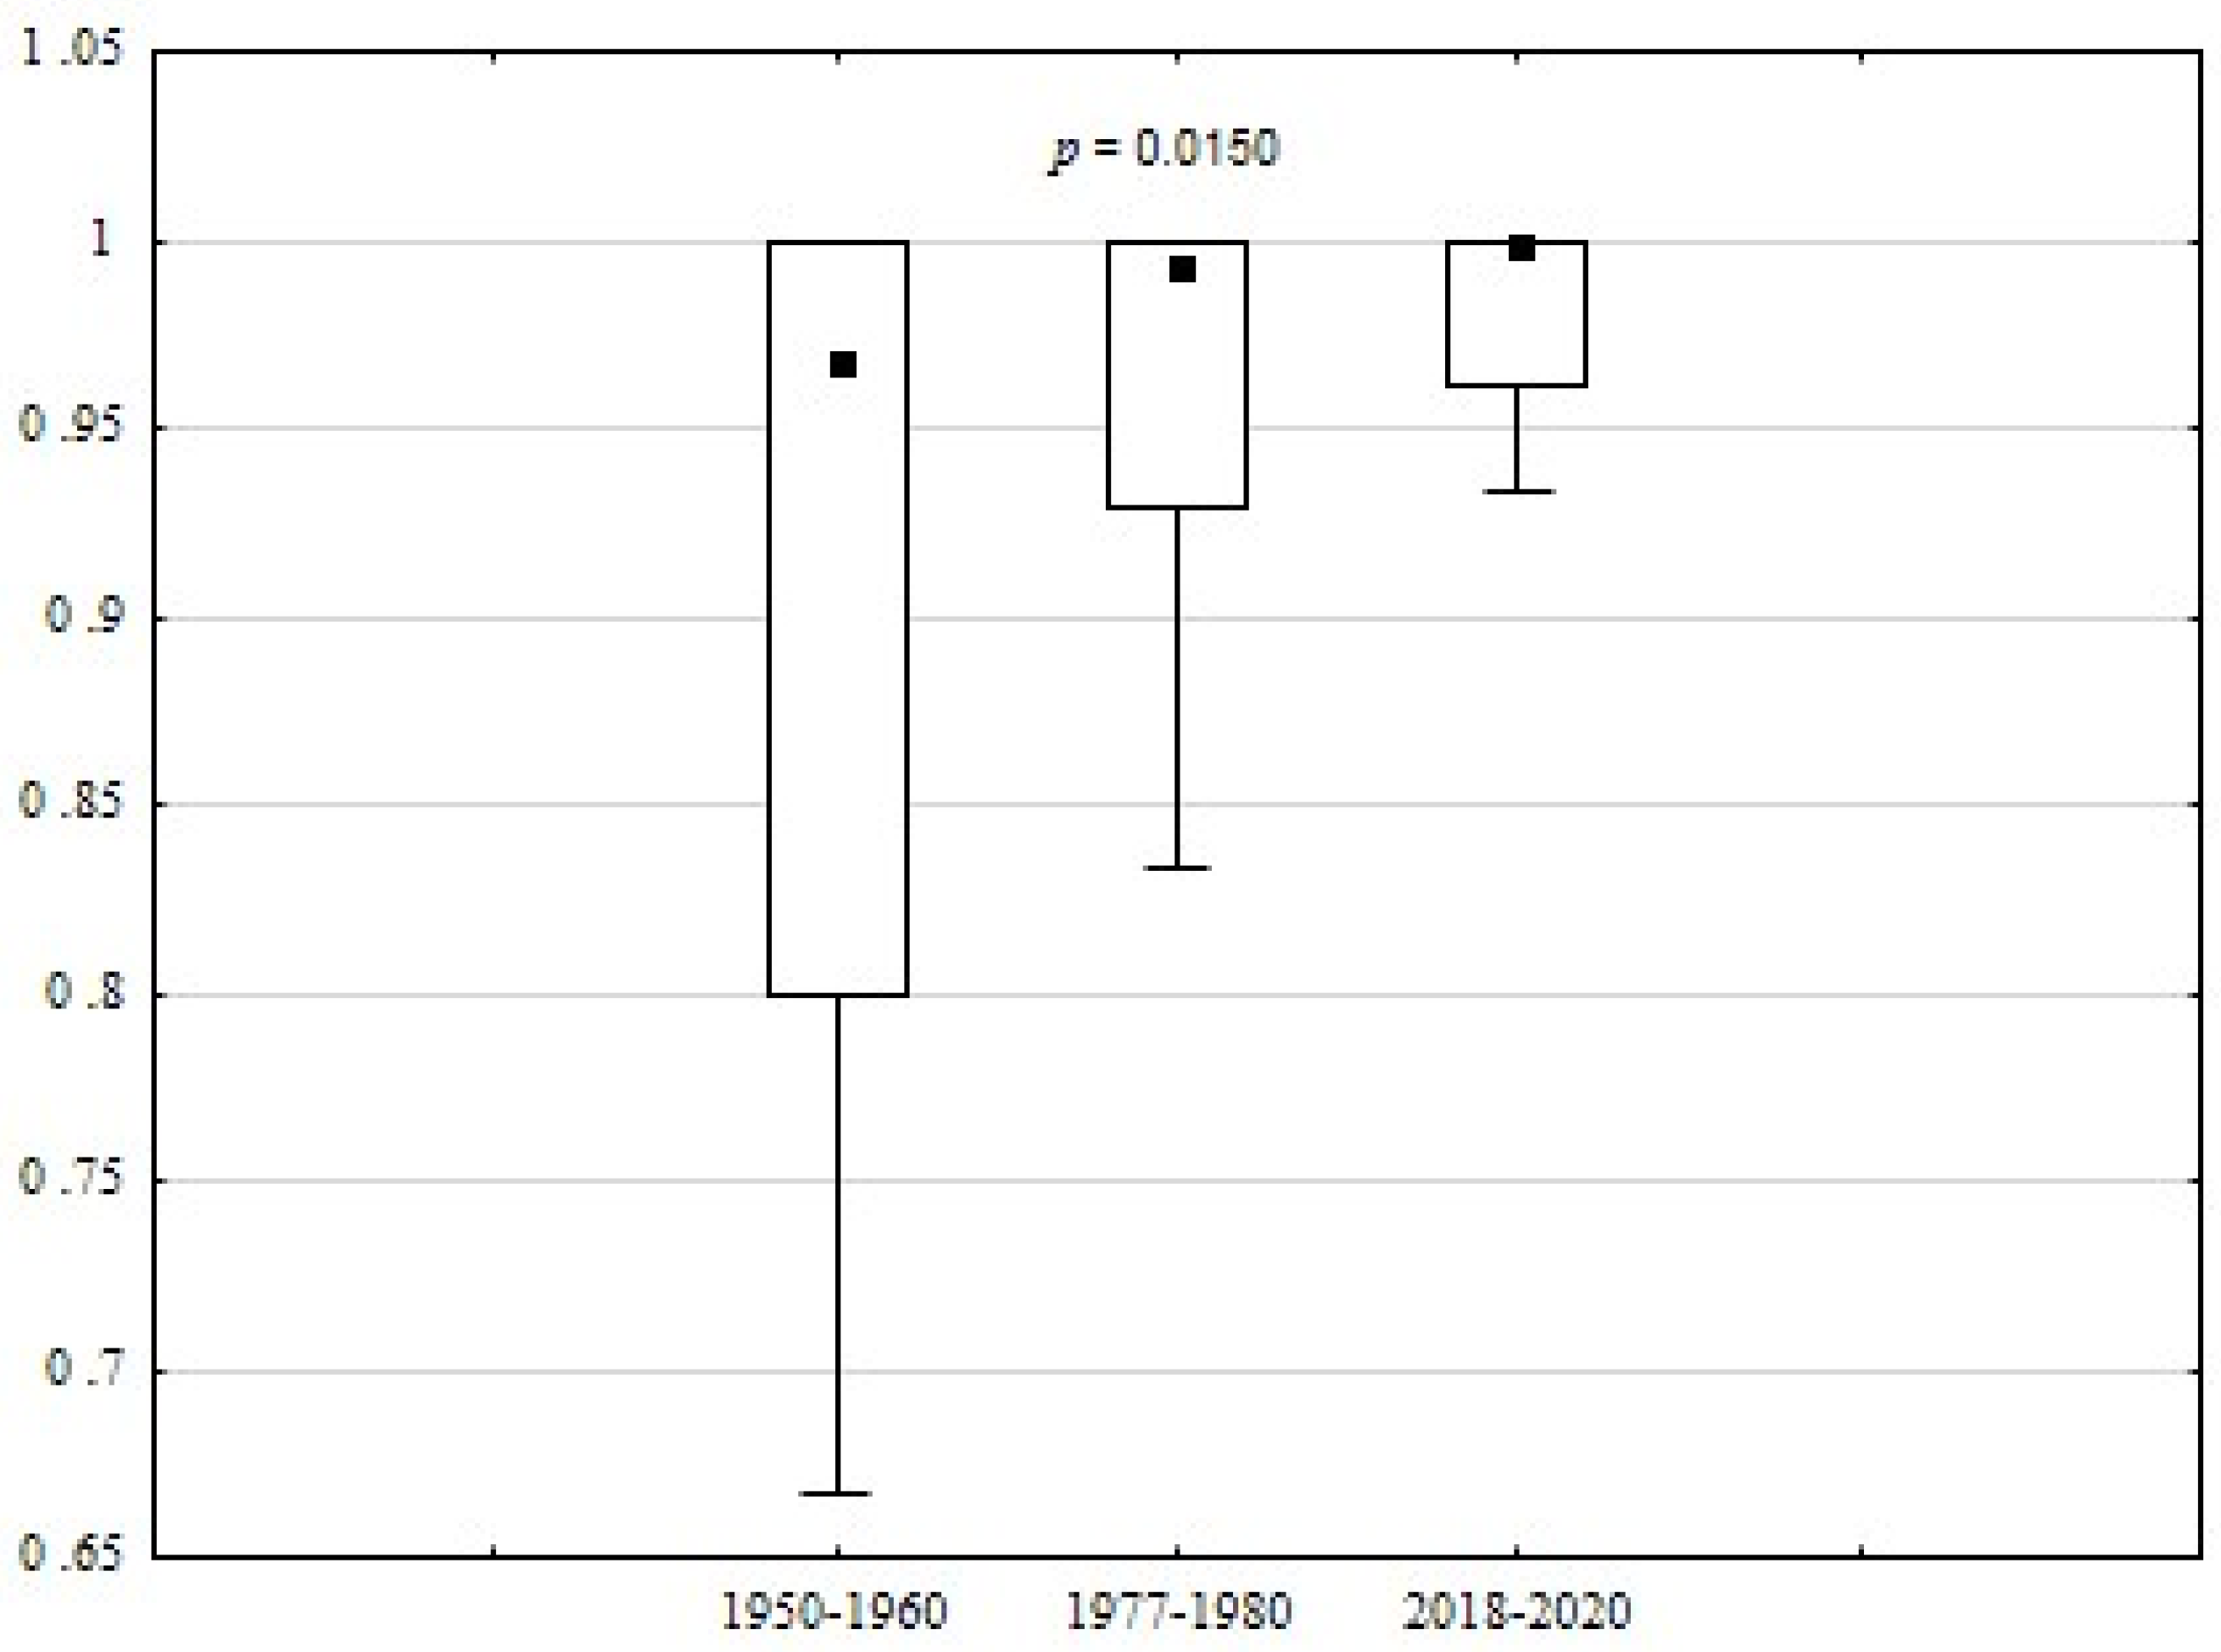
Figure 7.
Average values of the analyzed indicators. Standardized data (L—light, K—continentalism, N—trophy, F—moisture, R—reaction. T—temperature).
Figure 7.
Average values of the analyzed indicators. Standardized data (L—light, K—continentalism, N—trophy, F—moisture, R—reaction. T—temperature).

Figure 8.
PCA analysis between environmental factors, ecological indicators and plant properties in particular periods.
Figure 8.
PCA analysis between environmental factors, ecological indicators and plant properties in particular periods.

Table 1.
Changes in study area land use by decade—ANOVA results (significance level p < 0.05, bold indicates a statistically significant relationship).
Table 1.
Changes in study area land use by decade—ANOVA results (significance level p < 0.05, bold indicates a statistically significant relationship).
| Feature | p-Value |
|---|---|
| roads | 0.1617 |
| flowing waters/ drainage | 0.0461 |
| buildings | 0.0229 |
| forests | 0.4048 |
| swamps | 0.0511 |
| rushes | 0.0814 |
| water surface | 0.7699 |
| lake surface | 0.1035 |
| farmlands | 0.8491 |
| bushes and trees | 0.2360 |
| meadows | 0.0215 |
| surface waters | 0.0313 |
Table 2.
Classes composition and number of plant communities representing each class.
| Class | Number of Communities | 1950–1960 | 1977–1980 | 2018–2020 |
|---|---|---|---|---|
| Lemnetea minoris | 3 | 0 | 3 | 3 |
| Bidentetea tripartiti | 1 | 0 | 1 | 1 |
| Charetea | 4 | 4 | 2 | 1 |
| Potametea | 18 | 11 | 16 | 15 |
| Utricularietea intermeio-mnoris | 1 | 0 | 1 | 0 |
| Phragmitetea | 24 | 12 | 22 | 19 |
| Molinio-Arrhenatheretea | 8 | 5 | 8 | 0 |
| Scheuchzerio-Caricetea | 6 | 5 | 4 | 0 |
| Alnetea glutinosae | 3 | 3 | 3 | 2 |
| Querco-Fagetea | 1 | 1 | 1 | 0 |
| In total | 69 | 41 | 61 | 41 |
Table 3.
Habitats within the analyzed area of Lake Wytyckie.
| Habitat | Conservation Status | 1950 | 1980 | 2020 |
|---|---|---|---|---|
| Nardus grasslands and moors | + | |||
| Xerothermic grasslands | 6210 | + | + | |
| Variable wet Molinia meadows | 64,140 | + | + | |
| Transitional bogs and quaking bogs | 7140 | + | + | |
| Deciduous forest | + | + | ||
| Swamp forest | + | + | + | |
| Alder thickets | + | + | + | |
| Willow riparian forest | + | + | ||
| Farmland | + | + | ||
| Forest clearance | + | |||
| Ruderal | + | + | + | |
| Dry on a substrate rich in minerals | + | |||
| Ecotone | + | |||
| Water | + | + | + | |
| In total | 10 | 14 | 4 |
Table 4.
Values of floristic diversity indices for classes and communities in respective study periods.
Table 4.
Values of floristic diversity indices for classes and communities in respective study periods.
| 1950–1960 | 1977–1980 | 2018–2020 | |
|---|---|---|---|
| Class in years | |||
| DMg | 3.274 | 4.520 | 3.609 |
| HS | 2.505 | 2.537 | 1.672 |
| S | 0.813 | 0.783 | 0.607 |
| Communities in the years | |||
| DMg | 7.485 | 8.528 | 4.910 |
| HS | 3.304 | 3.469 | 2.679 |
| S | 0.869 | 0.866 | 0.789 |
Table 5.
Descriptive statistics of the values of ecological indicators.
| L Light | T Temperature | K Continentalism | F Moisture | R Reaction | N Trophy | |||
|---|---|---|---|---|---|---|---|---|
| 1950–1960 | ||||||||
| Number of species | 153 | 110 | 112 | 145 | 116 | 134 | ||
| Mean | 7.05 | 5.34 | 4.38 | 8.62 | 5.87 | 4.33 | ||
| V | 6.18 | 6 | 2.81 | 4.09 | 3.07 | 2.15 | ||
| SD | 1.14 | 0.83 | 1.56 | 2.11 | 1.91 | 2.01 | ||
| Range | 4–9 | 2–8 | 1–8 | 2–12 | 1–9 | 1–8 | ||
| 1977–1980 | ||||||||
| Number of species | 273 | 185 | 206 | 249 | 190 | 238 | ||
| Mean | 6.90 | 5.48 | 4.13 | 7.72 | 6.22 | 4.90 | ||
| V | 5.90 | 7.31 | 2.85 | 3.27 | 3.72 | 2.34 | ||
| SD | 1.17 | 0.75 | 1.45 | 2.36 | 1.67 | 2.09 | ||
| Range | 3–9 | 2–8 | 1–8 | 2–12 | 1–9 | 1–9 | ||
| 2018–2020 | ||||||||
| Number of species | 111 | 85 | 83 | 108 | 82 | 97 | ||
| Mean | 6.94 | 5.56 | 4.16 | 9.07 | 6.14 | 5.42 | ||
| V | 7.08 | 8.42 | 3.22 | 5.24 | 3.77 | 2.91 | ||
| SD | 0.98 | 0.66 | 1.29 | 1.73 | 1.63 | 1.86 | ||
| Range | 4–9 | 4–8 | 1–7 | 4–12 | 1–9 | 1–9 | ||
Table 6.
Number of protected species in respective periods.
| Protection Rank | 1950–60 | 1977–80 | 2018–20 |
|---|---|---|---|
| Rare | 7 | 9 | 4 |
| Partial protection | 9 | 17 | 4 |
| Strict protection | 19 | 19 | 0 |
| In total | 35 | 45 | 8 |
Table 7.
Descriptive statistics of environmental factors (Friedman test * p < 0.05).
| Year | Parameter | min | max | Mean | SD | CV | p |
|---|---|---|---|---|---|---|---|
| 1955 | water temperature (°C) | 16 | 20 | 18.3 | 1.7 | 9.36 | 0.0597 |
| depth (m) | 0.5 | 3.5 | 1.3 | 0.2 | 15.38 | 0.0096 * | |
| open water surface (ha) | 238.6 | 0.00 | |||||
| plant surface (ha) | 52.9 | 0.00 | |||||
| pH | 7.1 | 7.7 | 7.4 | 0.3 | 3.98 | 0.2818 | |
| water transparency (m) | 0.7 | 0.9 | 0.8 | 0.1 | 12.50 | 0.0498 * | |
| ditches | 31.0 | 0.00 | |||||
| built-up area | 49.4 | 0.00 | |||||
| surface water | 3.3 | 0.00 | |||||
| peat lands | 236.0 | 0.00 | |||||
| protected species | 7 | 19 | 11.7 | 6.4 | 55.11 | ||
| DMg | 2.1 | 21.7 | 7.4 | 6.2 | 83.26 | 0.7788 | |
| HS | 0.9 | 5.2 | 2.6 | 1.5 | 56.72 | 0.0202 * | |
| S | 0.0 | 1.0 | 0.8 | 0.00 | 0.0150 * | ||
| 1980 | water temperature (°C) | 18.0 | 20.0 | 19.0 | 0.8 | 4.30 | |
| depth (m) | 1.0 | 5.5 | 2.0 | 0.3 | 12.59 | ||
| open water surface (ha) | 237.6 | 0.00 | |||||
| plant surface (ha) | 173.7 | 0.00 | |||||
| pH | 6.7 | 7.4 | 7.1 | 0.3 | 4.67 | ||
| water transparency (m) | 1.2 | 1.7 | 1.4 | 0.3 | 17.56 | ||
| ditches | 114.1 | 0.00 | |||||
| build-up area | 49.8 | 0.00 | |||||
| surface water | 1.1 | 0.00 | |||||
| peat lands | 28.1 | 0.00 | |||||
| protected species | 9.0 | 19.0 | 15.0 | 5.3 | 35.28 | ||
| DMg | 2.4 | 41.2 | 8.7 | 8.9 | 102.22 | ||
| HS | 1.0 | 6.3 | 2.7 | 1.5 | 57.64 | ||
| S | 1.0 | 22.0 | 6.1 | 7.2 | 118.83 | ||
| species number | 0.8 | 1.0 | 0,9 | 0,1 | 8.97 | ||
| 2020 | water temperature (°C) | 20.0 | 23.0 | 21.5 | 1.3 | 6.00 | |
| depth (m) | 0.5 | 4.0 | 1.5 | 0.4 | 26.67 | ||
| open water surface (ha) | 295.6 | 0.00 | |||||
| plant surface (ha) | 164.7 | 0.00 | |||||
| pH | 7.3 | 8.2 | 7.8 | 0.4 | 5.42 | ||
| water transparency (m) | 0.4 | 0.6 | 0.5 | 0.1 | 20.00 | ||
| ditches | 138.4 | 0.00 | |||||
| build-up area | 82.9 | 0.00 | |||||
| surface water | 30.4 | 0.00 | |||||
| peat lands | 5.0 | 0.00 | |||||
| protected species | 0.0 | 4.0 | 2.7 | 2.3 | 86.60 | ||
| DMg | 3.3 | 19.5 | 7.6 | 5.5 | 72.26 | ||
| HS | 1.0 | 5.0 | 2.6 | 1.4 | 52.61 | ||
| S | 0.0 | 1.0 | 0.8 | 0.3 | 41.10 | ||
| species number | 0.0 | 19.0 | 4.1 | 6.9 | 169.16 |
Publisher’s Note: MDPI stays neutral with regard to jurisdictional claims in published maps and institutional affiliations. |
© 2021 by the authors. Licensee MDPI, Basel, Switzerland. This article is an open access article distributed under the terms and conditions of the Creative Commons Attribution (CC BY) license (https://creativecommons.org/licenses/by/4.0/).
Share and Cite
MDPI and ACS Style
Sender, J.; Urban, D.; Różańska-Boczula, M.; Grzywna, A. Long-Term Changes in Floristic Diversity as an Effect of Transforming the Lake into a Retention Reservoir. Sustainability 2021, 13, 7642. https://doi.org/10.3390/su13147642
AMA Style
Sender J, Urban D, Różańska-Boczula M, Grzywna A. Long-Term Changes in Floristic Diversity as an Effect of Transforming the Lake into a Retention Reservoir. Sustainability. 2021; 13(14):7642. https://doi.org/10.3390/su13147642
Chicago/Turabian StyleSender, Joanna, Danuta Urban, Monika Różańska-Boczula, and Antoni Grzywna. 2021. "Long-Term Changes in Floristic Diversity as an Effect of Transforming the Lake into a Retention Reservoir" Sustainability 13, no. 14: 7642. https://doi.org/10.3390/su13147642
Note that from the first issue of 2016, this journal uses article numbers instead of page numbers. See further details here.