3.1. Fresh Mortar Properties
Setting time, flow and slump data obtained from the analyses of fresh mortar specimens were given in
Table 2. The results indicate that increasing the initial nutrient content significantly decreased the setting time (
p = 0.05) (
Table 2). Initial setting time was more affected by the increase in the nutrient content of the mortars than the final setting time. Even at the lowest nutrient content (CN0.25-CF0.63) initial setting time decreased significantly.
Among the tested mortar mixes, four of them were determined to be inadequate for further tests because of their considerably short setting time (less than 60 min) based on the NBN EN-1008 standard. The effect of nutrients on consistency and workability of the specimens were less remarkable. Among the tested specimens, only the mix containing the highest amount of nutrients (i.e., CN3.00-CF7.50) showed a significant decrease in consistency and workability. Fresh mortar properties indicated that the nutrient content of nitrate-reducing-bacteria-based self-healing concrete should not exceed 7.00%
w/w cement (CN2.00-CF5.00). Above this limit, initial and final setting times, as well as the workability of the mortar decreased significantly to the levels which compromised the commercial application of these mixtures without the use of additional modifiers (set retarders, superplasticizers, etc.). Similar set acceleration behaviours of CN and CF were also reported in previous studies and attributed to the increased calcium content in the mixture [
17,
18,
21]. Thus, calcium content of the nutrients should not exceed 2.00%
w/w cement.
On the one hand, mortar mixtures varying in a certain nutrient content margin (i.e., between reference and CN0.25-CF0.63, CN0.25-CF0.63 and CN0.50-CF1.25 etc.) did not show considerably different fresh mortar properties which indicated that initially defined increments in nutrient content (±0.88% in this case) were over-cautious. On the other hand, higher increments resulted in a combination of significant and insignificant effects. Therefore, in further tests, nutrient increments were doubled to 1.75% (i.e., reference and CN0.50-CF1.25, CN0.50-CF1.25 and CN1.00-CF2.50 etc.).
3.3. The Amount of Bioavailable Nutrients in Different Mixtures
The crack age did not affect the nutrient leaching rate significantly (
p = 0.05) (
Figure 5 and
Figure 6) which indicated that the added nutrients (nitrate and formate) were not consumed in any of the chemical reactions inside the mortar. Therefore, the observed effects in setting properties and strength development were attributed to the increased calcium content of the mixtures as previously described in several studies [
17,
18].
Nutrient leaching rates through the crack increased with the increasing initial nutrient content of the mortar specimens. Accordingly, the lowest bioavailable NO
3-N (0.4 ± 0.1 mg/L) was observed in the batch containing the lowest initial nutrient content (CN0.50-CF1.25). In this batch, there was a minor increase in the nutrient concentration throughout the experimental period of 14 days (
Figure 5). The highest bioavailable NO
3-N (24.0 ± 1.3 mg/L) was observed in the batch containing the highest initial nutrient content (CN2.00-CF5.00). The average NO
3-N leaching rates from the cracks of mortar specimens were found as 0.04 mg·d
−1, 0.57 mg·d
−1, 0.92 mg·d
−1 and 1.32 mg·d
−1 for CN0.50-CF1.25, CN1.00-CF2.50, CN1.50-CF3.75 and CN2.00-CF5.00, respectively (
Figure 5). Formate leaching rates also increased with the increasing nutrient content of the mortar mix. Average HCOO
− leaching rates from the cracks of different specimens were noted as 5.84 mg·d
−1, 13.68 mg·d
−1, 20.96 mg·d
−1 and 28.64 mg·d
−1 for CN0.50-CF1.25, CN1.00-CF2.50, CN1.50-CF3.75 and CN2.00-CF5.00, respectively (
Figure 6).
When formate and nitrate leaching rates were compared at similar nutrient content, a higher leaching rate was recorded for formate ions when compared to the leaching rate of nitrate ions. For example, when the initial calcium formate content of a mix was 2.50%
w/w cement, the formate concentration inside the mix became 7.79 mg/L which corresponded to ~2.00 g of formate in a single mortar prism (0.256 L). This initial formate content led to a formate leaching rate of 13.68 mg·d
−1 (
Figure 6). When the initial calcium nitrate content of the mix was 2.00%
w/w cement, the nitrate concentration inside the mix became 6.80 mg/L which corresponded to 1.75 g of nitrate in a single prism. This initial nitrate content led to a nitrate leaching rate of 5.84 mg·d
−1 (
Figure 5). Considering these results, it could be concluded that when the initial mass contents of nitrate and formate were comparable in mortar specimens, the leaching rate of formate ions was more than twice the leaching rate of nitrate ions from cracked mortar.
Findings reveal that except the batch made with the lowest amount of nutrients (CN0.50-CF1.25) which did not have significant nitrate leaching, the bioavailable nutrient ratio was ~23g HCOO
−/g NO
3-N. Considering the aforementioned stoichiometry for nitrate reduction (8 g HCOO
− oxidation for 1 g NO
3-N reduction), the required CF:CN ratio was ~2.0. As also mentioned earlier, to be on the safe side, it was chosen as 2.5 (10 g HCOO
− oxidation for 1 g NO
3-N reduction) in this study. However, based on the leaching results, in microbial self-healing concrete preparation, CF:CN ratio of 2.5 appeared to be excess. On the one hand, from an economical perspective, considering the recorded bioavailable nutrient ratio (~23 g HCOO
−/g NO
3-N), it can be claimed that CF:CN ratio of 0.9 would be sufficient for an economical mix design enabling effective use of the provided nutrients (8 g HCOO
− oxidation for 1 g NO
3-N reduction) during microbial self-healing of cracks (
Figure 5 and
Figure 6). On the other hand, this ratio is only valid for MICP reactions without considering the germination of spores and reproduction of bacteria. In a previous study, it was revealed that under minimal nutrient conditions and limited P availability (N:P ratio of 24), some nitrate-reducing microorganisms could reproduce by using HCOO
− and NO
3-N [
22]. It was reported that the
w/w ratio of these nutrients should be ~20 (g HCOO
−/g NO
3-N) to achieve simultaneous microbial growth and MICP [
23].
The cost of the self-healing bioconcrete depends on the amount of bacterial agents and amount of the nutrients used. Therefore, these two agents should be meticulously examined to develop a cost-efficient self-healing concrete. If lower CF:CN ratios are used, the amount of bacterial agent in the mix design should be high enough to induce calcium carbonate precipitation with minimum or no reproduction of cells. In this approach the defined CF:CN ratio of 2.5 could be decreased to 0.9 so that the costs related to nutrients can be decreased. In another approach, one may consider using the least amount of bacteria that would not compromise the probability of bacteria presence in any formed crack due to distribution issues. In this approach, the bioavailable nutrient ratio should be at least 20 g HCOO−/gNO3-N to obtain simultaneous cell reproduction and MICP which would be the drivers for effective crack healing. Our findings revea that such nutrient bioavailability can be achieved when the initial CF:CN ratio of the mix is around 2.2. Further trade-off studies should be conducted carefully by considering: (i) the influence of nutrients on concrete properties, (ii) the cost of possible bacterial healing agents (axenic or non-axenic cultures), (iii) the cost of protective carriers and/or encapsulation methods and (iv) the cost of the nutrients to elucidate whether reducing the amount of bacterial agents or the nutrients is more significant to reach a cost efficient microbial self-healing concrete.
Previous studies considering the feasibility of up-scaling of self-healing concrete reported 100 to 1000 times higher unit costs for bacteria compared to the nutrients used in self-healing studies [
5]. These high unit costs were even valid for the most economically feasible non-axenic cultures proposed for development of self-healing bioconcrete [
4,
5,
24]. Therefore, decreasing the amount of bacterial agents in the mix design of microbial self-healing concrete seems to be a more economically feasible approach. Based on the results of this study, it can be said that nutrient ratio of 2.5 (CF:CN) in nitrate-reducing-bacteria-based self-healing concrete is suitable for mixtures containing small amounts of bacteria that both reproduction and MICP is planned to occur simultaneously during crack healing. Unfortunately, the effect of bacteria content on self-healing of cracks is still unknown and thus it is not possible to define a scale that indicates if a certain amount of bacteria incorporation would require only MICP or both MICP and reproduction during crack healing.
Observed leaching rates and the ratio of the bioavailable nutrients were also remarkable as they unveil how it was possible to achieve decent self-healing performances in the previous studies using CF and CN without considering the stoichiometry for MICP. Ersan et al. [
4,
16] reported significant crack healing when the initial CF content (2.00%
w/w cement) was lower than the initial CN content (3.00
w/w cement). Although under these circumstances one would expect either a carbon source limitation or uneconomical use of nitrate source, our findings in this study revealed that a relatively higher leaching rate of formate ions might have avoided such issues. Moreover, in those studies, the bacteria content was reported as 0.5%
w/w cement. Considering that the used CF:CN ratio was 0.67 and decent self-healing performance could be achieved, it can be claimed that in those studies microbial self-healing mortar mixtures did not favour simultaneous growth and MICP which requires CF:CN ratio of at around 2.5. Therefore, one can conclude that bacteria content of 0.50%
w/w cement is one of the doses that would economically benefit from less nutrient incorporation. If one considers defining a cost-efficient bacteria content for nitrate reduction-based microbial self-healing concrete, investigating bacteria doses of less than 0.50%
w/w cement with higher initial CF:CN ratio should be prioritised.
Findings of this study also revealed the fate of the nutrients upon direct addition to the mortar mixture. Since cementitious composites have a porous structure, nutrient leaching can occur because of the permeability of the concrete. Thus, the likelihood of running out of nutrients before any crack occurrence should be further evaluated for later age cracks in the concrete. In the mix CN2.00-CF5.00 which showed the highest NO
3-N leaching, regardless of the age of the mortar, the highest NO
3-N concentration reached in the immersion solution was 21.9 ± 2.4 mg/L in 14 days. This amount corresponded to 17.5 ± 1.9 mg NO
3-N in the immersion solution (800 mL). As mentioned above, in a homogenous mortar mixture 1.74 g NO
3− (393 mg NO
3-N) was present in one mortar prism of 160 mm × 40 mm × 40 mm (0.256 L) in size. Although there was a crack in the prism which accelerated the leaching rate due to increased permeability, in 14 days, total leached NO
3-N only corresponded to 4.5% of the provided nutrient in one prism. The same mortar mixture (CN2.00-CF5.00) could be evaluated for formate leaching as well. Regardless of the mortar age, formate concentration reached 488 ± 43 mg/L in the bulk solution which corresponded to 390.4 ± 34.4 mg HCOO
− leach from a single 160 mm × 40 mm × 40 mm size prism (0.256 L) containing 4 g of HCOO
−. The average amount of formate leached from a cracked prism in 14 days only corresponded to 9.7% of the available nutrients in a single prism. In uncracked concrete, nutrient leaching occurs mostly through surface washing as the permeability of uncracked concrete is at least 10
3 to 10
4 times less than the cracked concrete [
7]. Therefore, in uncracked concrete, leaching rates are expected to be slower. Moreover, results showed that leaching rate decreases with time by following a logarithmic function (
Figure 5 and
Figure 6). Considering that even in the cracked concrete, the amount of leached nutrients was less than 10% of the total available nutrients, it became safe to claim that even for immersed structures, nutrients can be added directly as admixtures, and this would not lead to severe nutrient limitation in the healing of later age cracks.
3.4. Evaluation of the Effect of Nutrient Bioavailability on Resuscitation and MICP Performance of Nitrate Reducing Biogranules
In the control reactor, NO3-N concentrations were similar to the replicated nutrient leaching conditions throughout the 16 days of the experimental period. However, HCOO− concentrations initially showed a slight difference which was consistent in each measurement throughout the experimental period. The main reason for this extra carbon source in the first couple of days was the carbon release from dry nitrate reducing biogranules and the initial carbon content of the tap water. Similar differences in the initial concentrations were also observed in biologically active batch reactors and thus these differences were normalised based on the observations in the control reactor by subtracting the carbon content of the control reactor from all measurements.
Decrease in nutrient concentrations in the batch reactors is a sign of microbial activity. According to the recorded results, except control reactor, in all batches there was microbial activity (
Figure 7,
Figure 8 and
Figure 9). These findings indicated that regardless of the nutrient leaching rate, resuscitation of the dried biogranules was possible in all investigated leaching conditions.
3.4.1. Changes in Bioavailable NOx-N Concentration
As shown in
Figure 7, NO
3-N was almost completely consumed in all batches. In Batch A (replication of bioavailable nutrient conditions for cracked CN0.50-CF1.25 mortar) NO
3-N concentration was already less than 1 mg/L for abiotic conditions and in the presence of nitrate reducing biogranules, most of the nitrate reduction activity and nitrite accumulation was observed between days 4 and 6 with a nitrate reduction activity of (0.21 mg NO
3-N·g
−1 CDW·d
−1). Minimum nitrate reduction rate (0.03 mg NO
3-N·g
−1 CDW·d
−1) occurred between days 8 and 10. NO
2-N amount reached its maximum value when NO
3-N consumption rate was maximum (between days 4 and 6). However, as no NO
3-N leaching was recorded for the next two days, bacteria started to reduce NO
2-N immediately. In Batch A, complete resuscitation of nitrate reducing biogranules took 4 to 6 days and after that nitrate reduction rate was always much higher than the replicated nutrient leaching rate which resulted in rapid depletion of NO
3-N. At the end of the experimental period, no NO
3-N was observed and only a negligible amount of NO
2-N (<0.1 mg/L) was present.
As described earlier, MICP rate and the total precipitated calcium carbonate amount depend on the bioavailability of nutrients. Moreover, previous studies using nitrate reducing biogranules in mortar reported that NO
2− accumulation in the system is desired to inhibit reinforcement corrosion [
12,
16]. Observations for Batch A indicated that the bioavailability of electron acceptor (NO
3-N) in cracked, and CN0.50-CF1.25 becomes the major limitation for MICP and possible corrosion inhibition.
In Batch B (replication of bioavailable nutrient conditions for cracked CN1.00-CF2.50 mortar), NO3-N concentration reached almost 10 mg/L for abiotic conditions and in the presence of nitrate reducing biogranules; the highest NO3-N reduction activity was observed between days 6 and 8 as 1.68 mg NO3-N·g−1 CDW·d−1 and the lowest NO3-N reduction activity was observed between days 12 and 14 as 0.92 mg NO3-N·g−1 CDW·d−1. At the end of 16 days the residual NO3-N concentration was negligible (<0.1 mg/L). There was a trace amount of NO2-N accumulation in the system (~1 mg/L). Throughout the experimental period of 16 days, the recorded NO2-N concentration was always below 1.5 mg/L which indicated poor nitrite accumulation. Observations indicated that the bioavailability of electron acceptor (NO3-N) in cracked CN1.00-CF2.50 was the major limitation for MICP and accumulation of corrosion inhibitor NO2-N.
In Batch C (replication of bioavailable nutrient conditions of cracked CN1.50-CF3.75 mortar), NO3-N concentration was around 15 mg/L at the end of the experimental period for abiotic conditions. In the presence of nitrate reducing biogranules, similar to Batch B, maximum NO3-N consumption occurred between days 6 and 8 and recorded as 2.67 mg NO3-N·g−1 CDW.d−1. Minimum nitrate reduction activity was observed between days 2 and 4 as 0.96 mg NO3-N·g−1 CDW·d−1. On day 16, there was no residual NO3-N in the system. Meanwhile, NO2-N concentration gradually increased and reached the peak concentration in sometime between days 8 and 10. In the following days, NO2-N concentration started to decrease and finally all of them were consumed at the end of day 16. Hence, there was no available NO3-N and NO2-N in the system at the end of the experiment which indicated that also in cracked CN1.50-CF3.75 mortar, the electron acceptor (NO3-N) leaching rate was a limiting factor for MICP and accumulation of corrosion inhibitor NO2-N.
In Batch D (replication of bioavailable nutrient conditions of cracked CN2.00-CF5.00 mortar), NO3-N concentration reached around 22 mg/L for abiotic conditions and in the presence of nitrate reducing biogranules the highest nitrate reduction activity was observed between days 4 and 6 as 4.81 mg NO3-N·g−1 CDW·d−1. Minimum activity was observed between days 2 and 4 as 0.64 mg NO3-N·g−1 CDW·d−1. The periods of the minimum nitrate reduction activities were similar in both Batch C and Batch D. On day 16, 0.45 mg/L NO3-N was recorded. Meanwhile, NO2-N concentration increased until day 8 and the accumulation reached its peak value sometime between days 8 and 10. After day 10, a decrease in NO2-N concentration was observed and between days 12 and 14, no drastic change occurred in accumulated NO2-N concentration. At the end of the 16 days, 3.80 mg/L NO2-N was detected in the system. Since in the presence of nitrate reducing biogranules there was bioavailable NO3-N and NO2-N at the end of the experimental period, it can be said that in cracked CN2.00-CF5.00 mortar, electron acceptor leaching rate was not a limiting factor for MICP and accumulation of corrosion inhibitor (NO2-N).
Nitrate reduction is not just an MICP mechanism but also leads the production of nitrite which is the product of partial denitrification as observed in these reactors. Nitrite is also commercially used as an anodic inhibitor for steel corrosion. In this manner, nitrite accumulation is important for the corrosion inhibition [
19]. CN2.00-CF5.00 mortar (Batch D) appeared to be the most advantageous mortar mixture considering the positive influence of nitrite accumulation on corrosion inhibition, because during the experimental period, the highest nitrite accumulation was observed in the replication of CN2.00-CF5.00 mortar (11.06 mg/L NO
2-N). Nitrite is an alternative electron acceptor for nitrate reducing bacteria and nitrite reduction metabolism precedes in the absence or limitation of bioavailable nitrate [
25]. As nutrient leaching from mortar followed a logarithmic trend, towards the end of the experiment, nitrate leaching rate decreased (
Figure 7) and thus after day 10, significant NO
2-N reduction was observed in replicated bioavailable nutrient conditions of cracked CN1.50-CF3.75 (Batch C) and CN2.00-CF5.00 mortars (Batch D).
These results also bring out an important parameter in the optimization of nutrient content for a cost-efficient nitrate-reduction-based microbial self-healing concrete, namely the optimum CN content for effective NO
2-N accumulation. As seen in
Figure 7, the maximum NO
2-N concentrations were increasing from CN0.50-CF1.25 (has the minimal nutrient environment) to CN2.00-CF5.00 (has the maximum nutrient environment) which revealed that NO
2-N accumulation can be increased by adding more CN to the mortar mixtures. However, our initial tests on fresh and hardened mortar properties indicated that CN2.00-CF5.00 mix already had the highest tolerable calcium content (2.00%
w/w cement), and further increase in initial nutrient content resulted in unacceptable fresh mortar properties (
Table 2). Therefore, further increase in CN content of this mix is only possible if either CF content is decreased or sodium nitrate is used in addition to the CN. Considering that the formate leaching rate was about twice the nitrate leaching rate, one may consider decreasing the CF:CN ratio by decreasing CF content and increasing the CN content. Indeed, in a previous study where nitrate reducing biogranules (0.5%
w/w cement) provided simultaneous crack healing and corrosion inhibition, the CN in the mix was 3.00%
w/w cement with a CF:CN ratio of 0.67 (CN3.00-CF2.00) [
16]. Lastly, as described earlier, the CF:CN ratio of the mortar mix is a decisive parameter for microbial growth and activity. When initial CF:CN ratio of a mortar mixture is 0.9, the stoichiometry of the bioavailable nutrients in cracked mortar enables growth limited MICP, and when the initial CF:CN ratio of a mortar mixture is 2.2, the stoichiometry of the bioavailable nutrients in cracked mortar enables MICP through cell synthesis and activity. As decreasing bacteria content is more advantageous due to the high unit price of bacterial agents it should be prioritized. For this purpose, one should combine the following boundary conditions; (i) it is known that 0.5%
w/w nitrate reducing bacteria do not require growth favouring conditions for corrosion inhibition and self-healing [
16], (ii) CF:CN ratio in mortar should be at least 2.2 to stimulate growth and activity upon cracking, (iii) CN content of %3.00 is enough for microbial induced corrosion inhibition through NO
2-N accumulation [
16], (iv) calcium content of mortar mixture should not exceed 2.00%
w/w cement (
Table 2). Considering these boundary conditions, further studies should consider testing self-healing and corrosion inhibition performances of microbial mortars containing less than 0.5%
w/w bacteria, while keeping the CF:CN ratio of the mix at around 2.2. Either the mortar mixture CN2.00-CF5.00, tested in this study, or a slightly modified version, such as CN2.20-CF4.80, defined based on aforementioned boundary conditions, can be the optimum starting mixture for such tests.
3.4.2. Changes in Bioavailable HCOO− Concentration
As described earlier, a control reactor was prepared to observe any nutrient leaching from the used microbial granules. In the control reactor microbial activity was blocked by adjusting the pH of the medium to 11. According to the results there was no NO
3-N leaching from the biogranules to the bulk solution. However, there was a trace amount of carbon source leaching from the biogranules which was recorded as additional soluble COD (55.5 mg/L) in the control reactor (
Figure 8). The observed additional COD was attributed to the combination of the sCOD content of tap water (11.5 mg COD/L) and sCOD leaching from the biogranules (44.0 mg COD/L) in the first 2 days.
Biologically active batch reactors showed similar increase in COD concentration in the first two days, although formate spiking for the replication of bioavailable nutrient conditions was only started on day 2. The increase in the first two days was consistent in all bioreactors and in the control reactor, which confirmed that the observed increase was due to the trace amount of soluble organics in tap water and the formate dissolving from dried biogranules (
Figure 8 and
Figure 9).
The source of the COD leaching from the biogranules was the residual formate in the effluent of the granule cultivation reactor. During the harvesting of the biogranules, a small portion of the reactor content was also taken with the biogranules and the residual formate ions in this mix further precipitated on the biogranules during the drying stage. Thus, when these dry biogranules contacted with water, these soluble ions dissolved and caused an initial COD.
The amount of electron donor leaching from the biogranules corresponded to 17% w/w of the biogranules. Since this value may vary based on the biogranule production process (i.e., the effluent formate concentration), while deciding the initial nutrient content of microbial self-healing concrete, the bioavailability of carbon source should not rely on the amount of formate leaching from biogranules. Therefore, bioavailability of nutrients should be decoupled from the formate ions leaching from biogranules and initial nutrient content of microbial self-healing concrete should be solely sufficient to provide the bioavailable nutrients necessary for resuscitation, growth and MICP.
The control reactor was considered as a blank sample and evolution of the formate concentrations in different setups were normalised accordingly in order to assess the sufficiency of initial nutrient content in different batches (
Figure 9). In normalisation, COD equivalent of formate was taken as 0.35 g COD/g HCOO
−. All of the results were presented as HCOO
−, since it was the only carbon source used in all of the experiments (biogranule production, nutrient leaching etc.) conducted in this study.
Upon normalising the bioavailable formate concentration, in Batch A (replication of CN0.50-CF1.25 mortar), Batch B (replication of CN1.00-CF2.50 mortar), Batch C (replication of CN1.50-CF3.75 mortar) and Batch D (replication of CN2.00-CF5.00 mortar), average formate consumption rates were determined as 12.75 mg·L
−1·d
−1, 20.45 mg·L
−1·d
−1, 30.92 mg·L
−1·d
−1, and 22.51 mg·L
−1·d
−1, respectively (
Figure 9). When compared with previously determined formate leaching rates (7.30 mg.L
−1·d
−1, 17.10 mg·L
−1·d
−1, 26.20 mg·L
−1·d
−1 and 35.80 mg·L
−1·d
−1 for CN0.50-CF1.25, CN1.00-CF2.50, CN1.50-CF3.75 and CN2.00-CF5.00, respectively), average formate consumption rates were superior in CN0.50-CF1.25, CN1.00-CF2.50 and CN1.50-CF3.75 mortar. Therefore, in these three batches, the resuscitation and growth of bacteria as well as their MICP performance had been supported by the electron donor leaching from biogranules. However, in CN2.00-CF5.00 mortar (Batch D), formate leaching rate was higher than formate consumption rate which confirmed that electron donor leaching rate was not a limiting factor for this initial nutrient content. Among all the tested mortar mixtures, the mortar containing CN2.00-CF5.00 appeared to be the only mix in which microbial activity would not rely on the additional carbon coming with the dry biogranules.
In all batches, the highest amount of formate was consumed between the second and fourth days. This initial consumption was attributed to the spore germination which required C for producing cell material. Spore germination was completed when spores turned into vegetative cells. Then, vegetative cells metabolized the bioavailable nutrients and produced carbon dioxide which was the precursor of the CaCO
3 precipitation [
26].
In this study, batch reactors were not purged with N
2, Ar or CO
2 gas to remove the initial dissolved oxygen of tap water. The initial DO concentration of the reactors was 7.0 mg/L. It should be noted that in this study, the major objective was to replicate the possible nutrient leaching scenario for microbial self-healing concrete containing different amounts of nutrients and determine the effect of initial nutrient content on resuscitation and MICP performance of biogranules. It is expected that in real applications, structures made of microbial self-healing concrete will be either completely immersed or exposed to intermittent wetting. In both cases, the presence of dissolved oxygen is inevitable in the first couple of days of the healing period. Therefore, this dissolved oxygen might also contribute to resuscitation and microbial activity in the first couple of days if the nitrate reducing biogranules contain facultative (can grow under both aerobic and anaerobic conditions) bacteria. Considering that the biogranule production reactor was operated under alternating anoxic-aerobic periods, it was highly possible to cultivate biogranules containing facultative bacteria. Therefore, changes in HCOO
− concentrations in the first 4 days of the batch tests should be interpreted accordingly. In the first 2 days, dissolved oxygen was available and some dissolved organic carbon was also available due to formate leaching from biogranules and carbon coming from the tap water. However, there was no N source to produce cell material which prevented the germination of spores. Upon spiking of nutrients (CF and CN) on day 2, N-limited conditions ceased and the spores in the biogranules germinated sometime between days 2 and 4. In this period, the highest amount of HCOO
− consumption occurred in all batches (
Figure 9) while in the same period the lowest NO
3-N reduction activities were observed in all batches (
Figure 7). These results confirmed that in the presence of dissolved oxygen and limited N source, microbial granules preferred to use dissolved oxygen as an electron acceptor to be able to use NO
3-N in cell synthesis. These results were further discussed by interpreting consumed gHCOO
−/gNO
3-N throughout the experimental period in
Section 3.4.3.
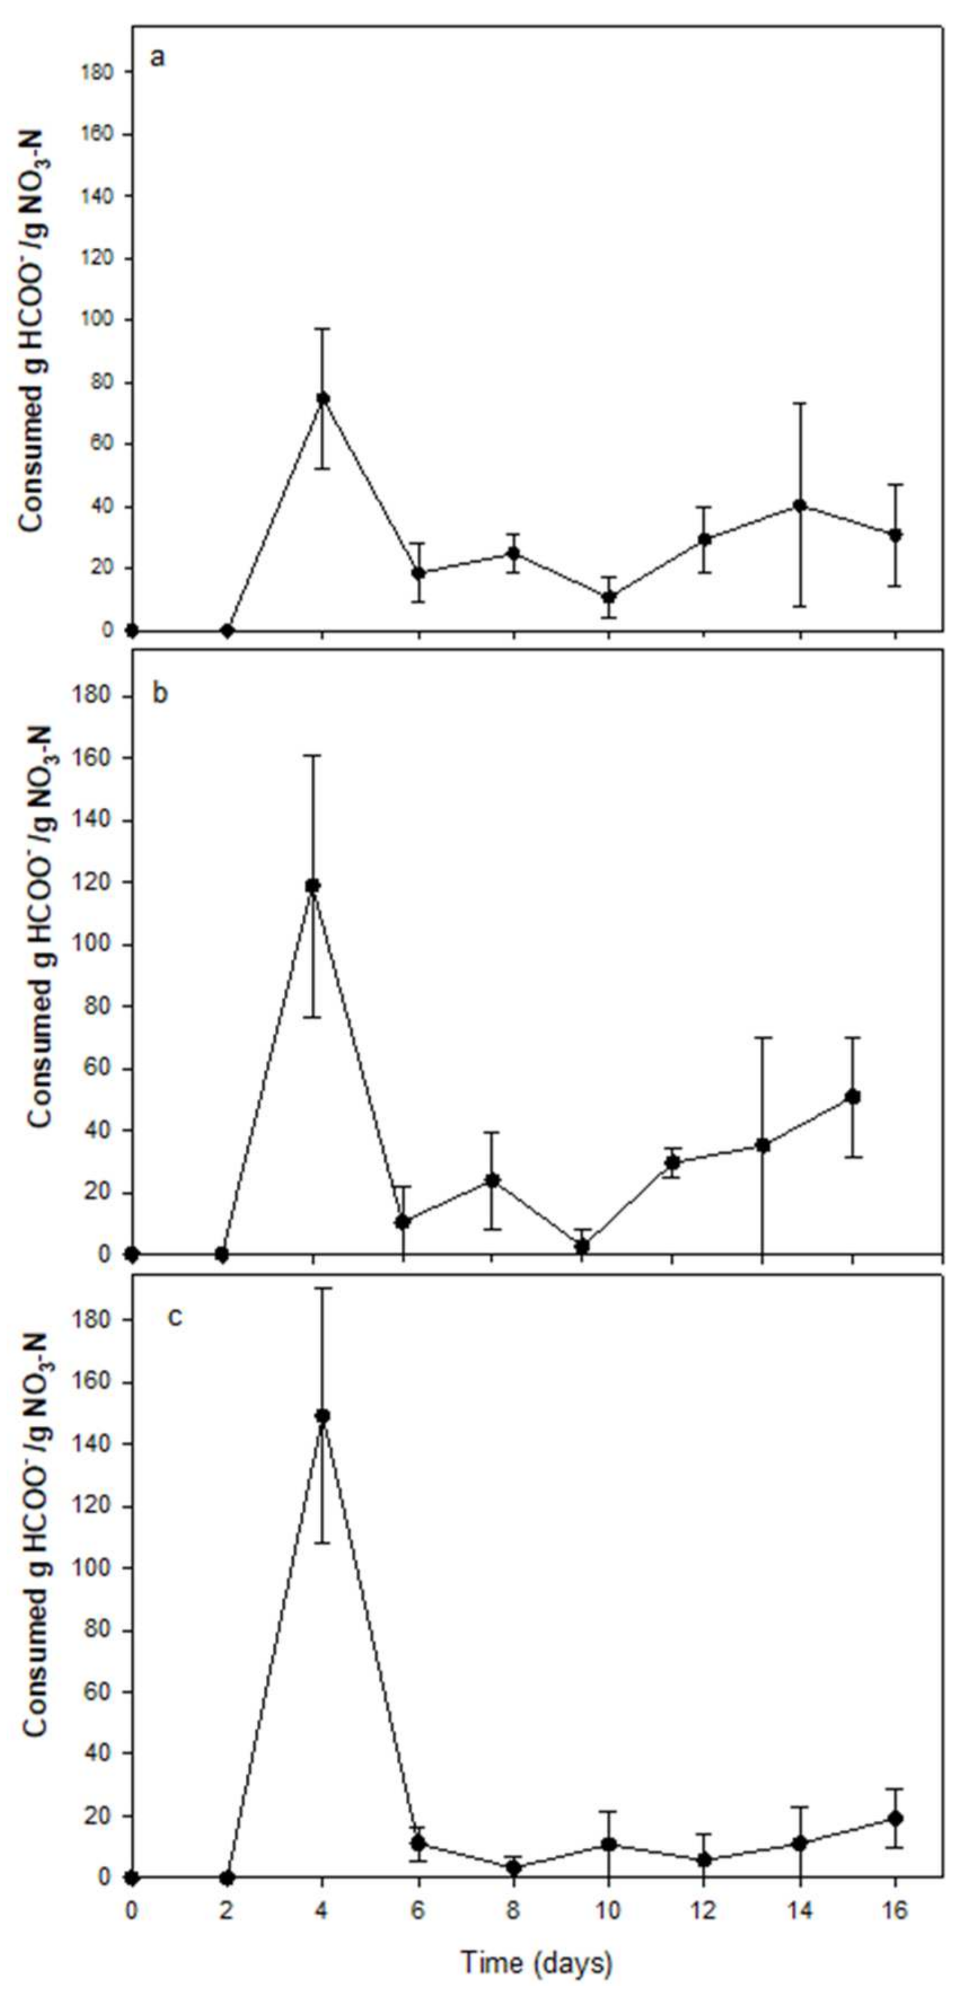
3.4.3. Consumed Nutrient Ratio (gHCOO−/gNO3-N) Variations in Different Batches
Figure 10 shows the changes in g HCOO
−/g NO
3-N consumption ratios throughout the experiment. The consumed g HCOO
−/g NO
3-N ratios were changing between 75 to 150 between days 2 and 4 that germination of spores occurred at initial DO concentration of 7.0 mg/L. In the other days, g HCOO
−/g NO
3-N consumption ratio was between 3.3 and 44. In batches C and D, significant amounts of NO
2-N accumulated between days 4 and 10 (
Figure 7c,d) which was an indication of partial nitrate reduction (Equation (5)). Indeed, the g HCOO
−/g NO
3-N consumption ratio was also mostly below 20 during this period. However, after day 10, NO
2-N started to be consumed together with NO
3-N due to the decrease in nitrate supply of the batches (replicating decreasing nitrate leaching rates of the mortars), thus the ratio of consumed g HCOO/g NO
3-N started to increase towards the end of the experimental period. This rising pattern in g HCOO
−/g NO
3-N consumption ratio was more obvious in batch C and D as the accumulated NO
2-N concentrations were higher in these two batches (
Figure 7c,d). The average nutrient consumption ratios were 25.9 g HCOO
−/g NO
3-N, 24.9 g HCOO
−/g NO
3-N and 10.4 g HCOO
−/g NO
3-N between days 6 and 16, in batch B, C and D, respectively.
Consumed g HCOO
− to reduced g NO
3-N ratio is an important parameter to evaluate the stages of microbial activity. As described earlier, for non-growth MICP scenario g HCOO
−/g NO
3-N ratio should be 8 according to the stoichiometry (Equations (5)–(8)). If the ratio is around 20, it can be said that there is combined MICP and cell synthesis in the system (Equation (9)). Additionally, in the presence of dissolved oxygen, if the dissolved oxygen is solely used for energy reactions and the NO
3-N was used as N source in cell synthesis, gHCOO
−/gNO
3-N ratio of 60 is enough for growth and MICP (Equation (10)). It should be noted that in derivation of both Equations (9) and (10), the energy transfer efficiency (ϵ) of the microbial system was taken as 0.55 and lower efficiencies would lead to even higher gHCOO
−/gNO
3-N ratios.
As the g HCOO−/g NO3-N consumption ratio would be around 20 for the combined cell synthesis and MICP (Equation (9)), it can be said that in batch B and C there was simultaneous MICP and cell growth. However, in batch D, the ratio was closer to 8 which indicated that MICP was the abundant process.
3.5. CaCO3 Precipitation Capabilities
At the end of 16 days of fed batch operation, each batch was evaluated based on their MICP yield. The amount of calcium carbonate in the control batch (coming from the mineral layer of bacterial granules) was subtracted from the amount of calcium carbonate precipitated in each batch. Ultimate net amounts in each batch were shown in
Figure 11.
The results indicate that there was no CaCO
3 precipitation in Batch A (replication of CN0.50-CF1.25 mortar) (
Figure 11). The main reason for this poor performance was the aforementioned electron acceptor limitation, as total NO
3-N leached from CN0.50-CF1.25 mortar was less than 1 mg/L.
In Batch B (replication of CN1.00-CF2.50 mortar), Batch C (replication of CN1.50-CF3.75 mortar) and Batch D (replication of CN2.00-CF5.00 mortar), the ultimate net amounts of CaCO3 precipitates were found as 15.65 mg CaCO3, 24.00 mg CaCO3, 48.05 mg CaCO3, respectively.
Evaluation of Initial Nutrient Content in Terms of Their Effective Use for MICP
The efficient use of nutrients for MICP is essential to maximize the self-healing capacity of concrete and the efficiency can be tracked by evaluating the microbial CaCO
3 precipitation yields for the provided nutrient sources.
Figure 12 shows the CaCO
3 yields for the electron acceptor. At the end of 16 days of experimental period, CaCO
3 yields in Batch B (replication of CN1.00-CF2.50 mortar), Batch C (replication of CN1.50-CF3.75 mortar), and Batch D (replication of CN2.00-CF5.00 mortar) were found as 18.50 ± 5.35 g CaCO
3/g NO
3-N, 16.60 ± 4.60 g CaCO
3/g NO
3-N and 25.30 ± 16.65 g CaCO
3/g NO
3-N, respectively (
Figure 12). Based on these mean values, it was concluded that the most efficient use of bioavailable NO
3-N occurred in Batch D (replication of CN2.00-CF5.00 mortar). This relatively higher performance in Batch D can be attributed to the use of NO
3-N mostly for MICP reactions rather than cell synthesis. As the results of g HCOO
−/g NO
3-N consumption ratios indicated that in Batch B and C, cell synthesis and MICP occurred simultaneously, in these batches, CaCO
3 yields per reduced NO
3-N became lower.
At the end of 16 days, CaCO
3 precipitation yields in Batch B (replication of CN1.00-CF2.50 mortar), Batch C (replication of CN1.50-CF3.75 mortar) and Batch D (replication of CN2.00-CF5.00 mortar) were found as 0.55 ± 0.15 g CaCO
3/g HCOO
−, 0.60 ± 0.15 g CaCO
3/g HCOO
− and 1.50 ± 0.95 g CaCO
3/g HCOO
−, respectively (
Figure 13). If all of the bioavailable HCOO
− was used in CaCO
3 precipitation, the yield would be 2.20 g CaCO
3/g HCOO
− based on the stoichiometry (Equation (1)). Therefore, according to the results, in none of the conditions HCOO
− was totally consumed for MICP. In Batch B, 24% of the total bioavailable carbon was precipitated as CaCO
3 and the remaining portion might have been used for germination of spores and cell synthesis. During the time period between days 2 and 4, which was thought to be the resuscitation and germination period, 33% of the total bioavailable carbon was consumed. Considering that the MICP took place after the germination period, it can be said that 36% of the bioavailable carbon was precipitated between days 4 and 16 and the rest was used in cell synthesis. In Batch C, 27% of the total bioavailable carbon was used in CaCO
3 precipitation. In the resuscitation and germination period (days 2–4), 27% of total bioavailable carbon was consumed. After the resuscitation and germination period, between days 4 and 16, it was found that 37% of the bioavailable carbon was used in the CaCO
3 precipitation, and the remaining portion might have used to produce new cells. In Batch D, 68% of the total bioavailable carbon was precipitated as CaCO
3. In the first four days which is considered as the resuscitation and germination period, 28% of the total bioavailable carbon was consumed. After the resuscitation and germination period, between days 4 and 16, it can be said that 93% of the bioavailable carbon was precipitated. Therefore, it appeared that cell synthesis was not significant in Batch D, between days 4 and 16 which was consistent with the findings based on g HCOO/g NO
3-N consumption ratio.
The highest g CaCO3/g HCOO− yield was achieved in batch D (replication of CN2.00-CF:5.00 mortar). Yields (g CaCO3/g HCOO−) increased with an increasing bioavailable nutrient content (from Batch A to Batch D) and thus with an increasing initial nutrient content (from CN0.50-CF1.25 to CN2.00-CF5.00).
In this study, bioavailable nutrient concentrations were observed in the bulk solution. However, in microbial self-healing concrete, microbial healing agents are mostly located at the inner crack surface and thus the concentration of nutrients inside the cracks governs the actual self-healing and corrosion inhibition performance. The spread of nutrients leaching from the crack depends on diffusion and thus it is expected that the bioavailable nutrient concentrations are higher inside the crack and at locations around the crack. As increasing bioavailable nutrient content is beneficial for CaCO3 yields and NO2-N accumulation, it can be said that among the investigated mortar mixtures, CN2.00-CF5.00 is the best option for development of nitrate reducing biogranule based microbial self-healing concrete.


