
Strengthening the Collaborative Environment in Port-Hinterland Corridor Management Initiatives: A Value System Approach


1
Department of Maritime Studies, University of Piraeus, Karaoli and Dimitriou 80, 18534 Piraeus, Greece
2
Centre for Research and Technology Hellas, Hellenic Institute of Transport, Egialias 52, 15125 Marousi, Greece
*
Author to whom correspondence should be addressed.
Sustainability 2021, 13(16), 9212; https://doi.org/10.3390/su13169212
Submission received: 23 July 2021
/
Revised: 9 August 2021
/
Accepted: 14 August 2021
/
Published: 17 August 2021
(This article belongs to the Special Issue Multi-criteria Decision Making and Sustainable Transport)
Abstract
:With port competition now increasingly taking place on the landside, port actors have a genuine interest in enhancing their role and introducing improvements in the hinterland transport and logistics system. Among the different opportunities that are available, less attention has been placed on those that port–hinterland corridor management initiatives have to offer. These will be discussed herein, and a proposal is put forward for strengthening the collaborative environment in those initiatives, further reinforcing existing opportunities or creating new ones. More specifically, a value system approach is outlined and the steps for its development are sketched, putting forward value-oriented perspectives over the current performance-related ones. The proposed approach adds another useful dimension to the business thinking and decision-making of corridor members, enabling them to more holistically understand their respective roles and positioning and, in turn, further enhance collaboration among them, not just for improving performance but also, more importantly, for adding further value to the corridor. In the long term, this can result in greater benefits being realized for the corridor community as a whole.
1. Introduction
The Industrial Revolution, and advances in information and communication technologies (ICT) that were realized during the mid-1980s, drove the globalization of supply chains and a significant rise in international trade [1]. Indeed, over the past four decades, international trade has been constantly increasing, with only four exceptions being reported in 1982, 2001, 2009 and, more recently, in 2020. The first two can be attributed to the inflation-defeating recession and the dot-com bubble, respectively, while the third one, which accounted for the steepest decrease in trade volumes (−12.2%), was a direct result of the heavy impact of the global financial crisis [2]. The latest one has been more recent and can be attributed to the global outbreak of the COVID-19 pandemic, which imposed a major “shock” on the world economy, with trade volumes declining by 5.3% in 2020 [3,4].
With over 80% of the world’s cargo by volume and 70% by value being transported by sea, maritime transport is justly characterized as the backbone of international trade, accounting for one of the major cornerstones of the global economy [5]. Growth in international seaborne trade is still heavily supported by developing countries (mainly in South-East Asia) that continue to hold a leading position in the export of raw materials at the global level. This duly justifies international seaborne trade volumes being mainly concentrated on the east- and westbound main-lane trade routes connecting Eastern Asia with its key trading partners, namely, Europe and North America (mainly the United States). An extended network of ports accommodates these incoming trade volumes on both continents, which, however, present different patterns of hinterland market concentration. The European market is centrally located and is being served by transport corridors organized in a radial-type format, providing efficient connections to a large number of gateway ports located in key surrounding coastal regions. The U.S. market, on the other hand, is mainly concentrated along the continent’s east and west coasts, with cross-cutting land bridges effectively connecting major and regional maritime hubs located at each end [6].
In both of the above context settings, port competition from the hinterland perspective has been heavily intensified, with port-hinterland connectivity being acknowledged as the second most important factor driving port competitiveness, after port costs [7]. Port actors have, therefore, a genuine interest in introducing improvements in the hinterland transport and logistics system that can considerably enhance their competitiveness and boost the respective region’s trade attractiveness [8]. Different options are available and are presented in the following section, placing particular emphasis on port-hinterland corridor management initiatives and on the opportunities that lie within their frameworks for enhancing corridor efficiency. The most notable initiatives that currently exist in both Europe and the U.S. are outlined, briefly describing their main objectives, organizational structures and key activities undertaken, along with the relevant role of port actors. With the aim of contributing toward further enhancing the collaborative environment within such initiatives, and better supporting the creation and exploitation of new opportunities, the development of a value system for port-hinterland corridors is proposed and sketched in Section 3. Such a system, which presents a novel contribution to the port-hinterland literature [8], is expected to add another important dimension to the business thinking and decision-making of both corridor managers and members, going beyond the performance-oriented perspectives that govern existing planning approaches and tools. Where the latter confine their focus into putting forward actions and measures for ensuring that the corridor performs well, a value system has a broader scope, identifying elements and/or attributes that can add further value to it. This is the factor differentiating it from current planning and operational approaches and practices, with the value system contributing toward the wider integration of forward-thinking perspectives that can support the corridor community into better adapting to a highly uncertain and rapidly changing future. For setting up the proposed value system, useful insights were extracted from both relevant bibliographic sources as well as from a series of semi-structured interviews that were conducted over the previous year with selected representatives of the key industry associations in Greece, taking the port of Thessaloniki and its hinterland corridors as a reference basis. The paper concludes with a set of targeted recommendations for the system’s full-scale development and exploitation, stressing the configurability it should present so that it can be properly adjusted to different spatial and functional contexts, and thus cater for varying conditions.
2. Port Actions for Introducing Improvements in the Hinterland Transport and Logistics System
Improvements in the hinterland transport and logistics system are mainly land-driven, meaning that they are realized as a result of the strategies and actions that stakeholders of the hinterland transport and logistics chain are constantly devising and implementing [9]. However, port actors also have an important role to play (Table 1). Their role has been strengthened over the years, following considerable changes in port governance models, with global terminal operators (GTOs) being introduced, continuously expanding and evolving their networks and strategies [10,11].
Traditionally, port actors have mainly served as “conservators” of hinterland connectivity, limiting their focus on the port area and on actions that can be undertaken for improving port-hinterland access [12]. Realizing, however, the benefits that can be derived from increased cooperation and coordination with hinterland stakeholders, port actors naturally transited toward acting as “facilitators”, driving the formation of targeted partnerships and initiatives that can (i) better stimulate joint developments, (ii) commonly introduce new integrated services, (iii) facilitate information and data exchange, and (iv) put forward promising promotional campaigns describing what each respective port-hinterland community has to offer as a whole. More recently, the “entrepreneur” role has also been taken up by certain port actors (mainly GTOs, but also some authorities, usually those of large ports) investing, through majority or minority shares, in inland transport and terminal operations [13,14]. Through such vertical integration strategies, port actors can acquire better control over the level of efficiency of the hinterland transport and logistics system and can thus more easily identify and plan improvement actions that are to be taken. Of course, this level of control depends on the structure and dynamics of each hinterland market (i.e., the multiplicity of actors and respective market shares).
In addition to the above, important opportunities for port actors also lie within port-hinterland corridor management initiatives that have been established in both Europe and the U.S. In both contexts, those initiatives have been formally developed for coping with challenges at the strategic level, while informal ones also often emerge for tackling the tactical and operational levels [13].
Key Port-Hinterland Corridor Management Initiatives in Europe and the United States
In Europe, the Trans-European Transport Network (TEN-T) serves as the reference layer for those initiatives that cover, under the auspices of the so-called “European Coordinators”, nine hinterland corridors that are connected with key maritime gateways (Figure 1).
The European Coordinators are tasked with the mandate to draw up a work plan for the corridor that is under their responsibility, outlining its current status, highlighting existing bottlenecks and inefficiencies, and setting and prioritizing measures to be implemented for achieving a high level of technical and operational integration and harmonization by 2030, which represents the TEN-T policy’s target year [15]. For setting the basis of these work plans, the latest (4th) edition of which was published in the summer of 2020, comprehensive corridor studies are being conducted. Within their framework, the corridor forum is being regularly consulted, which consists of various working groups, including one dedicated to ports. To this end, port actors have the opportunity to share their views with the corridor community and discuss how existing challenges can be successfully addressed in a timely manner, so that efficiency improvements are realized, for their own gain as much as for all other stakeholders that will benefit.
In the U.S., such initiatives are referred to as “Corridor Coalitions”. The Eastern Transportation Coalition (ETC) (the former “I-95 Corridor Coalition”) is a rather distinctive case, considering the coastal concentration of the U.S. market (Figure 2). The ETC comprises more than 100 members, including Federal Administrations, State and local Departments of Transportation (DOTs), transportation and port authorities, transport industry associations, etc. It encompasses three committees overseeing (a) travel information services, (b) coordinated incident management and safety, and (c) intermodal movement of freight and passengers [16]. Within the latter, and in consultation with the Federal Maritime Administration (MARAD), which is also part of the ETC, the 15 major U.S. ports included in the Coalition, as well as the 13 smaller ones with a more peripheral role, can express their views to the corridor community with regard to existing major bottlenecks and barriers for growth, facilitating in that way the joint planning and implementation of improvement solutions.
As stated above, although often informal and more limited in number, regional and local corridor initiatives also exist, complementing the strategic ones. Of note are the cases of the South East Transport Axis (SETA) in Europe and the Alameda corridor in the U.S. The former was established informally as a result of a homonymous regional project funded under the South East Europe programme, which aimed to improve the rail connections between four TEN-T core hinterland corridors (i.e., Baltic–Adriatic, Mediterranean, Orient/East Mediterranean and Rhine–Danube). After the end of the lifetime of the project, the partners signed a memorandum of understanding (MoU) for sustaining the already established collaboration and advancing the implementation of the measures studied in the project [17]. The Alameda Corridor Transportation Authority (ACTA), on the other hand, is a formal joint local partnership of the cities and ports of Long Beach and Los Angeles, and the Los Angeles County Metropolitan Transportation Authority [18]. ACTA financed the construction of a set of bridges, underpasses, overpasses and street improvements that allowed the separation of the freight trains serving the two ports from passenger and street traffic, with the aim of providing important benefits to a variety of different stakeholders (i.e., port actors, rail freight transport operators, the urban community, shippers, etc.).
3. A Value System Approach for Strengthening the Collaborative Environment in Port-Hinterland Corridor Management Initiatives
Within the framework of the aforementioned initiatives, performance-oriented perspectives are most often adopted in the interaction of corridor members and for guiding relevant decision-making. Indeed, decisions are mostly taken based on performance-related evidence (i.e., key performance indicators—KPIs), often not bearing in mind the ultimate value that the corridor can create. A switch from a “governance by performance” to a “governance by value” approach can better integrate forward-thinking perspectives, changing the performance-related basis that is currently used for making decisions about an uncertain future, with the relative dynamics now changing much faster than before. The establishment of a port-hinterland corridor value system has the potential to strengthen the collaborative environment in the aforementioned initiatives, as a result of the enhanced common understanding that corridor members would develop in terms of the main elements generating value to the corridor. Furthermore, such a system also has the potential to increase the competitiveness of the corridor, since value-adding actions can be more easily and commonly identified and prioritized, providing benefits to both corridor members (e.g., higher profits) and customers (e.g., products and services of higher quality). Evidence from other sectors confirms this belief that value systems can drive and foster enhanced collaboration [19,20,21,22], which is an important prerequisite for developing well-coordinated and efficient hinterland transport and logistics chains [23,24,25].
A conceptual model of value systems in collaborative networks is described in [26], setting the general definitions and outlining the steps to be followed for the development of such a system. These have been properly adapted and are being applied herein for addressing the context of port-hinterland corridors.
3.1. Definitions
A clear definition of the corridor’s value is the first step that should be taken. In general, value is defined as the relative worth, importance, or utility of something. The value of a port-hinterland corridor can therefore be defined as “the additional worth provided to the corridor’s extended community, supporting trade growth and business and regional economic development, while at the same time minimizing all negative resulting externalities”.
For estimating this value, the concepts of the evaluation object, evaluator and evaluation process are introduced. In this context, the evaluation object is the port-hinterland corridor as a whole (Figure 3).
Corridor managers, as previously mentioned, can be of different form and type, depending on the corridor’s scale (e.g., coalition, informal partnership, authority). They can serve as the system’s evaluators, transmitting to the corridor community the relevant insights to be gained, supporting in turn the joint planning of targeted interventions that need to be undertaken. For structuring the evaluation process, a relevant sub-system should be set up (Figure 4) comprising three interconnected elements: the evaluation perspective, the evaluation dimensions corresponding to the selected perspective, and the evaluation functions to be used for assigning a score (quantitative or qualitative) to the evaluation object for each dimension that is being taken into consideration.
3.2. Setting Up the Evaluation Sub-System
3.2.1. Evaluation Perspective and Dimensions
Utilizing insights derived from a series of semi-structured interviews that were conducted with selected representatives of key industry associations in the hinterland of the port of Thessaloniki in Greece (i.e., Greek Exporters’ Association, Hellenic Logistics Association, Thessaloniki Chamber of Commerce and Industry, Thessaloniki Chamber of Handicrafts) [27], the main elements of the evaluation sub-system were defined. More specifically, interviewees first shared their views regarding a number of key regional bottlenecks that had been identified and grouped around five thematic clusters (i.e., market, infrastructural, operational, institutional and innovation), and, taking that as a basis, they provided a set of targeted recommendations for structuring the evaluation sub-system. As noted in the relevant report [27], although knowledge of the regional setting was exploited (i.e., the Balkan region), the aim was to develop a generic system that can be easily reformed and applied in other contexts not only within but also beyond Europe. To this end, the core value perspective was acknowledged as the most appropriate for the original setting of the port-hinterland corridor value system. For this perspective, nine relevant dimensions were defined, according to the following hypotheses: “The corridor is of greater value if…”:
- It facilitates trade (trade facilitation);
- It drives (regional) economic growth (economic growth);
- It facilitates the cost-efficient transportation of goods (cost efficiency);
- It facilitates the transportation of goods in a timely manner (time efficiency);
- The services provided are of high quality (service quality);
- The services provided are reliable (reliability);
- It is able to withstand disruptions and recover promptly from their effects (resiliency)
- Goods are transported safely (safety and security)
- No or minimum impact is imposed on the environment (environmental friendliness).
According to [26], dimensions can be approached through a single evaluation function. However, this is not possible in the context addressed, considering the high level of complexity that characterizes each of the aforementioned nine dimensions. As such, an intermediate step needs to be added. To this end, 38 sub-dimensions were defined in total, associated with the nine dimensions addressed.
3.2.2. Sub-Dimensions
Taking the stated hypotheses as a starting point, the nine dimensions were broken down into a series of key sub-dimensions. It should be noted at this point that, although some sub-dimensions, as noted below, appear to be contributing to more than one dimension (e.g., characteristics and state of infrastructure), they are considered with different evaluation functions in each case.
Trade facilitation
The port-hinterland corridor best facilitates trade if:
- The available capacity is adequate for accommodating current levels of demand, and there is also a margin that allows the system to cope with potential increases (corridor capacity: degree of saturation);
- There are opportunities to expand existing capacity for meeting large increases in demand (corridor capacity: expansion potential);
- Relevant processes and requirements have been simplified to the greatest possible extent (level of simplification);
- Relevant processes and requirements have been made digital to the greatest possible extent (level of digitalization);
- There is a high level of technical and administrative alignment and/or harmonization (if the corridor is international, among the countries that it crosses) (technical and administrative alignment);
- Trade facilitation policies are in place and institutional support is also provided (policies and institutional support).
Economic growth
The port-hinterland corridor best drives (regional) economic growth if:
- It is well aligned (geographically) with key economic centers (i.e., production centers, consumption areas, logistics centers) (geographical alignment with economic centers);
- It contributes to the expansion of the relevant hinterland market (i.e., number and economic activity of relevant service providers) (market growth).
Cost efficiency
The port-hinterland corridor facilitates the cost-efficient transport of goods if:
- The tax policy is favorable (tax policy);
- Labor costs are low (labor costs);
- The infrastructure pricing policy is favorable (infrastructure pricing);
- The market is large and there are no monopolistic or oligopolistic conditions, but instead, competition is high (market competition);
- There are opportunities for exploiting economies of scale (economies of scale);
- There is an increased uptake of key technological solutions that can induce cost savings (key technology uptake).
Time efficiency
Goods are transported in a timely manner along the port-hinterland corridor if:
- The level of congestion is low (level of congestion);
- Due to the certified status of associated parties, cargo inspection requirements are reduced and thus cargo clearance processes are expedited (time for cargo inspection/clearance);
- Service windows are extended, and no or minimum service limitations apply (service windows);
- There is an increased uptake of key technological solutions that can induce time savings (key technology uptake).
Service quality
The services provided along the port-hinterland corridor are of high quality if:
- The infrastructure is modern and well-maintained (characteristics and state of infrastructure);
- Along with the basic services, additional functionalities are also offered (additional functionalities);
- Service providers are certified to international quality standards (standardization (quality));
- Customer satisfaction is high (customer satisfaction).
Reliability
The services provided along the port-hinterland corridor are reliable if:
- There are no service cancellations (service cancellation);
- There are no or only minor/acceptable deviations from the expected delivery times (deviation from expected delivery time).
Resilience
The port-hinterland corridor is resilient if:
- It can withstand a given amount of stress without losing any function (robustness);
- There are alternatives (i.e., facilities and routes) in proximity, which can be utilized in order to cope with the partial degradation or the complete loss of function of a corridor component (rerouting alternatives);
- Problems are swiftly identified, and resources are mobilized to manage a disruption/perturbation (disruption management);
- The time required to recover from a disruption/perturbation is low (recovery time).
Safety and security
Goods are safely transported along the port-hinterland corridor if:
- Infrastructure is modern and well-maintained (characteristics and state of infrastructure);
- Vehicles and equipment are modern and well-maintained (state of fleet and equipment);
- Relevant policies and regulations are in place and are effectively enforced (safety and security policies and regulations);
- Relevant processes take place following international safety standards (standardization (safety and security));
- There is an increased uptake of key technological solutions that can contribute towards enhancing safety and security levels (key technology uptake).
Environmental friendliness
The impact imposed on the environment by the port-hinterland corridor is lower if:
- Capacity utilization is high and empty runs are minimized (capacity utilization);
- Sustainable transport modes (i.e., rail and inland waterways) account for considerable shares in the current modal split (modal split);
- The share of environmentally friendly (green) vehicles and equipment in current fleets is high (environmentally friendly fleet and equipment);
- There is infrastructure that can support the operation of environmentally friendly (green) vehicles and equipment (supporting infrastructure);
- Environmental policies are in place and relevant standards are followed (environmental policies and standards).
3.2.3. Evaluation Functions—Key Value Indicators (KVIs)
As a next step, for each of the aforementioned sub-dimensions, specific evaluation functions should be developed. Key value indicators (KVIs) are proposed to be used addressing all different components of the port-hinterland corridor under investigation (see Figure 3). Where KPIs allow corridor managers to demand not much more than what is needed for the corridor to perform well, KVIs encourage them to identify what may add further value to the corridor. For guiding the selection process, a set of relevant criteria were devised, building upon relevant insights as provided in [28]:
- Measurability: The KVIs should be relatively easy to measure at different time periods and should cater for all different structures of port-hinterland corridors (see Figure 3). This is of the utmost importance since difficulties in data collection often discourage the monitoring of the selected indicators and, thus, the replication of the overall process.
- Cost: The cost for data collection should be reasonable enough so that the process can be repeated at logical time intervals. Efforts should be undertaken to utilize, to the best possible extent, existing datasets of different bodies, institutions, stakeholders, etc., while any opportunity for automatic data collection (e.g., via installed systems) should be exploited.
- Consistency: The KVIs should be clearly defined and be easily and commonly understood, so that results at different time periods can be compared and, thus, meaningful conclusions can be drawn with regard to the progress achieved over time (i.e., core value creation).
- Decision-making balance: The KVIs should be strategic, as well as tactical and operational, and a good balance between these two categories should be ensured. To this end, evidence-based decisions at all different levels can be taken by the respective stakeholders (i.e., corridor managers and members).
It is also important that KVIs are commonly defined and accepted by the whole corridor community since, as stated before, this is an important prerequisite for enhancing the collaborative environment among its members and implementing, as a next step, those actions/measures that can add further value. It is acknowledged in [27] that a basic set of KVIs should be put forward, which corridor managers may expand upon or reform, based on their contextual knowledge and understanding, thus, coming up with the final set to be integrated into their respective value system. A suggested KVI system is presented below (Figure 5, Figure 6, Figure 7, Figure 8, Figure 9, Figure 10, Figure 11, Figure 12 and Figure 13).
3.3. Aggregation Process for Determining the Corridor’s Core Value
Four levels of aggregation, in a bottom-up approach, are distinguished for estimating the core value of a port-hinterland corridor (Figure 14). More specifically, once KVI values are determined, which may be either quantitative or qualitative, a normalization process should be undertaken so that a common basis is established, and the aggregation process is facilitated.
Different normalization methods are available, with “ranking”, “distance to target”, “Z-score” and “min-max” methods accounting for the widest applicability in the construction of composite indicators [29]. Each method presents its own advantages and disadvantages and/or limitations, which should be carefully considered before making the final selection [30]. In this context, and considering also the proposed aggregation method to be discussed below, the “min-max” normalization method is regarded as the most appropriate, although with a slight modification that is quite similar to the one adopted in [31]. More specifically, through this technique, KVI values are rescaled by linear interpolation into the 0–1 range, based on a minimum and a maximum value (Figure 15). These values are, however, not extracted by a specific dataset as is normally the case but, instead, represent (a) targets set in relevant policies (e.g., TEN-T policy), and (b) best-practice operational thresholds. To this end, the method’s key disadvantage (i.e., non-representative min-max range, due to outliers) can be overcome.
The next step is to form a weighting system that may address all the different levels of aggregation. To this end, the required efforts and the processes that should be followed for obtaining the required weights should be taken into careful consideration. The decision on the proportional size of weights (equal or differential) should be made not independently but jointly, considering the type of aggregation method to be adopted (compensatory vs. non-compensatory) [32].
The port-hinterland corridor value system, as it has been defined and sketched until now, suggests that a non-compensatory logic should be adopted since different but equally important dimensions are integrated for estimating the corridor’s overall core value. They equally contribute toward core value creation and, thus, losses in a certain dimension or attribute (i.e., a sub-dimension and/or KVI) cannot be compensated for, by increases in another. To this end, neither additive nor geometric aggregation methods that account, respectively, for full and partial compensability are suitable [33]. Instead, as mentioned above, a non-compensatory approach should be adopted.
Compared to non-compensatory multi-criteria decision-making methods (i.e., outranking relation methods, such as ELECTRE, PROMETHEE, etc.), a method using fuzzy logic proves to be a better fit since, besides respecting the non-compensability property, it (a) can coherently handle both quantitative and qualitative information and cater for inputs of varying levels of detail, effectively addressing the multiplicity and complexity that characterizes some of the selected KVIs, and (b) does not require an explicit mathematical model for the aggregation of KVIs, sub-dimensions and dimensions (i.e., it is rule-based), making the overall process easier to execute. The capabilities and advantages that such methods provide are substantial for being able to cope with increasingly complex and vague concepts [34], and, thus, present wide applicability in the building of composite indexes addressing various business sectors and research fields [35,36,37,38,39].
Normalized values of the selected KVIs can thus be represented as fuzzy sets, and, through a 4-stage fuzzy inference process, the corridor’s overall core value can be estimated (Figure 16).
A Mamdani-type fuzzy inference system (FIS) is proposed to be used, since, compared to a Sugeno-type system, it has more intuitive rule bases that are easier to understand. The process is proposed to be structured as an aggregated fuzzy tree, with outputs of each lower level serving as inputs to the upper level. Besides the corridor’s overall core value, estimated at the last level, important insights can also be gained at each lower level (e.g., dimension level).
The steps to be followed for the setup of the Mamdani FIS, as depicted in Figure 16, are the following:
- Fuzzification: as a preparatory step, the fuzzy linguistic sets should be defined for all input and output variables, at each of the aforementioned four aggregation stages. Next, the degree to which each variable belongs to each of the aforementioned fuzzy sets should be determined. This is performed via the setting of proper membership functions. Input variables at the first stage of aggregation would comprise the crisp numerical normalized values of the selected KVIs, which would already be limited to the 0–1 interval. At each aggregation stage and considering the number of the fuzzy sets that would have been defined for both input and output variables, relevant inference rules should be formed. Specific attention needs to be placed within this multistage process on the number of input and output membership functions to be defined at each level, since this would exponentially affect the number of inference rules required, running the risk of the latter becoming computationally unmanageable. Once this preparatory work is concluded, each input variable can be fuzzified; for each inference rule defined, considering the selected logical operator (since, in this case, the input variables at each aggregation stage are more than one), the implication method, once selected, can be applied at the membership function of the respective output variable. The result of the implication process in a Mamdani FIS is a fuzzy set of the output variable for each inference rule that is activated, considering the input variables.
- Aggregation: the fuzzy sets of the output variable for each inference rule that is activated, considering the input variables, should then be aggregated, as a next step, into a single fuzzy set for the respective output variable. Different methods can be applied to this end (e.g., maximum, probabilistic, sum of the rule output fuzzy sets).
- Defuzzification: the aggregated output fuzzy set can then be defuzzified, and a single crisp number can be extracted. Again, different methods are available and can be used (e.g., centroid, bisector, middle of maximum, largest of maximum and smallest of maximum).
4. Conclusions
Port competition has intensified over the years, following a number of business changes and trends taking place not only on the sea-side (e.g., formation of shipping alliances, introduction of GTOs that in several cases account for subsidiaries of shipping companies, etc.) but also on the landside. Port actors seek to exploit all opportunities that are available for acquiring better control over the efficiency of the hinterland transport and logistics system, with vertical integration strategies having received great attention over the past few years. Indeed, the “entrepreneur” role of port actors has been enhanced and sea-driven developments are now taking place at a faster pace than before.
Within this context, less emphasis has been placed on the opportunities lying within port-hinterland corridor management initiatives that have been formally or informally developed, addressing not only the strategic but also the tactical and operational levels. These initiatives bring together corridor members to discuss existing challenges, persistent bottlenecks and major inefficiencies, and jointly plan the implementation of appropriate actions that can successfully address them and improve, in turn, business competitiveness and trade attractiveness.
With the aim of further supporting this process and enhancing the collaborative environment in those initiatives, a value system approach is proposed and outlined herein, drawing insights from the relevant literature and a series of semi-structured interviews that were conducted over the previous year with selected representatives of key industry associations in the hinterland of the port of Thessaloniki in Greece [27]. The rationale is that such an approach can support corridor members in developing a better understanding of the value that the corridor provides as a whole, as well as of the elements that can add further value to it, some of which may lie within their responsibility and/or require their effective collaboration. Such a value-oriented approach can provide a different perspective to corridor members, integrating another dimension into their business thinking and decision-making, going beyond performance-related perspectives that dominate the business environment and that now serve as the norm [28].
The value system is defined and sketched herein but is not developed to its full extent. After defining all attributes and setting the methodological steps to be taken, the next step is to collect the necessary data (e.g., policy targets, best-practice operational thresholds, etc.) for properly informing the normalization process of KVIs, which will then be fed into the FIS system. An equal weighting scheme has been proposed for the evaluation perspective considered and, based on that, membership functions can be defined, and inference rules can be formed accordingly. Since a 4-stage fuzzy inference process is foreseen, membership functions for both inputs and outputs should be carefully defined so that the number of inference rules remains computationally manageable. Of course, all details in the Mamdani-FIS have to be specified, justifying each selection made (e.g., of the logical operator, aggregation and defuzzification method, etc.). The system’s monotonicity should also be checked [40], and its robustness and sensitivity need to be tested, preferably on a real-world case basis.
Once fully developed, and after accompanying it with a set of relevant guidelines, the value system can be promoted to port-hinterland corridor management initiatives for use, allowing in that way a more thorough and accurate assessment of (a) the benefits derived from such an approach, (b) possible defects and suggestions for improvements, (c) its expansion potential and scalability. A bottom-up approach, i.e., starting from local or regional initiatives and working the way up toward successful deployment at a larger scale, is being considered as more beneficial. For the last point especially, various ideas are already in mind. For example, different evaluation perspectives can be taken into consideration (e.g., infrastructural, operational, etc.), which of course would require a proper reforming of the other components of the evaluation sub-system and a resetting of the overall aggregation process to be performed.
Author Contributions
Conceptualization, E.S. and M.B.; methodology, E.S.; validation, E.S. and M.B.; writing—original draft preparation, E.S.; writing—review and editing, M.B.; visualization, E.S. All authors have read and agreed to the published version of the manuscript.
Funding
This research was partly funded by a grant from Thessaloniki Port Authority S.A. within the context of the “ISTEN—Integrated and Sustainable Transport in Efficient Network” research project, supported by the Interreg ADRION Program that is being funded under the European Regional Development Fund (ERDF) and the IPA II fund.
Institutional Review Board Statement
Not applicable.
Informed Consent Statement
Not applicable.
Data Availability Statement
Not applicable.
Acknowledgments
This work has been supported by the University of Piraeus Research Center and the Fulbright Student Program ‘Visiting Research Students’.
Conflicts of Interest
The authors declare no conflict of interest.
References
- Baldwin, R. Global supply chains: Why they emerged, why they matter, and where they are going. In Global Value Chains in a Changing World; Elms, D.K., Low, P., Eds.; World Trade Organization Publications: Geneva, Switzerland, 2012. [Google Scholar]
- The Great Collapse: What Caused It and What Does It Mean? Available online: http://voxeu.org/article/great-trade-collapse-what-caused-it-and-what-does-it-mean (accessed on 29 June 2021).
- Baldwin, R.; Tomiura, E. Thinking ahead about the trade impact of COVID-19. In Economics in the Time of COVID-19; Baldwin, R., Weder di Mauro, B., Eds.; CEPR Press: London, UK, 2020. [Google Scholar]
- World Trade Primed for Strong But Uneven Recovery after COVID-19 Pandemic Shock. Available online: https://www.wto.org/english/news_e/pres21_e/pr876_e.htm (accessed on 29 June 2021).
- United Nations Conference on Trade and Development (UNCTAD). Review of Maritime Transport 2020; United Nations Publication: New York, NY, USA; Geneva, Switzerland, 2020. [Google Scholar]
- Brooks, M.; van der Lugt, L.M. Transatlantic port issues. J. Trans. Res. Forum 2010, 49, 133–154. [Google Scholar] [CrossRef] [Green Version]
- Parola, F.; Risitano, M.; Ferretti, M.; Panetti, E. The drivers of port competitiveness: A critical review. Trans. Rev. 2017, 37, 116–138. [Google Scholar] [CrossRef]
- Sdoukopoulos, E.; Boile, M. Port-hinterland concept evolution: A critical review. J. Transp. Geogr. 2020, 86, 102775. [Google Scholar] [CrossRef]
- Monios, J.; Wilmsmeier, G. Giving a direction to port regionalization. Trans. Res. A. 2012, 46, 1551–1561. [Google Scholar]
- Notteboom, T.; Rodrigue, J.-P. The corporate geography of global container terminal operators. Marit. Policy Manag. 2012, 39, 249–279. [Google Scholar] [CrossRef]
- Zhu, S.; Zheng, S.; Ge, Y.-E.; Fu, X.; Sampaio, B.; Jiang, C. Vertical integration and its implications to port expansion. Marit. Policy Manag. 2019, 46, 920–938. [Google Scholar] [CrossRef] [Green Version]
- Magnan, M.; van der Horst, M. Involvement of port authorities in inland logistics markets: The cases of Rotterdam, Le Havre and Marseille. Marit. Econ. Logist. 2020, 22, 102–123. [Google Scholar] [CrossRef]
- Sdoukopoulos, E.; Boile, M. Hinterland corridor management initiatives in the EU and the US: The role of ports. In Developments in Maritime Technology and Engineering; Guedes Soares, C., Santos, T.A., Eds.; CRC Press: London, UK, 2021. [Google Scholar]
- Van den Berg, R.; De Langen, P.W. Hinterland strategies of port authorities: A case study of the port of Barcelona. Res. Transp. Econ. 2011, 33, 6–14. [Google Scholar] [CrossRef]
- European Parliament and the Council. Regulation (EU) No 1315/2013 of the European Parliament and the Council of 11 December 2013 on Union Guidelines for the Development of the Trans-European Transport Network and Repealing Decision No 661/2010/EU; European Union: Brussels, Belgium, 2013. [Google Scholar]
- The Eastern Transportation Coalition. Available online: https://tetcoalition.org/about-us/ (accessed on 1 July 2021).
- South East Transport Axis (SETA) Consortium. SETA Corridor Development Plan; Project Deliverable, South East Europe Programme; SETA Project: Burgenland, Austria, 2014. [Google Scholar]
- Alameda Corridor Transportation Authority. Available online: https://www.acta.org/ (accessed on 31 July 2021).
- Abreu, A.; Camarinha-Matos, L.M. On the role of value systems to promote the sustainability of collaborative environments. Int. J. Prod. Res. 2008, 46, 1207–1229. [Google Scholar] [CrossRef]
- Romero, D.; Molina, A. Collaborative networked organisations and customer communities: Value co-creation and co-innovation in the networking era. Prod. Plan. Control. 2011, 22, 447–472. [Google Scholar] [CrossRef]
- Macedo, P.; Camarinha-Matos, L.M. A qualitative approach to assess the alignment of Value Systems in collaborative enterprises networks. Comput. Ind. Eng. 2013, 64, 412–424. [Google Scholar] [CrossRef]
- Macedo, P.; Camarinha-Matos, L.M. Value Systems Alignment Analysis in Collaborative Networked Organizations Management. Appl. Sci. 2017, 7, 1231. [Google Scholar] [CrossRef] [Green Version]
- Braun, C.; Perić, A. Integrated Spatial and Transport Development along European Corridors: A Look through the Lens of Stakeholder Cooperation. Presented at the 22nd International Conference on Urban Planning and Regional Development in the Information Society, Vienna, Austria, 12–14 September 2017. [Google Scholar]
- Van der Horst, M.R.; De Langen, P.W. Coordination in Hinterland Transport Chains: A Major Challenge for the Seaport Community. Marit. Econ. Logist. 2008, 10, 108–129. [Google Scholar] [CrossRef]
- Van der Horst, M.R.; Van der Lugt, L.M. Coordination mechanisms in improving hinterland accessibility: Empirical analysis in the port of Rotterdam. Marit. Policy Manag. 2011, 38, 415–435. [Google Scholar] [CrossRef]
- Camarinha-Matos, L.M.; Macedo, P. A conceptual model of value systems in collaborative networks. J. Intell. Manuf. 2010, 21, 287–299. [Google Scholar] [CrossRef]
- Madas, M.; Boile, M.; Fouskas, K.; Sdoukopoulos, A.; Pachni-Tsitiridou, O. Local Action Plan for Thessaloniki Area; Technical Deliverable 2.2.6.; ISTEN Project: Thessaloniki, Greece, 2020. [Google Scholar]
- Kunaka, C.; Carruthers, R. Trade and Transport Corridor Management Toolkit; World Bank: Washington, DC, USA, 2014. [Google Scholar]
- Talukder, B.; Hipel, K.W.; vanLoon, G.W. Developing Composite Indicators for Agricultural Sustainability Assessment: Effect of Normalization and Aggregation Techniques. Resources 2017, 6, 66. [Google Scholar] [CrossRef] [Green Version]
- The Organization for Economic Cooperation and Development (OECD). Handbook on Constructing Composite Indicators. Methodology and User Guide; Joint Research Center—European Commission: Paris, France, 2008. [Google Scholar]
- Phillis, Y.A.; Grigoroudis, E.; Kouikoglou, V.S. Sustainability ranking and improvement of countries. Ecol. Econ. 2011, 70, 542–553. [Google Scholar] [CrossRef]
- Maggino, F.; Ruviglioni, E. Obtaining Weights: From Objective to Subjective Approaches in View of More Participative Methods in the Construction of Composite Indicators. Paper Presented at the Seminar on “New Techniques and Technologies for Statistics (NTTS)”; EUROSTAT: Luxembourg, 18–20 February 2009. [Google Scholar]
- Nardo, M.; Saisana, M.; Saltelli, A.; Tarantola, S. Handbook on Constructing Composite Indicators: Methodology and User Guide; OECD Publishing: Paris, France, 2008. [Google Scholar]
- Cárdenas, J.R.G.; Nebot, À.; Mugica, F. Comparison between Composite Index Solution Surfaces with Fuzzy Composite Index Decision Surfaces. In Proceedings of the 2019 IEEE International Conference on Fuzzy Systems, New Orleans, LA, USA, 23–26 June 2019. [Google Scholar]
- Famurewa, S.M.; Stenström, C.; Asplund, M.; Galar, D.; Kumar, U. Composite indicator for railway infrastructure management. J. Mod. Transport. 2014, 22, 214–224. [Google Scholar] [CrossRef] [Green Version]
- Ermini, R.; Ataoui, R. Computing a global performance index by fuzzy set approach. Procedia Eng. 2014, 70, 622–632. [Google Scholar] [CrossRef] [Green Version]
- Zani, S.; Milioli, M.A.; Morlini, I. Fuzzy Composite Indicators: An Application for Measuring Customer Satisfaction. In Advances in Theoretical and Applied Statistics. Studies in Theoretical and Applied Statistics; Torelli, N., Pesarin, F., Bar-Hen, A., Eds.; Springer: Berlin, Germany, 2013. [Google Scholar]
- Castillo, C.; Lorenzana, T. Evaluation of Business Scenarios by Means of Composite Indicators. Fuzzy Econ. Rev. 2010, 15, 3–20. [Google Scholar] [CrossRef]
- Gerundo, R.; Marra, A.; De Salvatore, V. Construction of a Composite Vulnerability Index to Map Peripheralization Risk in Urban and Metropolitan Areas. Sustainability 2020, 12, 4641. [Google Scholar] [CrossRef]
- Seki, H.; Tay, K.M. On the monotonicity of Fuzzy Inference Models. J. Adv. Comput. Intell. Intell. Inform. 2012, 16, 592–602. [Google Scholar] [CrossRef]
Figure 1.
TEN-T core hinterland corridors and connected seaports (own elaboration based on [15]).
Figure 1.
TEN-T core hinterland corridors and connected seaports (own elaboration based on [15]).
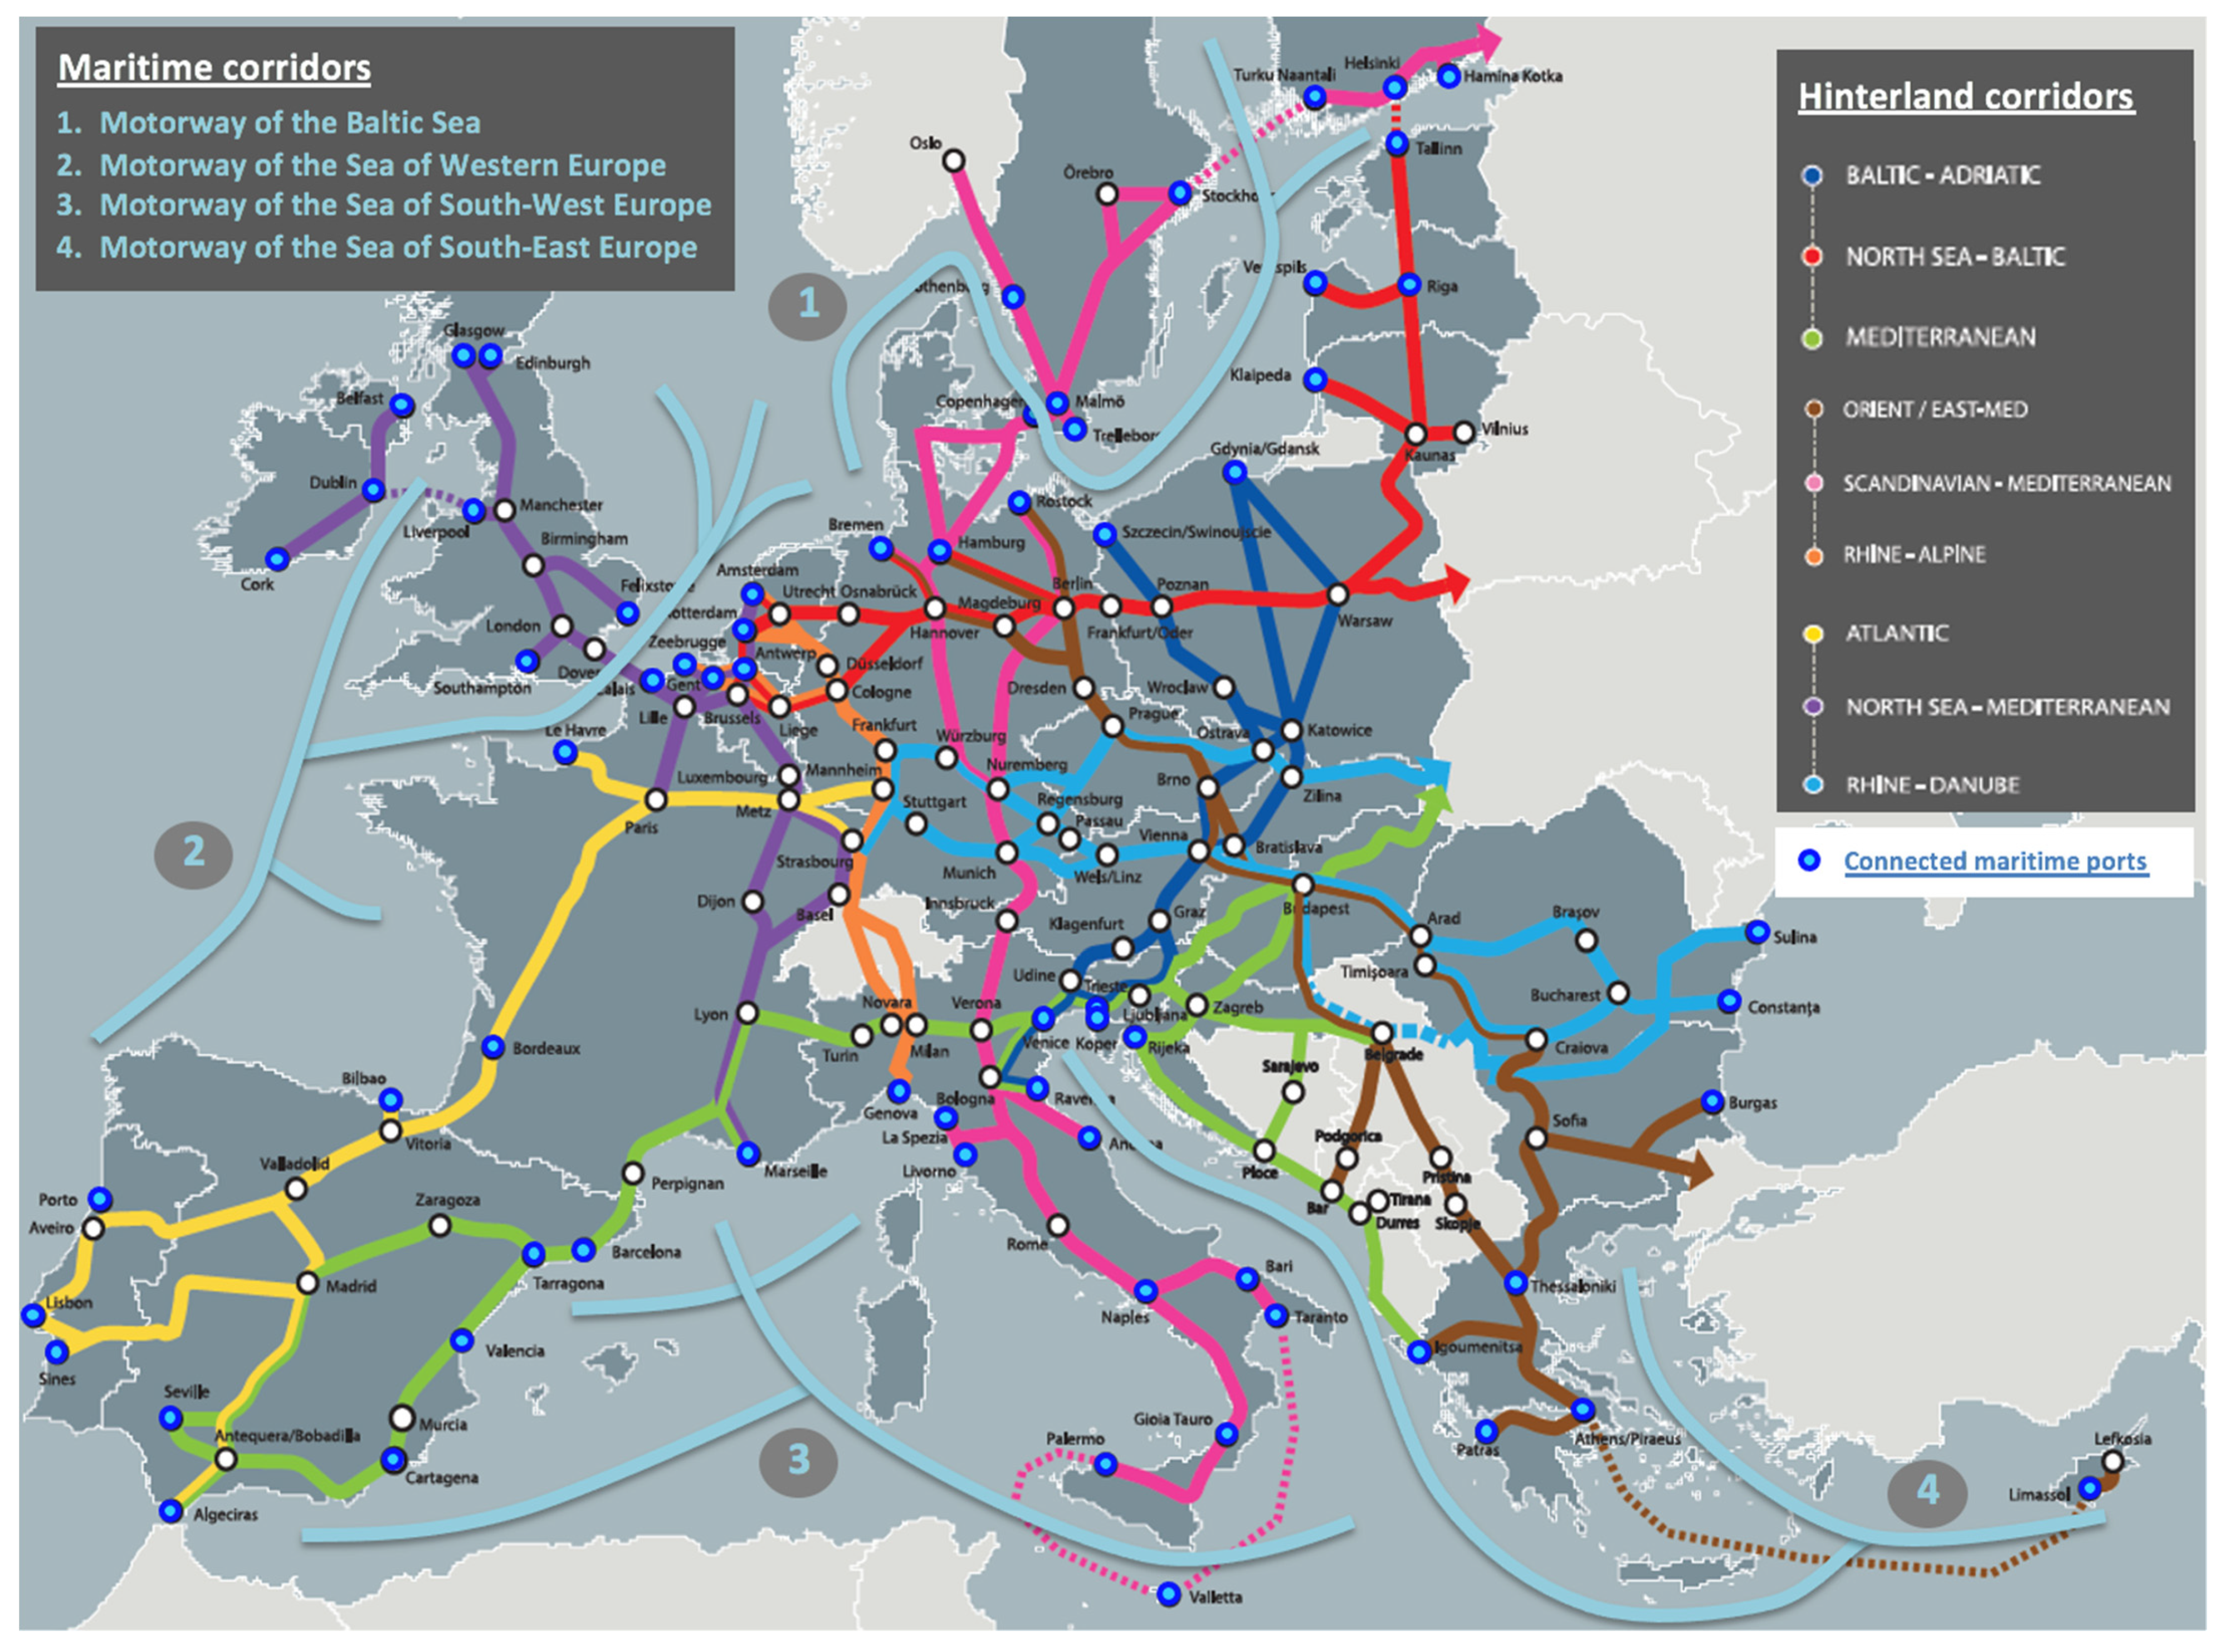
Figure 2.
The context of the Eastern Transportation Coalition (own elaboration based on [16]).
Figure 2.
The context of the Eastern Transportation Coalition (own elaboration based on [16]).

Figure 3.
Outline of the generic structure of a port-hinterland corridor.

Figure 4.
Structure of the value system [26].
Figure 4.
Structure of the value system [26].

Figure 5.
KVIs for the “Trade facilitation” dimension and sub-dimensions.


Figure 6.
KVIs for the “Economic growth” dimension and sub-dimensions.

Figure 7.
KVIs for the “Cost efficiency” dimension and sub-dimensions.

Figure 8.
KVIs for the “Time efficiency” dimension and sub-dimensions.

Figure 9.
KVIs for the “Service quality” dimension and sub-dimensions.

Figure 10.
KVIs for the “Reliability” dimension and sub-dimensions.

Figure 11.
KVIs for the “Resilience” dimension and sub-dimensions.

Figure 12.
KVIs for the “Safety and security” dimension and sub-dimensions.

Figure 13.
KVIs for the “Environmental friendliness” dimension and sub-dimensions.

Figure 14.
Levels of aggregation for estimating the core value of a port-hinterland corridor.

Figure 15.
Linear interpolation of KVI values based on the min-max method.

Figure 16.
Value system setup process (own elaboration based on [39]).
Figure 16.
Value system setup process (own elaboration based on [39]).


Table 1.
The role that port actors can take in improving hinterland transport and logistical integration (own elaboration based on [12,13]).
| Role of Port Actor | Key Actions | Indicative Examples |
|---|---|---|
| Conservator | Development of physical and technological infrastructure inside the port area for facilitating hinterland access | Rail shunting operations, optimal design of the layout of terminal gates, implementation of truck appointment systems, etc. |
| Facilitator | (i) Non-commercial partnerships, (ii) promotion and lobbying, (iii) ICT services, (iv) financial and contractual incentives | (i) Strategic initiatives with industry associations (e.g., Inlandlinks.eu, etc.), (ii) hinterland network promotion partnerships (e.g., Medlink ports, etc.), (iii) port and cargo community management systems (e.g., Portbase, DAKOSY, AP+, etc.), (iv) mediator in commercial business relations (e.g., HungaRo Express) |
| Entrepreneur | Investments (majority or minority shares) in (i) inland transport and (ii) terminal operations | (i) CSP Iberian Rail Services, European Gateway Services, Synergy APM Terminals Railway Spain, etc., (ii) CSP Iberian Zaragoza Rail Terminal, DeCeTe Duisburg, DP World Mannheim, etc. |
Publisher’s Note: MDPI stays neutral with regard to jurisdictional claims in published maps and institutional affiliations. |
© 2021 by the authors. Licensee MDPI, Basel, Switzerland. This article is an open access article distributed under the terms and conditions of the Creative Commons Attribution (CC BY) license (https://creativecommons.org/licenses/by/4.0/).
Share and Cite
MDPI and ACS Style
Sdoukopoulos, E.; Boile, M. Strengthening the Collaborative Environment in Port-Hinterland Corridor Management Initiatives: A Value System Approach. Sustainability 2021, 13, 9212. https://doi.org/10.3390/su13169212
AMA Style
Sdoukopoulos E, Boile M. Strengthening the Collaborative Environment in Port-Hinterland Corridor Management Initiatives: A Value System Approach. Sustainability. 2021; 13(16):9212. https://doi.org/10.3390/su13169212
Chicago/Turabian StyleSdoukopoulos, Eleftherios, and Maria Boile. 2021. "Strengthening the Collaborative Environment in Port-Hinterland Corridor Management Initiatives: A Value System Approach" Sustainability 13, no. 16: 9212. https://doi.org/10.3390/su13169212
Note that from the first issue of 2016, this journal uses article numbers instead of page numbers. See further details here.