
An Integrated Approach to Municipal Solid Waste Recycling Performance Evaluation by Incorporating Local Demographic Features


1
Department of Environmental Engineering and Management, Chaoyang University of Technology, No. 168, Jifeng E. Rd, Wufeng District, Taichung 413310, Taiwan
2
Department of Applied Chemistry, Chaoyang University of Technology, No. 168, Jifeng E. Rd, Wufeng District, Taichung 413310, Taiwan
*
Author to whom correspondence should be addressed.
Sustainability 2021, 13(18), 10446; https://doi.org/10.3390/su131810446
Submission received: 17 August 2021
/
Revised: 11 September 2021
/
Accepted: 15 September 2021
/
Published: 19 September 2021
(This article belongs to the Special Issue Selected papers from IEEE Eurasia Conference on Biomedical Engineering, Healthcare and Sustainability 2021 (IEEE ECBIOS 2021))
Abstract
:Recycling municipal solid waste has become a challenging task for municipalities. Appropriate recycling efficiency evaluations are, thus, essential to find practical benchmark learning targets for inefficient municipal solid waste authorities (MSWAs). This study developed a recycling performance evaluation procedure by subgrouping MSWAs with prominent local demographic features, such as population density, ratio of senior citizens, tourism index etc. Principal recycling relevant factors for MSWAs in each group were then collected, and data envelopment analysis (DEA) was applied for efficiency evaluation and benchmark learning targets. A case study of 181 MSWAs in Taiwan demonstrated the suitability of the proposed procedures. An assessment of the required efforts for efficiency improvements revealed that, in an unsegregated scenario, inefficient MSWAs representing a rural subgroup required maximum efforts to fulfill the efficiency targets, which was on average 61% higher than that determined in their respective subgroup. Furthermore, the unsegregated scenario revealed proximal efficiency results for the urban subgroup. The results indicated that consideration of local demographic features was essential for a fair assessment of recycling efficiency. Additionally, evaluating MSWAs with similar local demographic features was superior in obtaining appropriate benchmark learning targets for the inefficient MSWAs and, consequently, exhibited practicality for improving walkthroughs to achieve the efficiency goal.
1. Introduction
Resource consumption patterns are changing with the economic development, leading to an unprecedented production of waste. Several waste management practices are in existence within municipal authorities, among which the recycling and the recovery of waste are gaining popularity owing to the limited landfill space, difficult setup, and depletion of materials associated with other methods [1]. Successful promotion of material recycling from municipal solid waste (MSW) has also become a major challenge for the authorities. However, there exist some exemplary cases in MSW recycling. For instance, in Taiwan, between 1999 and 2017, the recycling rate increased from 9.78% to 60.22% [2]. Effective enhancement of the rates depends not only on public participation but also on capital and manpower investment made by the government.
Studies have shown that municipal authorities usually adjust inputs including funding, manpower, or machinery over outputs such as the amount or rate of recycling to evaluate the recycling performance. For example, Worthington and Dollery [3] used waste disposal volume, garbage collection amount, and recycling rate as output factors and waste collected, collection frequency, urban density, population distribution, occupation, waste disposal cost, total recycling cost, and local government assets as the input factors to find the improvement direction of local waste. Similarly, Bosch et al. [4] considered collection containers, vehicles, and workers as inputs and waste collected as output to evaluate the MSW collection system. Benito et al. [5] also used total waste collected as output and cost for MSW management as input.
In these studies, factors such as population distribution, urban density, occupation, etc., which are particular to a municipal area, could have been classified as local demographic features, which are difficult or sometimes impossible to be altered by the MSWAs. However, to our knowledge, none of these studies treated the input factors independently from those features while performing the analysis. It is always better to assess the impact of these local demographic features before considering the improvement of recycling practice for an MSWA. A couple of previous studies elucidated their impacts on recycling behavior and achievements. Garces [6] indicated that household resource recycling behaviors are affected by factors such as income, education, and age group. Demographic factors including age, education level, gender, and occupation influence knowledge, attitude, and perception regarding source separation and recycling of solid waste [7]. Population density and per capita income play a significant role in analyzing the regional efficiencies of recycling [8]. Benito-Lopez et al. [9] demonstrated a significant relationship between efficiency and the analyzed variables (per capita income, urban population density, tourism index, etc.). Similarly, Almasi et al. [10] concluded that age, occupation, education, family size, marital status, and recycling programs implemented by the private sectors affect their recycling behavior. Some other studies have shown that the recycling performance also differs according to economic status and standards of living [11,12]. Hence, neglecting the influential local demographic features is likely to hinder the selection of an appropriate direction for improving inputs and outputs of MSWAs. The effects of local demographic features on recycling performance are, thus, significant and should be treated independently of input and output factors. Development of a robust method for recycling performance evaluation involving input/output improvement can be considered reliable only if the influential local demographic features are treated independently in the overall evaluation process.
There are various local demographic features associated with MSWAs such as population density, average age, occupation, education, tourism index, etc., which can facilitate a more accurate understanding of the local recycling determinants. Those factors could serve as a basis for subgrouping, and MSWAs with similar data can be arranged into an identical category. For example, Tseng et al. [13] conducted a cluster analysis of the input resources and output services of the medical sector in Taiwan from 2007 to 2011 and arranged similar units into an identical subgroup to facilitate subsequent analysis of resource allocation and service efficiency.
Data envelopment analysis (DEA) is an appropriate tool for such cases where relative analysis can be conducted regarding the performance or efficiency of separate units [14], whereby inefficient units can be improved by studying efficient units such as by learning the collection process, transportation system, and collection frequency [15]. DEA is widely used in multi-input and multi-output production. In the efficiency evaluation process, the business and public sectors mainly use input and output factors of different decision-making units (DMUs) to find the one at the leading edge of efficiency as a reference for the improvement of others. Many previous studies related to determining the efficiency and performance ability of DMUs incorporated DEA techniques. Benito-Lopez et al. [9] used the DEA method to analyze the efficient DMUs for municipal street-cleaning and refuse collection services in Spain. Exposito and Velasco [8] studied the use of specific DEA methods to determine the full development of the recycling market related to waste disposal in the Spanish region, estimated the necessary output and input forecasts, and selected the most efficient regions for the corresponding waste management department as a reference. Halkos et al. [16] applied DEA to study the waste recycling efficiency of 28 EU member states and concluded that recycling rate was able to describe the DEA results, i.e., more efficient countries seemingly had higher recycling rates. Considering the above findings, this study aimed to incorporate DEA to evaluate recycling performance, as well as discover improvement measures for inefficient DMUs, i.e., MSWAs. The major goals of this study were to evaluate the recycling performance of MSWAs by integrating local demographic features and to estimate the required output and input projections to generate efficient performers in each identical subgroup of MSWAs.
2. Methodology
2.1. Brief Introduction of the Research Process
Figure 1 presents the flowchart of this study. Data related to local demographic features of the municipal area such as population density, average age, the proportion of aboriginal group, occupation, tourism activities etc., and the input/output factors of MSWAs, were collected. MSWAs with similar demographic features were classified in an identical subgroup. The DEA method was then implemented using input/output factors in each subgroup and in the unsegregated group to evaluate the recycling performance of MSWAs. Details of the overall procedure are explained below.
2.2. Local Demographic Features
Local demographic features, which are often not alterable by MSWAs, can have a pronounced effect on recycling performance. Hence, such influential local demographic features were used in this study to determine subgroups of MSWAs after the screening process.
Table 1 lists the local demographic features likely to have an impact on recycling performance. Local demographic features such as population density and distribution can reflect the population status of a region, whereas education level, income, municipal assets, and occupation are related to the properties of a municipal area. These factors facilitate demonstrating the consumption pattern and proportion of recyclables in the waste stream, which may reflect local urbanization. Similarly, the proportion of the aboriginal population, age group, and dependency ratio can be used as the determinants of rural or secluded areas. The number of hotels, tourists, and tourism activities can indicate the tourism features of an area. As there can be several factors related to local demographic features, it is often impossible to consider them all into account owing to uncertainties in data availability and frequencies. Hence, such factors need to be screened, and suitable factors should be selected depending on study criteria, data requirements, and availability. Details of factor screening and subgrouping are described later.
Different studies conducted in various regions have found a contrasting correlation between some local demographic features and recycling potential. The reference column in Table 1 was provided to illustrate the relevant literature studies which incorporated those features and presented their correlation with recycling potential. In Table 1, the term dependent refers to the contrasting results revealed in the different literature sources presented. For instance, Garces et al. (2002) demonstrated a negative correlation between salary/income level and recycling practices, indicating that people with high income have productive jobs/services and they do not have spare time to participate in such recycling programs and activities, whereas Chang et al. (2013) demonstrated a positive correlation between those variables, claiming that a high-income status leads to people practicing environmentally friendly behavior and developing positive attitudes toward recycling procedures. Such divergence in their results could be due to differences in region-specific socioeconomic circumstances, political influences, policies, governance, etc.
2.3. Input/Output Factors
Input and output factors can objectively represent the efficiency level of MSWAs once progression of those factors is analyzed. The performance of each MSWA within identical subgroups is evaluated on the basis of input involvement and targeted output achievement. These factors, after analysis, can serve as a basis for benchmark learning.
Table 2 demonstrates the possible input and output factors associated with resource recycling. The indicators of input and output factors and their respective definitions were based on the studies cited in the reference column of the table. Input factors included the resources invested such as allocated budget, manpower and equipment used, number of households served, waste collection frequency, and recycling promotion activities, whereas output factors were related to achievement gained such as amount of waste collected, resources recycled, and recycling rates. Input factors are subjectively invested by municipal authorities according to their policy objectives; thus, the number of input factors is comparatively greater than that of output factors. Since the goal of this study was to evaluate the recycling performance based on recycling efficiency, the rate of recycling or the quantity of recycled resources could be popular determinant output factors. As data availability and frequency of factors in use may vary across MSWAs, those factors under operation or consideration of each MSW authority should be screened, and appropriate factors should be selected on the basis of a field study, as explained in Section 2.4.
2.4. Screening
Screening was performed after the collection of crucial information related to local demographic features and input/output factors. Those factors/features which are not available or have high correlations should be avoided. As required information of each collected factor may not be obtained from all MSWAs, integration of factor screening principles including data availability and accessibility, data compliance, data monitoring and frequency, data integrity, and factor independence need to be considered. Moreover, those factors with a closer meaning according to the literature can be merged to reduce the number of factors. Selection of appropriate factors, by means of factor screening, facilitates obtaining reliable information on factors of interest and makes the overall evaluation process effective.
Among the possible local demographic features listed in Table 1, the relevant factors were selected using factor screening to represent specific characteristics of a recycling area. Population density, average income, and average education representing urban features, proportion of indigenous people and senior citizens (>60 years) representing rural features, and number of tourists and tourism spots representing tourism features were among the local demographic features considered under this study.
Similarly, among the input/output factors, four indicators were selected to fulfill the recycling performance evaluation objective of this study. Three input factors, namely, manpower involved, number of recycling vehicles, and promotional activities, and a single output factor, i.e., amount of recycled resources, were considered after final screening. Selected indicator such as the manpower involved was used to reflect the assigned human resources for MSW recycling. Similar is the case for the number of vehicles used in collection and recycling activities. The greater frequency of publicity for recycling activities represents a higher awareness level and probability of more waste recycling. Likewise, the amount of waste recycled was among the possible determinants of performance evaluation. These factors could provide the appropriate basis for recycling performance evaluation of each MSW authority.
2.5. Subgrouping
The screening was followed by the subgrouping of MSWAs on the basis of their local demographic features so that MSWAs with similar local demographic features would belong to an identical subgroup. The recognition of classified subgroups was based on the prominent local demographic features of MSWAs in this study. Four subgroups were classified: an urban subgroup with a higher population density, education, and income level, a rural subgroup with a higher proportion of indigenous and senior citizens, a tourism subgroup with higher tourist flow and tourism spots, and a general subgroup with less significant characteristics. This method was adopted to assist decision-makers in determining MSWAs’ proximity of resource involvement.
2.6. DEA for Performance Evaluation
The DEA method is applied to analyze the respective efficiency of DMUs in a subgroup via the screened input/output factors. Those DMUs with high efficiency can be used as benchmarks for other inefficient DMUs of the subgroups.
This study used the CCR [22] and BCC models [23] of DEA. The CCR model assumes constant returns to scale (fixed scale returns), whereas the BCC model allows variable returns to scale (variable scale returns). The efficiency of a DMU can be determined as a function of the weighted sum of its outputs and inputs, where the objective function and constraints are provided by the equations of CCR and BCC model. The equations of the CCR model are as follows:
where k denotes the index of a DMU, j refers to the index of output factors, s indicates the total number of output factors, is the nonnegative weight assigned to output factor j, Yjk represents the value of the DMU k on output factor j, i refers to the index of input factors, m indicates the total number of input factors, is the nonnegative weight assigned to input factor i, Xik represents the value of the DMU k on input factor i, and r indicates the index of total competitive DMUs (i.e., DMU-1, 2, …, n). The variables in the above equations are constrained to be non-negative.
Equation (1) represents the objective function, which is to maximize the weighted sum of DMU k’s output factors. Equation (2) shows the sum of weighted input factors for the given DMU k to prevent unbounded solutions. Similarly, Equation (3) indicates that the weighted sum of each individual DMU’s output factors should be less than or equal to the weighted sum of its input factors. For each DMU, the above equations (Equations (1)–(3)) are applied to form a linear model to determine its efficiency. Thus, n models must be established for the efficiencies of all DMUs.
The CCR model evaluates the overall efficiency (OE), while the BCC model evaluates the pure technical efficiency (PTE) and the net of scale effect/scale efficiency (SE). Technical efficiency refers to a DMU’s production performance with reference to the efficiency frontier, and scale efficiency refers to the optimum size of resources/scale of production. OE is the product of TE and SE.
The equations of the BCC model are as follows:
where represents an artificial variable relevant to the scale efficiency, which may be positive, negative, or zero, whereas other variables are constrained to be non-negative. Equation (4) represents the objective function, which is used to maximize the weighted sum of the DMU k’s output factors, with an addition of artificial variable, to identify the scale return status. Equation (5) shows the sum of weighted input factors for the given DMU k to prevent unbounded solutions. Similarly, Equation (6) indicates that the weighted sum of each individual DMU’s output factors should be less than or equal to weighted sum of its input factors, provided an artificial variable . For each DMU, the above equations (Equations (4)–(6)) are used to obtain the linear model to determine the overall efficiency. TE can be obtained by taking the ratio of output/input values of technically efficient reference points on the efficient frontier having the same scale size to the inputs/outputs value of the DMU to be evaluated. Similarly, SE can be obtained by dividing the value of OE by TE. The artificial variable enables the DMU to identify scale return status (RTS) (i.e, constant, increasing, or decreasing returns to scale); hence, the direction of operation scale adjustment for each DMU can be proposed.
DEA is followed by benchmark learning of DMUs. All DMUs in each subgroup are not equally efficient for resource consumption to yield optimum outputs. Benchmark learning enables the improvement of relative effectiveness of inefficient DMUs by following the efficient one (i.e., closer to local demographic features and input resources) and setting the performance goals accordingly.
3. Case Study
3.1. Case Background
This study analyzed 181 MSWAs of Taiwan for the evaluation of recycling performance. Data associated with local demographic features and input/output factors were collected from the relevant MSWAs, including cleaning units, environmental protection bureaus, and statistics. Data screening for local demographic features and input/output factors, along with subgrouping of MSWAs, was done as described above. The four subgroups, urban, rural, tourism, and general, were categorized on the basis of prominent local demographic features such as population density, average income, indigenous people and senior citizens, number of tourists etc. Similarly, the screened input factors included the manpower involved in recycling, total number of vehicles used, and number of promotional activities for waste recycling, whereas the output factor was the total amount of resources recycled.
DEA of the DMUs was performed in two different scenarios i.e., with and without subgrouping of DMUs, termed as the subgrouping scenario and unsegregated scenario, respectively. A comparative analysis of each DMU’s performance level in two different scenarios was carried out, allowing the provision of information to find the appropriate benchmarks for inefficient DMUs.
3.2. Scenario I: DEA for Subgroups
According to the local demographic features representing local characteristics, four subgroups were generated, namely, the urban, rural, tourism, and general subgroups. The DEA method was then applied to each subgroup. The urban subgroup represented the DMUs with higher population density, education, and income level, the rural subgroup featured a higher proportion of indigenous and senior citizens, the tourism subgroup had a higher number of tourists and tourism spots, and the general subgroup featured less significant characteristics. Those subgroups consisted of 28, 25, 33, and 95 MSWAs, respectively. An input-oriented DEA model was used to determine the efficiencies of DMUs. The concept of shortest average distance, i.e., the minimal distance required for the inefficient DMUs toward efficient DMUs/benchmarks [24,25], was adopted. A lower effort would be required for an inefficient DMU to achieve the targeted efficiency level if its distance to the respective benchmark is shorter.
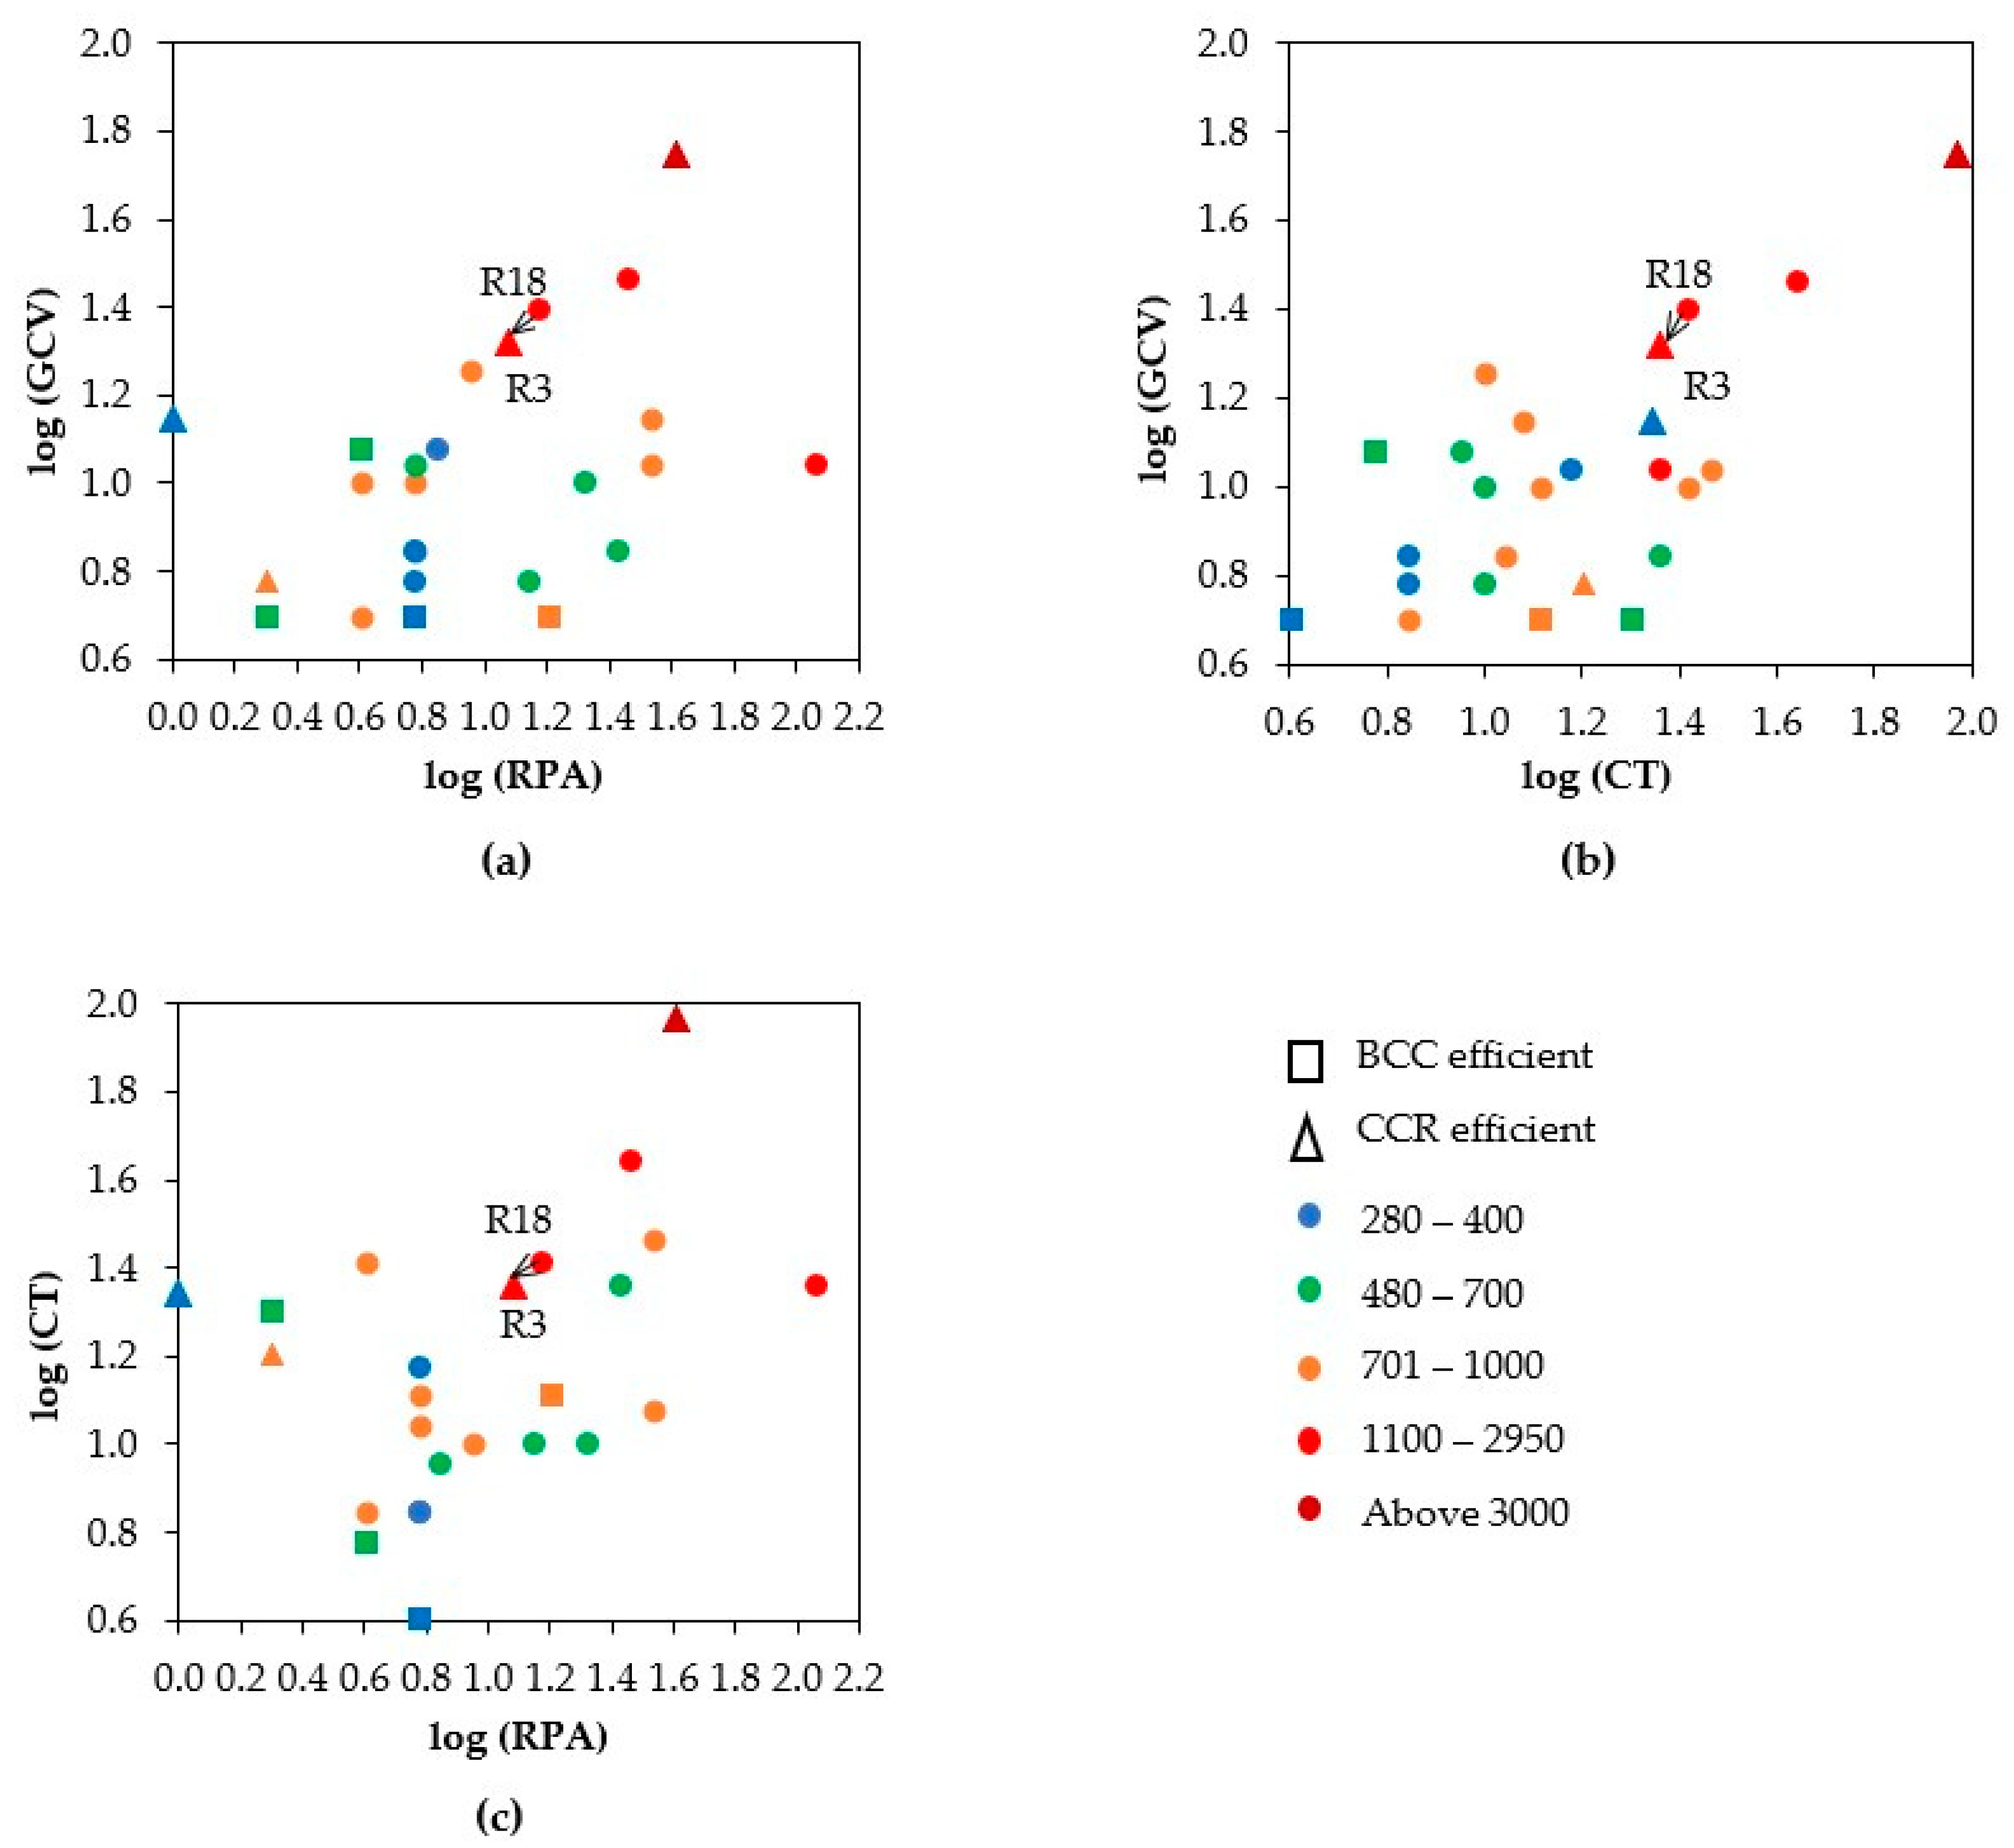
Figure 2 presents the determination of a benchmark target for each inefficient DMU in the rural subgroup after obtaining DEA results. The DMU inputs/output were standardized to avoid the impact of various units with different scales of values; however, to enhance readability of the given graph, the results were interpreted using logarithmic values indicating the respective number of inputs. The DEA results determined four CCR efficient, four BCC efficient, and 17 inefficient DMUs in the rural subgroup. Those efficient DMUs acted as benchmark targets for the respective inefficient DMUs based on their proximity/shortest average distance.
The position and distance (as denoted by arrows) between the inefficient DMUs and proximal benchmarks suggest how to increase the output by using the existing inputs or decreasing the input levels for current output levels to improve the efficiency. Figure 2a illustrates the status of garbage cleaning vehicles (GCVs) versus recycling promotion activities (RPAs), Figure 2b describes the status of GCVs versus the cleaning team (CT), and Figure 2c illustrates the status of CT versus RPAs. According to the varying output level (i.e., number of resources recycled), the DMUs were categorized with distinctive colors. Most DMUs were within the range of 701–1000, while only one DMU exceeded the output range of 3000 in each subfigure. An example of DEA application in benchmark learning is provided below.
Figure 2 demonstrates that R18 was inefficient in both CCR and BCC evaluation and, hence, could be guided by the nearby efficient R3 (CCR efficient). The input levels (RPA, GCV, CT) of R18 were greater than those of R3. Therefore, to reach the efficiency frontier, R18 should reduce the current input levels to obtain the same output by learning the resource consumption efficiency of R3. On the other hand, R18 may increase its output level with the existing inputs, identical to the input–output ratio of R3. It was found that R18 should either reduce its current input levels by 33.79%, 30.48%, and 26.78% for RPAs, GCVs, and CT, respectively, or increase its current output level by 26.4% with the existing inputs in order achieve efficiency.
Typically, DMUs with BCC efficiency which have not yet achieved CCR efficiency could follow the respective proximal CCR efficient DMU to adjust their scale of operation. However, in practice, greater expansion/shrinkage of the waste scale is hard to achieve for municipal solid waste authorities since waste collection services are mostly dependent on their administrative districts. The possible alternative to increase the operation scale might be to introduce centralized collection/treatment/disposal of waste for nearby districts. However, this is highly sensitive and sometimes may cause NIMBY effects.
Table 3 presents the result of DEA and the average values of input/output for efficient DMUs. All average input/output values for the rural subgroup were below the mean of all DMUs, while the average values for the urban subgroup were maximal among all subgroups and were much higher than the mean. This implies that, among the different subgroups, the urban subgroup had larger inputs/output and performance levels, whereas the rural subgroup’s inputs/output and performance levels were lower/minimal. DMUs in the urban subgroup were in densely populated areas. In such locations, resource/material consumption remains higher. Consequently, adequate recyclables can be collected with less effort, ultimately increasing the quantity of recycled products (output). Furthermore, those DMUs have the advantage of economies of scale due to the higher scale of operation. The scenario for the rural subgroup (DMUs) contrasts with the case of the urban subgroup.
The DEA results of efficiency elucidated four DMUs in the rural, nine in the general, four in the tourism, and six in the urban subgroups that were only technically efficient (BCC efficient), as well as four in the rural, four in the general, seven in the tourism, and eight in the urban subgroups that were both technically and scale efficient (CCR efficient).
3.3. Scenario II: DEA for Unsegregated Scenario
In this scenario, DEA was applied to the 181 DMUs without subgroups. Efficiency analysis of the DMUs and benchmark sorting for each inefficient DMU were conducted as previously described. Table 4 presents the results of efficiency analysis and standardized average values of input/output for the efficient DMUs. All the standardized values were above the mean, indicating that the efficient DMUs had a higher level of inputs and output, i.e., a larger scale of DMUs. In addition, the value for output, compared to the inputs, was distinctly greater, indicating a significantly better performance status of efficient DMUs in this scenario. The DEA result showed only 14 efficient DMUs, among which seven were only technically efficient (BCC), and seven were technically and scale efficient (CCR).
3.4. Comparative Analysis of Subgrouping and Unsegregated Scenario
DEA revealed contrasting findings regarding efficiency and benchmark learnings of the DMUs in two scenarios, i.e., subgroups and unsegregated. The potential benchmarks can be determined with the shortest average distance method for each inefficient DMU, where the distance can be used as a measure to assess the required efforts for the DMUs [24,26]. For a comparison of results in two scenarios, the average distances of all inefficient DMUs in the subgroups/group were used.
Table 5 presents the findings of average distance and efficiency status among the subgroups and the unsegregated scenario. Between the two scenarios, the unsegregated group revealed a higher average distance. This indicates that inefficient DMUs in the unsegregated group demand more effort than those in subgroups. Regarding efficiency analysis, a greater number of efficient DMUs from the urban subgroup were also efficient in the unsegregated scenario, whereas none of the efficient DMUs of the rural subgroup were efficient in the unsegregated scenario.
Among the subgroups, the urban subgroup, having high scale efficient DMUs (average standardized input/output values above the unsegregated mean), revealed the highest average distance. Similarly, the rural subgroup with lower scale efficient DMUs (average standardized input/output values below the unsegregated mean) had the shortest average distance. This implies that the average distance in each subgroup is determined by the input/output levels of efficient DMUs. In comparison to the unsegregated scenario, the shorter distances in the subgroups demonstrated a reduced level of heterogeneity across inefficient DMUs and their respective benchmarks. As a result, benchmark learnings for all inefficient DMUs in their respective subgroups could be more effective. Furthermore, when urban and rural areas were evaluated together, the DEA results tended to prefer efficient DMUs from more populated areas, as evidenced by the number of identical efficient DMUs between subgroups and the unsegregated scenario. These DMUs benefit from large-scale waste collection and economies of scale, resulting in higher outputs and performance levels. The findings support the premise that, if the local demographic features of DMUs are considered and categorized appropriately, a comprehensive evaluation of their performance and benchmark targets may be achieved (such as subgrouping in our case). This is particularly crucial for low-performing/disadvantaged groups of DMUs that require more resources/scale adjustments to enhance their efficiency levels while being in an unsegregated group. On the basis of these findings, this study recommends attempting essential procedures, such as subgrouping of the DMUs considering local demographic features prior to ultimate performance evaluation using statistical tools like DEA. DMU learnings can be aided by such an approach, allowing targeted efficiency levels to be achieved with minimal effort.
4. Conclusions
This study established a full procedure to analyze recycling efficiency, incorporating major recycling relevant factors after subgrouping MSWAs using local demographic features. The use of the proposed model may support reducing the arbitrary evaluation of performance status in the waste collection/recycling problem. The developed approach was demonstrated via a case study of MSWAs in Taiwan, and the results revealed the significance of incorporating local demographic features for the performance evaluation and benchmark learning of inefficient municipal authorities. Unlike the input/output factors relevant to MSWAs, local demographic features are hardly altered by MSWAs; hence, the study considered treating them separately before the performance analyses.
The subgroups formed for performance evaluation were more homogeneous, making the efficiency results objective in application, as proven by the comparative results in unsegregated and subgrouping scenarios. On the basis of the DEA findings for different scenarios, our study demonstrated that less effort is required for efficiency improvement in the subgrouping scenario, which was on average reduced by 61%, 41%, 17%, and 3% compared to that observed in the unsegregated scenario for the rural, general, tourism, and urban subgroups, respectively. These findings revealed that, in an unsegregated scenario, inefficient DMUs from rural subgroup require maximum effort to fulfill the efficiency targets, followed by those from general, tourism, and urban subgroups. The demographic features of an area may have different impacts on recycling performance due to the variations in culture, policy, economy, etc., nonetheless, it is still justifiable to cluster MSWAs which have similar local demographic features. In our study, the rural subgroup demonstrated the minimal average input-output scales, whereas the urban subgroup demonstrated the maximum. In addition, most of the inefficient DMUs in the rural subgroup had to adjust only one input factor, (mainly the recycling promotional activities) to become efficient; however, when they were evaluated in an unsegregated scenario, most of them were required to adjust all three input resources according to their respective benchmark targets, implying their inclination toward the urban scenario. Notable variations also existed with resource adjustments in two scenarios for inefficient DMUs from the general and tourism subgroups, whereas results were almost identical for those from the urban subgroup in both scenarios. The case of maximal resource adjustments observed for the unsegregated scenario may sometimes fail to fulfill the desired goal. The study showed that some local demographic features, including population density, occupation, and education, are associated with the observed results of recycling performance, and DEA was proven to be a suitable tool for resolving the recycling performance problem once the appropriate subgrouping procedures are followed.
The unavailability of crucial data related to some variables limited the further exploration of issues of recycling efficiency in our study. In addition, the correlations of some local demographic features (e.g., age, income, urban density etc.) with the recycling activity varied in different literature studies. Future studies may be directed toward the exploration of the underlying structure of factors influencing recycling efficiency to facilitate the incorporation of the local demographic features in the performance evaluation procedure. In addition, environmental issues likely to be associated with the collection and treatment process can be integrated, along with efficiency evaluation procedure, for recycling performance assessment.
Author Contributions
Conceptualization, H.-Y.L.; methodology, Y.-H.H. and H.-Y.L.; software, S.R. and Y.-H.H.; validation, S.R.; formal analysis, S.R., Y.-H.H. and H.-Y.L.; investigation, Y.-H.H.; resources, H.-Y.L.; data curation, S.R. and Y.-H.H.; writing—original draft preparation, H.-Y.L.; writing—review and editing, S.R. and H.-Y.L.; visualization, S.R. and H.-Y.L.; supervision, H.-Y.L. All authors have read and agreed to the published version of the manuscript.
Funding
This research received no external funding.
Institutional Review Board Statement
Not applicable.
Informed Consent Statement
Not applicable.
Data Availability Statement
Not applicable.
Conflicts of Interest
The authors declare no conflict of interest.
References
- Tseng, M.L.; Wong, W.P.; Soh, K.L. An overview of the substance of resource, conservation and recycling. Resour. Conserv. Recycl. 2018, 136, 367–375. [Google Scholar] [CrossRef]
- Taiwan Environmental Protection Administration. Yearbook of Environmental Protection Statistics; Taiwan Environmental Protection Administration: Taipei City, Taiwan, 2018; pp. 1–24.
- Worthington, A.C.; Dollery, B.E. Measuring Efficiency in Local Government: An Analysis of New South Wales Municipalities’ Domestic Waste Management Function. Policy Stud. J. 2001, 29. [Google Scholar] [CrossRef] [Green Version]
- Bosch, N.; Pedraja, F.; Suárez-Pandiello, J. Measuring the Efficiency of Spanish Municipal Refuse Collection Services. Local Gov. Stud. 2000, 26, 71–90. [Google Scholar] [CrossRef] [Green Version]
- Benito, B.; Bastida, F.; Garcia, J.A. Explaining differences in efficiency: An application to Spanish municipalities. Appl. Econ. 2010, 42, 515–528. [Google Scholar] [CrossRef] [Green Version]
- Garcés, C.; Lafuente, A.; Pedraja, M.; Rivera, P. Urban waste recycling behavior: Antecedents of participation in a selective collection program. Environ. Manag. 2002, 30, 378–390. [Google Scholar] [CrossRef] [PubMed]
- Babaei, A.A.; Alavi, N.; Goudarzi, G.; Teymouri, P.; Ahmadi, K.; Rafiee, M. Household recycling knowledge, attitudes and practices towards solid waste management. Resour. Conserv. Recycl. 2015, 102, 94–100. [Google Scholar] [CrossRef]
- Expósito, A.; Velasco, F. Municipal solid-waste recycling market and the European 2020 Horizon Strategy: A regional efficiency analysis in Spain. J. Clean. Prod. 2018, 172, 938–948. [Google Scholar] [CrossRef]
- Benito-López, B.; del Rocio, M.-E.M.; Solana-Ibañez, J. Determinants of efficiency in the provision of municipal street-cleaning and refuse collection services. Waste Manag. 2011, 31, 1099–1108. [Google Scholar] [CrossRef]
- Almasi, A.; Mohammadi, M.; Azizi, A.; Berizi, Z.; Shamsi, K.; Shahbazi, A.; Mosavi, S.A. Assessing the knowledge, attitude and practice of the kermanshahi women towards reducing, recycling and reusing of municipal solid waste. Resour. Conserv. Recycl. 2019, 141, 329–338. [Google Scholar] [CrossRef]
- Chang, D.S.; Liu, W.; Yeh, L.T. Incorporating the learning effect into data envelopment analysis to measure MSW recycling performance. Eur. J. Oper. Res. 2013, 229, 496–504. [Google Scholar] [CrossRef]
- Fioretti, G. The organizational learning curve. Eur. J. Oper. Res. 2007, 177, 1375–1384. [Google Scholar] [CrossRef]
- Tseng, S.F.; Lee, T.S.; Deng, C.Y. Cluster analysis of medical service resources at district hospitals in Taiwan, 2007–2011. J. Chin. Med. Assoc. 2015, 78, 732–745. [Google Scholar] [CrossRef] [Green Version]
- Wang, L.C.; Tsai, H.Y. Evaluation of highway maintenance performance using Data Envelopment Analysis (DEA) in Taiwan. J. Mar. Sci. Technol. 2009, 17, 145–155. [Google Scholar] [CrossRef]
- Yüksel, H. Evaluating the Success of Waste Collection Programs of Municipalities with Data Envelopment Analysis. Int. J. Environ. Prot. 2012, 2, 6–8. [Google Scholar]
- Halkos, G.; Petrou, K.N. Assessing 28 EU member states’ environmental efficiency in national waste generation with DEA. J. Clean. Prod. 2019, 208, 509–521. [Google Scholar] [CrossRef]
- Soobader, M.; Cubbin, C.; Gee, G.C.; Rosenbaum, A.; Laurenson, J. Levels of analysis for the study of environmental health disparities. Environ. Res. 2006, 102, 172–180. [Google Scholar] [CrossRef] [PubMed]
- Schweitzer, L. Environmental justice and hazmat transport: A spatial analysis in southern California. Transp. Res. Part D Transp. Environ. 2006, 11, 408–421. [Google Scholar] [CrossRef]
- Bel, G. Gasto municipal por el servicio de residuos sólidos urbanos. Revista Economia Aplicada 2006, 14, 5–32. [Google Scholar]
- Nolan, J.F.; Moore, A.T.; Segal, G. Putting out the Trash: Measuring Municipal Service Efficiency in U.S. Cities. SSRN Electron. J. 2005. [Google Scholar] [CrossRef] [Green Version]
- Fiala, P. Analýza efektivnosti odpadového hospodářství českých obcí metodou DEA. In Příspěvky k Metodologii Ex-Post Analýz v Politice Životního Prostředí; Šauer, P., Ed.; Oeconomica Publishing House: Prague, Czech Republic, 2007; Volume 2, pp. 87–105. [Google Scholar]
- Charnes, A.; Cooper, W.W.; Rhodes, E. Measuring the efficiency of decision making units. Eur. J. Oper. Res. 1978, 2, 429–444. [Google Scholar] [CrossRef]
- Banker, R.D.; Charnes, A.; Cooper, W.W. Some Models for Estimating Technical and Scale Inefficiencies in Data Envelopment Analysis. Manag. Sci. 1984, 30, 1078–1092. [Google Scholar] [CrossRef] [Green Version]
- Baek, C.; Lee, J.-d. The relevance of DEA benchmarking information and the Least-Distance Measure. Math. Comput. Model. 2009, 49, 265–275. [Google Scholar] [CrossRef]
- Aparicio, J.; Pastor, J.T. On how to properly calculate the Euclidean distance-based measure in DEA. Optimization 2014, 63, 421–432. [Google Scholar] [CrossRef]
- Aparicio, J.; Ruiz, J.L.; Sirvent, I. Closest targets and minimum distance to the Pareto-efficient frontier in DEA. J. Product. Anal. 2007, 28, 209–218. [Google Scholar] [CrossRef]
Figure 1.
Research flow chart.

Figure 2.
Input/output scenario and benchmark sorting by DEA model in rural subgroup: (a) resource promoting activities (RPAs) vs. garbage cleaning vehicle (GCVs); (b) cleaning team (CT) vs. garbage cleaning vehicles (GCVs); (c) resource promoting activities (RPAs) vs. cleaning team (CT).
Figure 2.
Input/output scenario and benchmark sorting by DEA model in rural subgroup: (a) resource promoting activities (RPAs) vs. garbage cleaning vehicle (GCVs); (b) cleaning team (CT) vs. garbage cleaning vehicles (GCVs); (c) resource promoting activities (RPAs) vs. cleaning team (CT).


Table 1.
Explanation of local demographic features.
| Local Demographic Features | Measurement/Units | Influence on Recycling Potential | References |
|---|---|---|---|
| Population density (similar features: population distribution, size) | capita/km2 | Positive | [3,17,18] |
| Budget (similar features: assets of municipality) | NTD/year | Dependent | [3] |
| Average salary (similar features: income) | NTD | Dependent | [6,11] |
| Education level | years in education * | Positive | [6,10] |
| Average age (similar features: proportion of adults, senior citizens) | year | Dependent | [6,7] |
| Occupation (similar features: labor force ratio, dependency ratio) | % | Positive | [7,10] |
| Urban, rural/aboriginal density | per km2 | Dependent | [3,6] |
| Number of tourist visits (similar feature: tourism activities, number of hotels) | number of tourists/years | Positive | [9,19] |
* Average years spent to obtain educational level of the adults.
Table 2.
Input/output factors of resource recycling.
| Factors | Indicators | Definition | References |
|---|---|---|---|
| Input | Collection frequency | Number of times of resources being collected | [3] |
| Resource recycling budget | Total waste management (clearance, disposal, and recycling) budget | [4] | |
| Number of waste disposal vehicles * | Total number of vehicles such as trucks and carts used for waste pick up, transport, disposal, and recycling | [3,5] | |
| Manpower involved in waste management * | Total waste management (cleaning, handling, and recycling) personnel | [10,16] | |
| Waste collection containers, equipment | Number of containers, equipment used in waste recycling | [4] | |
| Recycling campaigns * | Number of resource recycling training, promotional activities for MSW management | [10] | |
| Number of households to serve | Total number of houses to achieve recycling services in each municipality | [20] | |
| Output | Amount of waste collected | Total quantity of waste collection by MSW authority | [3,5] |
| Resources recycled * | Total amount of recycled resources | [21] | |
| Recycling rate | Recyclable collection as a proportion of total waste collection | [8] |
* Input and output factors selected after screening.
Table 3.
Efficiency analysis and average values of input/output for efficient DMUs.
| Subgroups | I/O (Standardized Value) | Number of DMUs | |||||
|---|---|---|---|---|---|---|---|
| I1 | I2 | I3 | O | Total | BCC Efficient | CCR Efficient | |
| Rural | −0.23 | −0.09 | −0.23 | −0.25 | 25 | 4 | 4 |
| General | −0.31 | −0.19 | 0.25 | 0.57 | 95 | 9 | 4 |
| Tourism | 0.13 | 0.19 | 0.16 | 0.42 | 33 | 4 | 7 |
| Urban | 1.23 | 0.41 | 1.23 | 1.43 | 28 | 6 | 8 |
Table 4.
Efficiency analysis and average values of input/output for efficient DMUs.
| Scenario | I/O (Standardized Value) | Number of DMUs | |||||
|---|---|---|---|---|---|---|---|
| I1 | I2 | I3 | O | Total | BCC Efficient | CCR Efficient | |
| Unsegregated | 0.08 | 0.18 | 0.80 | 1.17 | 181 | 7 | 7 |
Table 5.
Scenario analysis of efficiency and benchmark learning.
| Scenario | Subgroup | Average Distance | Number of DMUs | ||
|---|---|---|---|---|---|
| CCR Efficient | BCC Efficient | Total | |||
| Subgrouping | Rural | 15.08 | 4/0 * | 4/0 * | 25 |
| General | 22.90 | 4/3 * | 9/3 * | 95 | |
| Tourism | 32.11 | 7/1 * | 4/1 * | 33 | |
| Urban | 37.63 | 8/3 * | 6/3 * | 28 | |
| Unsegregated | - | 38.67 | 7 | 7 | 181 |
* Number of efficient DMUs from this subgroup that were also efficient in the unsegregated scenario.
Publisher’s Note: MDPI stays neutral with regard to jurisdictional claims in published maps and institutional affiliations. |
© 2021 by the authors. Licensee MDPI, Basel, Switzerland. This article is an open access article distributed under the terms and conditions of the Creative Commons Attribution (CC BY) license (https://creativecommons.org/licenses/by/4.0/).
Share and Cite
MDPI and ACS Style
Rijal, S.; Huang, Y.-H.; Lin, H.-Y. An Integrated Approach to Municipal Solid Waste Recycling Performance Evaluation by Incorporating Local Demographic Features. Sustainability 2021, 13, 10446. https://doi.org/10.3390/su131810446
AMA Style
Rijal S, Huang Y-H, Lin H-Y. An Integrated Approach to Municipal Solid Waste Recycling Performance Evaluation by Incorporating Local Demographic Features. Sustainability. 2021; 13(18):10446. https://doi.org/10.3390/su131810446
Chicago/Turabian StyleRijal, Sandhya, Yu-Han Huang, and Hung-Yueh Lin. 2021. "An Integrated Approach to Municipal Solid Waste Recycling Performance Evaluation by Incorporating Local Demographic Features" Sustainability 13, no. 18: 10446. https://doi.org/10.3390/su131810446
Note that from the first issue of 2016, this journal uses article numbers instead of page numbers. See further details here.