
Evaluation of Suitability of Urban Land Using GIS Technology

1
School of Architecture, Tianjin University, Tianjin 300072, China
2
Key Laboratory of Architectural Cultural Heritage Inheritance Information Technology Ministry of Culture and Tourism, Tianjin University, Tianjin 300072, China
3
Institute of Computer Technology and Information Security, Southern Federal University, 344006 Rostov-on-Don, Russia
4
Department of Information Technology, College of Computers and Information Technology, Taif University, P.O. Box 11099, Taif 21944, Saudi Arabia
*
Authors to whom correspondence should be addressed.
Sustainability 2021, 13(19), 10521; https://doi.org/10.3390/su131910521
Submission received: 21 June 2021
/
Revised: 12 September 2021
/
Accepted: 14 September 2021
/
Published: 22 September 2021
Abstract
:The accelerating speed of urbanization has a negative impact on environmental degradation, leading to the imbalance in land-use structure and scarcity of its resources. The imbalance of the existing land-use structure and function distribution, along with the scarcity of land resources, were improved in this article to provide people with more a rational use of land service space. This article specifically contributes to the establishment of an evaluation index system for the evaluation of the suitability of urban land using Geographic Information System (GIS) technology. The topographic aspect of the planning area was determined by the filling and excavation of depth factors and terrain elevation of the planning area. This article also contributes to determining the topographic slope of the planning area and evaluation index weight for the analysis of superposition factors. GIS data processing methods, document analysis methods, and mathematical models are used to evaluate the suitability of construction land. The results of geological engineering, geological foundation, environment, and geological disasters of the northern New Area of Yan’an are combined, and the appropriate evaluation indicators are selected. The results show that the prohibited planning construction area accounts for about 4% of the total planning area. Appropriate construction and more suitable construction in the entire region account for about 96%. The mountain system is connected in form and meaning, and a rainwater collection and management system is established. The proposed method of intercepting flood ditch at the foot of the mountain was designed and adopted, followed by eventual realization of rainwater recycling and safe flood control, making urban land use more reasonable. Therefore, urban land planning is provided with a reasonable reference basis.
1. Introduction
The advancement in the economy and technological dependence has led to the increasing demand for urban residential area in various countries around the world. Various serious issues have been raised due to the rapid increase in the urbanization rate such as air pollution, imbalanced land-use structure, lack of traffic management, and many more [1,2]. This situation has raised the social economic burden on the management and environment for optimization of urban residential land, requiring the help of various urban planning agencies. This raises the need for a reliable and quantified urban residential environment for building a more improved understanding of the process of urbanization. In order to analyze this viewpoint, various factors should be kept in mind to understand the complete scenario of a land-use factor. Figure 1 depicts the land-use factors which generally affect the urban land distribution.
In recent years, the population has continued to grow, and cities have developed rapidly. The range of activities people need is constantly increasing. Therefore, people’s demand for urban land is becoming stronger and stronger. The random development of urban land resources does not only damage the urban ecosystem but also leads to uncoordinated land use due to the imbalance in land-use structure and its function distribution. This urbanization process also wastes precious land resources and leads to the low utilization rate of land [3]. Therefore, reasonable urban expansion is very important for the sustainable use of land. To better understand the laws of urban land use, the dynamic changes of urban land expansion are studied. It is of great significance to the scientific planning of land expansion and the sustainable development of land.
GIS ideas and methods are comprehensively applied in this work based on the ideas of system theory and cybernetics, according to the different functions and characteristics of the city. Based on this scientific hypothesis, the appropriate mathematical models are selected to reflect these functions and characteristics. Achieving the quantification of the analysis process is key to embodying quantitative planning in the evaluation of urban land use [4]. Realizing the quantification, standardization, systemization, and information acquisition of urban land evaluation will become an important subject for scientifically evaluating the suitability of urban land. Based on the analysis and summary of the relevant theories of urban land suitability evaluation, the comprehensive evaluation method of urban land suitability based on GIS technology is explored [5].
The major contributions of this article are listed in the following points:
- It specifically contributes to the establishment of an evaluation index system for the evaluation of suitability of urban land using Geographic Information System (GIS) technology.
- The topographic aspect of the planning area was determined by the filling and excavation of depth factors and terrain elevation of the planning area.
- Determining the topographic slope of the planning area and evaluation index weight for the analysis of superposition factors.
- The proposed methodology involves GIS data processing methods, document analysis methods, and mathematical models being used to evaluate the suitability of construction land.
- This method of intercepting flood ditch at the foot of the mountain was designed and adopted, followed by eventual realization of rainwater recycling and safe flood control, making urban land use more reasonable. Therefore, urban land planning is provided with a reasonable reference basis.
The rest of this article is organized as follows: Section 2 presents the current literature in this field, providing the prior state of art from the existing sources of research. The methods along with the map and context and hierarchal overview of the methodology adopted are presented in Section 3. Section 4 depicts the results and discussion of the experimental outcomes followed by the concluding remarks in Section 5.
2. Literature Review
There are several land suitability methods defined in the literature for assessing crops using the qualitative and quantitative approaches. Some of these approaches use Boolean algebra [6], weighted linear combination methods [7], and various multiple regression approaches [8] for analyzing the statistics. Among the various traditional approaches, the categorical data for the qualitative approach are depicted in Table 1.
The literature presented in this table depicts various approaches utilized by food and agricultural organization for land suitability frameworks. Most of the identified tractional methods indicates that the socioeconomic data are minimal, and this is very critical in the case of conducting the assessment for crop suitability [16,17]. Some of the approaches also pointed out the limitations of using the ordinal linear combinations for addressing the problems which are needed to practice the non-linearity. It was also revealed that the suitability and vulnerability of the transcending approaches is more in the cases of qualitative and quantitative analyses. These limitations of the current state of the art method are addressed in this research work.
3. Methodology
The methodology of a comprehensive GIS-based system with appropriate mathematical models for the selection of functions and characteristics, for achieving the quantification of the analysis process for planning the evaluation of urban land use, was used. Acquisition of information for realizing the quantification of urban land evaluation will become an important subject for scientifically evaluating the suitability of urban land. The relevant theories of urban land suitability evaluation are explored in this article; the flowchart for map of context showing various steps of research incorporated in this article is presented in Figure 2; and the subsequent steps involved are detailed in the following sub-sections.
The methodology of this work leads to the establishment of an evaluation index system for the evaluation of suitability of urban land using Geographic Information System (GIS) technology. This article also explores the topographic aspect of the planning area which was determined by the filling and excavation of depth factors and terrain elevation of the planning area. The methodology of this work determines the topographic slope of the planning area and evaluation index weight for the analysis of superposition factors. It further involves GIS data processing methods, document analysis methods, and mathematical models being used to evaluate the suitability of construction land.
3.1. Overview of the Northern New Area of Yan’an
The Municipal Party Committee and the Municipal Government selected the planning project base in the northern New Area of Yan’an as the site selection. West of the new district is Yinjiagou; the northern part is Changqing Road and the north of Nianzhuanggou ridge line; the eastern part is Nianzhuanggou; and the southeast is the mountain facing the Changqing Highway. The Municipal Party Committee and the Municipal Government promote the economic development of the area. It is precisely because the planning project area is adjacent to the Dongchuan New Area in the north and the North Ring Road in the south. Moreover, Dongchuan New Area has developed commerce, many hotel companies gather there, and the flow of people is large [18]. The planning and design area is 28.8 km2. The development scope of the first phase is about 13.3 km2, and the start-up area and Municipal Party Committee and the Municipal Government are about 0.5 km2. GIS technology is used to generate highly 3D models. The current topography of the planning area is analyzed. In the current terrain, there are three communication roads running from north to south to Liuwanjiagou, Qiaoergou, east–west main mountain beam, and Dongshilipugou. The planning area is located at 935–1300 m. The lowest height is 945 m, and the highest height is 1280 m. The difference is 335 m.
3.2. Establishment of Evaluation Index System
Here, the current layout, structure, and scale of urban land in the planning new area were processed and analyzed using GIS technology. After that, the suitability of urban land construction was evaluated and analyzed by GIS analysis technology. Four evaluation index factors of terrain aspect, depth of fill and excavation, terrain elevation, and terrain slope were selected.
- (1)
- Topographic aspect of the planning area
The topographical slope of the planning area of the northern New Area of Yan’an faces north, and the northwest and northeast directions are relatively few. The terrain slopes are more southwest, southeast, and south. Moreover, the terrain has relatively large fluctuations, and the shape of the terrain finally revealed is also very complicated [19]. Based on this, the evaluation criteria of the slope are established, as shown in Table 2 below.
In China, since ancient times, because of better energy conservation, most areas have paid more attention to the question of which direction buildings are facing. Experience has concluded that the best architectural orientation is to the south, with the southwest as the main direction. In the planning new area, most of the slope after reconstruction is mainly south. The slope after the transformation is a relatively reasonable slope facing the sun, accounting for 60% of the planning area of the new area. The slope to the north is the most unsuitable direction, and there is no sun all year round. The west, east, and southeast are more suitable slope directions. The northeast and northwest are the construction orientations with low suitable slope.
- (2)
- Filling and excavation of depth factors
To refine the buildings, the buildings are classified according to the different depths of the fill. The building is subdivided into 12 grades with 10 m grade. The buildings present 0–10, 10–20, 20–30, 30–40, 40–50, 50–60, 60–70, 70–80, 80–90, 90–100, and 100–110 m. Generally speaking, the filling and excavation area can be planning as urban green space and spacious land. The land quality in this area is not stable; therefore, planning can avoid some safety problems due to the uneven deep foundation of the building [20]. Based on this, the evaluation criteria for the depth of filling and excavation are established, as shown in Figure 3.
Generally speaking, the excavation depth of construction land should not be greater than 40 m, based on the settlement of the soil and its related properties. In addition, the excavation area can be planning as a high-rise building area, because the loess quality of the excavation area is stable. However, if the depth of the filling depth is greater than 40 m, it is suitable for green space and not suitable for urban construction. If the filling depth is less than 40 m, then the soil quality is relatively stable, and it can be planned as a lower-level building.
- (3)
- Terrain elevation of the planning area
Finally, the construction elevation below 1165 m in the allowable range of the land is determined as a suitable construction area. Here, 1165–1245 m is not suitable for construction area. Above 1245 m is non-construction land. Because of the difficulty of urban infrastructure construction, the allowable construction elevation is considered. Since the quantity units are differentiated according to the different properties of each element, there is no comparability between the set evaluation factors [21]. Therefore, all collected data need to be standardized, so that the data in the evaluation factor set can be compared with each other. For this reason, the terrain elevation of the planning area is divided into 5 categories and assigned values. The number 1 represents a suitable construction area, and the number 5 represents an unsuitable construction area. From 1 to 5, the terrain elevation is re-divided, and the final grade elevation map of the slope type is generated. The evaluation criteria for the depth of filling and excavation are established, as shown in Figure 4 below.
The elevation of the planning area is mainly controlled between 1045 and 1105 m. The land suitable for construction accounts for 52.4% of the total land area. Lands with elevations of 990–1045 m and 1105–1155 m are suitable construction areas, accounting for 27.5% of the total land area. The planning land with a terrain elevation of 965–990 m and above 1235 m is regarded as unsuitable development land, accounting for 5.4% of the total land area [22]. However, the elevation within the range of 1155–1235 m can be used as a constructable area through a relatively large amount of engineering. This part accounts for 14.6% of the total planning area.
- (4)
- Topographic slope of the planning area
According to the nature and characteristics of the evaluation factor, different values are given. Combined with the size of the slope, the degree of impact of the construction land in this area is assigned a graded value. Obviously, the greater the slope, the less suitable for constructive land use. Then, 1–4 are set as the priority of the slope, and the values 1, 2, 3, and 4 are successively assigned. The smaller the slope of the terrain, the more suitable for construction land. The greater the slope, the less suitable for construction land. The evaluation criteria for the depth of filling and excavation are established, as shown in Figure 5 below.
After analysis, a slope of 5–15% needs to be constructed in the mountains. Because it is mainly distributed on the side of the channel and needs some technology to be constructed, his part accounts for 9% of the total planning area. The slope of suitable construction land is mainly concentrated in the southern part of the planning area, accounting for 62% of the total planning land. In addition, the slope is controlled at 0.4–35%, 0.4–5%. Only when the slope is within this range does it become more conducive to drainage, set up roads and place buildings. Land with a slope of 0–0.4% or more than 56% accounts for 5% of the total land area. This part can be used as green land ecological land, park construction land, and non-construction area.
3.3. Determination of Evaluation Index Weight
Weight refers to the relative importance of a certain index in comprehensive evaluation [23]. Based on the experience of researchers in related disciplines, setting appropriate weighting factors is extremely important for the results of geological evaluation of construction land [24]. It is necessary to use qualitative methods to conduct on-site surveys to obtain the degree of influence of the evaluation factors. The weight is obtained through professional methods, including fuzzy evaluation method, AHP, and Delphi method. The plan for the northern New Area of Yan’an is strictly operated through procedures, and a judgment matrix is obtained after completion.
Next, the step-type judgment matrix is constructed. There are 4 evaluation elements for this land-use planning. The set D = {1, 2, 3, 4} is set, and the two are compared to obtain the judgment matrix. Generally speaking, the quantization scale of the judgment matrix has 9 levels. The judgment matrix can indicate the importance of the evaluation factor. A value of 7 means strongly important, a value of 5 means obviously important, and a value of 3 means the former is slightly important. A value of 1 indicates that the two elements are equally important, and a value of 9 indicates they are extremely important. Further, 2, 4, 6, and 8 represent the middle value of the two.
Finally, the hierarchical single sorting and consistency check are carried out. According to the normalized eigenvalues solved by the square root, the weight ranking of the eigenvectors is checked [25].
- (1)
- The product S of the elements in each row is calculated:
- (2)
- The n-th root of S in each row is calculated:
- (3)
- The vector is normalized:
- (4)
- The largest eigenvalue of the matrix is calculated:is a variable, and i represents the ith index. j represents the jth index, and represents the category weight. (BW) is the ith element of the vector BW.
- (5)
- Consistency testThe test equation is:CR is a fuzzy subset of D and the random consistency ratio of the matrix.
3.4. Analysis of Superposition Factors
For location selection and suitability model construction, it is most appropriate to use the weighted overlay tool in GIS. The weighted overlay tool in GIS is used to solve the multi-criteria problem [26]. In its analysis, every step is executed. Overlay analysis must decompose the model into sub-models, determine the input layer, and define the problem.
The ArcGIS weighted sum tool is used for overlay analysis of evaluation factors. The corresponding values are entered into the ArcGIS system, and conclusions can be drawn. The principle is that each is multiplied by the corresponding weight to add up and finally achieve superposition [27,28].
The comprehensive evaluation index indicates the extent of construction in the planning area. The lower the comprehensive evaluation index, the less suitable for land construction. The higher the index, the more suitable for construction. Through the comprehensive evaluation index, the level of land suitability construction is divided. The entire evaluation process has to go through the selection of evaluation factors, normalization, reclassification, weighting, and superimposition of the analysis process.
4. Results and Discussion
4.1. Analysis on the Evaluation Results of Land-Use Suitability in the New Planning Area
The suitability level and degree of impact of subdivided construction land need to consider the characteristics and distribution of the current topography of the planning new area [29,30]. The northern New Area of Yan’an has many mountain structures and complex topography, which poses certain limitations to the construction of urban land. Combining the four major influencing factors mentioned above and analyzing through the GIS system, the suitability construction distribution map is obtained. According to the above calculation method, the degree of influence of each evaluation factor is obtained. Then, through the ArcGIS weighted synthesis tool, the weight of the construction land is obtained. Figure 6 shows the resulting weight map. According to the result of the superposition analysis, the suitability construction level of the planning new area is divided into three types: suitable construction area, generally suitable construction area, and unsuitable construction area. Finally, Figure 7 shows the most suitable construction land area, which is about 80% of the total planning area. The banned construction area occupies the smallest land area, about 4% of the total planning area.
Unsuitable construction land is mainly distributed at the backbone of the mountains in the planning new area. The filling area larger than 40 m contains more than 55% slope. The loess quality in this area is not stable and suffers from natural disasters throughout the year. This area is unsuitable land construction. To ensure people’s personal safety and property, all construction related to human activities is prohibited. This area covers an area of 1.152 HA, accounting for 4% of the total planning land area. Generally, the construction of suitable land mainly includes a slope of 15–55%, and the distribution is relatively scattered. Generally suitable land is suitable for the construction of ecological green space to protect the natural environment. The area covers an area of 4.608 HA, accounting for 16% of the total planning area. If certain engineering techniques are used, generally suitable land can also be used as constructive land. The loess quality of the suitable construction land is stable and suitable for the construction for various activities. The distribution of suitable construction land is also concentrated. The terrain slope factor has little effect on the construction of this area. The aspect is also more suitable for construction. The area covers an area of 23.04 HA, accounting for about 80% of the total planning area. In summary, this area can be used as a centralized construction land. Observing the laws of nature is a prerequisite for building a city. It is the responsibility of each of us to protect the ecological region. Then, the construction land needs to protect the good original conditions of the original land. At the right time, the appropriate methods and technologies are used to plan urban construction scientifically and rationally.
4.2. Analysis of Safety Planning for Ecological Protection
A large amount of filling and excavation is required at the edge of the land topography transformation, which changes the original land shape. Then, natural disasters must be prevented at this time to protect the terrain and slopes. Figure 8 below shows the design of the slope protection.
Figure 8 shows the design requirements for slope protection. The minimum protection slope is not recommended to be less than 45 degrees. If the protection slope is less than 45 degrees, it leads to an excessively large area and a waste of land resources. The protection slope is greater than 60 degrees, which is prone to landslides, and the safety factor is not high. Therefore, the range of the protective slope should be controlled between 45 and 60 degrees.
Figure 9 shows the protective slope of the filling area. The protective slope forms a gentle green slope, and fills the edge of the filling to integrate it with nature.
The excavation area is divided into the edge of excavation within 10 m protection slope, 10–20 m edge zone protection slope, 20–30 m excavation edge zone protection slope, and over 30 m excavation edge zone protection slope. The 10–20 m edge protection slope construction land is retreated 45 m to protect the side slope withdrawal. The 10–20 m edge protection slope construction land is designed as a stepped small platform. The small platforms are generally designed to be 3.2–4.2 m wide with a vertical spacing of 8.2–12.2 m. This can make the slope smooth and prolong the service life. The edge protection construction land within 10 m is set back by 45 m, and it is more appropriate to plan it as a green slope. Figure 10 shows the edge protection slope of 20–30 m. The gradually increasing design slope is safer and more economical.
Figure 11 shows a cut edge slope protection greater than 30 m. The building retreat area is 95 m for slope protection with multiple retreats. A step-like low slope is formed step by step. Considering safety factors and preventing rain erosion, the slope should be controlled between 45° and 38°. In the end, a stepped low-steep slope with a slope angle greater than 65 degrees is selected to reduce rain damage to the slope.
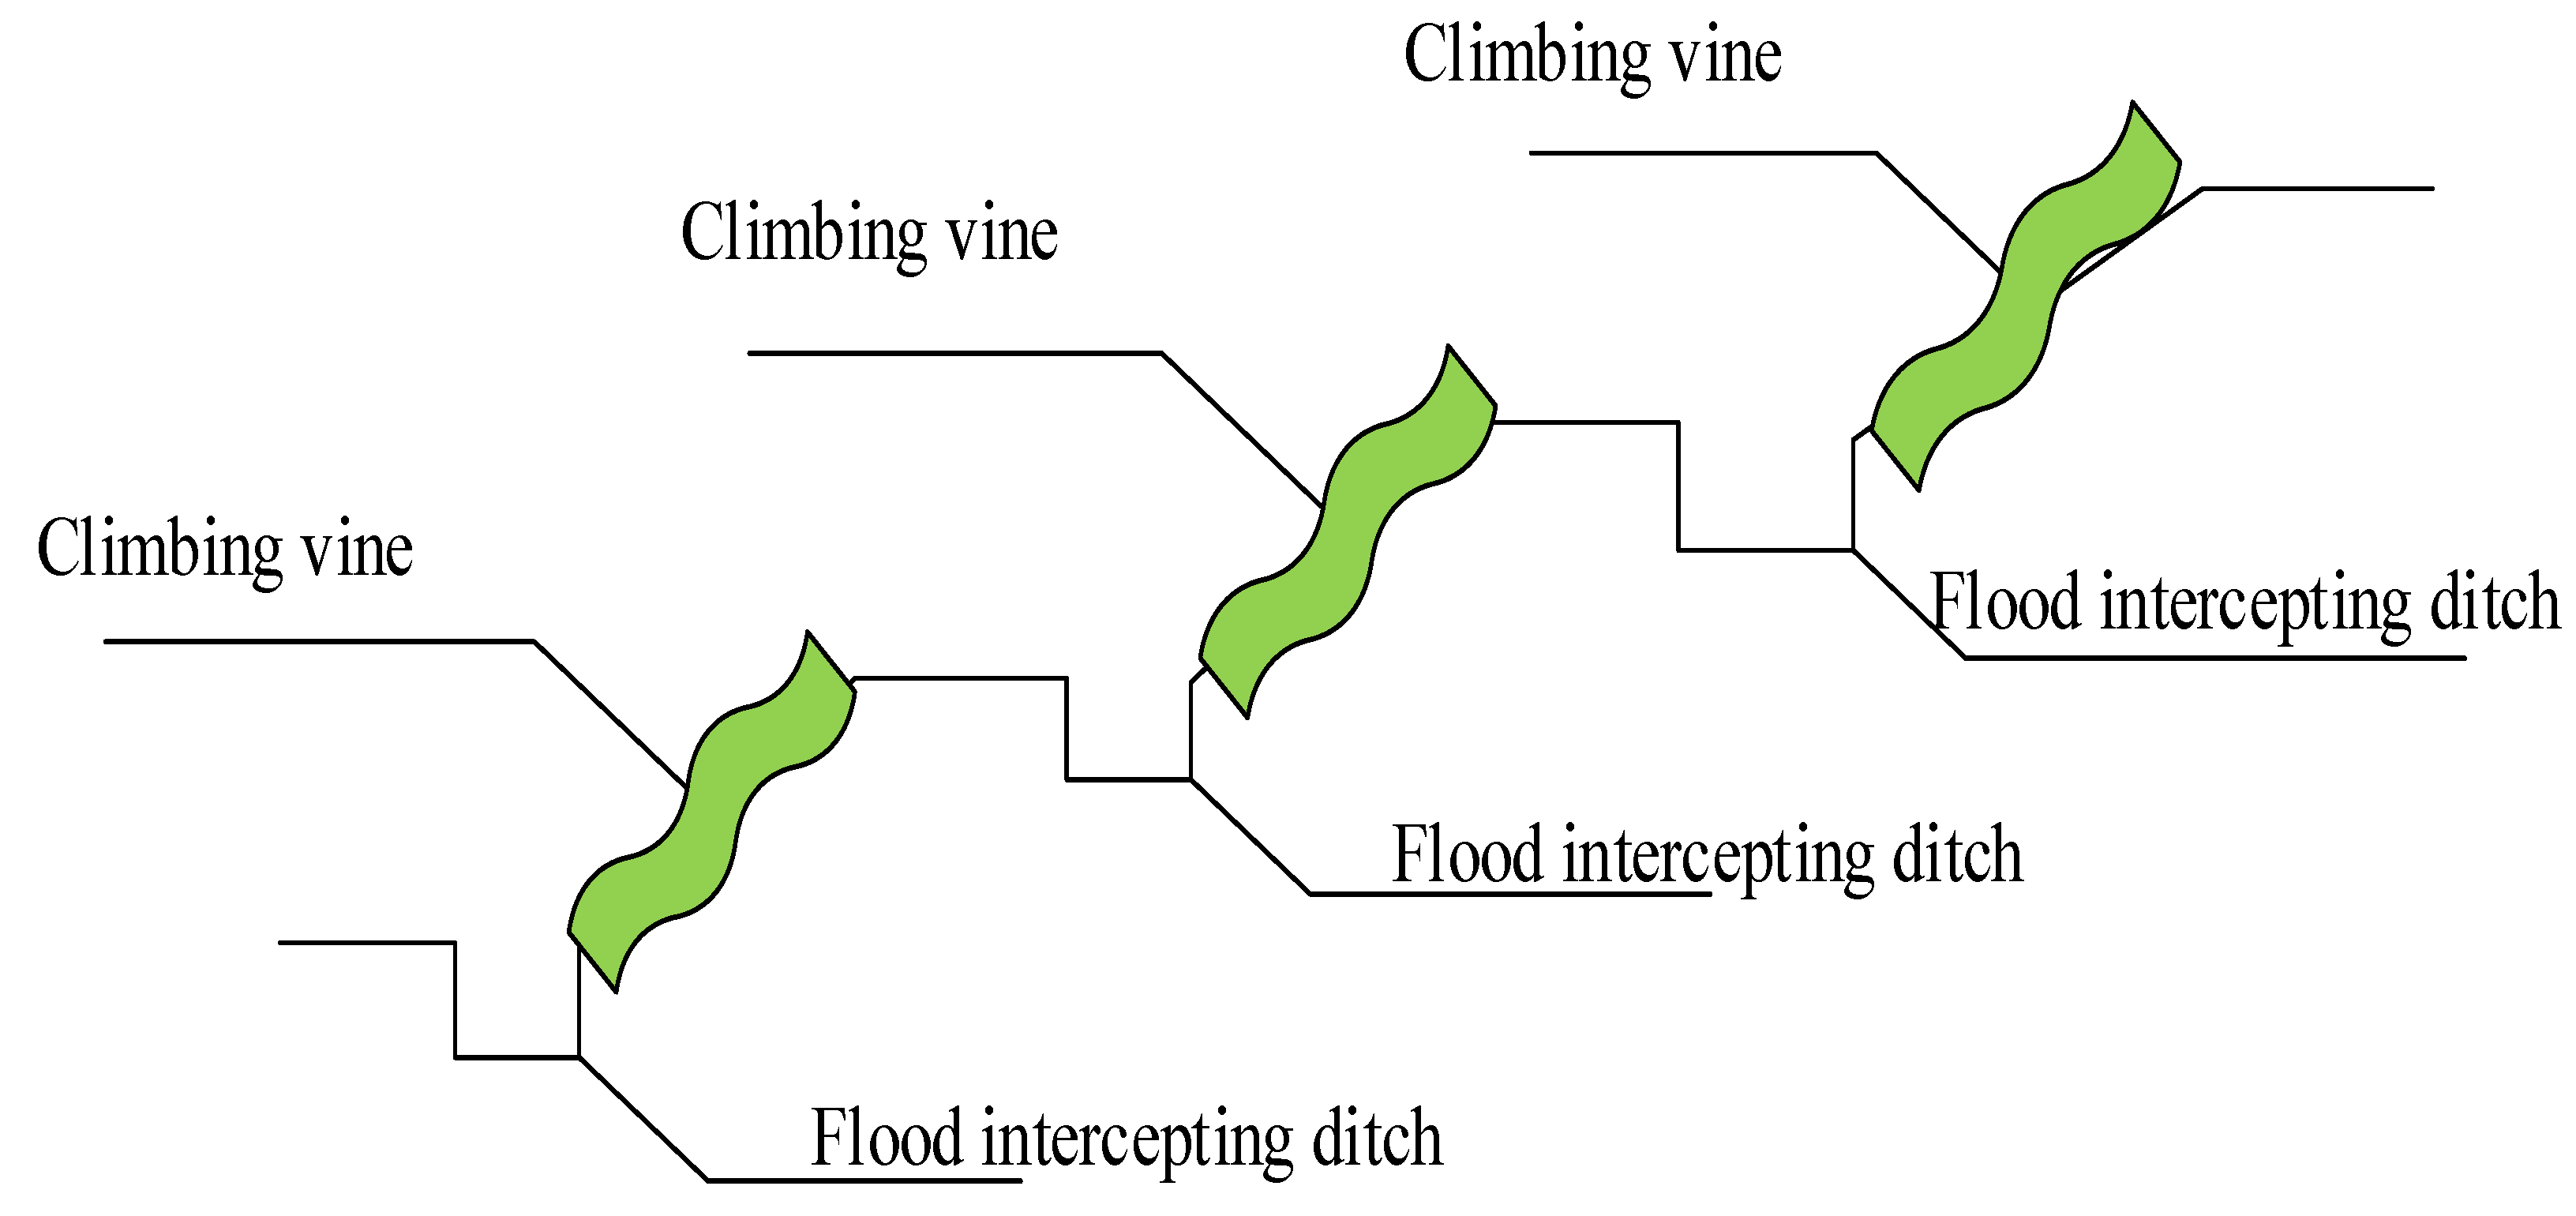
In summary, slopes of different heights need to be protected in different ways. A slope greater than 30° needs to emphasize its safety and ecology. With a slope of less than 30° in consideration of safety and ecological conditions, the required activity area should be designed. The flood control ditch at the foot of the mountain must be set up. Meanwhile, to prevent the occurrence of flood disasters, rainwater collection, flood control, and other corresponding projects must be established.
4.3. Plan the Land Layout According to the Evaluation Results
Based on the above analysis and elaboration, with a scientific point of view and the rationality of construction as the starting point, the land construction plan for the planning new area is drawn. In accordance with the topographic characteristics of the northern New Area of Yan’an, the shape and form connected with form and meaning are finally formed. In general, the pattern still maintains the original continuity in the east–west direction. According to the plan of the land construction plan, the north and south will carry out the construction design according to the requirements. According to the concept of mountain management, city management, ecological stability, and safety first, the overall layout of the original ecological and economical, safe, and innovative landform planning is designed [29].
5. Conclusions
This article uses the economics, physical geography, population distribution, and society of the planning new area as the starting point of the research. The research work selects the appropriate evaluation factors and corresponding evaluation indicators for proper mathematical modeling. The entire proposed analysis is quantified, and the evaluation of the suitability of the land forms an intuitive assumption, which benefits from the scientific use of GIS system. According to the current characteristics of the new area, the evaluation factors of the dominant factors in the planning new area are analyzed and evaluated. The multi-objective approach is used in this work for the evaluation of the suitability of land construction. The adaptability evaluation results of the study area are divided into three categories: suitable for construction, generally suitable for construction, and unsuitable for construction. The scale and layout of these three types of areas were qualitatively analyzed, respectively. This article significantly constructs and maximizes the planning of the new area, while analyzing the current situation of land use, conducting land-use evaluation, and proposing land-use construction strategies.
Author Contributions
Conceptualization, Y.Z. and Y.Y.; methodology, Y.Y.; software, Y.Y. and Y.Z.; validation, Y.Y. A.S. and Y.Z.; formal analysis, A.S. and J.F.A.-A.; investigation, Y.Z. and A.S.; resources, A.S. and J.F.A.-A.; data curation, Y.Y. and Y.Z.; writing—original draft preparation, Y.Z. and A.S.; writing—review and editing, A.S. and J.F.A.-A.; visualization, J.F.A.-A. and Y.Y.; supervision, Y.Y., A.S. and J.F.A.-A.; project administration, J.F.A.-A. and Y.Y.; funding acquisition, J.F.A.-A. All authors have read and agreed to the published version of the manuscript.
Funding
Taif University Researchers Supporting Project number (TURSP-2020/211), Taif University, Taif, Saudi Arabia.
Informed Consent Statement
Not applicable.
Acknowledgments
This paper is a general project of the National Natural Science Foundation of China (No. 51878439), and the authors are grateful for the support of Taif University Researchers Supporting Project number (TURSP-2020/211), Taif University, Taif, Saudi Arabia. The research is supported by postdoc fellowship granted by the Institute of Computer Technologies and Information Security, Southern Federal University, project No PD/20-03-KT.
Conflicts of Interest
The authors declare no conflict of interest.
References
- Mondal, B.; Das, D.N. How residential compactness and attractiveness can be shaped by environmental amenities in an industrial city? Sustain. Cities Soc. 2018, 41, 363–377. [Google Scholar] [CrossRef]
- Zellner, M.L.; Theis, T.L.; Karunanithi, A.T.; Garmestani, A.S.; Cabezas, H. A new framework for urban sus-tainability assessments: Linking complexity, information and policy. Comput. Environ. Urban Syst. 2008, 32, 474–488. [Google Scholar] [CrossRef] [Green Version]
- Qiong, J.; Andrey, Z. Study on ecological evaluation of urban land based on GIS and RS technology. Arab. J. Geosci. 2021, 14, 1–8. [Google Scholar]
- Marcella, S.V.; Juan, P.M.D. City Logistics in historic centers: Multi-Criteria Evaluation in GIS for city of Salvador (Bahia–Brazil). Case Stud. Transp. Policy 2019, 7, 772–780. [Google Scholar]
- Qin, X.F.; Qin, P. Evaluation of the Suitability of Urban Construction Land—A Case Study of Hudai Town. Urban. Land Use 2019, 7, 1–10. [Google Scholar] [CrossRef]
- Hoseini, Y.; Kamrani, M. Using a fuzzy logic decision system to optimize the land suitability evaluation for a sprinkler irrigation method. Outlook Agric. 2018, 47, 298–307. [Google Scholar] [CrossRef]
- Hassan, I.; Javed, M.A.; Asif, M.; Luqman, M.; Ahmad, S.R.; Ahmad, A.; Akhtar, S.; Hussain, B. Weighted overlay based land suitability analysis of agriculture land in Azad Jammu and Kashmir using GIS and AHP. Pak. J. Agric. Sci. 2020, 57, 1509–1519. [Google Scholar]
- Silva-Gallegos, J.J.; Aguirre-Salado, C.A.; Miranda-Aragón, L.; Sánchez-Díaz, G.; Valdez-Lazalde, J.R.; Pedroza-Carneiro, J.W.; Flores-Cano, J.A. Locating potential zones for cultivating Stevia rebaudiana in Mexico: Weighted linear com-bination approach. Sugar Tech 2017, 19, 206–218. [Google Scholar] [CrossRef]
- Bagherzadeh, A.; Gholizadeh, A. Modeling land suitability evaluation for wheat production by parametric and TOPSIS approaches using GIS, northeast of Iran. Model. Earth Syst. Environ. 2016, 2, 1–11. [Google Scholar] [CrossRef] [Green Version]
- Bagherzadeh, A.; Ghadiri, E.; Darban, A.R.S.; Gholizadeh, A. Land suitability modeling by parametric-based neural networks and fuzzy methods for soybean production in a semi-arid region. Model. Earth Syst. Environ. 2016, 2, 104. [Google Scholar] [CrossRef] [Green Version]
- Danvi, A.; Jütten, T.; Giertz, S.; Zwart, S.; Diekkrüger, B. A spatially explicit approach to assess the suitability for rice cultivation in an inland valley in central Benin. Agric. Water Manag. 2016, 177, 95–106. [Google Scholar] [CrossRef]
- Deng, F.; Li, X.; Wang, H.; Zhang, M.; Li, R.; Li, X. GIS-based assessment of land suitability for alfalfa cultivation: A case study in the dry continental steppes of northern China. Span. J. Agric. Res. 2014, 12, 364–375. [Google Scholar] [CrossRef] [Green Version]
- Estes, L.D.; Bradley, B.A.; Beukes, H.; Hole, D.G.; Lau, M.; Oppenheimer, M.G.; Schulze, R.; Tadross, M.A.; Turner, W.R. Comparing mechanistic and empirical model projections of crop suitability and productivity: Implications for ecological forecasting. Glob. Ecol. Biogeogr. 2013, 22, 1007–1018. [Google Scholar] [CrossRef]
- López-Blanco, J.; Pérez-Damián, J.L.; Conde-Álvarez, A.C.; Gómez-Díaz, J.D.; Monterroso-Rivas, A.I. Land suitability levels for rainfed maize under current conditions and climate change projections in Mexico. Outlook Agric. 2018, 47, 181–191. [Google Scholar] [CrossRef]
- Raza, S.M.H.; Mahmood, S.A.; Khan, A.A.; Liesenberg, V. Delineation of Potential Sites for Rice Cultivation Through Multi-Criteria Evaluation (MCE) Using Remote Sensing and GIS. Int. J. Plant Prod. 2017, 12, 1–11. [Google Scholar] [CrossRef] [Green Version]
- Veselov, G.; Tselykh, A.; Sharma, A.; Huang, R. Applications of Artificial Intelligence in Evolution of Smart Cities and Societies. Informatica 2021, 45. [Google Scholar] [CrossRef]
- Leroux, L.; Castets, M.; Baron, C.; Escorihuela, M.-J.; Bégué, A.; Seen, D.L. Maize yield estimation in West Africa from crop process-induced combinations of multi-domain remote sensing indices. Eur. J. Agron. 2019, 108, 11–26. [Google Scholar] [CrossRef]
- Ullah, K.M.; Mansourian, A. Evaluation of Land Suitability for Urban Land-Use Planning: Case Study D haka City. Trans. GIS 2016, 20, 20–37. [Google Scholar] [CrossRef]
- Sakieh, Y.; Salmanmahiny, A.; Jafarnezhad, J.; Mehri, A.; Kamyab, H.; Galdavi, S. Evaluating the strategy of decentralized urban land-use planning in a developing region. Land Use Policy 2015, 48, 534–551. [Google Scholar] [CrossRef]
- Liu, R.; Zhang, K.; Zhang, Z.; Borthwick, A.G. Land-use suitability analysis for urban development in Beijing. J. Environ. Manag. 2014, 145, 170–179. [Google Scholar] [CrossRef] [Green Version]
- Terzi, F.; Tezer, A.; Turkay, Z.; Uzun, O.; Köylü, P.; Karacor, E.; Kaya, M. An ecosystem services-based approach for decision-making in urban planning. J. Environ. Plan. Manag. 2020, 63, 433–452. [Google Scholar] [CrossRef]
- Ma, D.X.; Zeng, C.Q.; Ai, Q. GIS Technology Applied in Urban Plot Ratio Statistics and Land Suitability Evaluation. In Applied Mechanics and Materials; Trans Tech Publications Ltd.: Freienbach, Switzerland, 2014; Volume 638, pp. 2146–2150. [Google Scholar]
- Zhang, X.; Fang, C.; Wang, Z.; Ma, H. Urban construction land suitability evaluation based on improved multi-criteria evaluation based on GIS (MCE-GIS): Case of New Hefei City, China. Chin. Geogr. Sci. 2013, 23, 740–753. [Google Scholar] [CrossRef] [Green Version]
- Madaminovich, A.B. The use of gis technology to create electronic environmental maps. ACADEMICIA Int. Multidiscip. Res. J. 2020, 10, 438–440. [Google Scholar] [CrossRef]
- Liu, X.; Wang, Y.; Li, M. How to Identify Future Priority Areas for Urban Development: An Approach of Urban Construction Land Suitability in Ecological Sensitive Areas. Int. J. Environ. Res. Public Health. 2021, 18, 4252. [Google Scholar] [CrossRef]
- Wu, M. Application of urban planning and design in Yan’an new area based on GIS technology. Arab. J. Geosci. 2021, 14, 1–11. [Google Scholar]
- Andreev, D.V. Possibilities of GIS technologies in the mining industry. IOP Conf. Ser. Earth Environ. Sci. 2021, 677, 032090. [Google Scholar] [CrossRef]
- Duan, J.; Huang, J.; Chen, Y.; Du, K. Research on Eco-geological Environment Carrying Capacity Based on GIS Technology. IOP Conf. Ser. Earth Environ. Sci. 2021, 651, 042003. [Google Scholar] [CrossRef]
- Ruzikulova, O.; Sabitova, N.; Kholdorova, G. The role of GIS technology in determining irrigated geosystems. E3S Web Conf. 2021, 227, 03004. [Google Scholar] [CrossRef]
- Hossain, M.; Masud, M. Evaluating software usability of geographic information system. Int. J. Comput. Internet Manag. 2009, 17, 37–54. [Google Scholar]
Figure 1.
Land-use factors affecting the urban land distribution.
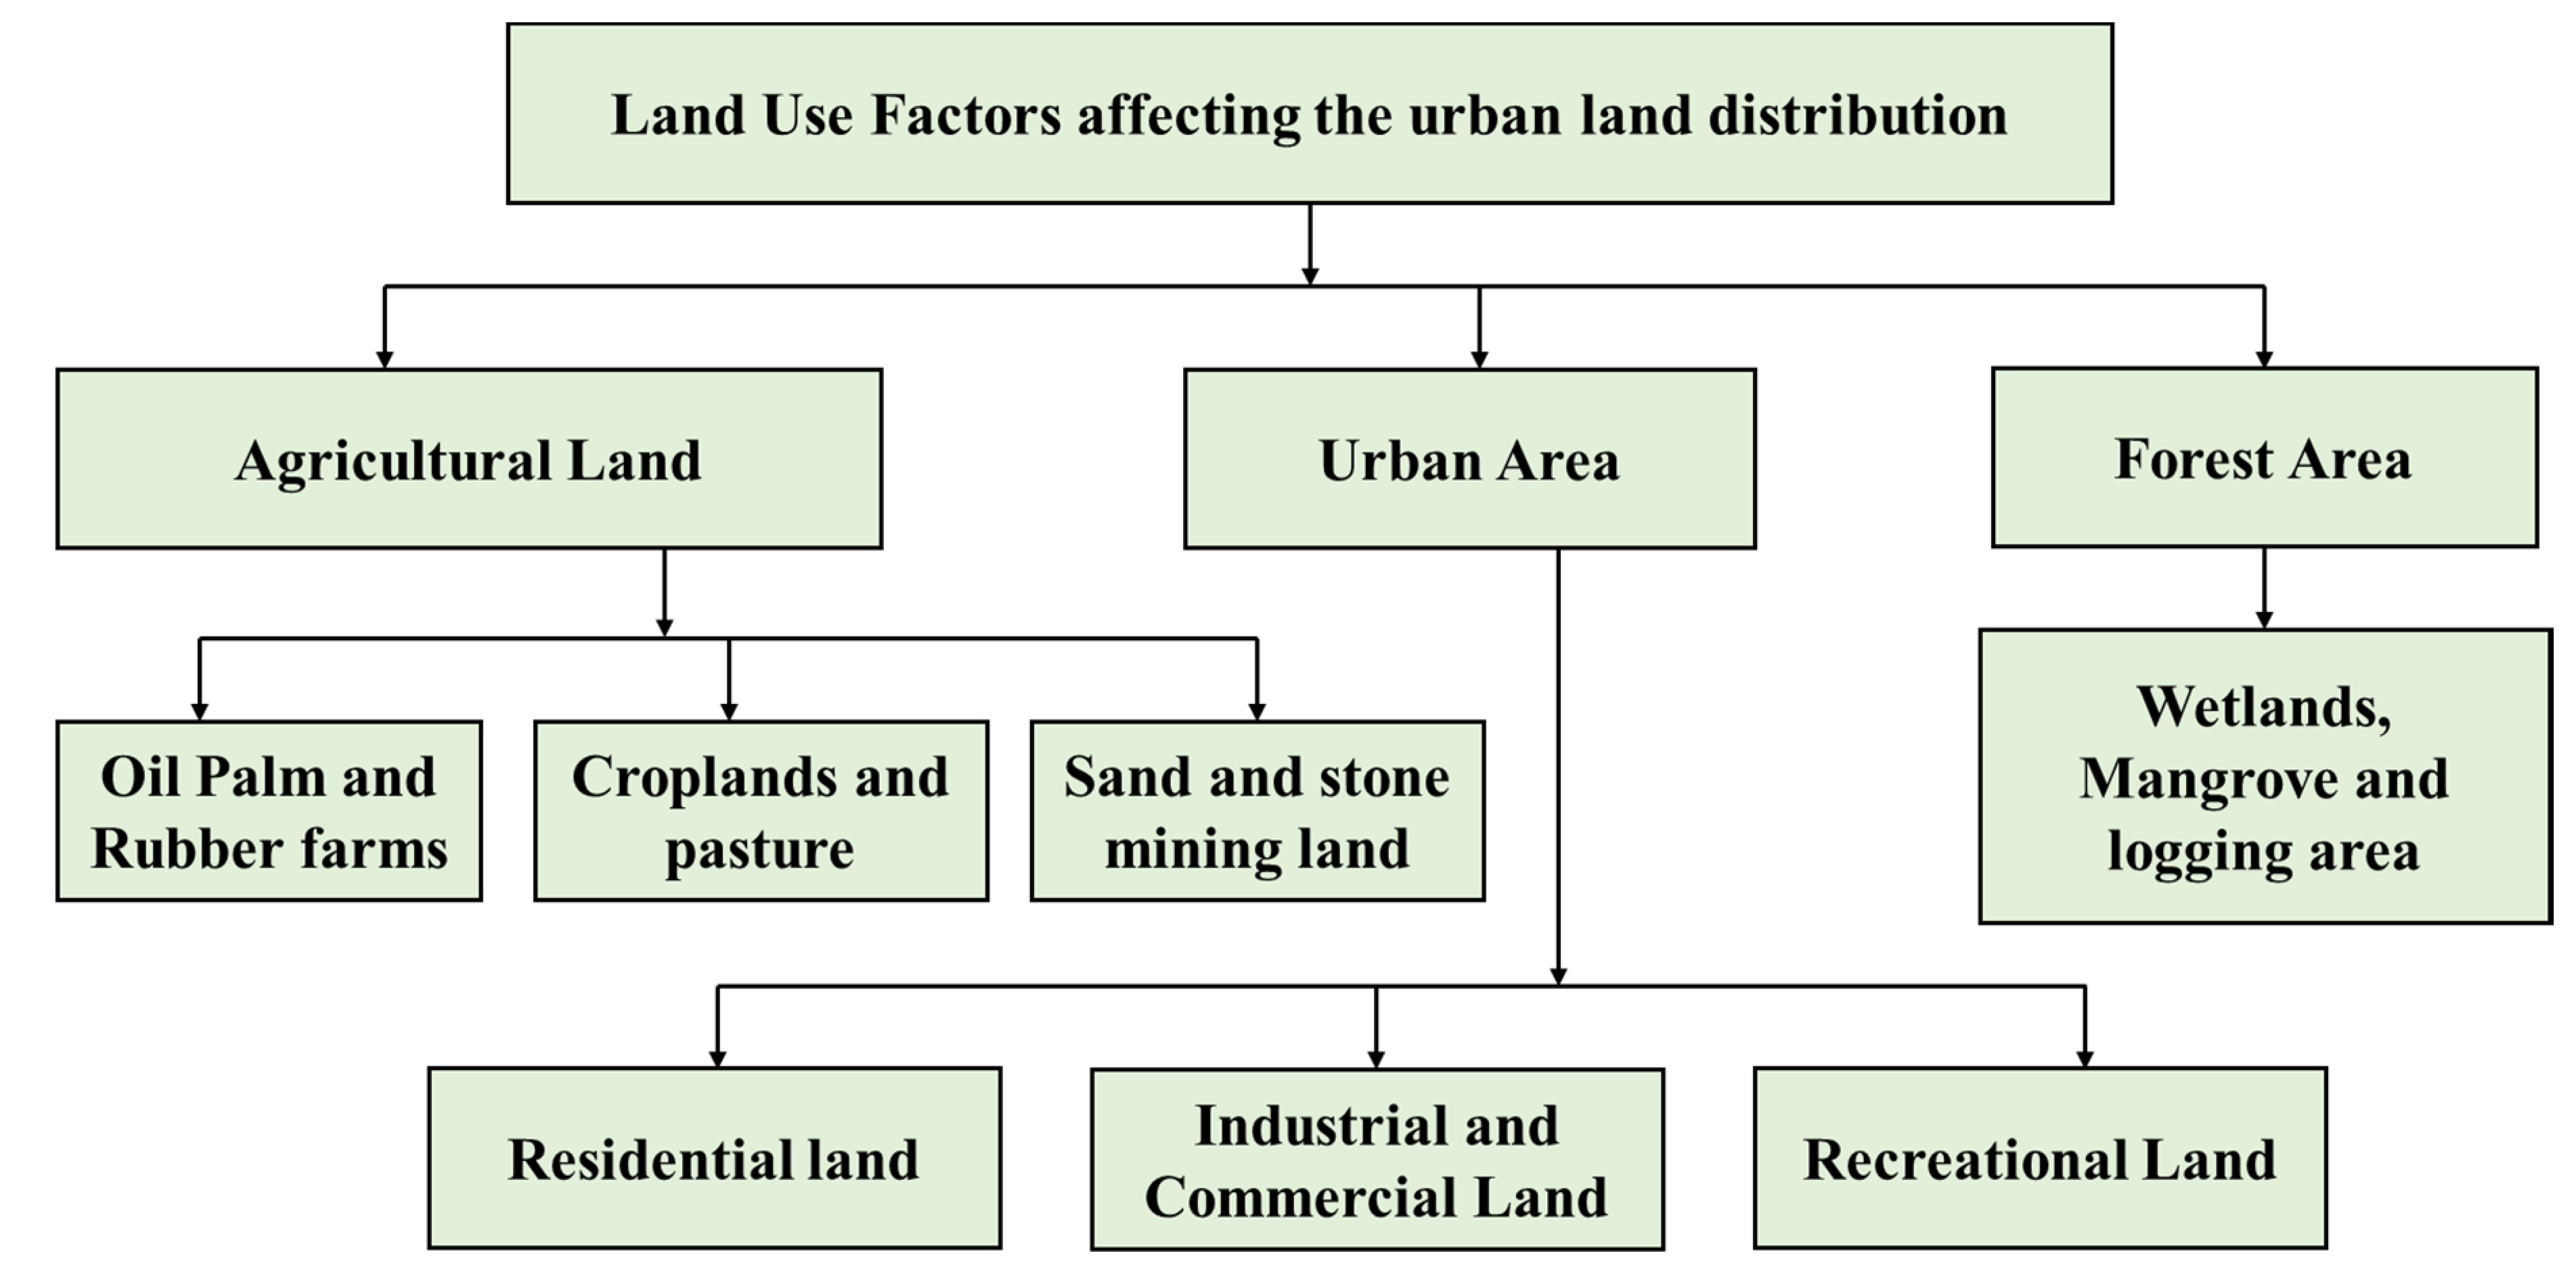
Figure 2.
Land-use factors affecting the urban land distribution.
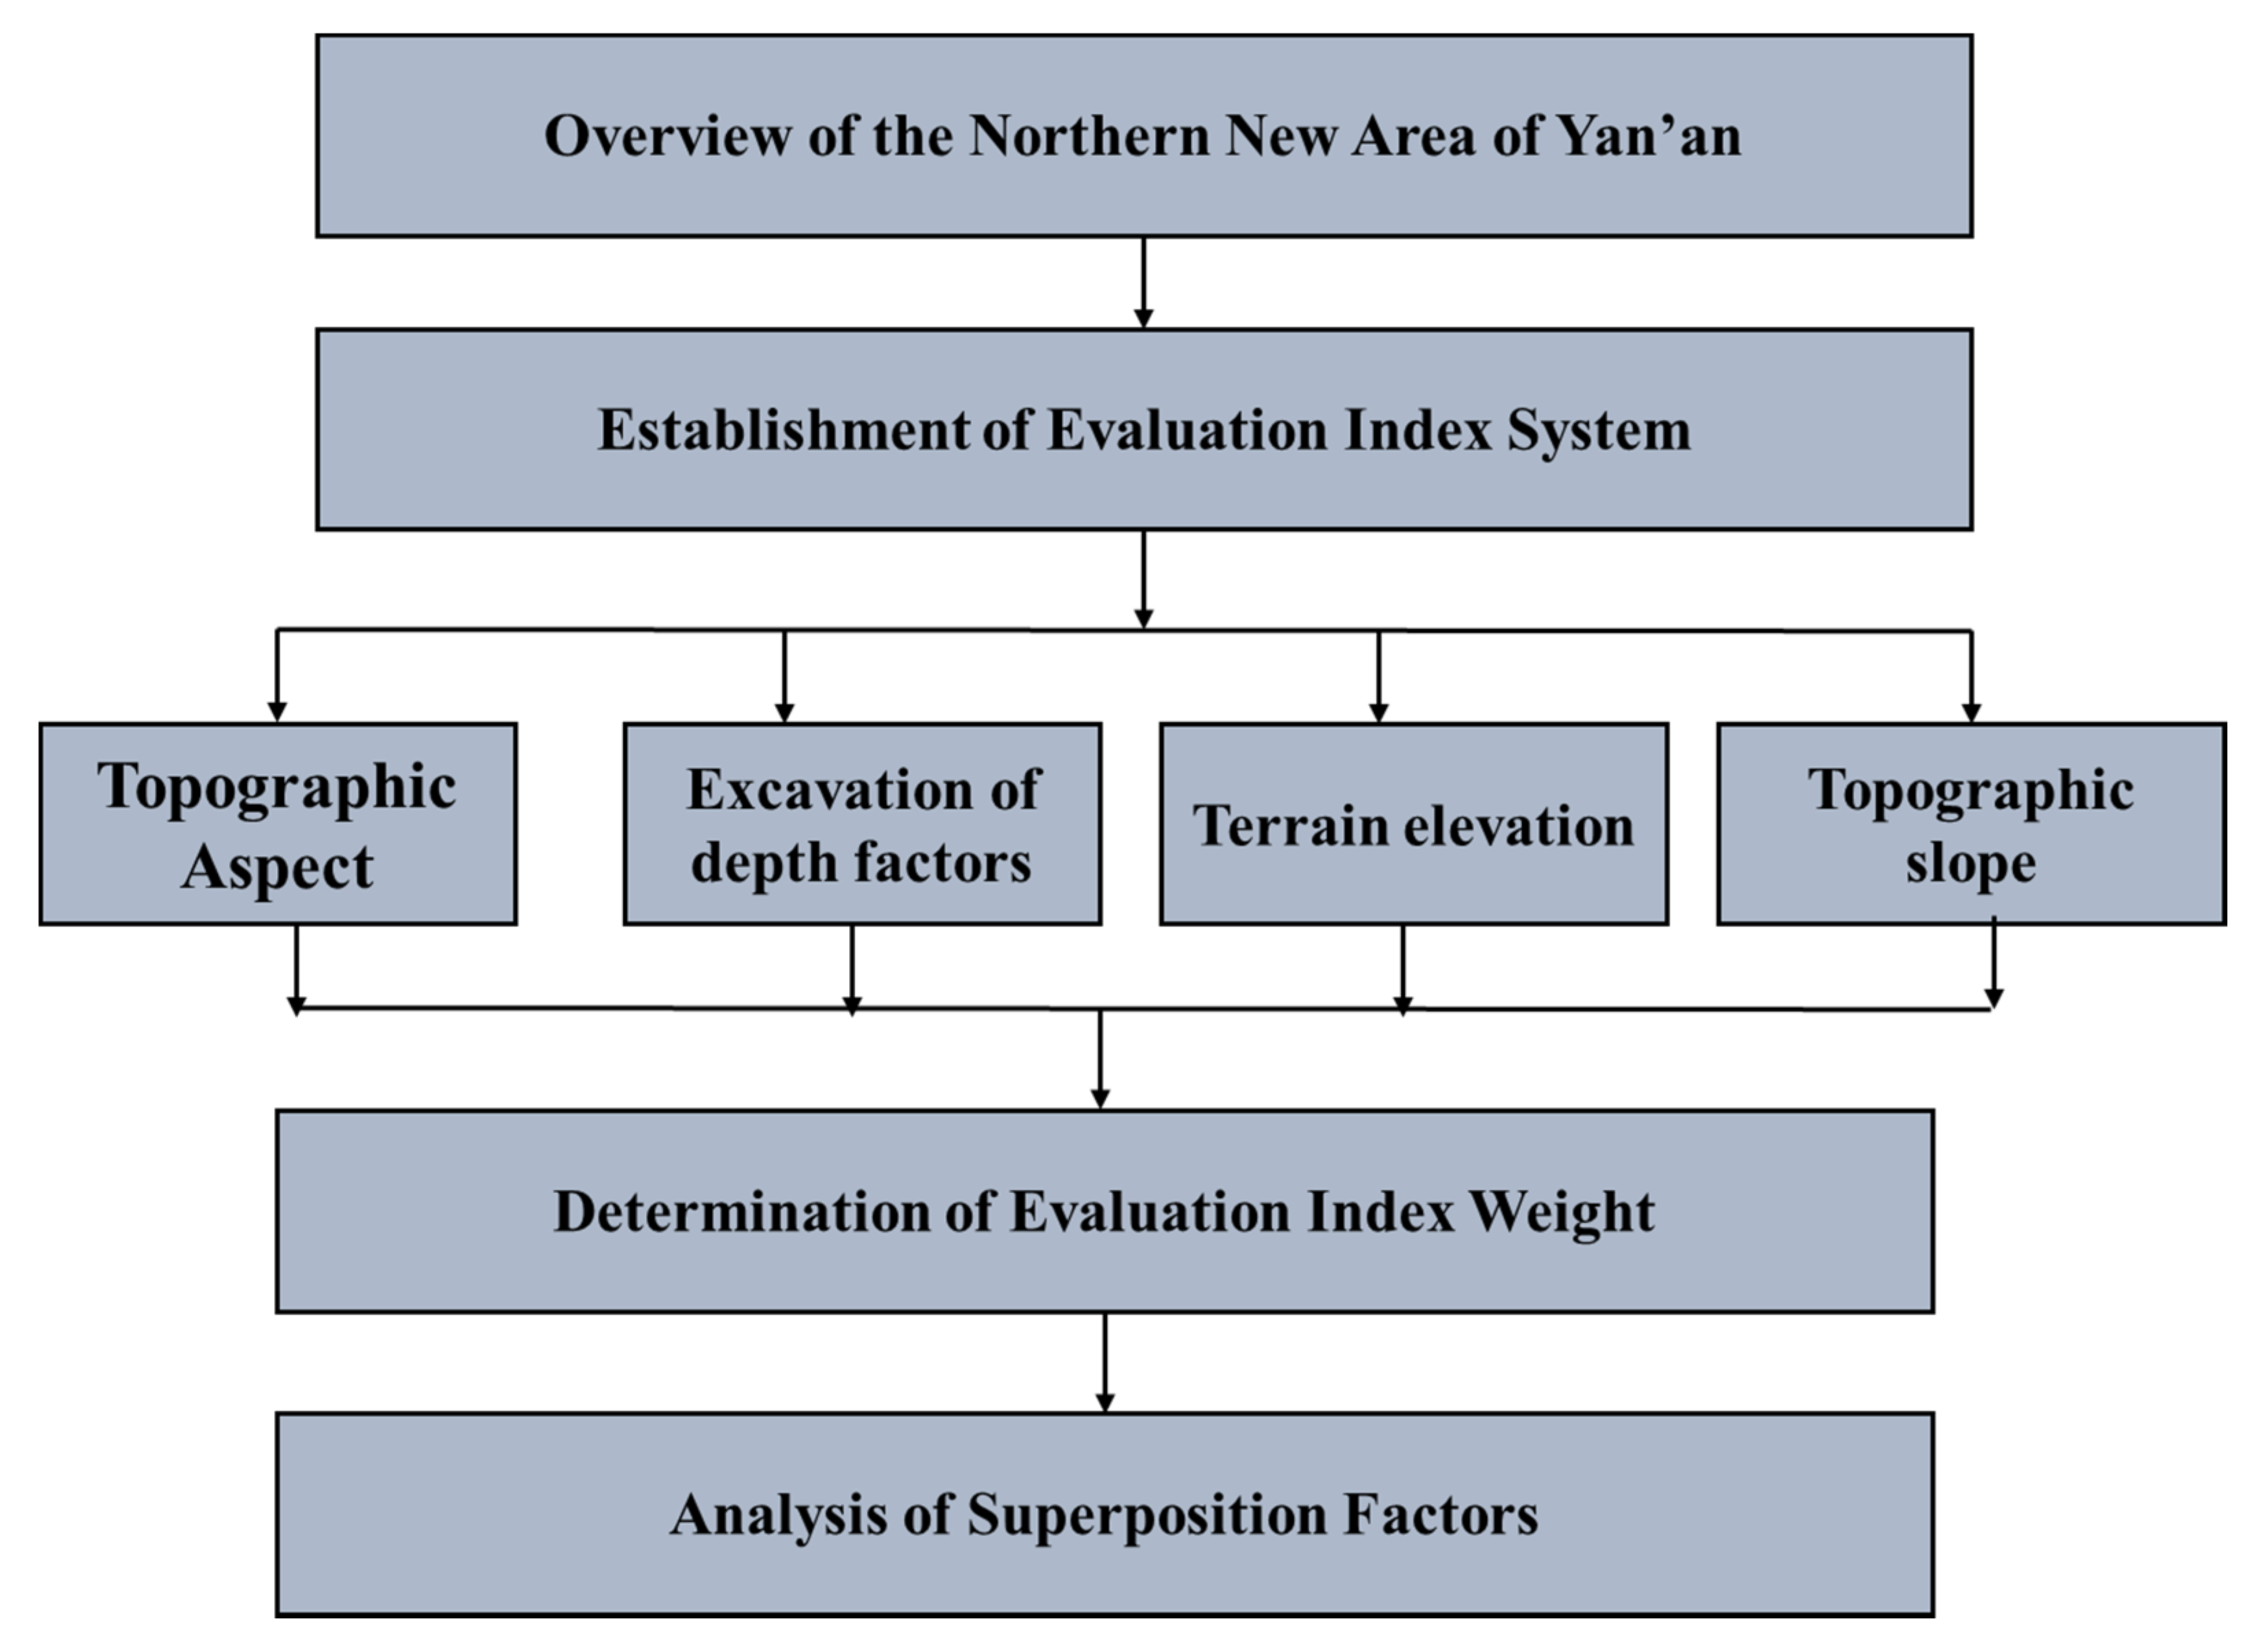
Figure 3.
The evaluation standard of the filling and excavation depth.
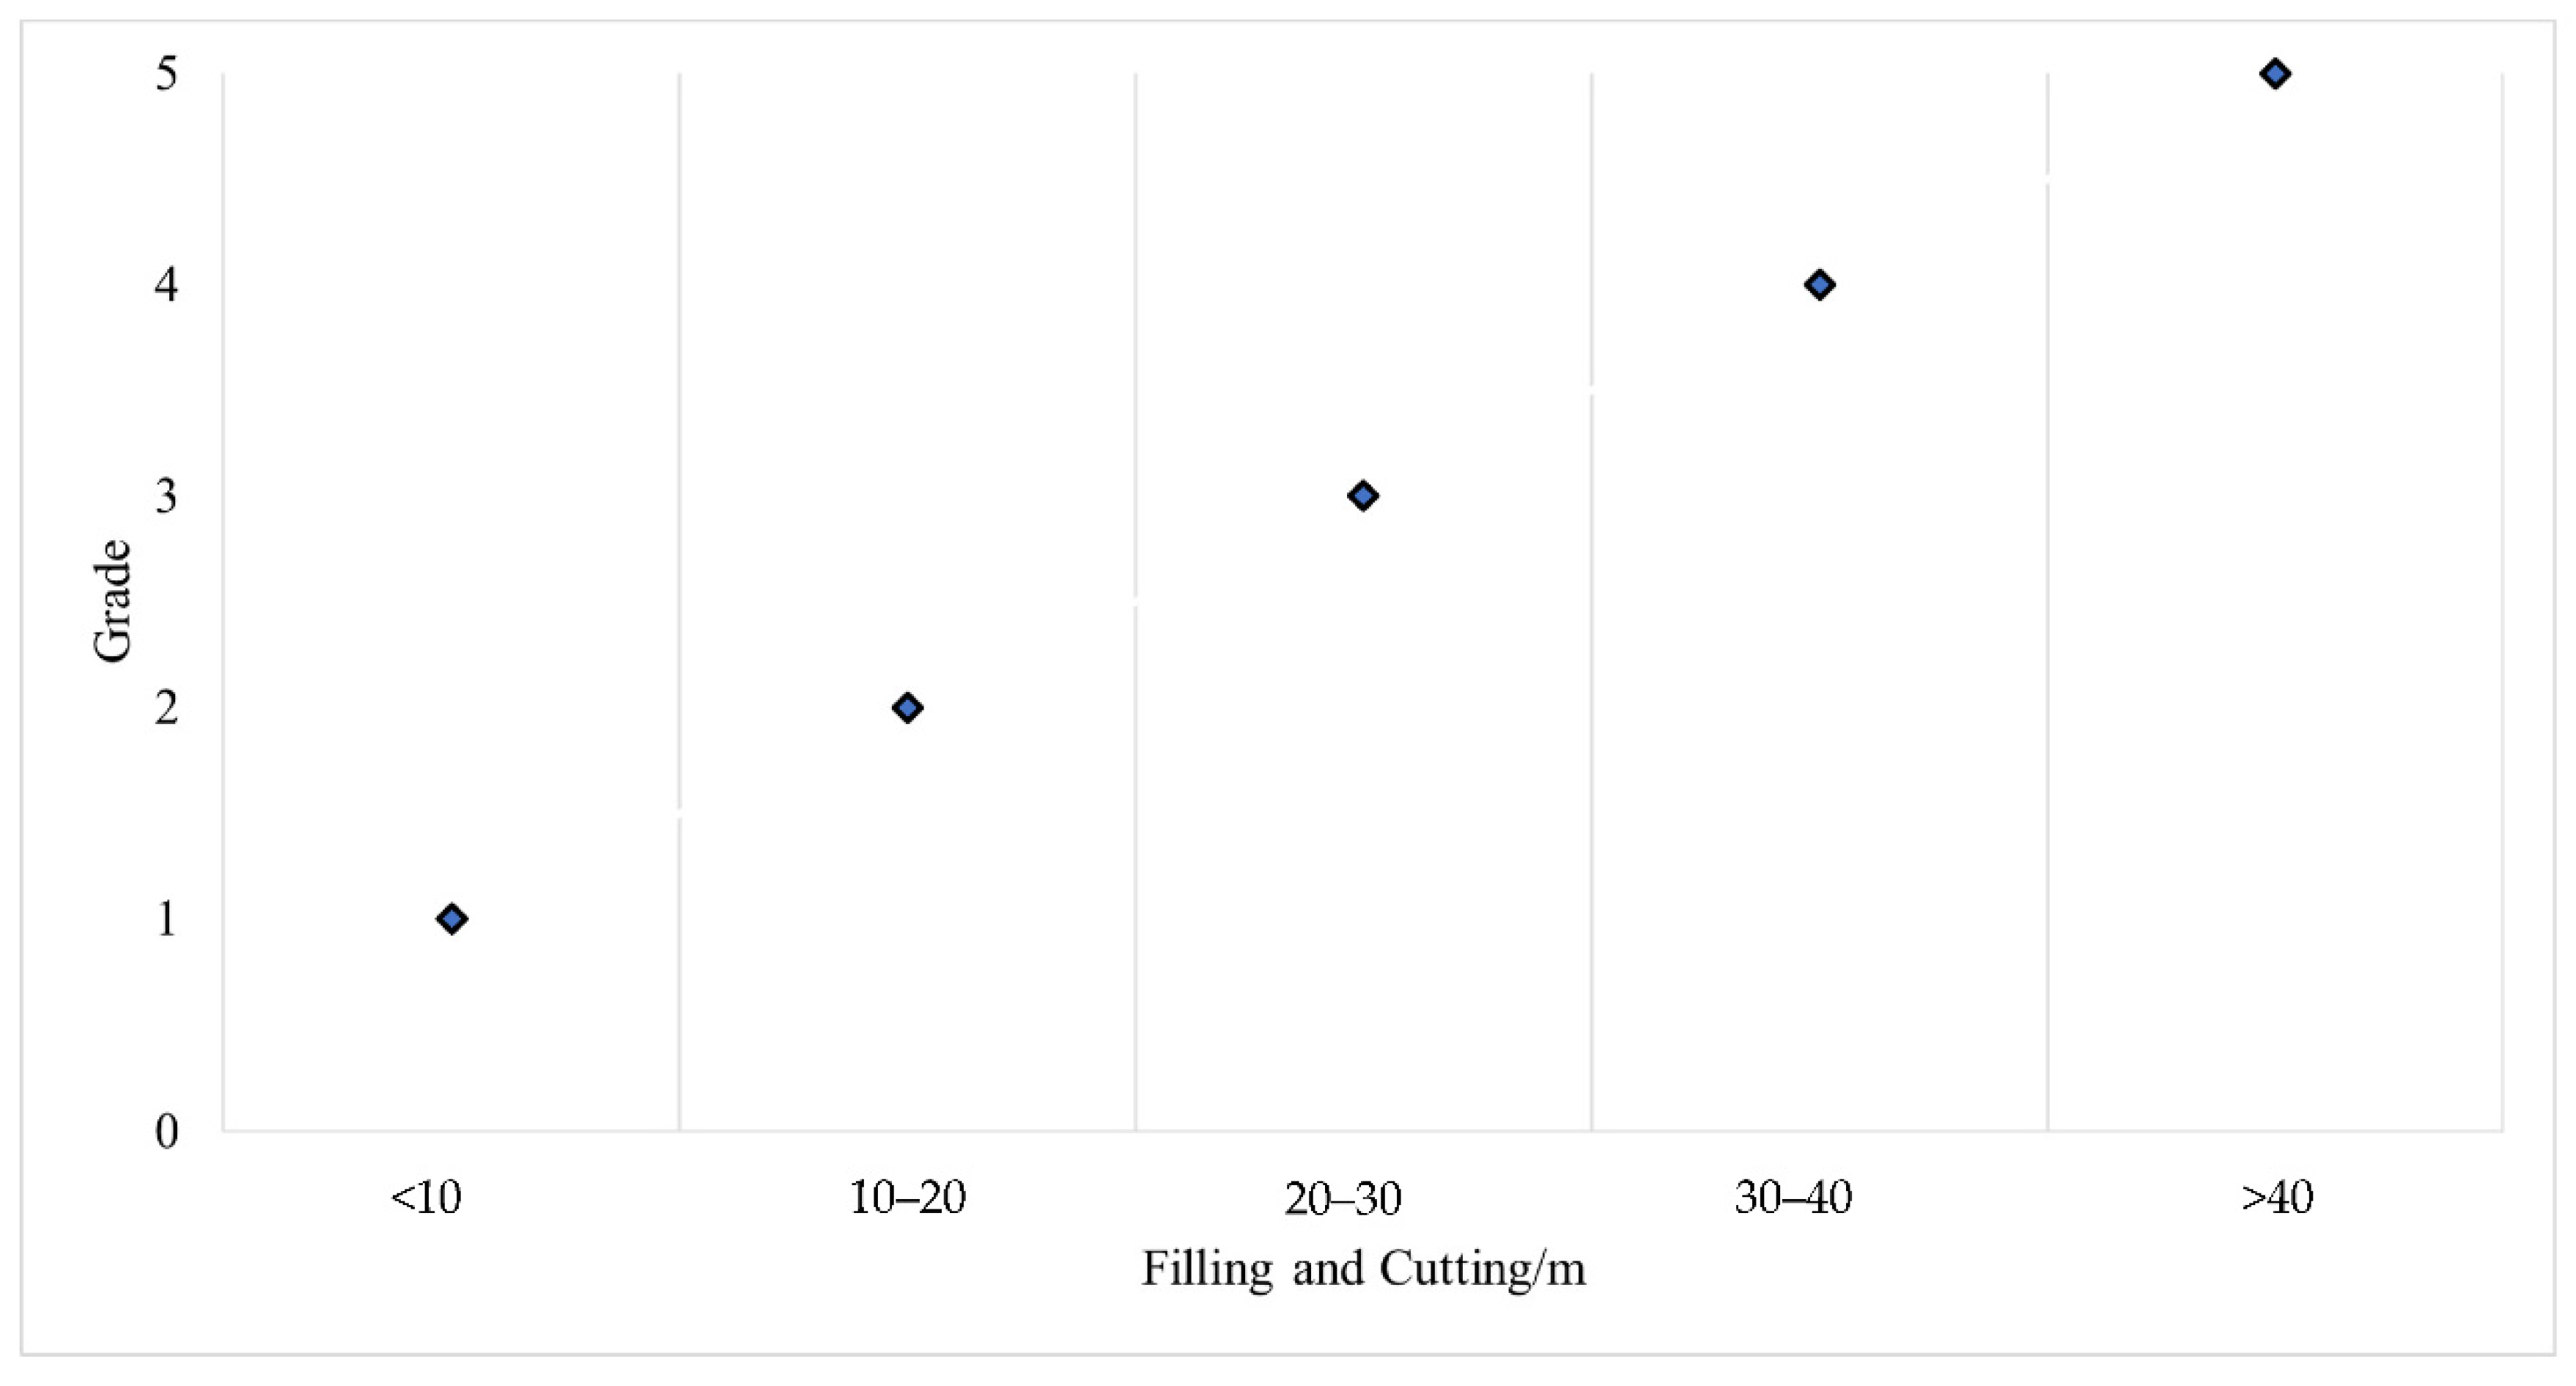
Figure 4.
Evaluation criteria of terrain elevation.
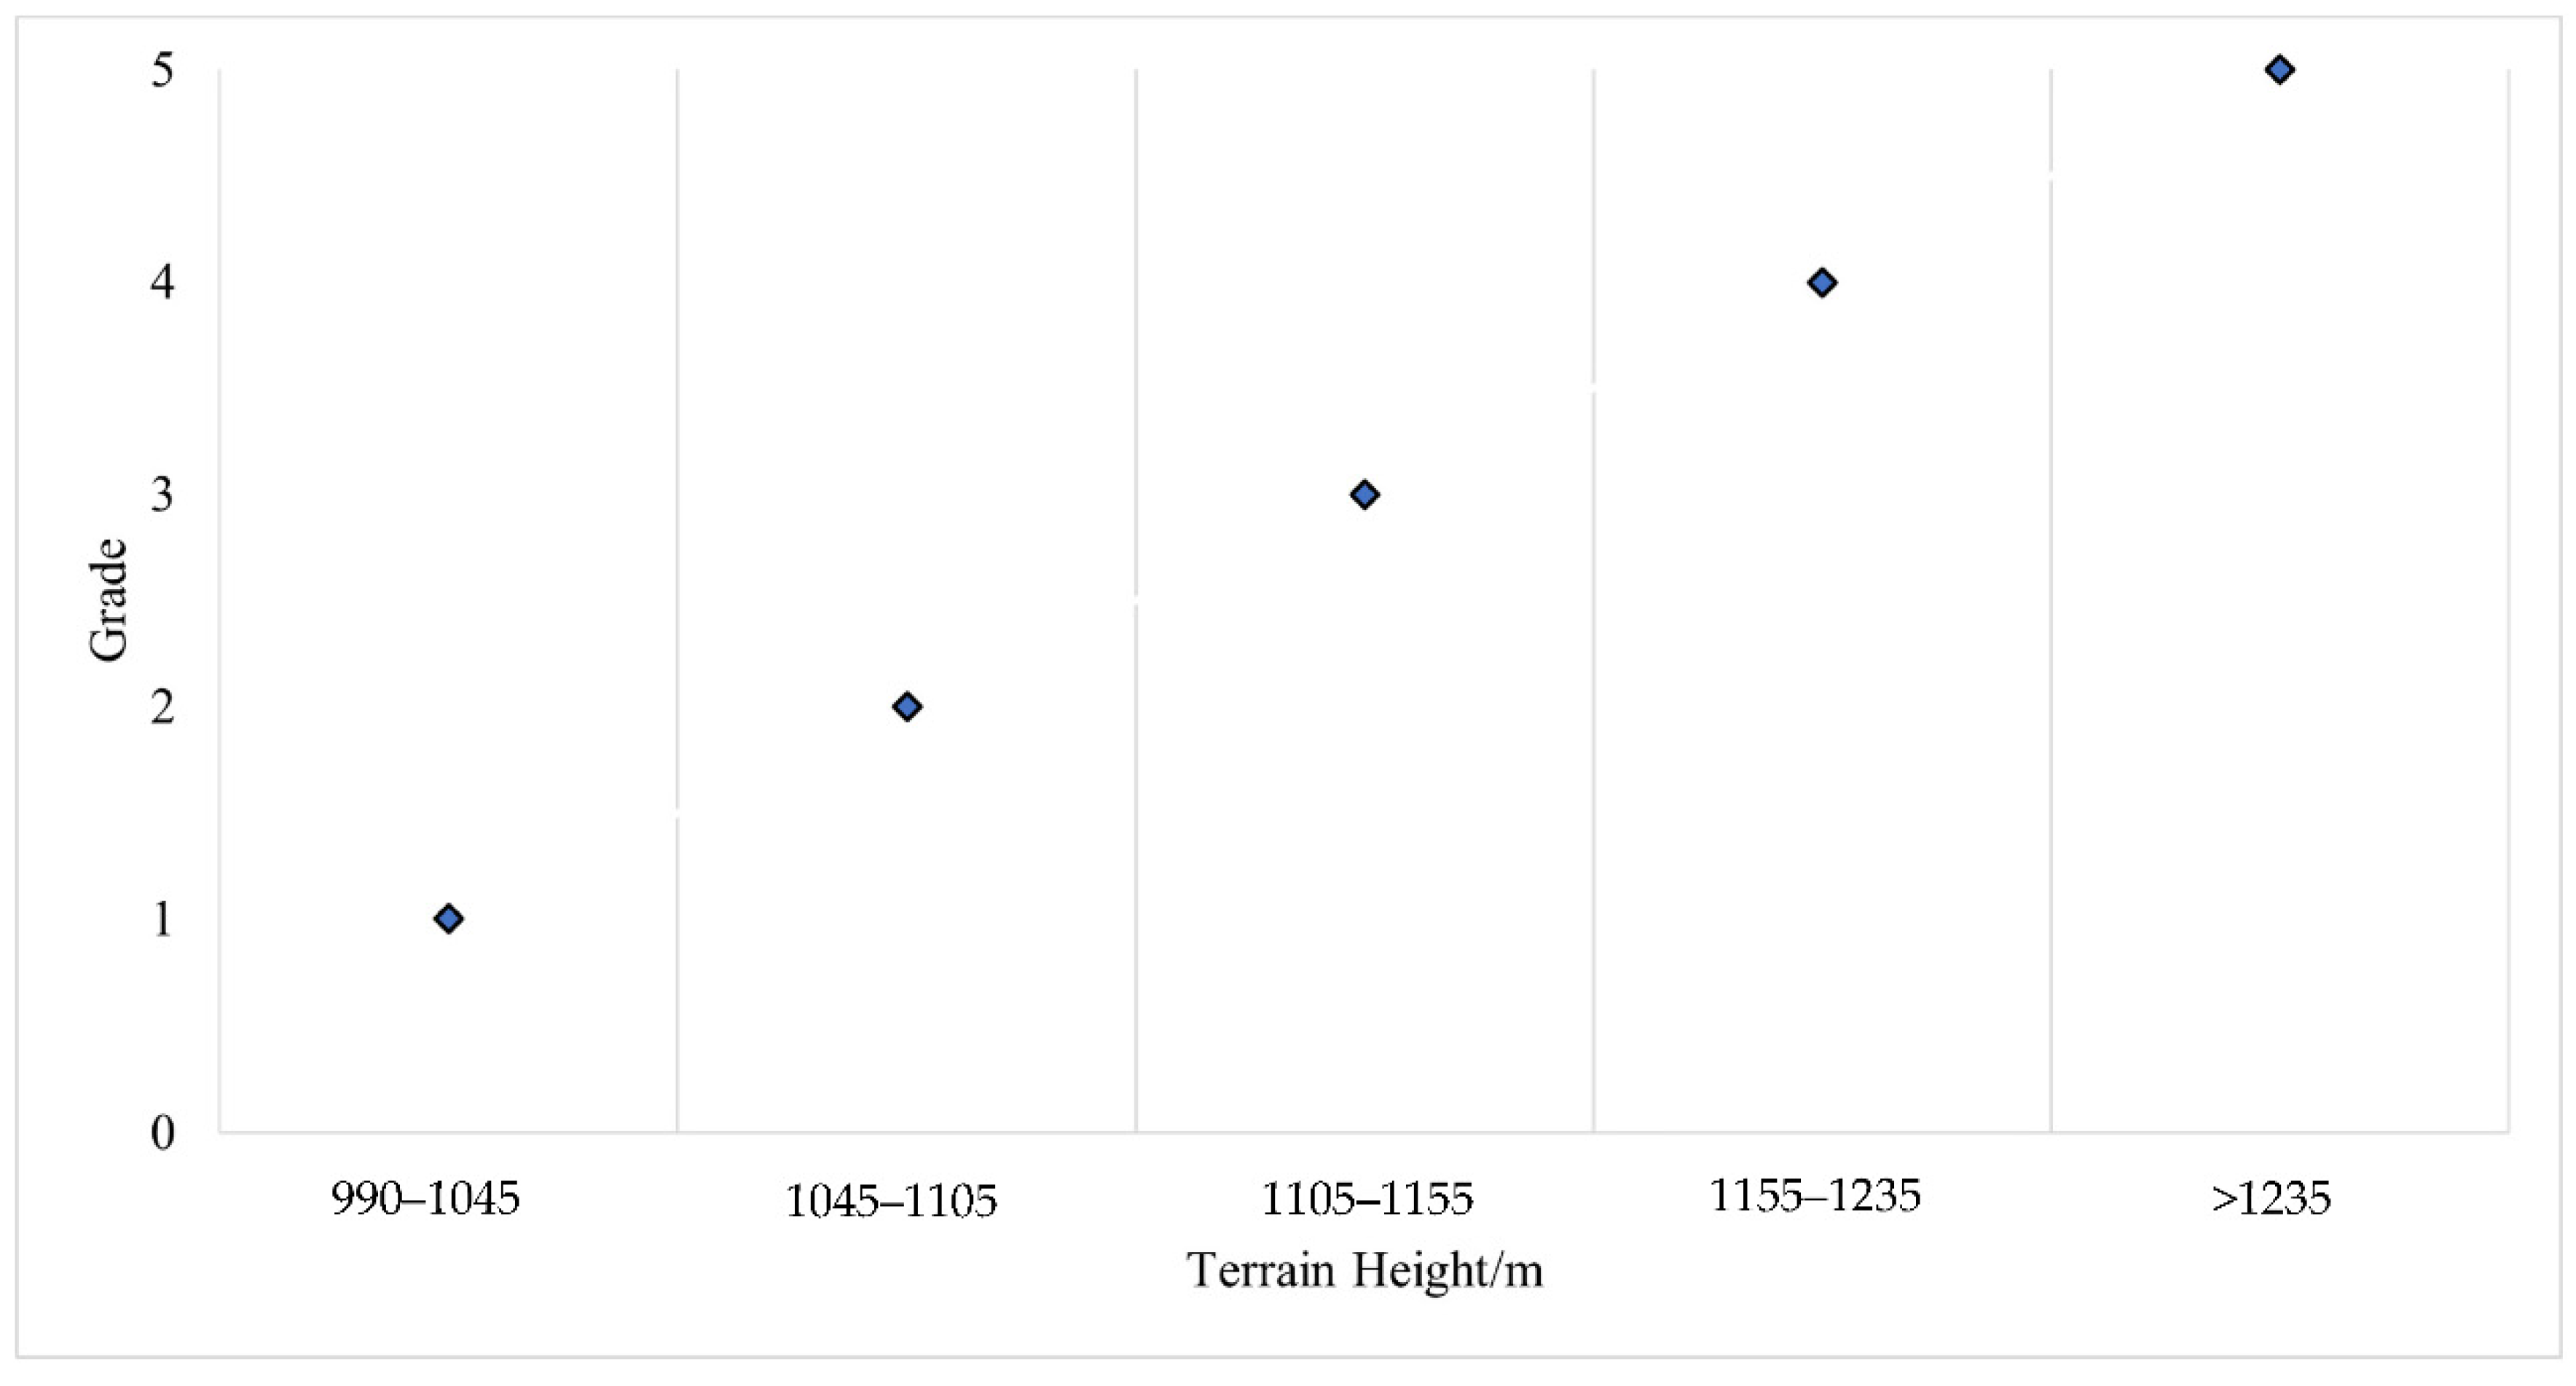
Figure 5.
Evaluation criteria of terrain slope.
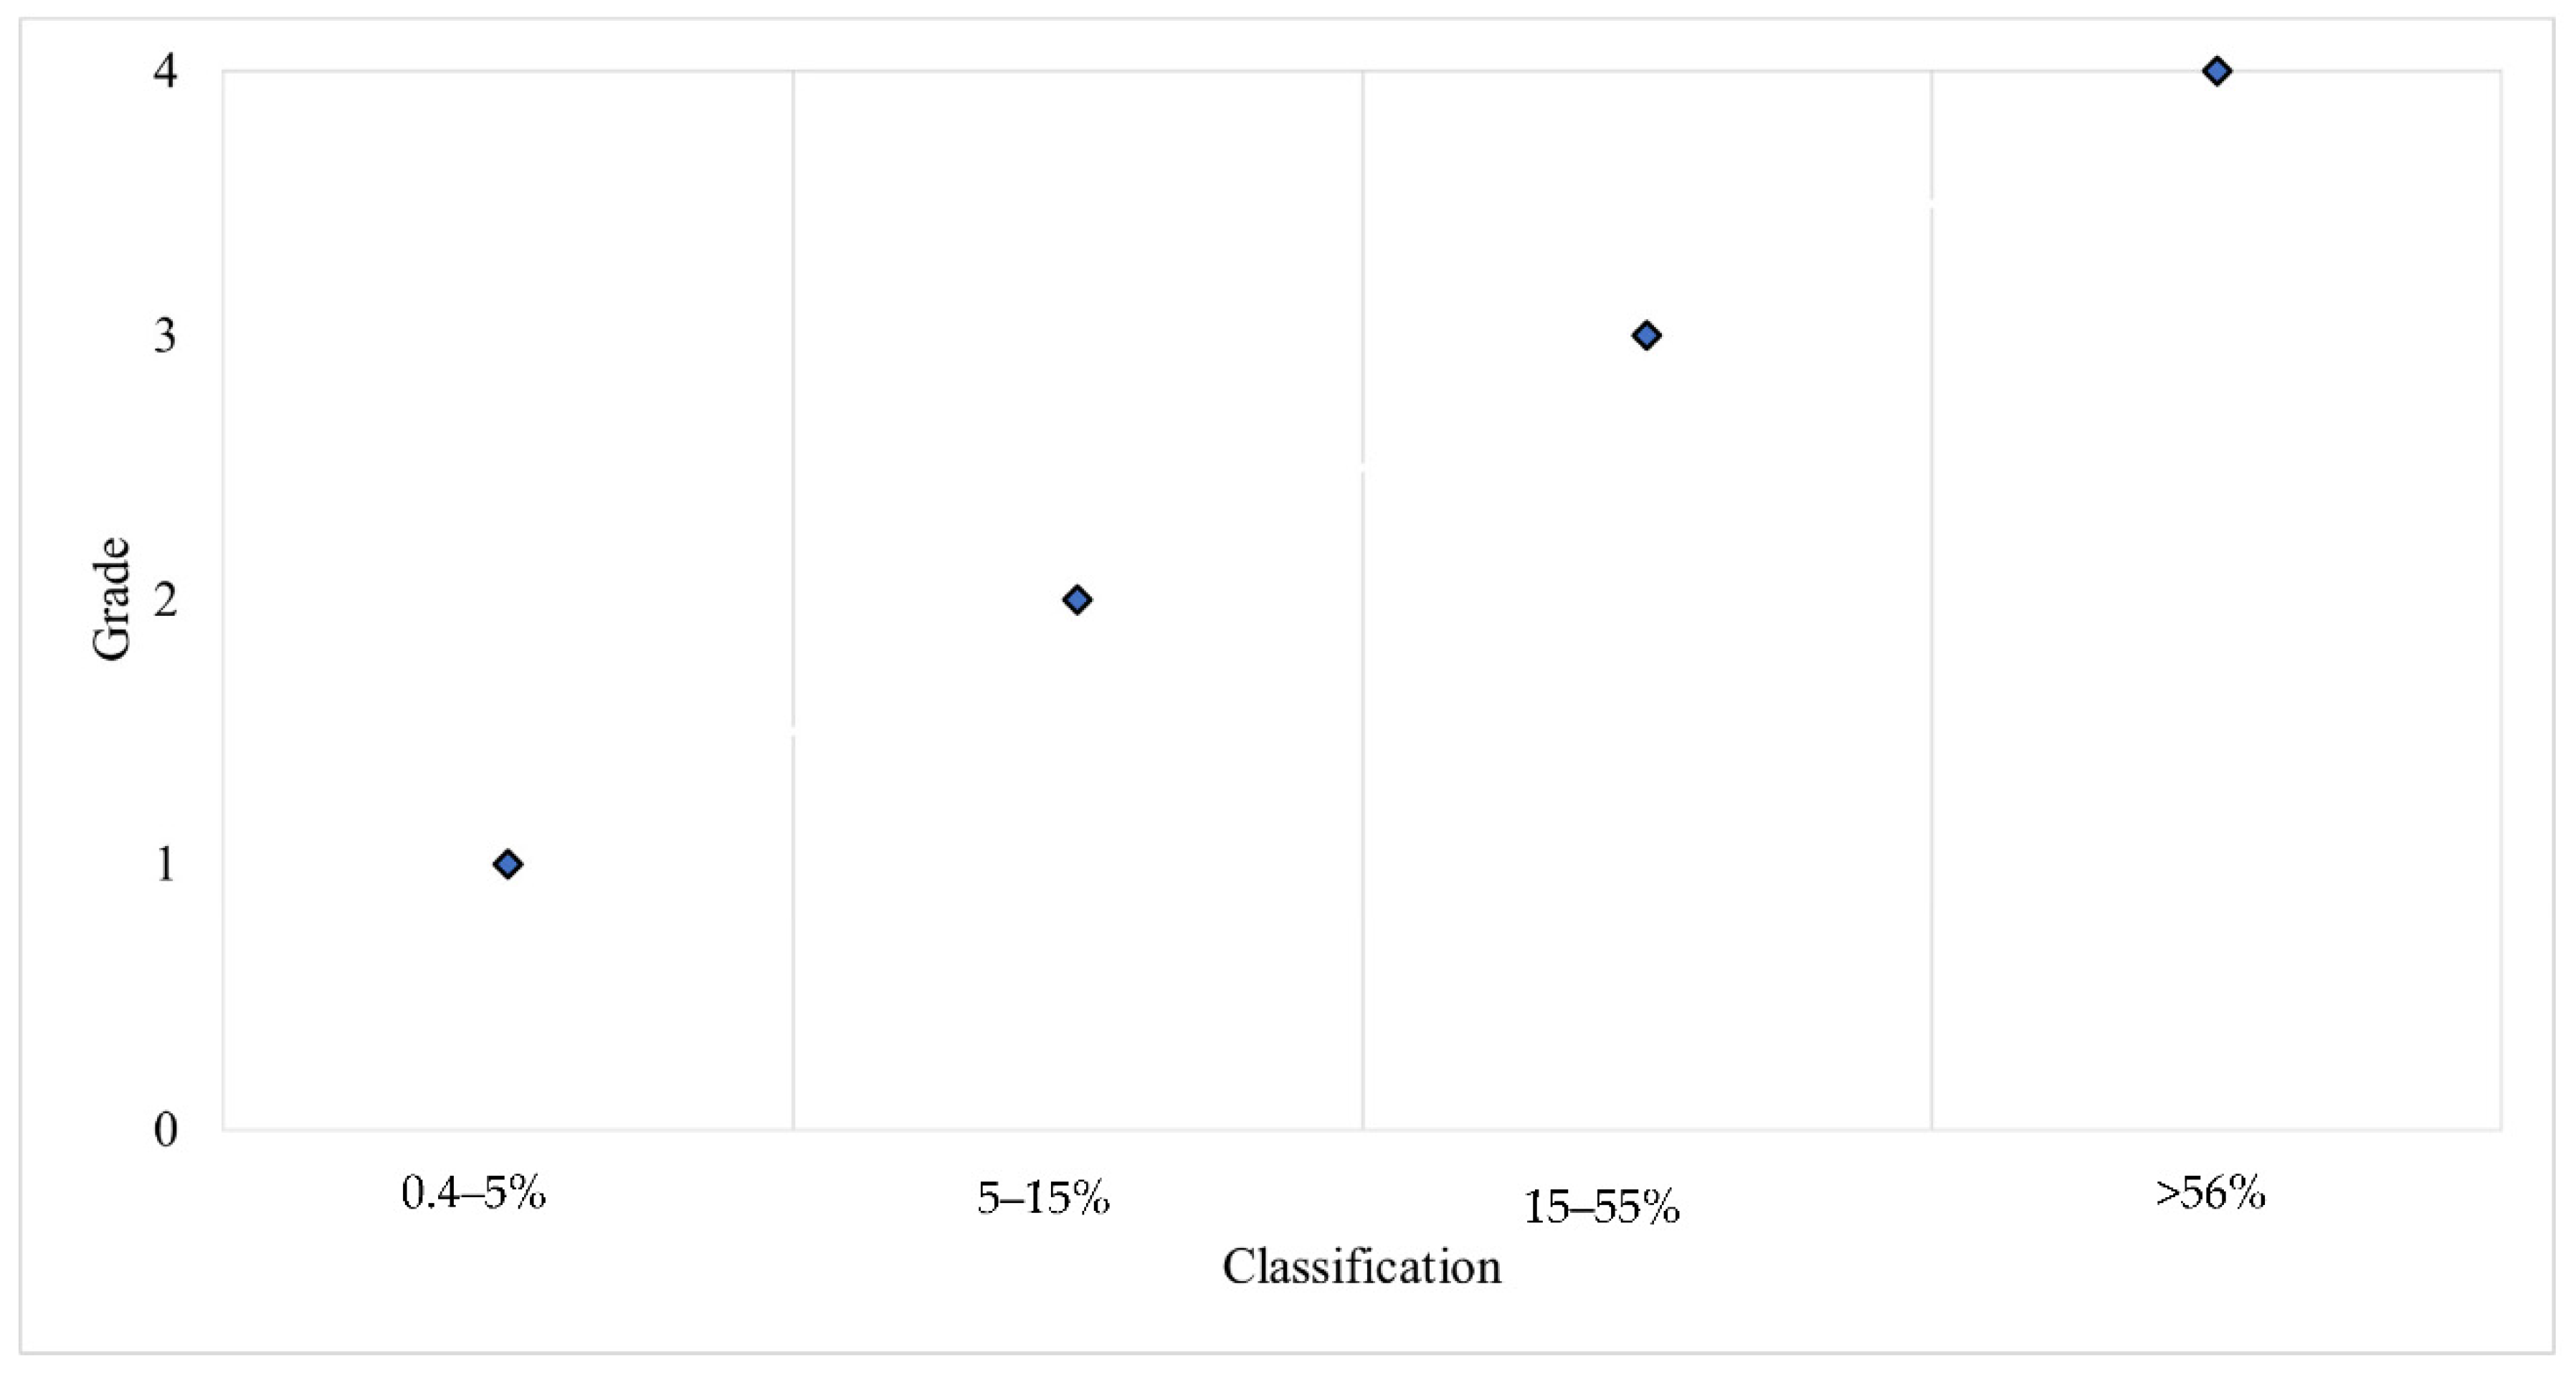
Figure 6.
Index weights of the evaluation system for the suitability of construction land.
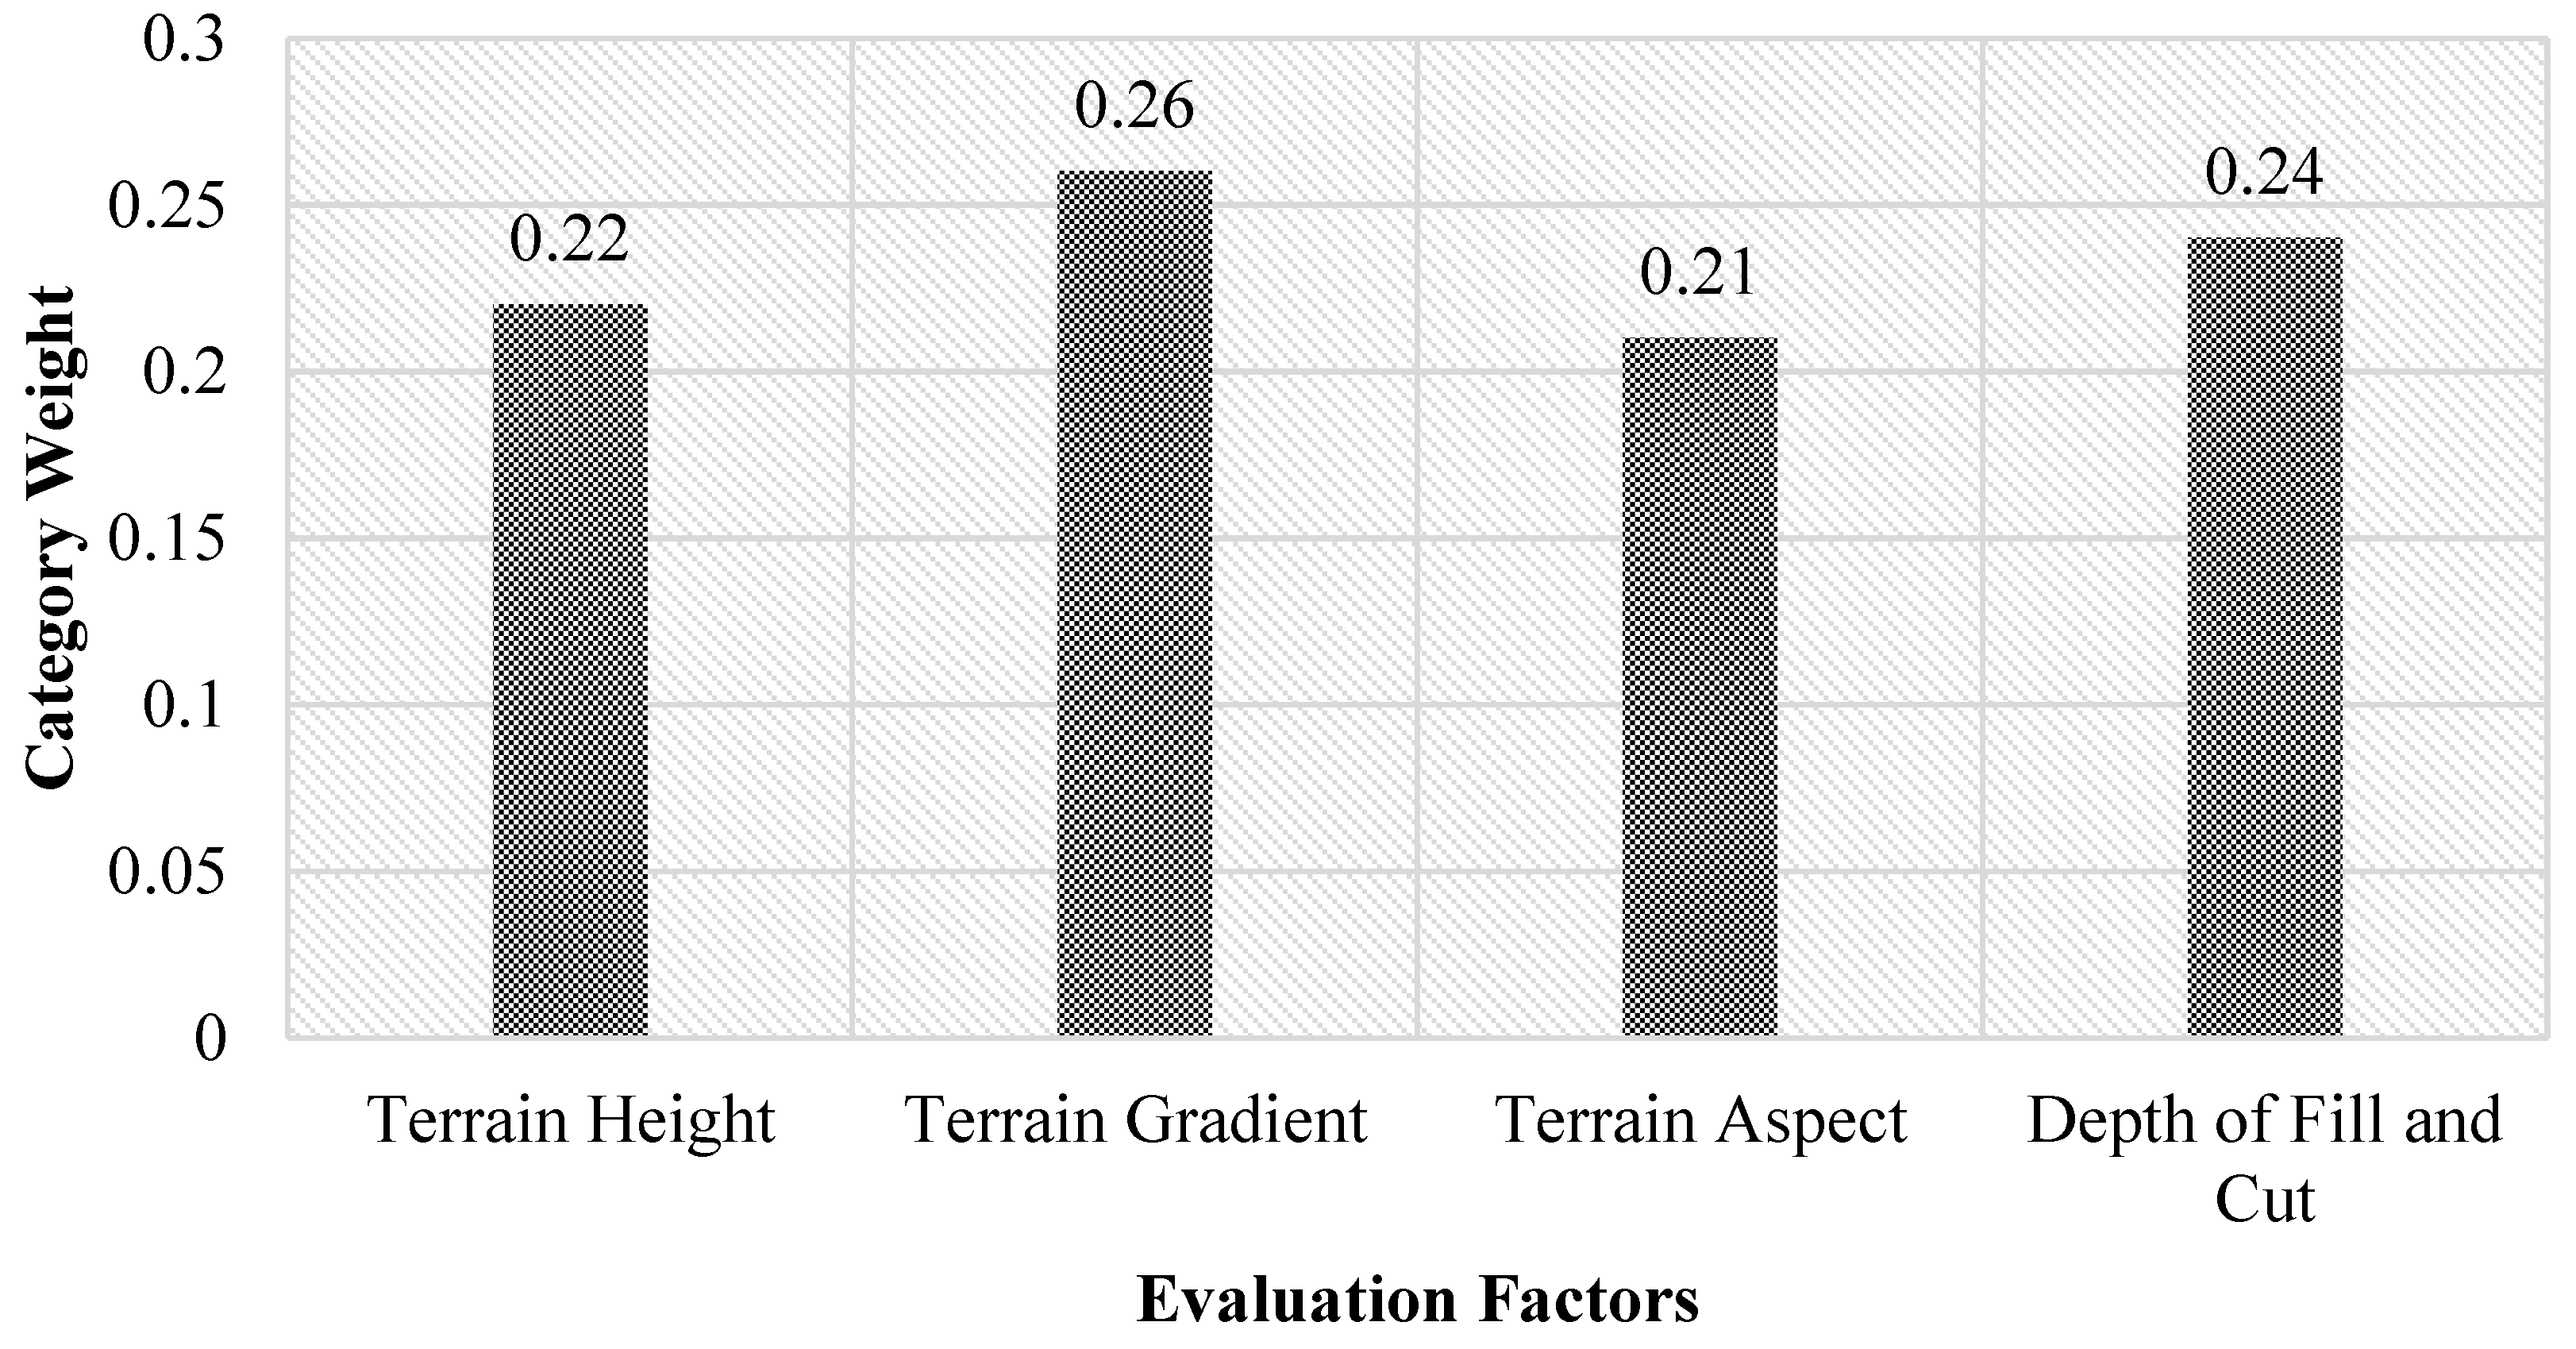
Figure 7.
Distribution of floor area of each grade.

Figure 8.
Design of slope protection.
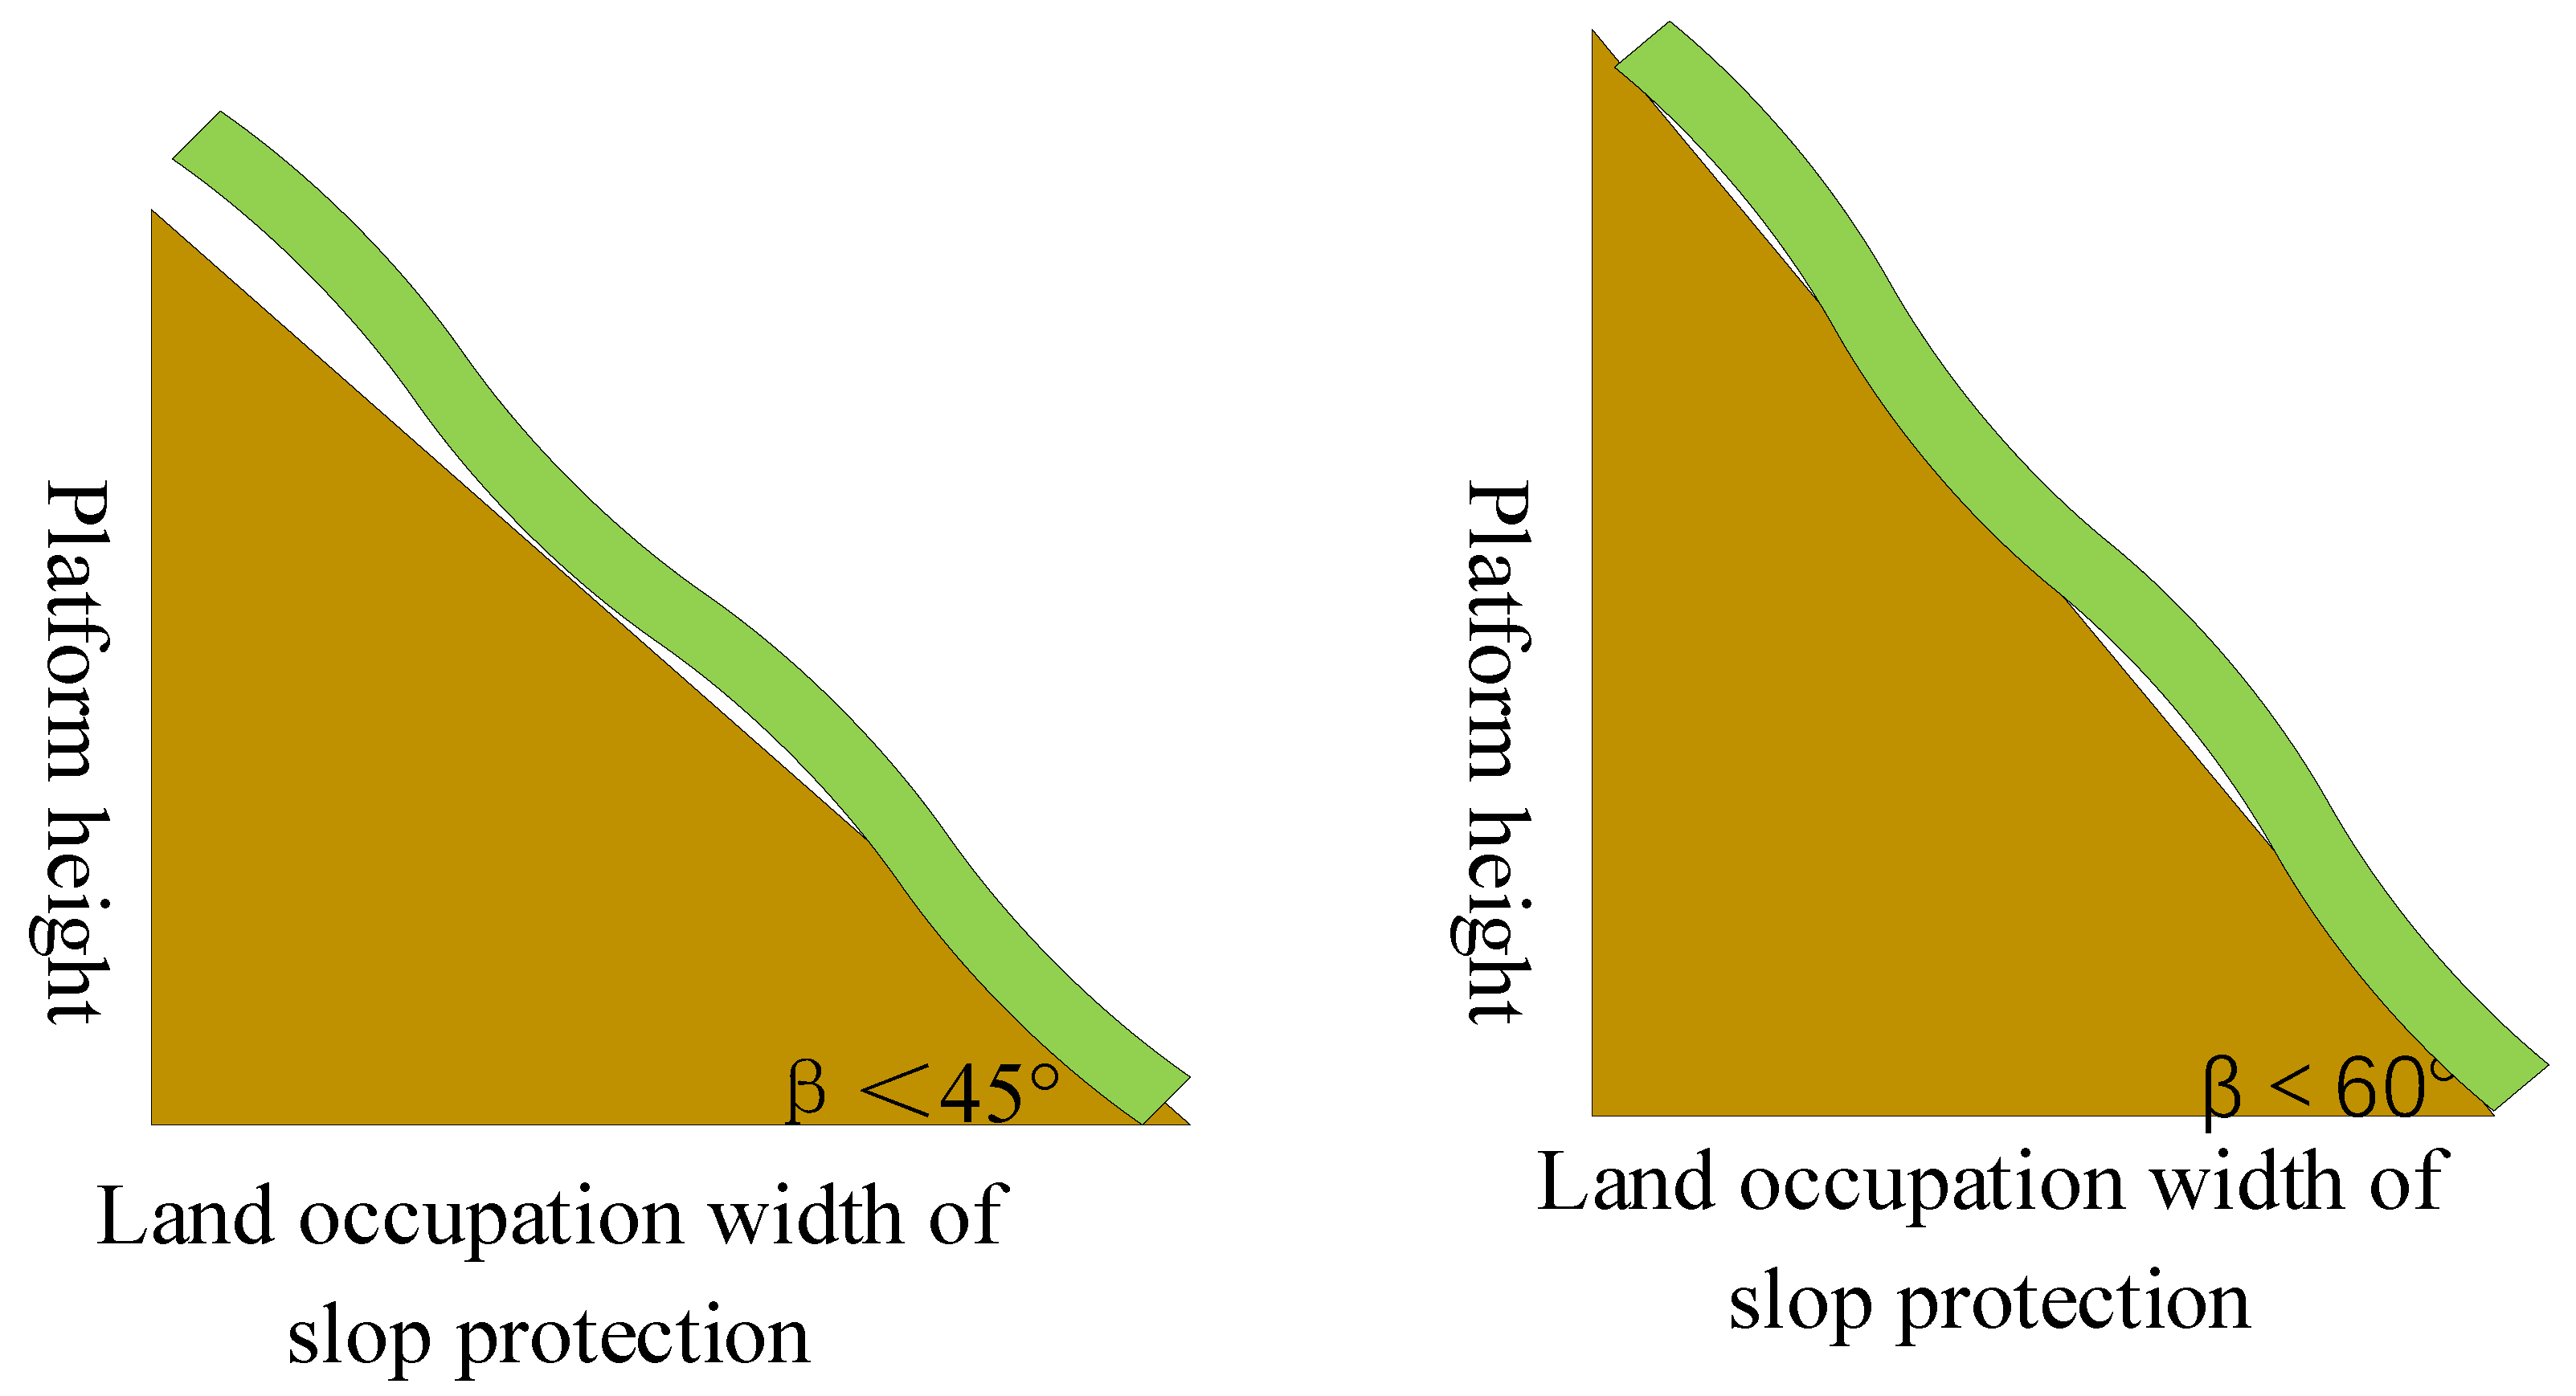
Figure 9.
Schematic diagram of protection measures for slopes less than 10 m in excavation.
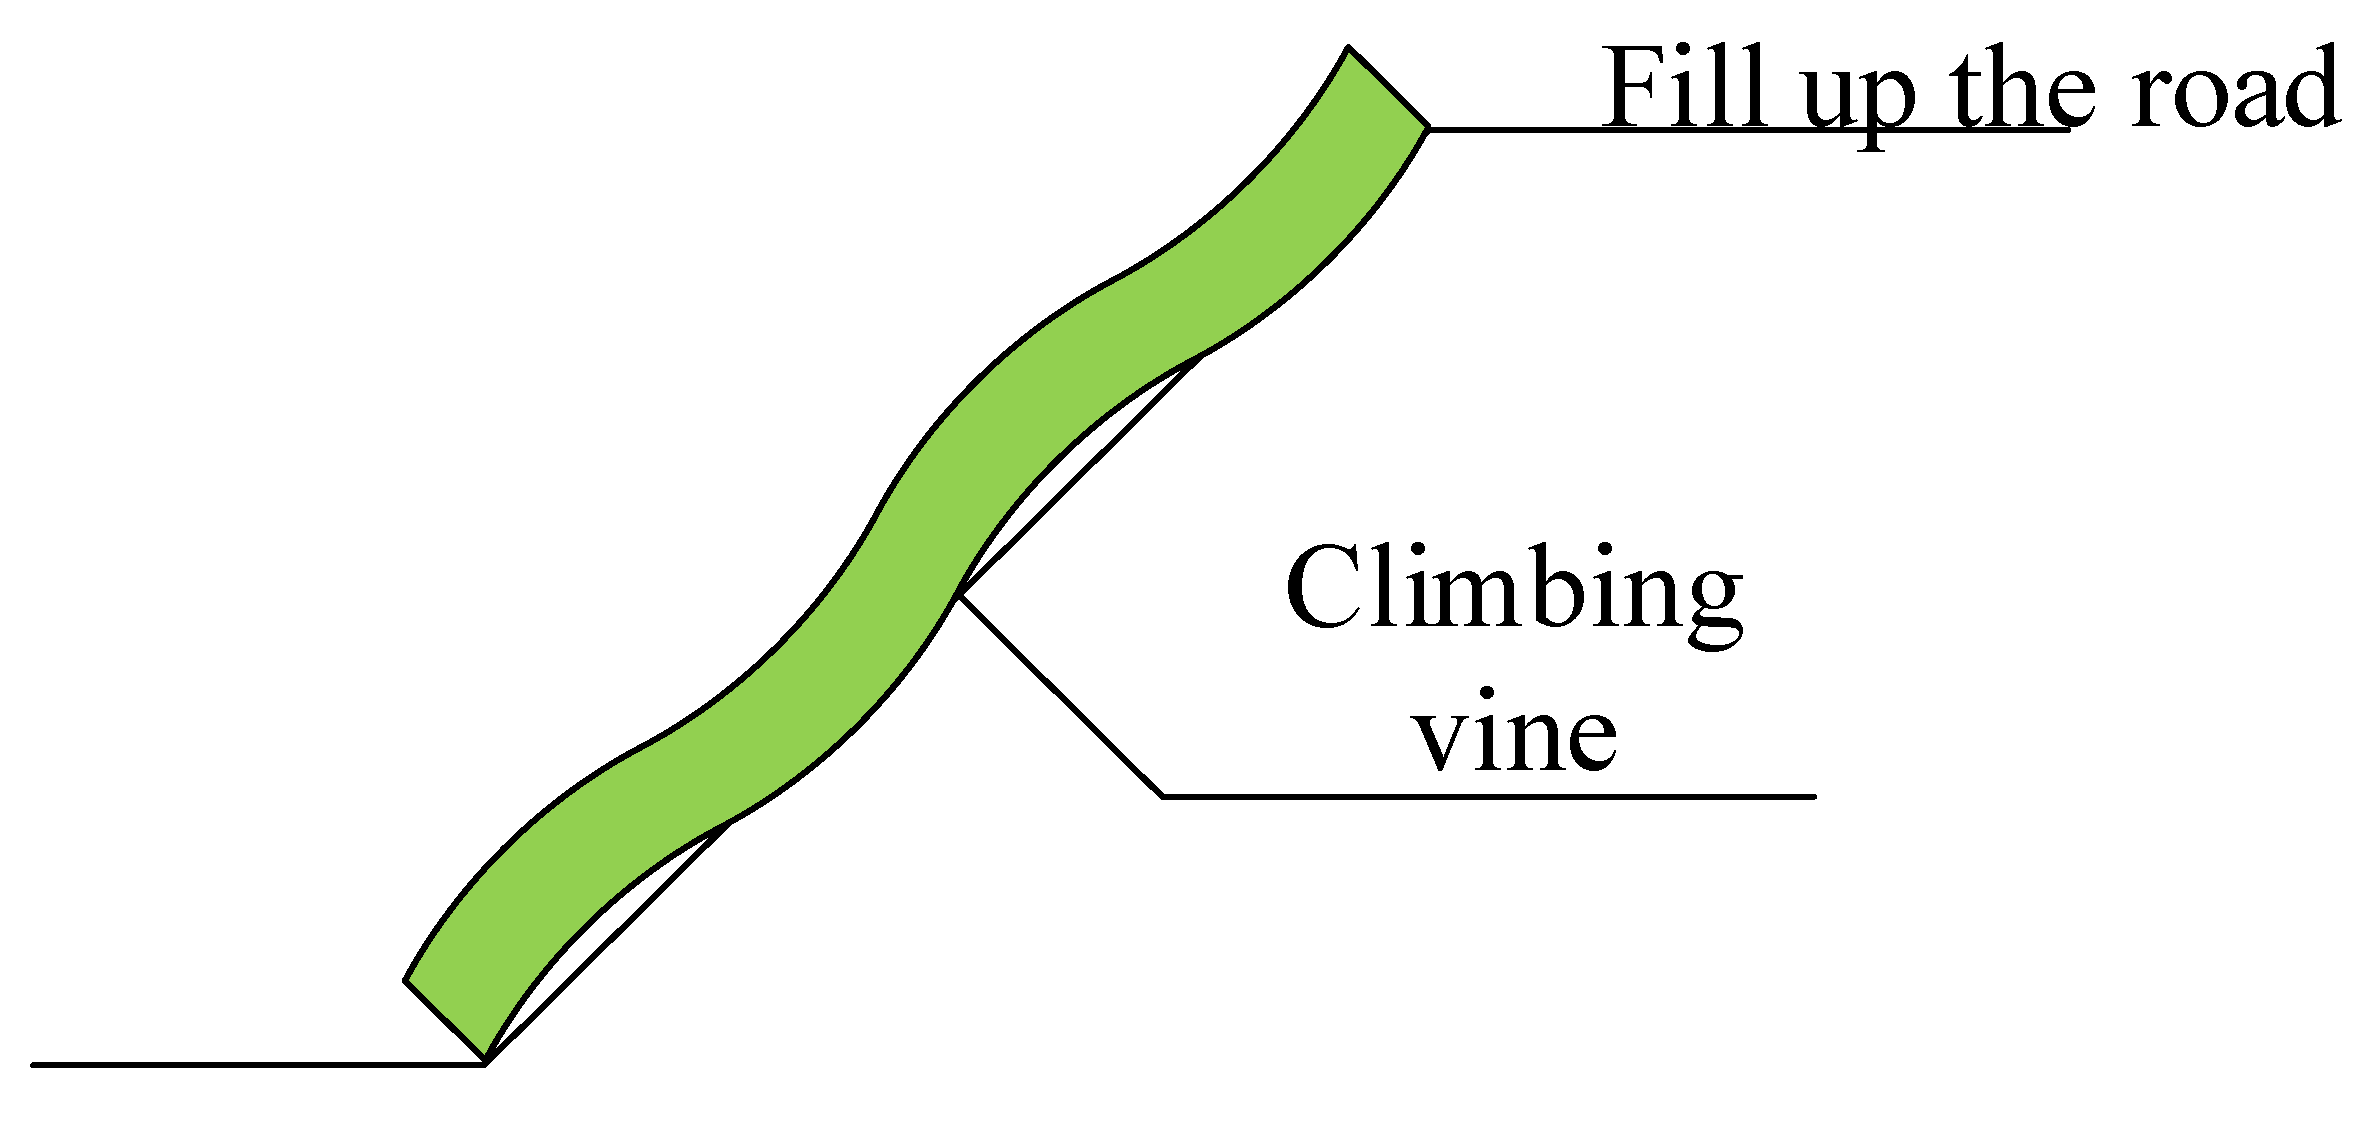
Figure 10.
Schematic diagram of protection measures for the 20–30 m side slope in excavation.
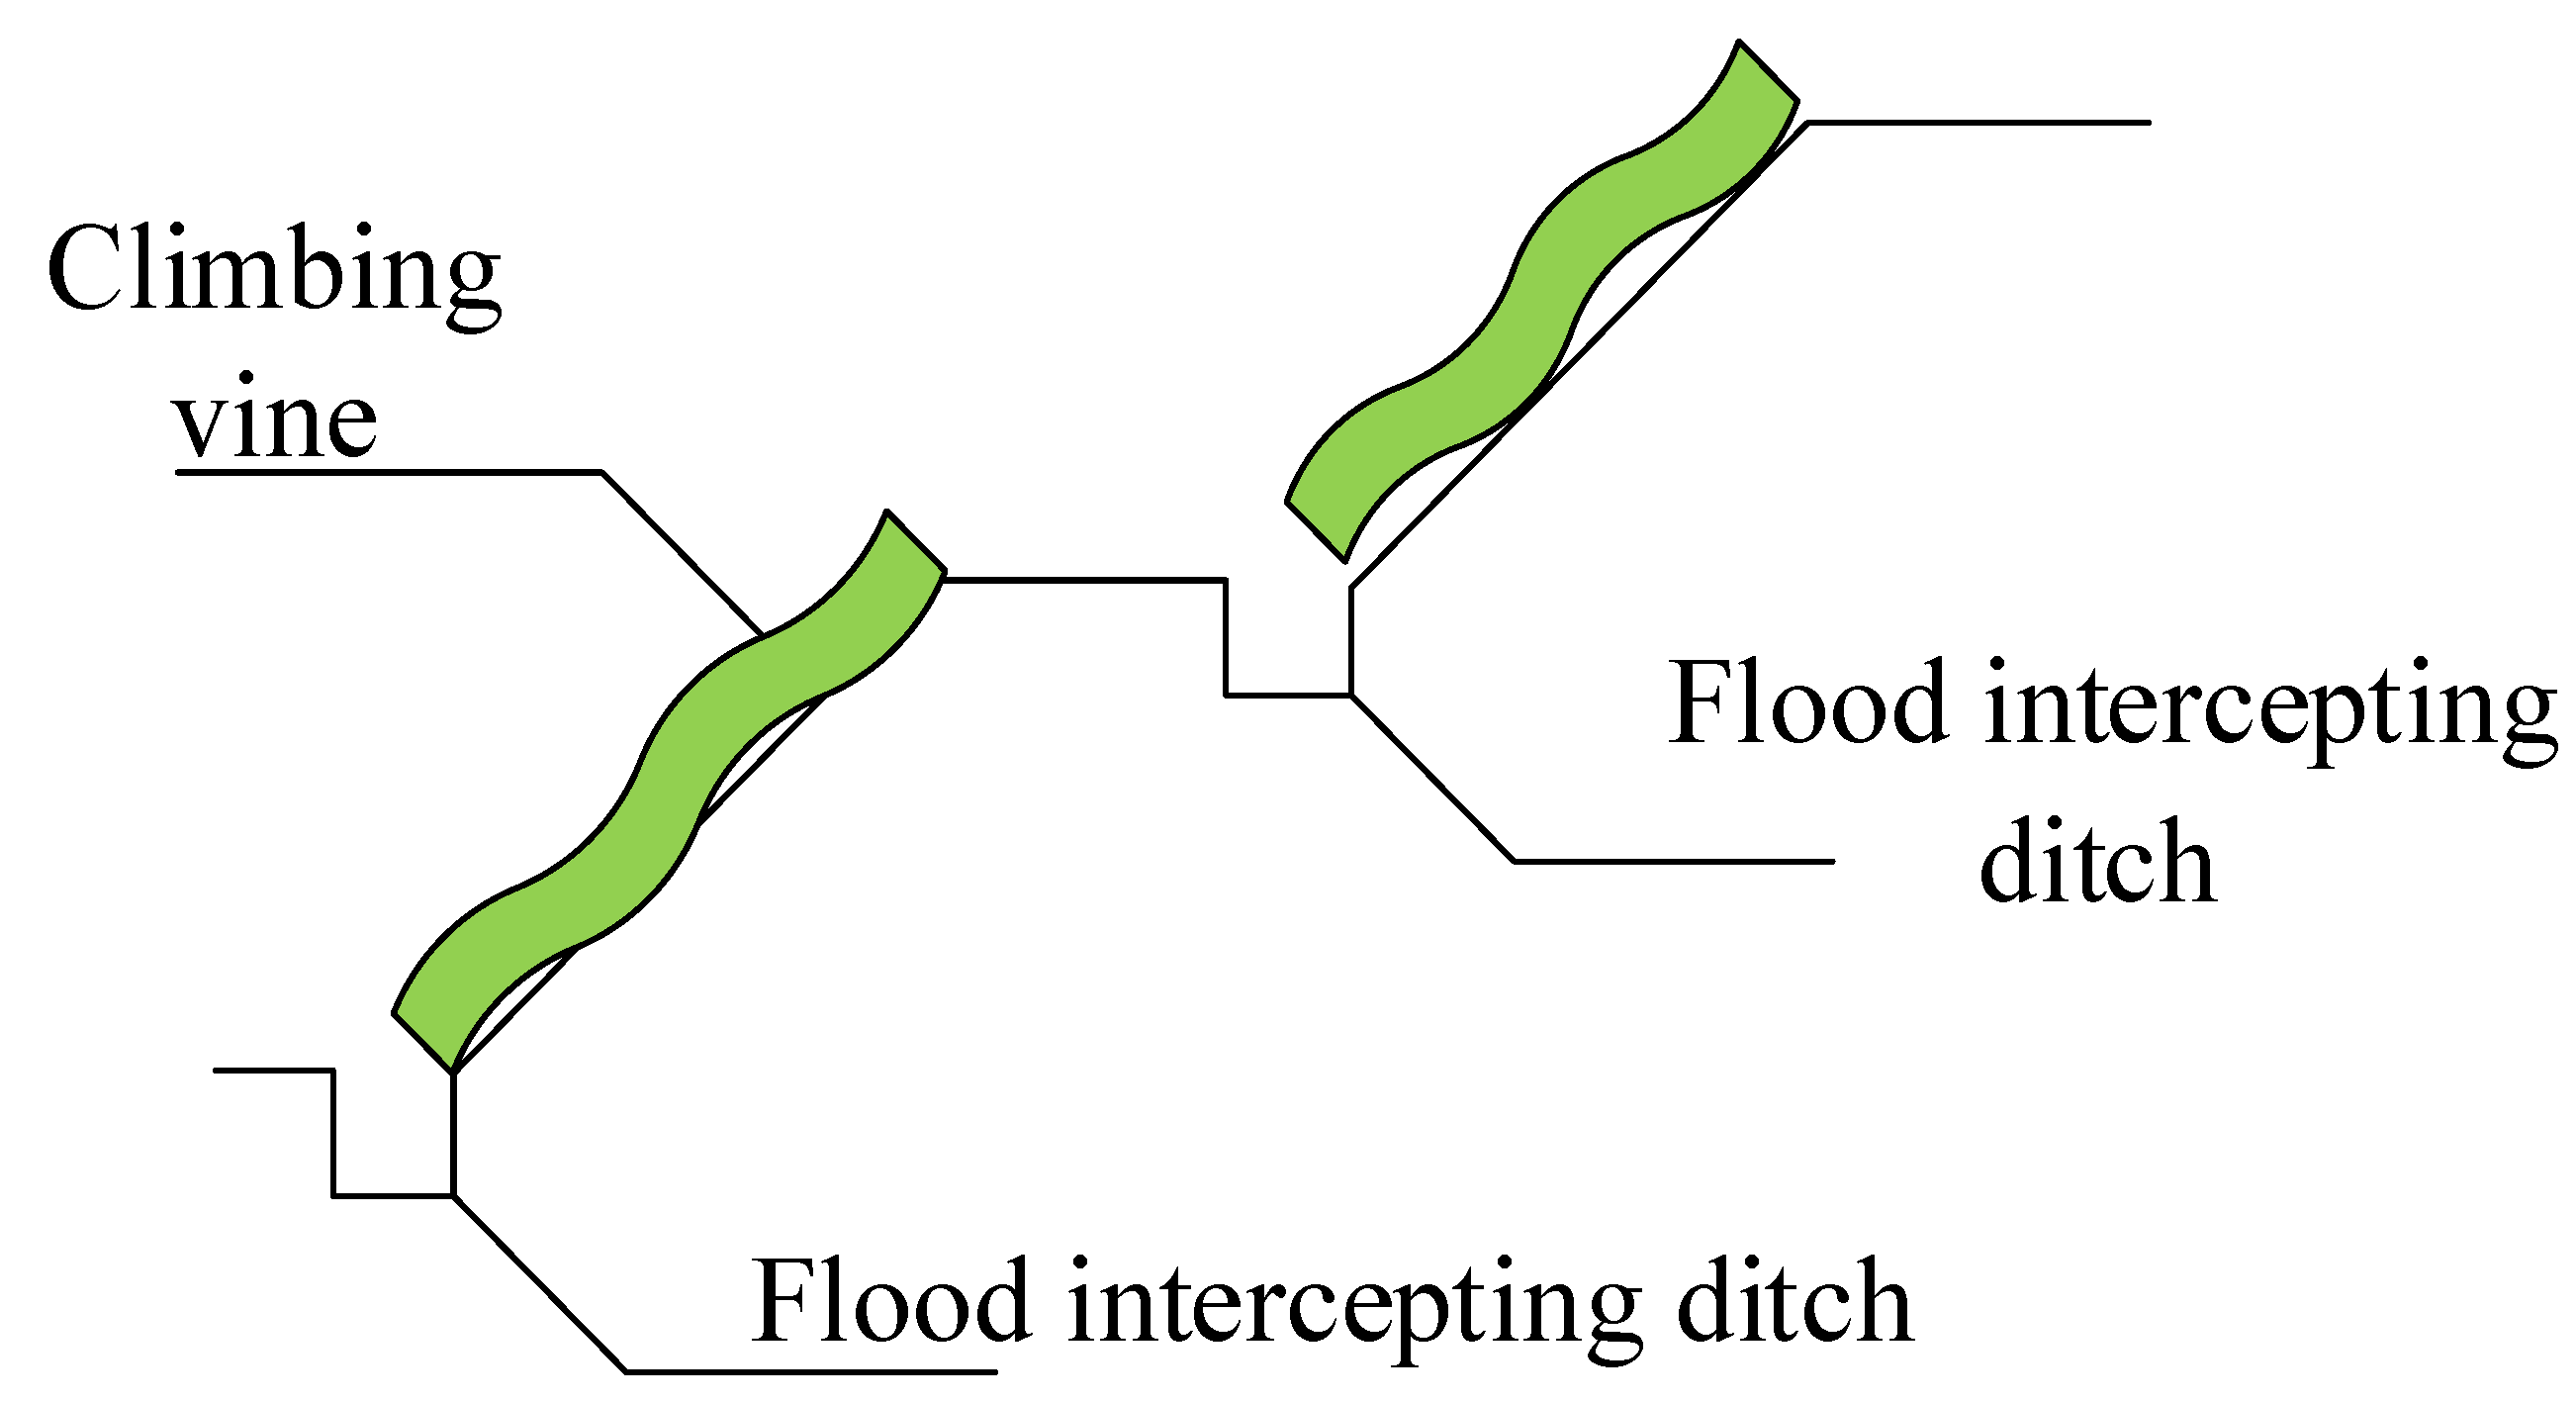
Figure 11.
Schematic diagram of protection measures for slopes greater than 30 m in excavation.

Table 1.
Descriptive analysis of various land suitability methods.
| Research | Crop | Methods |
|---|---|---|
| Bagherzadeh and Gholizadeh [9] | Alfalfa | Artificial Neural Network (ANN) |
| Bagherzadeh et al. [10] | Soyabean | Fuzzy approach |
| Danvi et al. [11] | Rice | Machine Learning (ML) |
| Deng et al. [12] | Rice | ANN + Genetic Algorithm (GA) |
| Estes et al. [13] | Maize | Machine Learning (ML) |
| Lopez-Blanco et al. [14] | Several Crops | Fuzzy approach + ML |
| Raza et al. [15] | Several Crops | Fuzzy approach |
Table 2.
Evaluation criteria of slope.
| Classification of Slope Orientation | Influence Level |
|---|---|
| North | Unsuitable orientation |
| Northeast, northwest | Low orientation |
| East, west | Suitable orientation |
| South, southwest, southeast | Best orientation |
Publisher’s Note: MDPI stays neutral with regard to jurisdictional claims in published maps and institutional affiliations. |
© 2021 by the authors. Licensee MDPI, Basel, Switzerland. This article is an open access article distributed under the terms and conditions of the Creative Commons Attribution (CC BY) license (https://creativecommons.org/licenses/by/4.0/).
Share and Cite
MDPI and ACS Style
Yan, Y.; Zhang, Y.; Sharma, A.; Al-Amri, J.F. Evaluation of Suitability of Urban Land Using GIS Technology. Sustainability 2021, 13, 10521. https://doi.org/10.3390/su131910521
AMA Style
Yan Y, Zhang Y, Sharma A, Al-Amri JF. Evaluation of Suitability of Urban Land Using GIS Technology. Sustainability. 2021; 13(19):10521. https://doi.org/10.3390/su131910521
Chicago/Turabian StyleYan, Yu, Yukun Zhang, Ashutosh Sharma, and Jehad F. Al-Amri. 2021. "Evaluation of Suitability of Urban Land Using GIS Technology" Sustainability 13, no. 19: 10521. https://doi.org/10.3390/su131910521
Note that from the first issue of 2016, this journal uses article numbers instead of page numbers. See further details here.