
Performance Measurement for the Recycling Production System Using Cooperative Game Network Data Envelopment Analysis

1
Department of Telecommunication Engineering, National Kaohsiung University of Science and Technology, Kaohsiung 82445, Taiwan
2
Department of Applied Mathematics, National Chiayi University, Chiayi 600355, Taiwan
*
Author to whom correspondence should be addressed.
Sustainability 2021, 13(19), 11060; https://doi.org/10.3390/su131911060
Submission received: 30 July 2021
/
Revised: 22 August 2021
/
Accepted: 10 September 2021
/
Published: 7 October 2021
(This article belongs to the Topic Industrial Engineering and Management)
Abstract
:Resources scarcity and environmental degradation have made sustainable resource utilization and environmental protection necessary worldwide. The development of the circular economy is considered an approach for more appropriate economic and environmental management. This work introduces a cooperative game network data envelopment analysis model for evaluating the implementation effect of recycling production systems from a closed loop and centralized control perspective. The factor efficiency analysis of the involved inputs and outputs is presented to provide guidance for the factor dominance of subsystem efficiencies. An application for assessing the circular economy of EU countries is provided to illustrate the validation of the proposed method. Our results show that the average performance of the production subsystem is superior to that of the recycling subsystem in EU countries. Furthermore, factor efficiency analysis reveals that the inefficient environmental treatment input is the culprit in worse performance of the recycling subsystem. A comparison of the proposed method with recent studies for circular economy performance evaluation is also included.
1. Introduction
Increasingly tight resource constraints and severe environmental degradation have made the coordination between economic prosperity and environmental regulation a major issue of concern to sustain our living world. The rise of the circular economy is one of the most promising economic trends for sustaining the global ecological system and developing industrial innovation. In a circular economy system, resources can be used sustainably and cyclically to save resources and reduce pollution emissions, satisfying a sustainable economic growth mode [1]. As a typical environment–economy linking system, improving the eco-efficiency of the circular economy system has been gaining a lot of attention and has played an importance role in the development of real economies and environmental protection. Systematic literature reviews on circular economic performance assessment methods have been presented recently [2,3]. Researchers adopted methods such as life-cycle analysis [4], material flow analysis [5], and ecological footprint analysis [6] to evaluate the eco-efficiencies of enterprises and industries. However, most of these methods involve the use of subjective factors to determine the weights of indicators. Data envelopment analysis (DEA) is a well-known frontier approach that effectively avoids the subjectivity of weight determination and uses programming solvers to calculate the input–output decision efficiency of decision making units (DMUs). It is the most efficient tool available for assessing eco-efficiency.
Conventional DEA models regard the production system as a black box when measuring efficiency, ignoring its internal structure. It has been found that ignoring the operations of the components may produce efficiency measures that are misleading when a system is composed of several components operating interdependently [7]. The network DEA model explores the internal structure of the system and examines the different subsystems. This was suggested, for the first time, by Färe and Grosskopf [8]. Then, the multi-stage structures, either with a serial or a parallel or a mixed structure for network DEA models were proposed. Since there are cooperation and conflict relations among subsystems, Cook et al. [9] studied the game issues within the system, and showed that all the existing approaches can be categorized as using either Stackelberg (leader-follower), or cooperative game concepts. Li et al. [10] presented a non-cooperative game DEA model, which assumes that there is a Stackelberg game relation between the two stages. In addition, Liang et al. [11,12] proposed a two-stage cooperative game DEA model, which improves the potential joint efficiency of all subsystems simultaneously.
DEA dealing with the performance measurement of production systems has made great progresses in its theory and application research. However, few extended models consider the circular structure system. Recently, Sun et al. [13] proposed a model using game theory and DEA for estimating and analyzing the circular economic system in China’s different provinces. Their model concerns only internal undesirable outputs while ignores recycled resources. Due to of this omission, their model is arguably unable to show a closed loop network of the circular economy [14]. This work considers introducing a cooperative game network DEA model for evaluating the implementation effect of a recycling production system from a closed loop and centralized control perspective. To provide a guidance for the factor dominance of subsystem efficiencies, the factor efficiency analysis is also presented. An application of the proposed model for assessing the circular economy of EU countries is studied. A comparison of the proposed method with recent studies for the circular economy performance evaluation is also included. The remainder of the paper is organized as follows. In Section 2, the network structure and circular process in the recycling production system are briefly reviewed. The competitive (non-cooperative) game network DEA model for assessing the recycling production system is presented. In Section 3, a cooperative game network DEA model for measuring efficiencies of the recycling production system is introduced. An application for assessing the circular economy of EU countries is provided in Section 4. The paper is concluded in the Section 5.
2. Preliminaries
2.1. The Network Structure and Circular Process in the Recycling Production System
A recycling production model—named the circular economy model states that materials and energy needed for production can be extracted not only from the underground resources, but from the recycling and reuse of emitted waste products—was proposed in the early 1990s [15]. For a micro-enterprise, with the newly developed technology, industrial solid wastes, sewage and waste gas are collected and reused to save new resources inputs and to decrease emissions and pollution of the environment simultaneously [16]. Taking wastewater recycling as an example, Figure 1 shows a typical recycling system. In the water recycling system, the water utilization system produces desirable outputs and turns wastewater into fresh water. The wastewater will be fed into the wastewater treatment system as an input to produce recycling water and wastewater is emitted. The recycled water will become reused water after the wastewater regeneration process and be poured back to the water utilization system.
This work considers a simplified recycling production system, where the overall system can be divided into two subsystems, namely the production system and recycling system, as shown in Figure 2. The production system (subsystem 1) describes the main production process to produce desirable outputs and undesirable output with resources inputs. The recycling system (subsystem 2) illustrates the processes of dealing with the above-mentioned undesirable outputs from industry sectors, especially the treatment and reusing of undesirable outputs. It should be noticed that the undesired outputs from subsystem 1 become one of inputs to subsystem 2, namely the intermediate variables, which will be converted into desired outputs and undesired outputs in subsystem 2. The undesired outputs in subsystem 2 will be emitted into the environment and the desired outputs in subsystem 2 will be fed back into subsystem 1 as a special type of input, which as a whole show a closed-loop feedback cycle for a recycling production system [16].
To evaluate the performance of the recycling production system described in Figure 2, we propose the following notations related to Figure 2. In Figure 2, each consisting of two subsystems, has M direct inputs, and P feedback inputs, to subsystem 1, to produce R desirable outputs, and D undesirable outputs, The output are the final outputs of subsystem 1; while the undesired outputs will be fed into subsystem 2 as inputs, with other controllable inputs, i.e., to produce desirable outputs and undesirable outputs The undesirable outputs are the final outputs of subsystem 2, while the desirable outputs will be poured back to subsystem 1 and become part of inputs to the production process.
2.2. The Competitive Game DEA for Evaluating the Performance of the Recycling Production System
A competitive (non-cooperative) game DEA model for estimating and analyzing the circular economic system in China’s different provinces was proposed by Sun et al. [13] recently. According to their work, a competitive game DEA model for assessing the recycling production system of is presented in (1). Let and be the inefficiency factors, which measure the inefficiency level of the production and recycling subsystems, respectively. The two-stage competitive game DEA model considers the leader-follower relationship between the two subsystems. In model (1), the recycling subsystem is treated as the leader, while the production subsystem is the follower as the inefficiency factor of the production subsystem is introduced into the objective function of (1).
where and are the intensity vectors for weighting each element. According to [13], the efficiency of in the production system is
and the efficiency of in the recycling system is
As mentioned in Section 1, the model (1) is arguably unable to show a closed loop network of the circular economy. To evaluate the implementation effect of recycling production systems from a closed loop and centralized control perspective, we introduce a cooperative game network DEA model in Section 3. Furthermore, the competitive game DEA model (1) can only measure the efficiencies of subsystems, it fails to explain the dominant factors in determining the efficiencies. To provide a guidance for the factor dominance of subsystem efficiencies, the factor efficiency analysis is also presented in Section 3.
3. A Cooperative Game Network DEA Model for Efficiency Measurement of the Recycling Production System
A cooperative game DEA model with a two-stage network was originally proposed by Liang et al. [11,12]. It supposes that the two stages jointly determine a set of optimal weights on the internal factors, and it strives for the maximum potential efficiency of the whole system from a centralized control view of decision makers [17]. In this work, we introduce the cooperative game DEA model in [14] for evaluating the performance of the recycling production system with feedback factors. The extended Färe-Lovell inefficiency of all non-internal factors in both production and recycling systems is introduced and the fixed link to keep the linking internal production unchanged (non-discretionary) is adopted [18]. Moreover, it is assumed that the intermediate undesirable factors and are all consumed. For that the intermediate undesirable factors are used to keep the continuity between the inputs and outputs in the two consecutive stages. When the intermediate undesirable outputs are taken into account in measuring a recycling production system, the DEA reference technology of the production system can be defined as
where is in the production possibility set, and is the intensity vector for weighting each element. In the recycling system, extra inputs are used to reduce the undesirable outputs produced in the production system. The final undesirable outputs are assumed to be freely or strongly disposable. As discussed by Färe et al. [19], free disposability of inputs means that a decision making unit can increase the quantity of any given input while holding other inputs constant and not decreasing outputs. Similar to the production system, the intermediate undesirable factors and are assumed all consumed. According to these assumptions, the DEA reference technology of the recycling system can be expressed as
Considering the continuity of activities at the production system and recycling system [18,20], we define the linkage as
Let the inefficiency factors denoted by measure the corresponding output deficiency and input redundancy of the production and recycling subsystems, respectively, and be the corresponding weight variables determined by decision makers with The cooperative game DEA model for evaluating the performance of the recycling production system of which takes into consideration of maximizing the factor inefficiency of both subsystems into the model’s measurement, can be described as follows [14]:
It should be noted that the model (6) concerns the internal undesirable outputs and recycled resources of both subsystems. Given the results of obtained from (6), the factor efficiencies can be represented as follows:
where and stand for the factor efficiencies of input and output in the production subsystem, respectively, and and refer to the factor efficiencies of input and output in the recycling subsystem. The greater the value of one factor efficiency, the better its performance is.
Based on the definitions of factor efficiencies in (7), the efficiencies of the production and recycling subsystems, denoted by and , respectively, can be considered as the aggregation of corresponding factor efficiencies, as shown in (8).
When there is no input redundancy or output insufficiency. Therefore, the performance of the CE system can be defined as the average of the efficiencies of the production and recycling subsystems as follows:
When all the factors related to the subsystems are efficient, we have Figure 3 presents the steps in the proposed approach.
4. An Application to Assessing the Circular Economy of EU Countries
The recycling production system in this study includes production and recycling subsystems. For the production subsystem, Sun et al. [21] measured the production efficiency attributing to environmental factors. For the recycling subsystem, Wu et al. [16,22] studied the environmental efficiency of two-stage systems with undesired outputs. Based on these studies, in this work, we choose the following indicators for assessing the circular economy of EU countries. In the production subsystem, labor force (), capital (), and total energy consumption () are treated as inputs (), GDP per capita as desirable output (), and total wastes generated () as undesirable output. Since the recycling system reuses the used resources consumed in the production system, the undesirable outputs () in the production subsystem are regarded as the input to be treated with the newly necessary resources (), such as the investment in treatment of environmental wastes and pollution. represents the intermediate variable between the production and recycling subsystems. Moreover, the intermediate variable can be converted into desired outputs () and undesirable outputs () in the recycling subsystem. The desired outputs, such as volume of recycled solid waste , volume of backfill , and energy recovery , will be fed back into sub-system 1 as a special type of inputs, and the undesirable outputs, such as landfill and other () and waste incinerated without energy recovery () will be considered as harmless discharge, having a reduced damage to the environment.
In this study, the EU country data of the above-mentioned variables for measuring the efficiency of recycling production system were collected from waste statistics of Euro states and the world bank data in 2017. The data of the inputs, intermediate measures, and outputs of the 28 EU countries are presented in Table 1.
To evaluate the efficiency for the circular economy system of EU countries, the following cooperative game network DEA model is employed.
The proposed method was coded using Matlab software. The overall efficiencies efficiency of the production subsystem and efficiency of the recycling subsystem calculated from (10) are shown under the heading “Cooperative Game Network DEA” in Table 2. The numbers in parentheses are the rankings of the corresponding DMUs. The overall system efficiency is the average of the process efficiencies, a value between its process efficiencies, and As shown in Table 2 (the second column), Cyprus performs efficiently in both production and recycling subsystems, and so in the efficient overall score. The averages of these three measures are shown in the last row of Table 2. The average efficiency of the production system is higher than that of the recycling system by 12.75%, which indicates that the average performance of the production system is superior to that of the recycling system in the EU countries’ CE system. Figure 4 shows the efficiency scores calculated from the proposed cooperative game network DEA model. It is clear that the inefficiency of the circular economic system is largely attributed to the recycling subsystem in many EU countries.
When the efficiencies and are ranked (the numbers in parentheses), it shows that some countries have a large difference in the rank of efficiencies between the production and recycling subsystems. It also reveals the source that causes the low scores of the whole system. For instance, Denmark performs unsatisfactorily in the recycling subsystem (as compared to the production subsystem) and Austria performs unsatisfactorily in the production subsystem (as compared to the recycling subsystem). However, some countries have similar ranks in and for example, Italy and Latvia. This implies that the performance of the whole process is evenly attributed to the performance of the two subsystems in these countries.
We have also compared the proposed method with the recent proposed competitive game DEA model (1). As mentioned in Section 2.2, the competitive game DEA model (1) obtains only the efficiencies of subsystems, but fails to explain the dominant factors, that determine the efficiencies. The efficiency in both production subsystem, and the recycling subsystem, , is calculated by applying (2) and (3), respectively. The results are shown in the right half of Table 2, under the heading “Competitive Game Network DEA.” Finland and Estonia perform efficiently in both production and recycling subsystems. Belgium, Czechia, Denmark, Germany, Estonia and Finland are efficient in recycling, while Bulgaria, Estonia and Finland are efficient in production. The average efficiency of the production system is lower than that of the recycling system by 25.87% (Table 2), indicating that the average performance of the recycling system is superior to that of the production system. This is because that the recycling system in the competitive game DEA model (1) is treated as the leader, while the production system is treated as the follower. Comparison of results between model (1) and the proposed cooperative game network DEA model in production system is shown in Figure 5, while that in the recycling system is shown in Figure 6. There are significant differences in the efficiency results of the two models. This difference is because the competitive game model (1) considers the leader-follower relationship between the two subsystems.
The factor efficiency analysis is developed in the proposed method to provide a guidance for the factor dominance of subsystem efficiencies. Based on (7) and (8), we can measure all factor efficiencies decomposed form the production and recycling subsystems. Table 3 shows the subsystem efficiency and the factor efficiencies of denoted by , respectively. In the production subsystem, the performance of production inputs is superior to that of production output (GDP) in most countries. For example, the labor force efficiency, capital efficiency, and total energy consumption efficiency of Greece are 0.9915, 0.9916, and 0.9868, respectively, while the GDP efficiency reaches 0.7380, indicating that the low score of in Greece is mainly caused by the worse performance of the production output. It also shows the weakness of the recycling subsystem performance was not caused by the recycling output. The average scores of and are higher than 0.9, while that of is 0.8369. In contrast to recycling output, the recycling input perform poorly which leads to a low-efficiency score for the recycling subsystem. This indicates that various environmental treatment inputs of funds or equipment are underutilized. To promote the efficiency of the recycling subsystem, the utilization efficiency of environmental treatment inputs should be improved by avoiding passive investment in environmental management and making full use of environmental equipment and environmental protection projects.
5. Conclusions
In this study, we present a cooperative game network DEA model for the efficiency measurement of the recycling production system with feedback factors. The cooperative game strategy between subsystems is modeled by maximizing the factor inefficiency of both subsystems into the model’s measurement from a centralized control perspective. The application of the proposed model to assessing the circular economy of EU countries has also been investigated. Our results show that the inefficiency of the circular economic system is largely attributed to the inefficient recycling subsystem in many EU countries. The subsystem efficiencies and their associated ranks can help identify the most influential factors in the performance of the whole system. In addition, the factor efficiency analysis reveals that the inefficient environmental treatment input is the culprit in the worse performance of the recycling subsystem. We have also included a comparison of the proposed method with recent studies for the circular economy performance evaluation. The proposed model can also be applied for evaluation of any circular economy unit within the closed structure and assessment of circular economy performance in enterprises and industries for promoting circular economy development and implementation.
One challenge of achieving an ideal circular economy is the potential loss of quality in regenerated materials (the feedback input in the production subsystem) compared with their virgin counterparts (the resource inputs). This quality reduction could limit the long-term circularity of resources and eventually lead to generation of unrecyclable wastes. In this proposed model, waste generation is taken into consideration and quantified by the undesirable output stream of the recycling subsystem. Recent advancement in recycling technologies allows the regeneration of raw materials or other value-added products without the loss of quality or applicability. It is suggested that an investigation on circular economy modelling approaches with the continuous innovations in sustainable technology is a worthy area for future research.
Author Contributions
Formal analysis, C.-F.H.; Methodology, H.-C.H. Both authors have read and agreed to the published version of the manuscript.
Funding
This research received no external funding.
Conflicts of Interest
The authors declare no conflict of interest.
References
- Simon, B. What are the most significant aspects of supporting the circular economy in the plastic industry? Resour. Conserv. Recy. 2019, 141, 299–300. [Google Scholar] [CrossRef]
- Fan, Y.; Fang, C. Circular economy development in China-current situation, evaluation and policy implications. Environ. Impact Assess. Rev. 2020, 84, 106441. [Google Scholar] [CrossRef]
- Sassanelli, C.; Rosa, P.; Rocca, R.; Terzi, S. Circular economy performance assessment methods: A systematic literature review. J. Clean. Prod. 2019, 229, 440–453. [Google Scholar] [CrossRef]
- Chen, W.; Liu, W.J.; Geng, Y.; Ohnishi, S.; Sun, L.; Han, W.Y.; Tian, X.; Zhong, S.Z. Life cycle based emergy analysis on China’s cement production. J. Clean. Prod. 2016, 131, 1–8. [Google Scholar] [CrossRef]
- Sun, L.; Li, H.; Dong, L.; Fang, K.; Ren, J.Z.; Geng, Y.; Fujii, M.; Zhang, W.; Zhang, N.; Liu, Z. Eco-benefits assessment on urban industrial symbiosis based on material flows analysis and emergy evaluation approach: A case of Liuzhou city, China. Resour. Conserv. Recy. 2017, 119, 78–88. [Google Scholar] [CrossRef] [Green Version]
- Mikulcic, H.; Cabezas, H.; Vujanovic, M.; Duic, N. Environmental assessment of different cement manufacturing processes based on emergy and ecological footprint analysis. J. Clean. Prod. 2016, 130, 1–25. [Google Scholar] [CrossRef] [Green Version]
- Castelli, L.; Pesenti, R.; Ukovich, W. DEA-like models for the efficiency evaluation of hierarchically structured units. Eur. J. Oper. Res. 2004, 154, 465–476. [Google Scholar] [CrossRef]
- Färe, R.; Grosskopf, S. Network DEA. Socio Econ. Plan. Sci. 2000, 4, 35–49. [Google Scholar] [CrossRef]
- Cook, W.D.; Liang, L.; Zhu, J. Measuring performance of two-stage network structures by DEA: A review and future perspective. Omega 2010, 38, 423–430. [Google Scholar] [CrossRef]
- Li, H.; Chen, C.; Cook, W.D.; Zhang, J.; Zhu, J. Two-stage network DEA: Who is the leader? Omega 2018, 74, 15–19. [Google Scholar] [CrossRef]
- Liang, L.; Yang, F.; Cook, W.D.; Zhu, J. DEA models for supply chain efficiency evaluation. Ann. Oper. Res. 2006, 145, 35–49. [Google Scholar] [CrossRef]
- Liang, L.; Cook, W.D.; Zhu, J. DEA models for two-stage processes: Game approach and efficiency decomposition. Nav. Res. Logist. 2008, 55, 643–653. [Google Scholar] [CrossRef]
- Sun, J.; Li, G.; Wang, Z. Technology heterogeneity and efficiency of China’s circular economic systems: A game meta-frontier DEA approach. Resour. Conserv. Recycl. 2019, 146, 337–347. [Google Scholar] [CrossRef]
- Ding, L.-L.; Lei, L.; Wang, L.; Zhang, L.; Calin, A.C. A novel cooperative game network DEA model for marine circular economy performance evaluation of China. Clean. Prod. 2020, 253, 120071. [Google Scholar] [CrossRef]
- Pearce, D.; Turner, R.K. Economics of Natural Resources and the Environment; The Johns Hopkins University Press: Baltimore, MD, USA, 1998. [Google Scholar]
- Wu, H.; Liu, Y.; Xia, Q.; Zhu, W. Measuring efficiency of recycling systems based on data envelopment analysis (DEA) network: A case from Chinese provincial circular economy. Environ. Eng. Manag. J. 2014, 13, 1089–1099. [Google Scholar]
- Zha, Y.; Liang, L. Two-stage cooperation model with input freely distributed among the stages. Eur. J. Oper. Res. 2010, 205, 332–338. [Google Scholar] [CrossRef]
- Tone, K.; Tsutsui, M. Dynamic DEA with network structure: A slacks-based measure approach. Omega 2014, 42, 124–131. [Google Scholar] [CrossRef] [Green Version]
- Färe, R.; Grosskopf, S.; Pasurka, S. Environmental production functions and environmental directional distance functions. Energy 2010, 32, 1055–1066. [Google Scholar] [CrossRef]
- Tone, K.; Tsutsui, M. Network DEA: A slacks-based measure approach. Eur. J. Oper. Res. 2009, 197, 243–252. [Google Scholar] [CrossRef] [Green Version]
- Sun, J.; Yuan, Y.; Yang, R.; Ji, X.; Wu, J. Performance evaluation of Chinese port enterprises under significant environmental concerns: An extended DEA-based analysis. Transp. Policy 2017, 60, 75–86. [Google Scholar] [CrossRef]
- Wu, J.; Chu, J.; Zhu, Q.; Yin, P.; Liang, L. DEA cross-efficiency evaluation based on satisfaction degree: An application to technology selection. Int. J. Prod. Res. 2016, 54, 5990–6007. [Google Scholar] [CrossRef]
Figure 1.
A water recycling system.

Figure 2.
A recycling production system.

Figure 3.
The steps in the proposed approach.
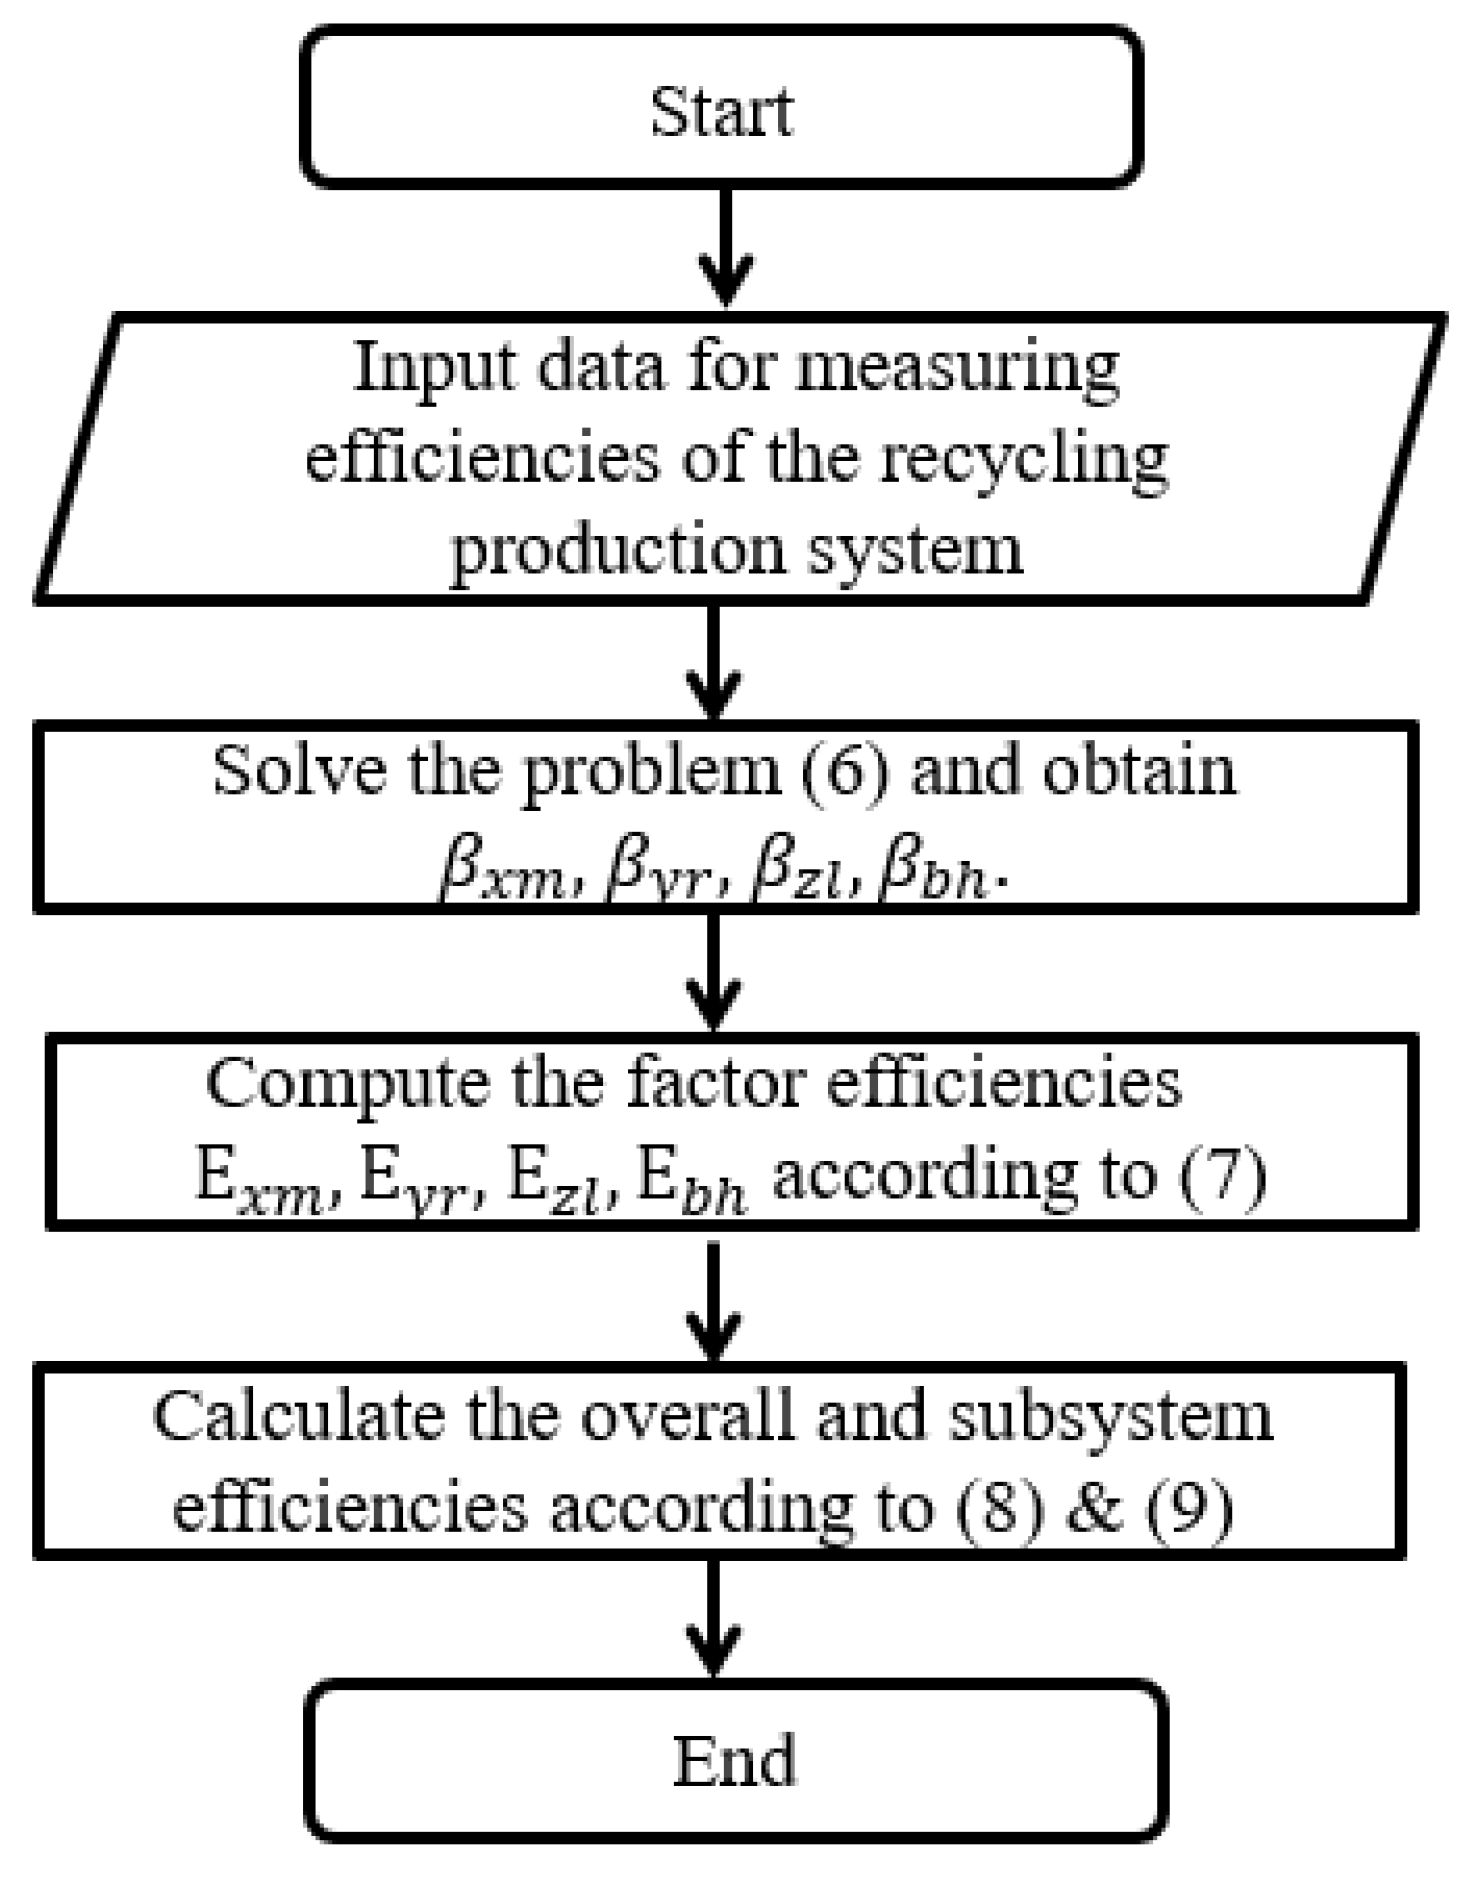
Figure 4.
The efficiency scores calculated from the proposed method.
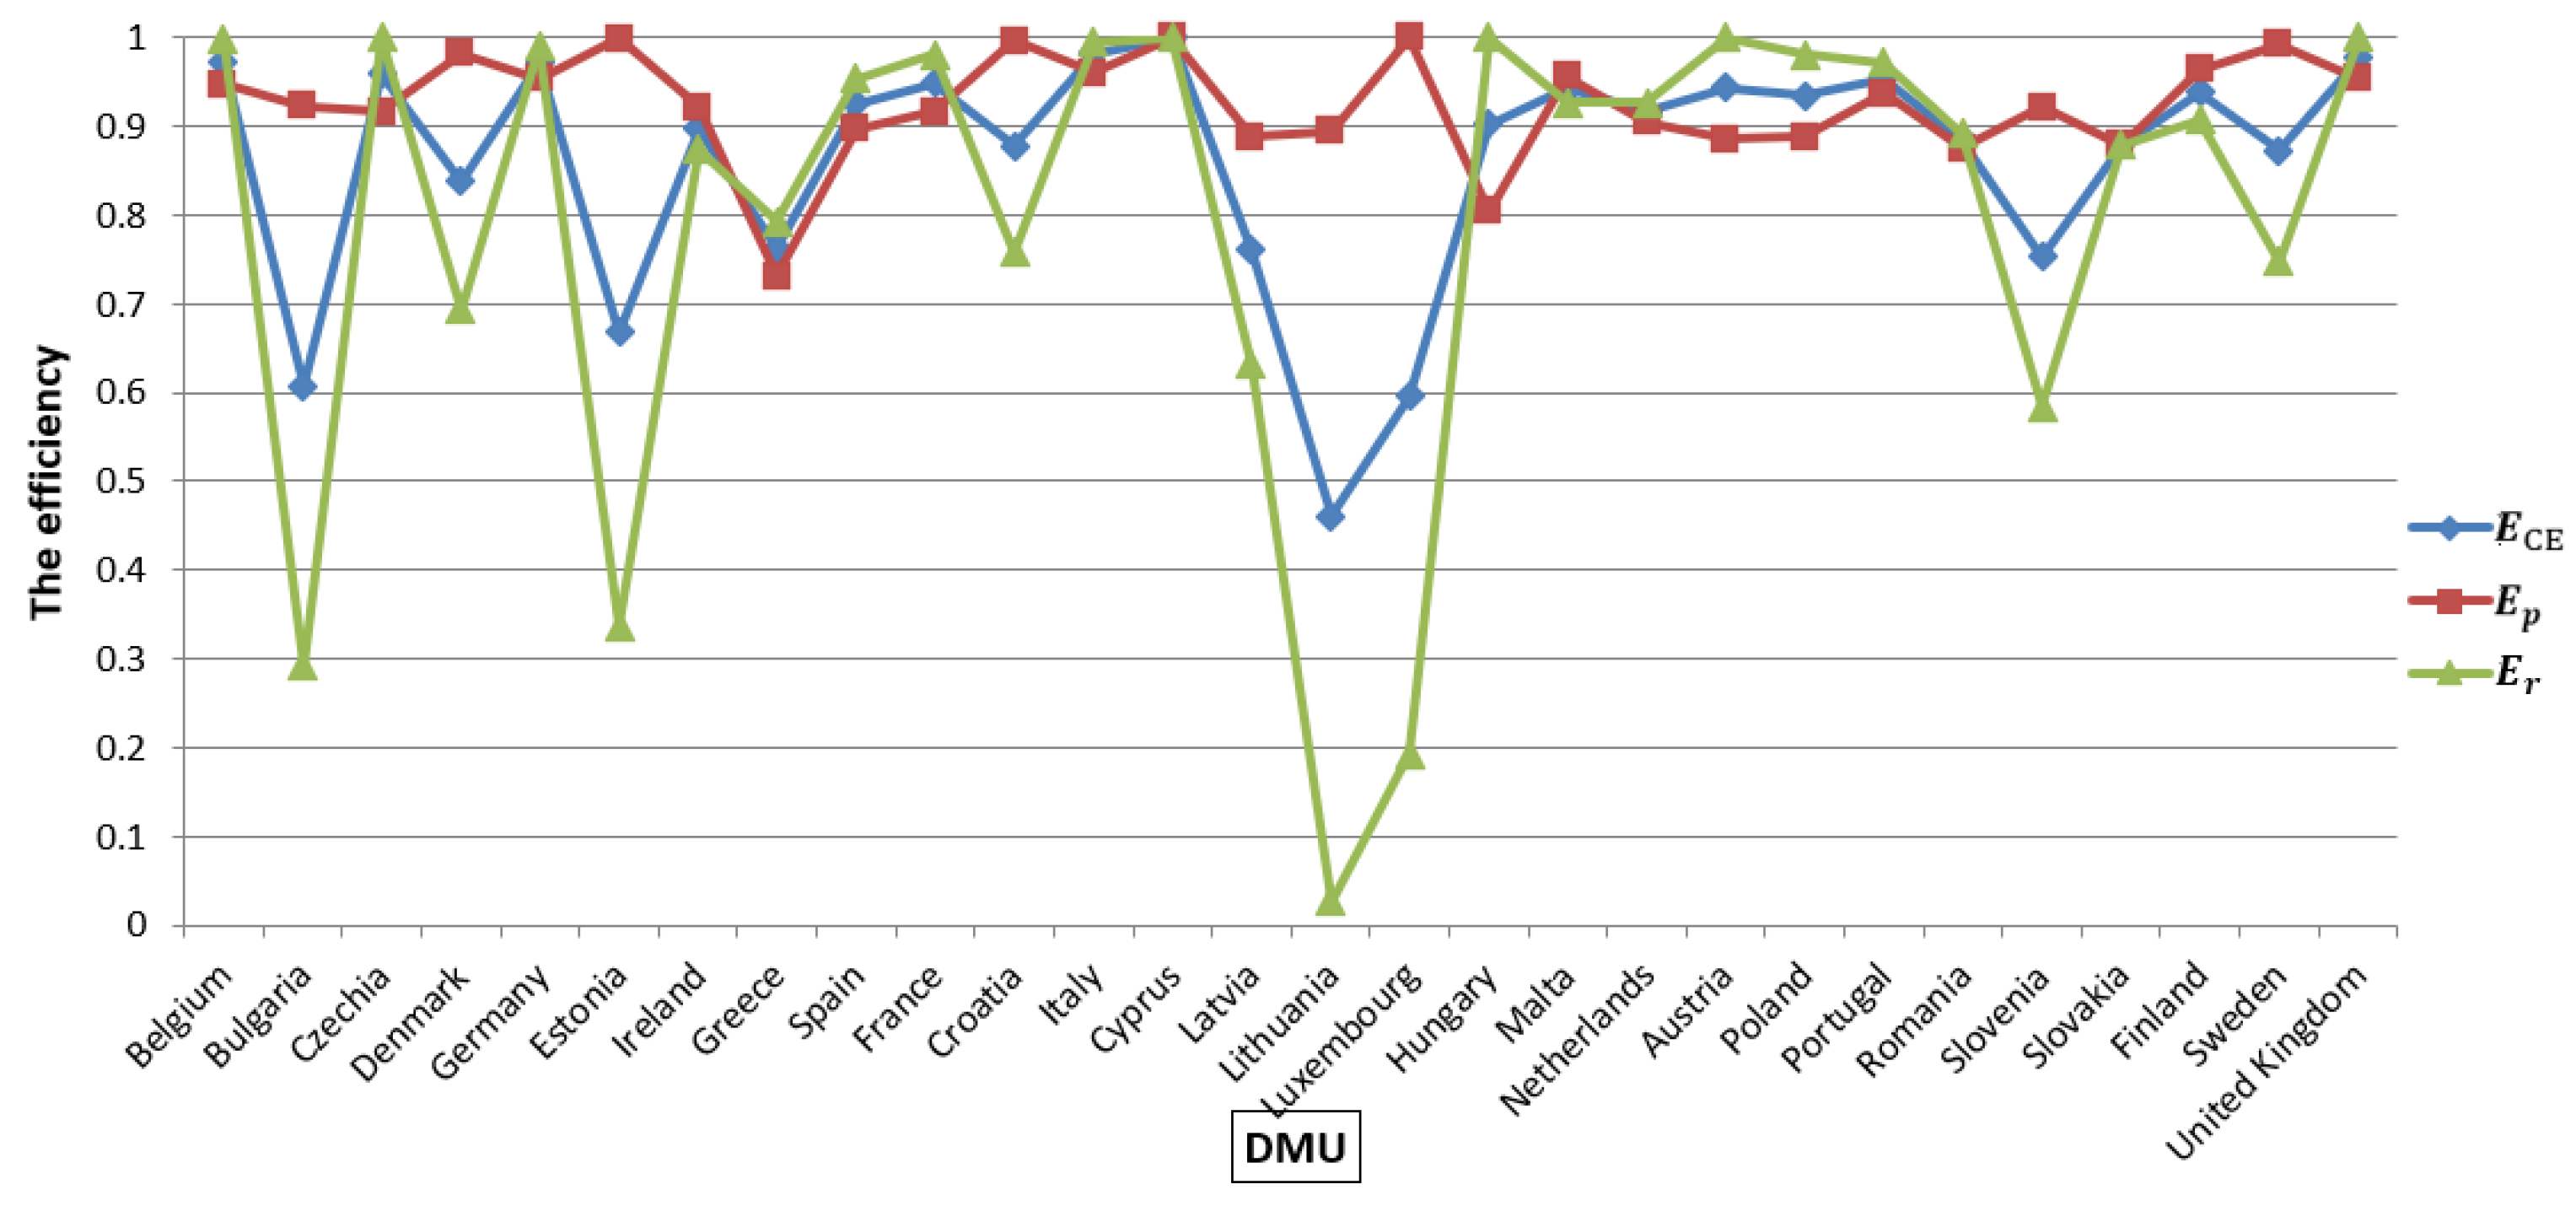
Figure 5.
Comparison of efficiency results in the production subsystem.

Figure 6.
Comparison of efficiency results in the recycling subsystem.


Table 1.
Data set for assessing efficiency for the recycling production system of EU countries.
| DMU | |||||||||||
|---|---|---|---|---|---|---|---|---|---|---|---|
| BE | 5004.72 | 109,635.23 | 36,332.6 | 46,000 | 63,150,004 | 2246 | 401,821,505.1 | 260,944,420.8 | 4,855,292,916 | 0 | 796,941,524 |
| BG | 4025.73 | 9889.20 | 9662.7 | 20,900 | 120,510,053 | 262.2 | 11,377,402,360 | 1,228,940.446 | 624,743,431 | 0 | 47,630,543 |
| CZ | 5387.52 | 48,753.81 | 24,880.6 | 34,200 | 25,380,325 | 489.1 | 421,402,923.7 | 8,969,823.401 | 1,256,506,220 | 736,788,139 | 114,365,359 |
| DK | 3024.43 | 62,642.40 | 14,449.5 | 49,300 | 20,981,701 | 73.2 | 611,036,025.7 | 453,589.4241 | 1,077,685,765 | 0 | 408,994,682 |
| DE | 43,294.64 | 696,913.18 | 216,447.3 | 49,800 | 400,049,839 | 5139 | 7,258,425,559 | 474,079,860.6 | 17,091,404,085 | 10,641,085,528 | 4,539,988,852 |
| EE | 694.11 | 5212.53 | 2818.3 | 30200 | 24,277,641 | 39.5 | 1,571,046,418 | 7207.720416 | 523,501,743 | 271,321,686 | 61,887,076 |
| IE | 2248.29 | 97,003.40 | 11,609.7 | 69,100 | 15,483,387 | 11.4 | 595,176,663.3 | 3,974,931.141 | 163,521,509 | 712,096,348 | 73,569,252 |
| EL | 4906.56 | 22,630.08 | 16,702.7 | 27,400 | 69,009,312 | 1045 | 6,101,405,554 | 2,254,867.174 | 223,834,033 | 559,291,350 | 14,145,383 |
| ES | 23,016.54 | 247,385.30 | 82,497.8 | 37,200 | 128,946,782 | 5561 | 6,917,730,969 | 1,630,152.259 | 4,782,727,890 | 729,903,060 | 462,686,172 |
| FR | 30,319.99 | 539,810.88 | 147,158.6 | 43,200 | 323,467,567 | 10,927 | 8,912,319,950 | 529,931,991.7 | 17,805,492,324 | 3,347,460,780 | 1,751,551,681 |
| HR | 1833.27 | 10,352.94 | 6639 | 23,800 | 5,280,553 | 3 | 252,644,927.4 | 8025.833542 | 248,979,558 | 21,330,946 | 5,091,818 |
| IT | 25,584.17 | 318,657.86 | 115,930.6 | 37,600 | 163,997,388 | 10,323.1 | 2,330,759,325 | 44,806,8861.9 | 12,940,757,588 | 16,749,969 | 663,403,006 |
| CY | 611.51 | 3610.62 | 1758 | 36,100 | 3,384,016 | 37.6 | 195,647,721.8 | 0 | 35,308,927 | 94,608,345 | 1,2836,602 |
| LV | 1008.67 | 5019.44 | 3820.3 | 26,200 | 2,531,726 | 86.5 | 5,151,4453.72 | 27,299.07299 | 181,524,359 | 2,877,570 | 17,228,886 |
| LT | 1481.03 | 8090.61 | 5108.4 | 6,645,689 | 146.3 | 376,219,111.1 | 265,115.2405 | 222,175,413 | 27,546,012 | 38,363,239 | |
| LU | 281.98 | 10,079.65 | 4038.9 | 105,400 | 136.6 | 394,682,009.3 | 447.388895 | 352,026,252 | 244,913,566 | 21,366,130 | |
| HU | 4686.10 | 24,195.73 | 17,865.2 | 28,300 | 15,908,526 | 159.2 | 544,534,135.6 | 9,173,793.23 | 861,341,728 | 58,137,346 | 117,665,638 |
| MT | 212.81 | 2613.15 | 583.7 | 40,100 | 1,971,253 | 58.6 | 33,840,198.53 | 729,659.0766 | 37,642,029 | 124,913,458 | 0 |
| NL | 9050.42 | 154,915.44 | 49,517 | 52,800 | 141,027,997 | 3827 | 6,484,656,382 | 123,312,495 | 6,429,380,745 | 0 | 1,065,450,090 |
| AT | 4535.20 | 90,187.98 | 28,127.9 | 49,000 | 61,226,583 | 174.5 | 2,809,451,363 | 1,867,412 | 2,264,108,063 | 675,844,441 | 1,867,412 |
| PL | 18,393.55 | 84,961.32 | 66,652 | 28,300 | 181,990,641 | 372.7 | 5,095,006,125 | 63,893,549.64 | 8,399,307,294 | 4,036,605,469 | 604,251,699 |
| PT | 5207.27 | 31,296.05 | 16,114.8 | 29,600 | 14,734,417 | 425.5 | 510,697,523.8 | 3,546,142.319 | 640,596,720 | 140,172,510 | 178,428,819 |
| RO | 8939.35 | 43,109.53 | 22,280.2 | 22,900 | 177,557,398 | 508.3 | 1,670,2885,666 | 10,101,348.96 | 714,524,681 | 77,559,190 | 250,668,909 |
| SI | 996.96 | 7859.45 | 4875.5 | 32,900 | 5,517,787 | 42.1 | 38,252,271.38 | 4,285,174.818 | 332,376,636 | 150,325,015 | 26,539,590 |
| SK | 2762.41 | 19,021.79 | 10,418.4 | 32,000 | 10,606,352 | 319.7 | 50,6588,801 | 4,865,030.324 | 424,682,144 | 49,836,276 | 74,662,989 |
| FI | 2687.20 | 51,490.26 | 25,248.8 | 43,400 | 122,869,413 | 75 | 10,816,368,847 | 5,368,598.21 | 908,084,245 | 0 | 557,119,580 |
| SE | 5245.27 | 123,749.83 | 32,590.9 | 50,800 | 141,622,198 | 760.1 | 10,806,010,637 | 22,813,777.52 | 1,702,475,279 | 694,274,083 | 936,645,999 |
| UK | 33,693.49 | 437,140.07 | 133,688.5 | 43,800 | 277,272,474 | 13,601.3 | 10,410,809,602 | 735,540,574 | 13,457,214,835 | 2,175,093,717 | 948,588,194 |
BE: Belgium; BG: Bulgaria; CZ: Czechia; DK: Denmark; DE: Germany; EE: Estonia; IE: Ireland; EL: Greece; ES: Spain; FR: France; HR: Croatia; IT: Italy; CY: Cyprus; LV: Latvia; LT: Lithuania; LU: Luxembourg; HU: Hungary; MT: Malta; NL: Netherlands; AT: Austria; PL: Poland; PT: Portugal; RO: Romania; SI: Slovenia; SK: Slovakia; FI: Finland; SE: Sweden; UK: United Kingdom.
Table 2.
Efficiency scores and the associated rankings (in parentheses).
| Cooperative | Game | Network | Competitive | Game | |
|---|---|---|---|---|---|
| DEA | Network | DEA | |||
| DMU | |||||
| Belgium | 0.9723 (4) | 0.9471 (12) | 0.9976 (6) | 0.9999 (4) | 1.0000 (1) |
| Bulgaria | 0.6073 (26) | 0.9230 (14) | 0.2917 (26) | 1.0000 (1) | 0.9996 (7) |
| Czechia | 0.9586 (6) | 0.9172 (17) | 1.0000 (1) | 0.4174 (20) | 1.0000 (1) |
| Denmark | 0.8379 (21) | 0.9820 (6) | 0.6937 (22) | 0.7913 (18) | 1.0000 (1) |
| Germany | 0.9721 (5) | 0.9545 (10) | 0.9897 (8) | 0.2953 (22) | 1.0000 (1) |
| Estonia | 0.6681 (25) | 0.9996 (3) | 0.3366 (25) | 1.0000 (1) | 1.0000 (1) |
| Ireland | 0.8978 (16) | 0.9220 (15) | 0.8736 (18) | 0.0004 (28) | 0.6504 (28) |
| Greece | 0.7620 (22) | 0.7306 (28) | 0.7935 (19) | 0.9985 (7) | 0.9930 (15) |
| Spain | 0.9251 (13) | 0.8967 (20) | 0.9535 (12) | 0.1901 (25) | 0.9849 (18) |
| France | 0.9484 (8) | 0.9162 (18) | 0.9806 (10) | 0.0652 (27) | 0.9475 (25) |
| Croatia | 0.8773 (19) | 0.9964 (4) | 0.7583 (20) | 0.9918 (11) | 0.9697 (22) |
| Italy | 0.9819 (2) | 0.9609 (8) | 0.9948 (7) | 0.2311 (23) | 0.9609 (23) |
| Cyprus | 1.0000 (1) | 1.0000 (1) | 1.0000 (1) | 0.9691 (14) | 0.9797 (19) |
| Latvia | 0.7606 (23) | 0.8888 (22) | 0.6323 (23) | 0.8972 (16) | 0.9338 (27) |
| Lithuania | 0.4608 (28) | 0.8945 (21) | 0.0268 (28) | 0.9180 (15) | 0.9947 (14) |
| Luxembourg | 0.5961 (27) | 1.0000 (1) | 0.1922 (27) | 0.9998 (5) | 0.9351 (26) |
| Hungary | 0.9023 (15) | 0.8047 (27) | 0.9999 (5) | 0.3370 (21) | 0.9969 (12) |
| Malta | 0.9417 (10) | 0.9565 (9) | 0.9269 (14) | 0.9933 (9) | 0.9579 (24) |
| Netherlands | 0.9161 (14) | 0.9049 (19) | 0.9271 (13) | 0.9993 (6) | 0.9988 (8) |
| Austria | 0.9430 (9) | 0.8860 (24) | 1.0000 (1) | 0.9965 (8) | 0.9965 (13) |
| Poland | 0.9347 (12) | 0.8879 (23) | 0.9816 (9) | 0.9817 (12) | 0.9925 (16) |
| Portugal | 0.9542 (7) | 0.9366 (13) | 0.9718 (11) | 0.1420 (26) | 0.9909 (17) |
| Romania | 0.8840 (17) | 0.8760 (26) | 0.8920 (16) | 0.9794 (13) | 0.9978 (11) |
| Slovenia | 0.7530 (24) | 0.9215 (16) | 0.5846 (24) | 0.9926 (10) | 0.9979 (10) |
| Slovakia | 0.8792 (18) | 0.8796 (25) | 0.8789 (17) | 0.2240 (24) | 0.9792 (20) |
| Finland | 0.9385 (11) | 0.9637 (7) | 0.9079 (15) | 1.0000 (1) | 1.0000 (1) |
| Sweden | 0.8729 (20) | 0.9932 (5) | 0.7482 (21) | 0.7069 (19) | 0.9777 (21) |
| United Kingdom | 0.9771 (3) | 0.9542 (11) | 1.0000 (1) | 0.8728 (17) | 0.9987 (9) |
| Average | 0.8615 | 0.9251 | 0.7976 0.7139 | 0.9726 |
Table 3.
The subsystem efficiency and the factor efficiencies.
| DMU | |||||||||
|---|---|---|---|---|---|---|---|---|---|
| Belgium | 0.9471 | 0.9972 | 0.9981 | 0.9992 | 0.9489 | 0.9976 | 0.9993 | 0.9968 | 0.9998 |
| Bulgaria | 0.9229 | 0.9972 | 0.9827 | 0.9975 | 0.9299 | 0.2917 | 0.2944 | 0.9817 | 0.9997 |
| Czechia | 0.9172 | 0.9704 | 0.9707 | 0.9844 | 0.9406 | 1.0000 | 1.0000 | 1.0000 | 1.0000 |
| Denmark | 0.9820 | 0.9977 | 0.9983 | 0.9992 | 0.9836 | 0.6937 | 0.6939 | 0.9995 | 1.0000 |
| Germany | 0.9545 | 0.9997 | 1.0000 | 0.9998 | 0.9547 | 0.9897 | 0.9900 | 0.9994 | 1.0000 |
| Estonia | 0.9996 | 0.9999 | 0.9999 | 1.0000 | 0.9997 | 0.3365 | 0.3366 | 0.9996 | 1.0000 |
| Ireland | 0.9220 | 0.9951 | 0.9793 | 0.9866 | 0.9341 | 0.8737 | 0.9821 | 0.7793 | 0.9999 |
| Greece | 0.7306 | 0.9915 | 0.9916 | 0.9868 | 0.7380 | 0.7936 | 0.7993 | 0.9858 | 0.9998 |
| Spain | 0.8967 | 0.9487 | 0.9471 | 0.9753 | 0.9369 | 0.9534 | 0.9996 | 0.9076 | 1.0000 |
| France | 0.9162 | 0.9963 | 0.9409 | 0.9984 | 0.9363 | 0.9806 | 1.0000 | 0.9612 | 1.0000 |
| Croatia | 0.9964 | 0.9975 | 0.9982 | 0.9978 | 0.9986 | 0.7582 | 0.7831 | 0.9365 | 1.0000 |
| Italy | 0.9690 | 0.9989 | 0.9984 | 0.9993 | 0.9701 | 0.9949 | 0.9967 | 0.9965 | 0.9998 |
| Cyprus | 1.0000 | 1.0000 | 1.0000 | 1.0000 | 1.0000 | 1.0000 | 1.0000 | 1.0000 | 1.0000 |
| Latvia | 0.8888 | 0.8970 | 0.9504 | 0.9323 | 0.9592 | 0.6323 | 0.7941 | 0.5926 | 0.9986 |
| Lithuania | 0.8948 | 0.8846 | 0.9663 | 0.9340 | 0.9640 | 0.0268 | 0.0322 | 0.6666 | 0.9999 |
| Luxembourg | 0.9998 | 0.9999 | 0.9999 | 1.0000 | 0.9999 | 0.1923 | 0.1923 | 0.9997 | 1.0000 |
| Hungary | 0.8047 | 0.8840 | 0.9840 | 0.9361 | 0.8608 | 0.9999 | 1.0000 | 0.9998 | 1.0000 |
| Malta | 0.9565 | 0.9600 | 0.9741 | 0.9869 | 0.9823 | 0.9270 | 0.9974 | 0.8589 | 0.9999 |
| Netherlands | 0.9049 | 0.9887 | 0.9905 | 0.9990 | 0.9115 | 0.9237 | 0.9747 | 0.9034 | 0.9995 |
| Austria | 0.8860 | 0.9875 | 0.9429 | 0.9732 | 0.9154 | 1.0000 | 1.0000 | 1.0000 | 1.0000 |
| Poland | 0.8879 | 0.9987 | 0.9960 | 0.9990 | 0.8898 | 0.9815 | 0.9823 | 0.9991 | 0.9993 |
| Portugal | 0.9366 | 0.9731 | 0.9909 | 0.9857 | 0.9526 | 0.9718 | 1.0000 | 0.9435 | 1.0000 |
| Romania | 0.8760 | 0.9790 | 0.9818 | 0.9950 | 0.8891 | 0.8920 | 0.9030 | 0.9762 | 0.9995 |
| Slovenia | 0.9215 | 0.9188 | 0.9569 | 0.8977 | 0.9968 | 0.5845 | 0.9958 | 0.1745 | 0.9995 |
| Slovakia | 0.8796 | 0.8457 | 0.9149 | 0.8833 | 0.9981 | 0.8789 | 0.9822 | 0.7898 | 0.9998 |
| Finland | 0.9637 | 0.9976 | 0.9973 | 0.9983 | 0.9659 | 0.9079 | 0.9199 | 0.9742 | 0.9997 |
| Sweden | 0.9932 | 0.9953 | 0.9942 | 0.9973 | 0.9976 | 0.7498 | 0.7856 | 0.9095 | 0.9994 |
| United Kingdom | 0.9542 | 0.9582 | 0.9338 | 0.9926 | 0.9924 | 0.9999 | 1.0000 | 0.9999 | 1.0000 |
| Average | 0.9251 | 0.9699 | 0.9778 | 0.9798 | 0.9481 | 0.7976 | 0.8368 | 0.9047 | 0.9998 |
Publisher’s Note: MDPI stays neutral with regard to jurisdictional claims in published maps and institutional affiliations. |
© 2021 by the authors. Licensee MDPI, Basel, Switzerland. This article is an open access article distributed under the terms and conditions of the Creative Commons Attribution (CC BY) license (https://creativecommons.org/licenses/by/4.0/).
Share and Cite
MDPI and ACS Style
Huang, H.-C.; Hu, C.-F. Performance Measurement for the Recycling Production System Using Cooperative Game Network Data Envelopment Analysis. Sustainability 2021, 13, 11060. https://doi.org/10.3390/su131911060
AMA Style
Huang H-C, Hu C-F. Performance Measurement for the Recycling Production System Using Cooperative Game Network Data Envelopment Analysis. Sustainability. 2021; 13(19):11060. https://doi.org/10.3390/su131911060
Chicago/Turabian StyleHuang, Huang-Chu, and Cheng-Feng Hu. 2021. "Performance Measurement for the Recycling Production System Using Cooperative Game Network Data Envelopment Analysis" Sustainability 13, no. 19: 11060. https://doi.org/10.3390/su131911060
Note that from the first issue of 2016, this journal uses article numbers instead of page numbers. See further details here.