Article

A Modeling Framework: To Analyze the Relationship between Accessibility, Land Use and Densities in Urban Areas

by
Amila Jayasinghe
*,
N. B. S. Madusanka
,
Chethika Abenayake
and
P. K. S. Mahanama
Urban Simulation Lab, Department of Town and Country Planning, University of Moratuwa, Moratuwa 10400, Sri Lanka
*
Author to whom correspondence should be addressed.
Sustainability 2021, 13(2), 467; https://doi.org/10.3390/su13020467
Submission received: 17 November 2020 / Revised: 2 December 2020 / Accepted: 5 December 2020 / Published: 6 January 2021
(This article belongs to the Special Issue Advanced Modelling Tools to Support Urban and Regional Planning)

Abstract

:
The study proposes a framework to model the three-dimensional relationship among density, land use, and accessibility in urban areas constructively contributing to overcome the limitations noted in the domains of urban planning and transport planning. First, most of the existing studies have focused on the topological characteristics in capturing the accessibility, but a limited attention has been given on measuring the accessibility by considering both topological and roadway characteristics. Second, the existing research studies have acknowledged the relationship among density, land use, and accessibility while a limited attention has been given to develop a modeling framework to capture the three-dimensional relationship. The modelling framework was tested in three urban areas in Sri Lanka. The research first analyzed the three-dimensional relationship among density, land use, and accessibility in the case studies. Then, the study developed a set of regression models to capture the density from the land use and accesability. The proposed model recorded a satisfactory level of accuracy (i.e., R2 > 0.70) on a par with internationally accepted standards. The relationship was further elaborated through a decision tree analysis and 4D plot diagrams. Findings of the study can be utilized to model the density of a given land use and the correspondent accessibility scenarios. The proposed model is capable of quantifying the impact of the changes in the density correspondent to the accessibility and land use. Therefore, the study concludes that this will be an effective tool for decision-makers in the fields of land-use planning and transport planning for scenario building, impact analysis, and the formulation of land use zoning and urban development plans aiming at the overarching sustainability of future cities.

1. Introduction

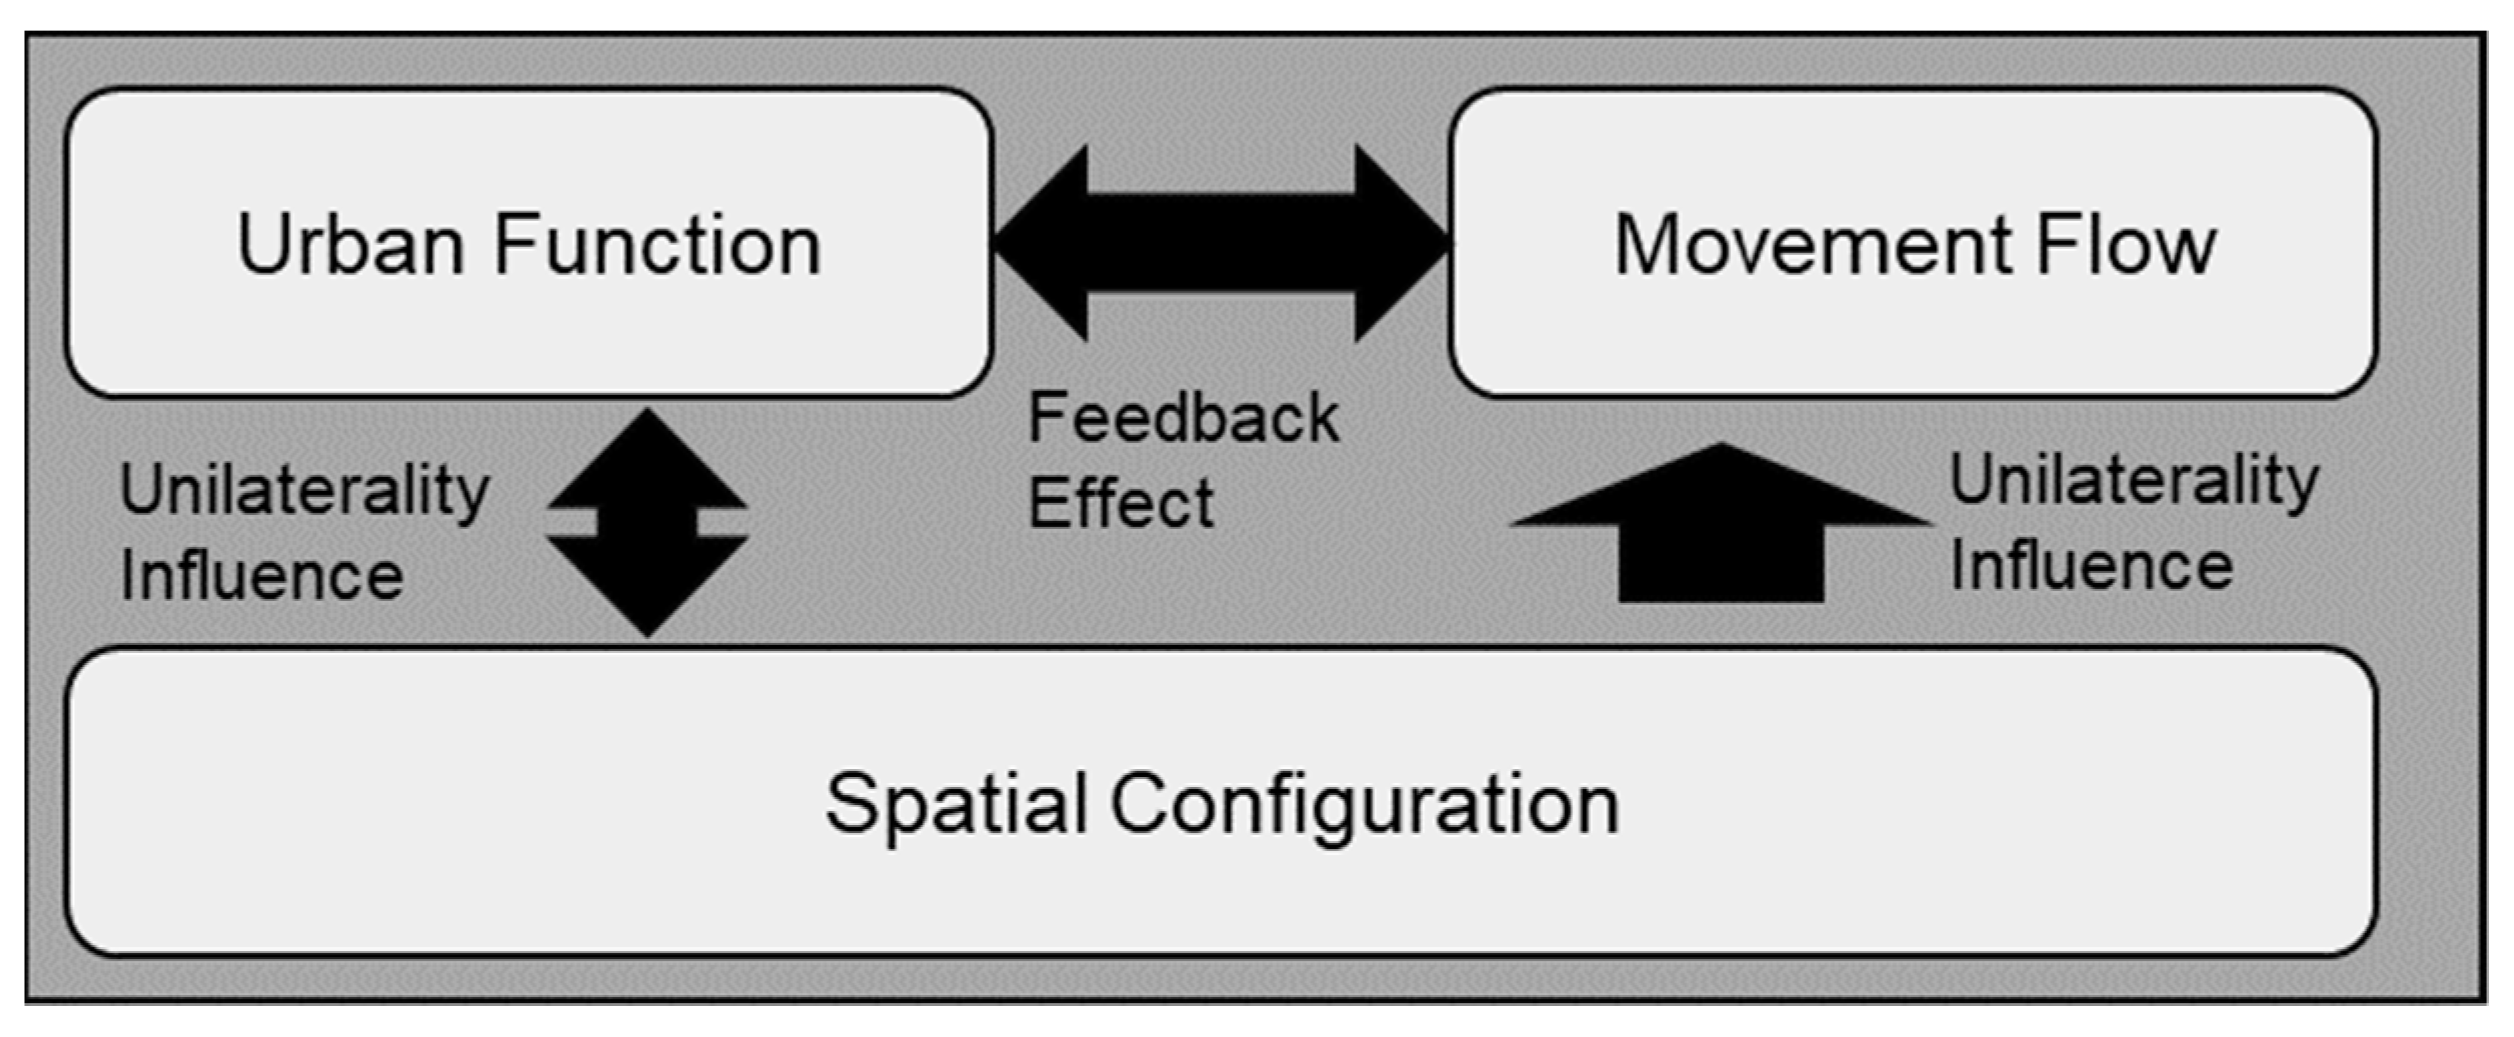
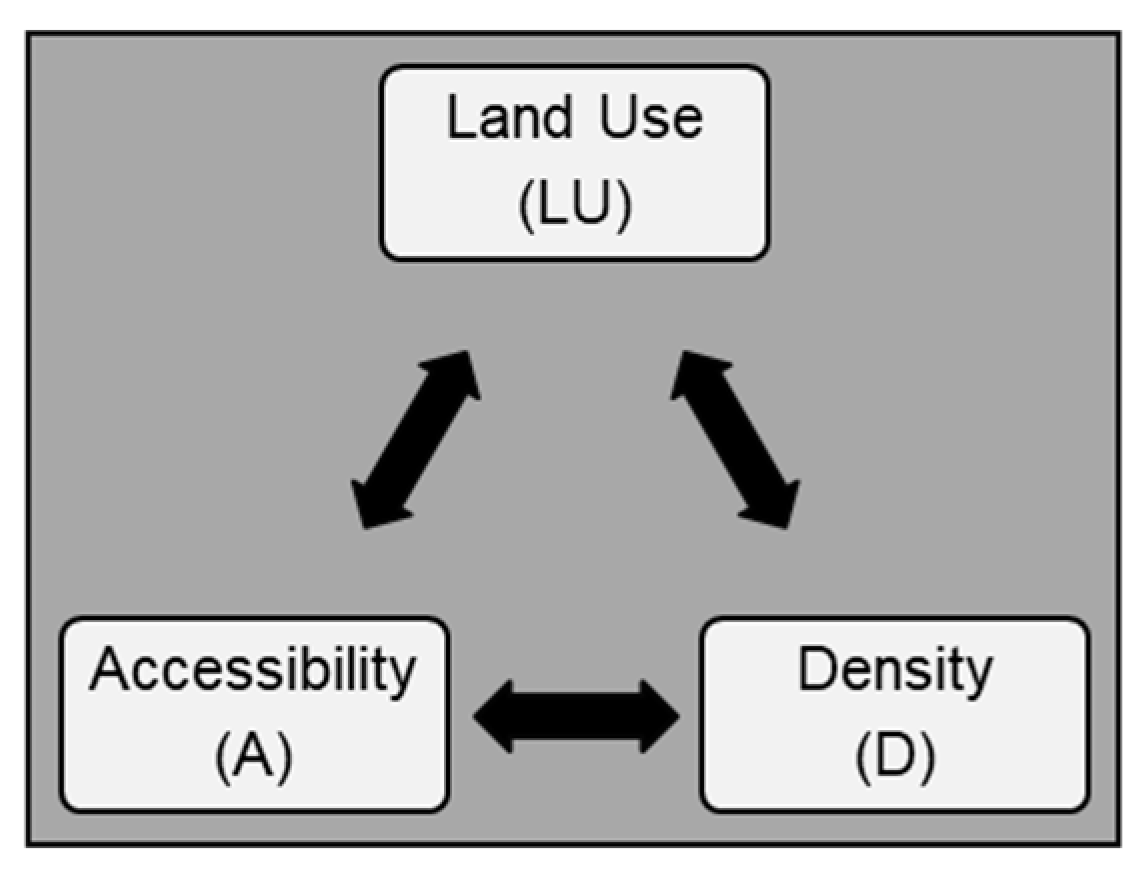
The link among density and accessibility is one of the critical factors in urban planning and transport planning [1]. Many contemporary researchers have acknowledged the relationship between density, accessibility, and land use [2]. In addition, density, land use, and accessibility factors have been identified as main characteristics of the urban form of the city [3]. Therefore, urban planners and transport planers should have a profound understanding about the dynamic interactions between the characteristics of the urban form of the city. This is because the change of one component can influence the change of another. According to Hellervik, Nilsson, and Andersson, planners need to integrate land use and transport plans [3]. Without a proper understanding about the static and dynamic relationships, planners cannot make a strategic intervention to achieve the envisaged urban form [4]. Currently, planners mostly opt for the strategic planning approach which makes strategic interventions for planning issues. Nevertheless, most of the planning interventions fail to achieve the envisaged urban form of the plan. One of the main reasons is the lack of comprehension on the dynamic relationships between the major components of the urban form, particularly density, land use, and accessibility. When decision-makers are not clever enough to grasp the natural dynamic relationships of the urban form, the vision tends to be overlooked by these dynamics and turns towards an unforeseen direction. Nonetheless, the dynamics of the urban form will be continued reacting to the real ground situations. For instance, Windle [5] mentioned that in Mumbai, India, the population density is 3230 per hectare whereas the maximum floor area ratio is 1:1.33. That numeral does not suit the existing and future population attractions to the city. Such population attractions have been driven by the accessibility and land use. Such problems could not have been occurred if the relationship among accessibility, land use, and population density had been modelled. That is the point where the derived urban form is going to be differed with the planners’ vision [4,6]. Hence, a peculiar awareness of the urban form and its dynamic relationships is required for a desirable planning practices in the real ground applications. Most planners are aware of this relationship and its impact theoretically, but the models are not developed to capture that scenario numerically [4,6]. Hence, most of the literature has explained the need for a quantitative framework to model the relationships among the aspects of the urban form [4,7]. Identification of the relationship among the elements of the urban form is a valuable insight for decision-makers such as urban planners, transport planners, and engineers to make cities more sustainable. Accordingly, various empirical studies have been carried out to identify the relationship between elements of the urban form. Hillier and his team have developed the “space syntax” theory and technique to analyze these relationships between the aspects of the urban form. Recent empirical studies have been found that there is a robust association of the configuration of the urban form (accessibility) with factors such as employment [8,9], density [10,11], the distribution of land use [6,12], and the distribution of activities in urban areas [13,
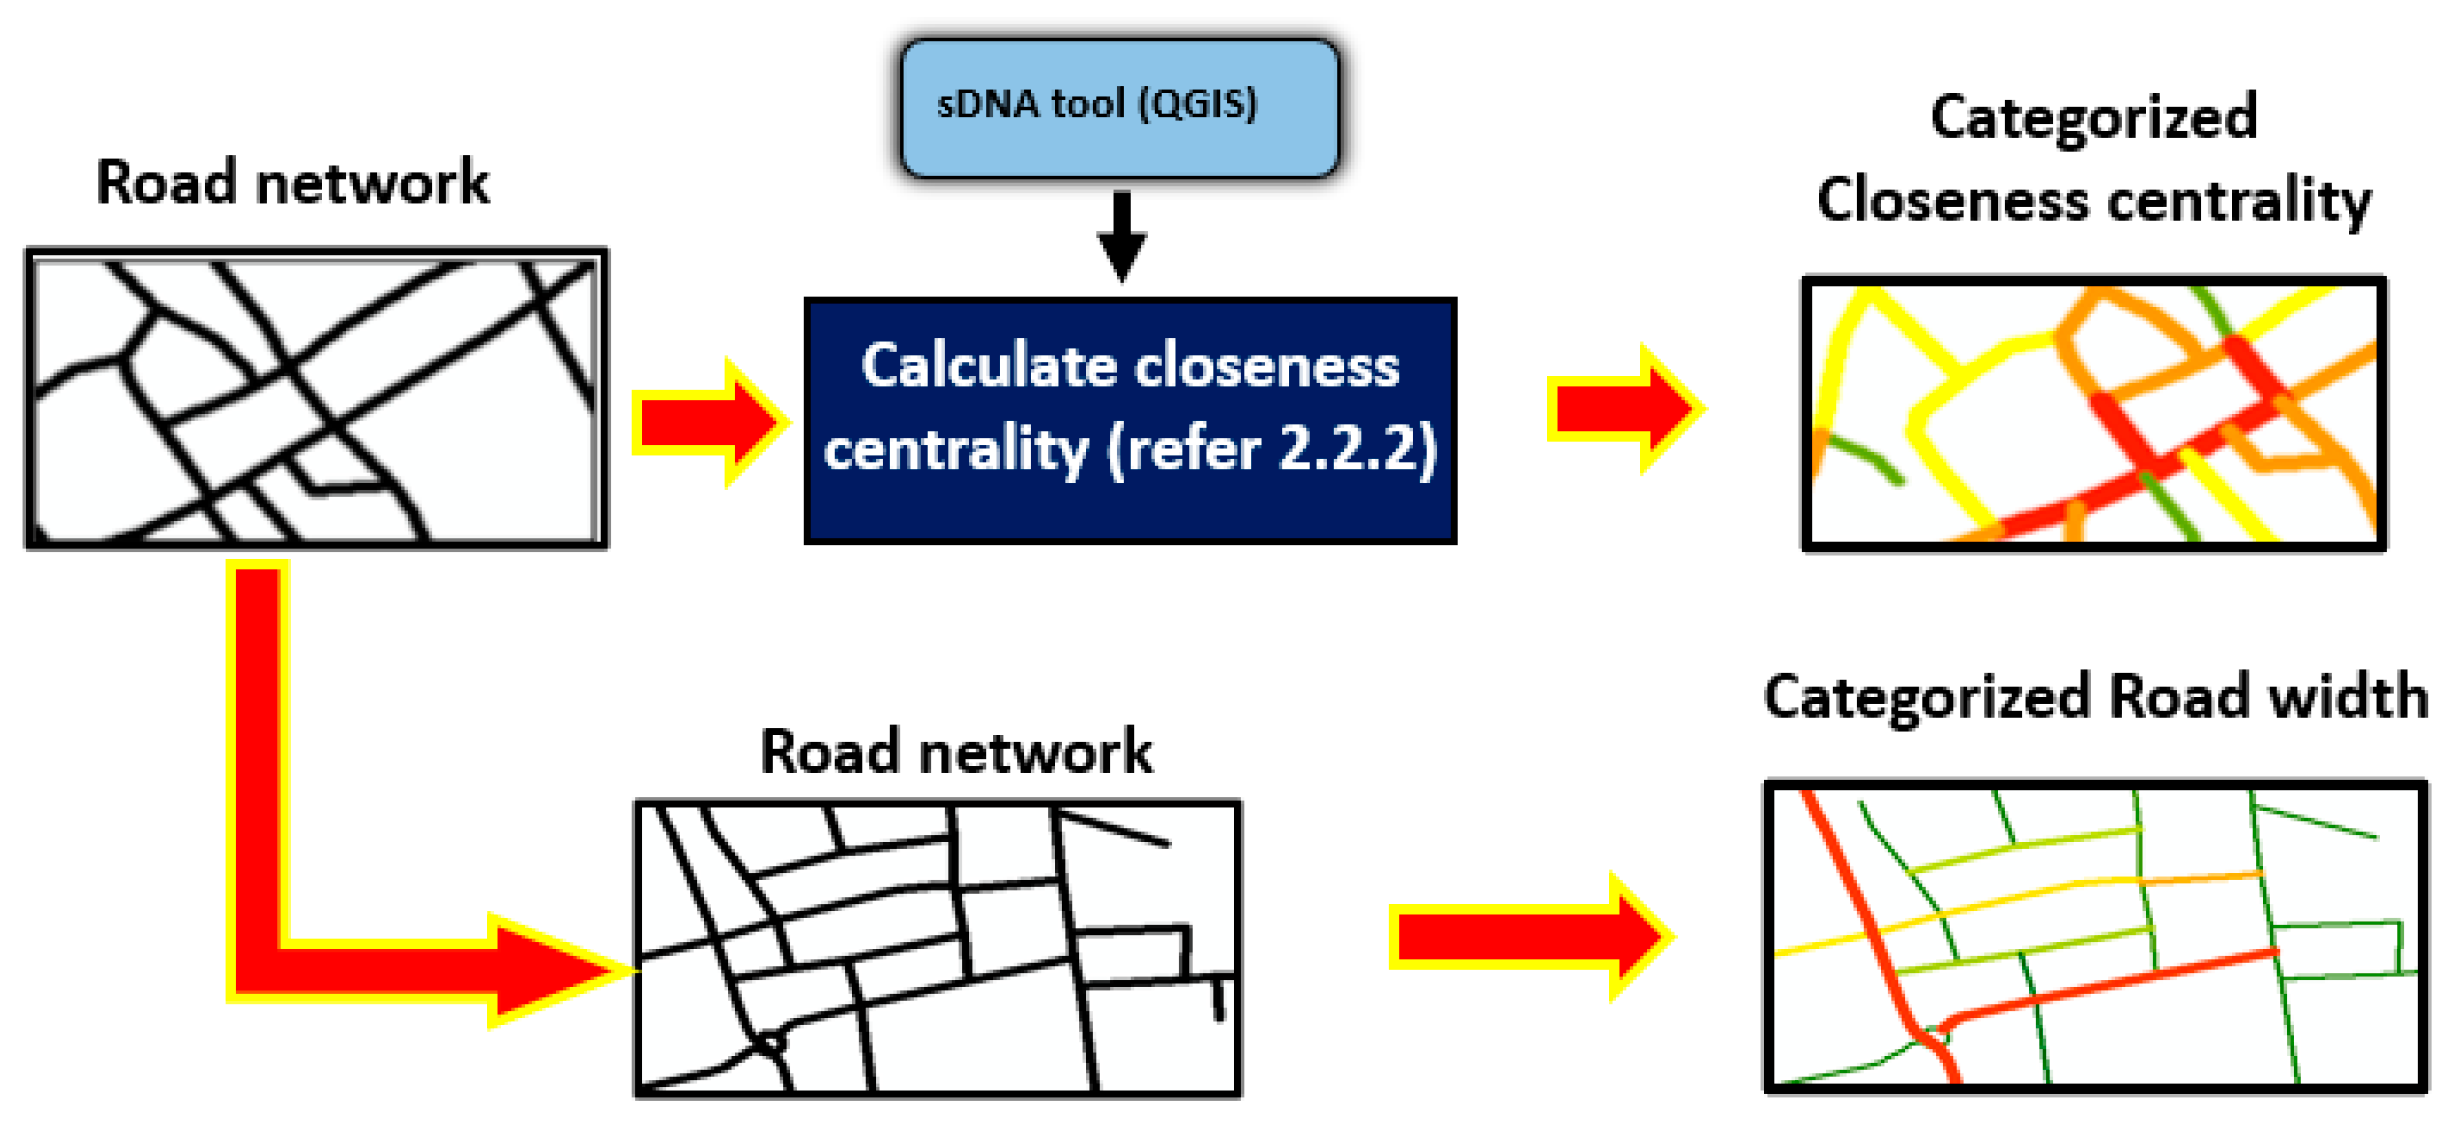
14]. However, in those studies, accessibility measurement was mainly considered the cognitive behavior of human movements, which is computed based on the topological-shortest-path, but the influence of the travel speed and roadway characteristics have not been considered [12,15]. Jayasinghe et al. [12] and Paul’s [
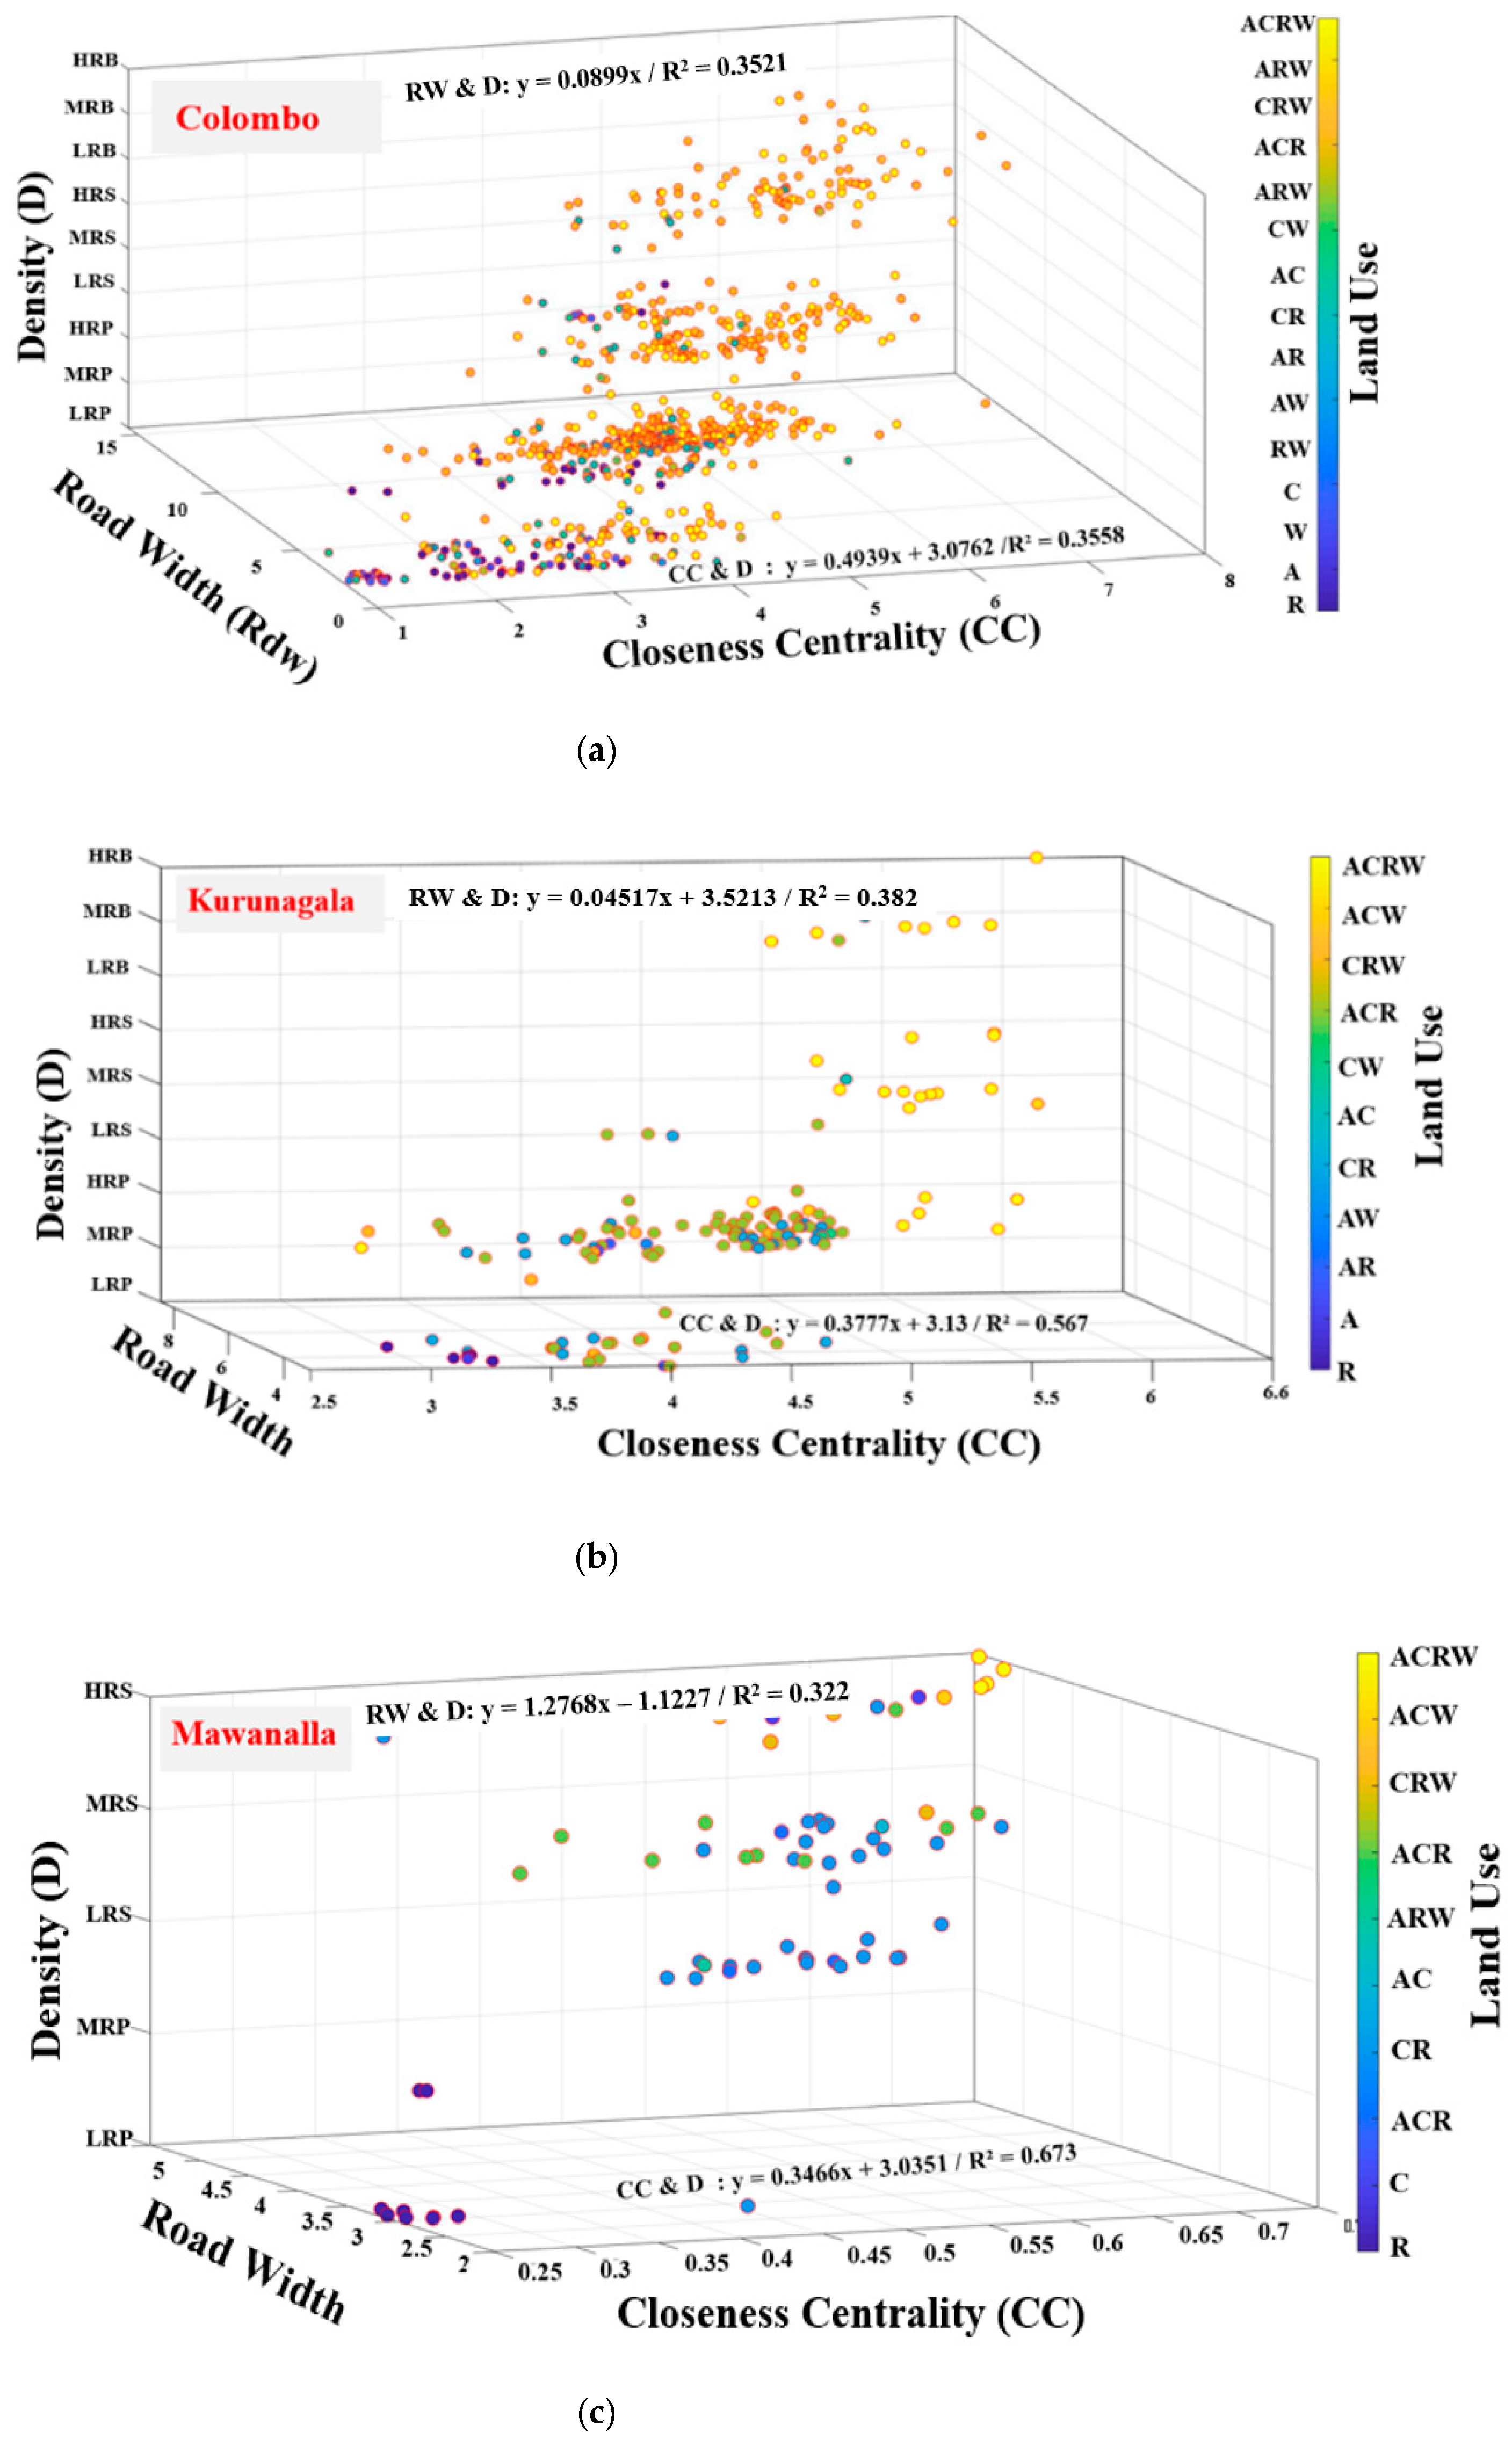
15] works have emphasized the importance of the impedance factor for account the travel speed and roadway characteristics. Furthermore, space syntax-based studies have mostly considered the two-dimensional connection among density and accessibility or land use and accessibility respectively [6,16,
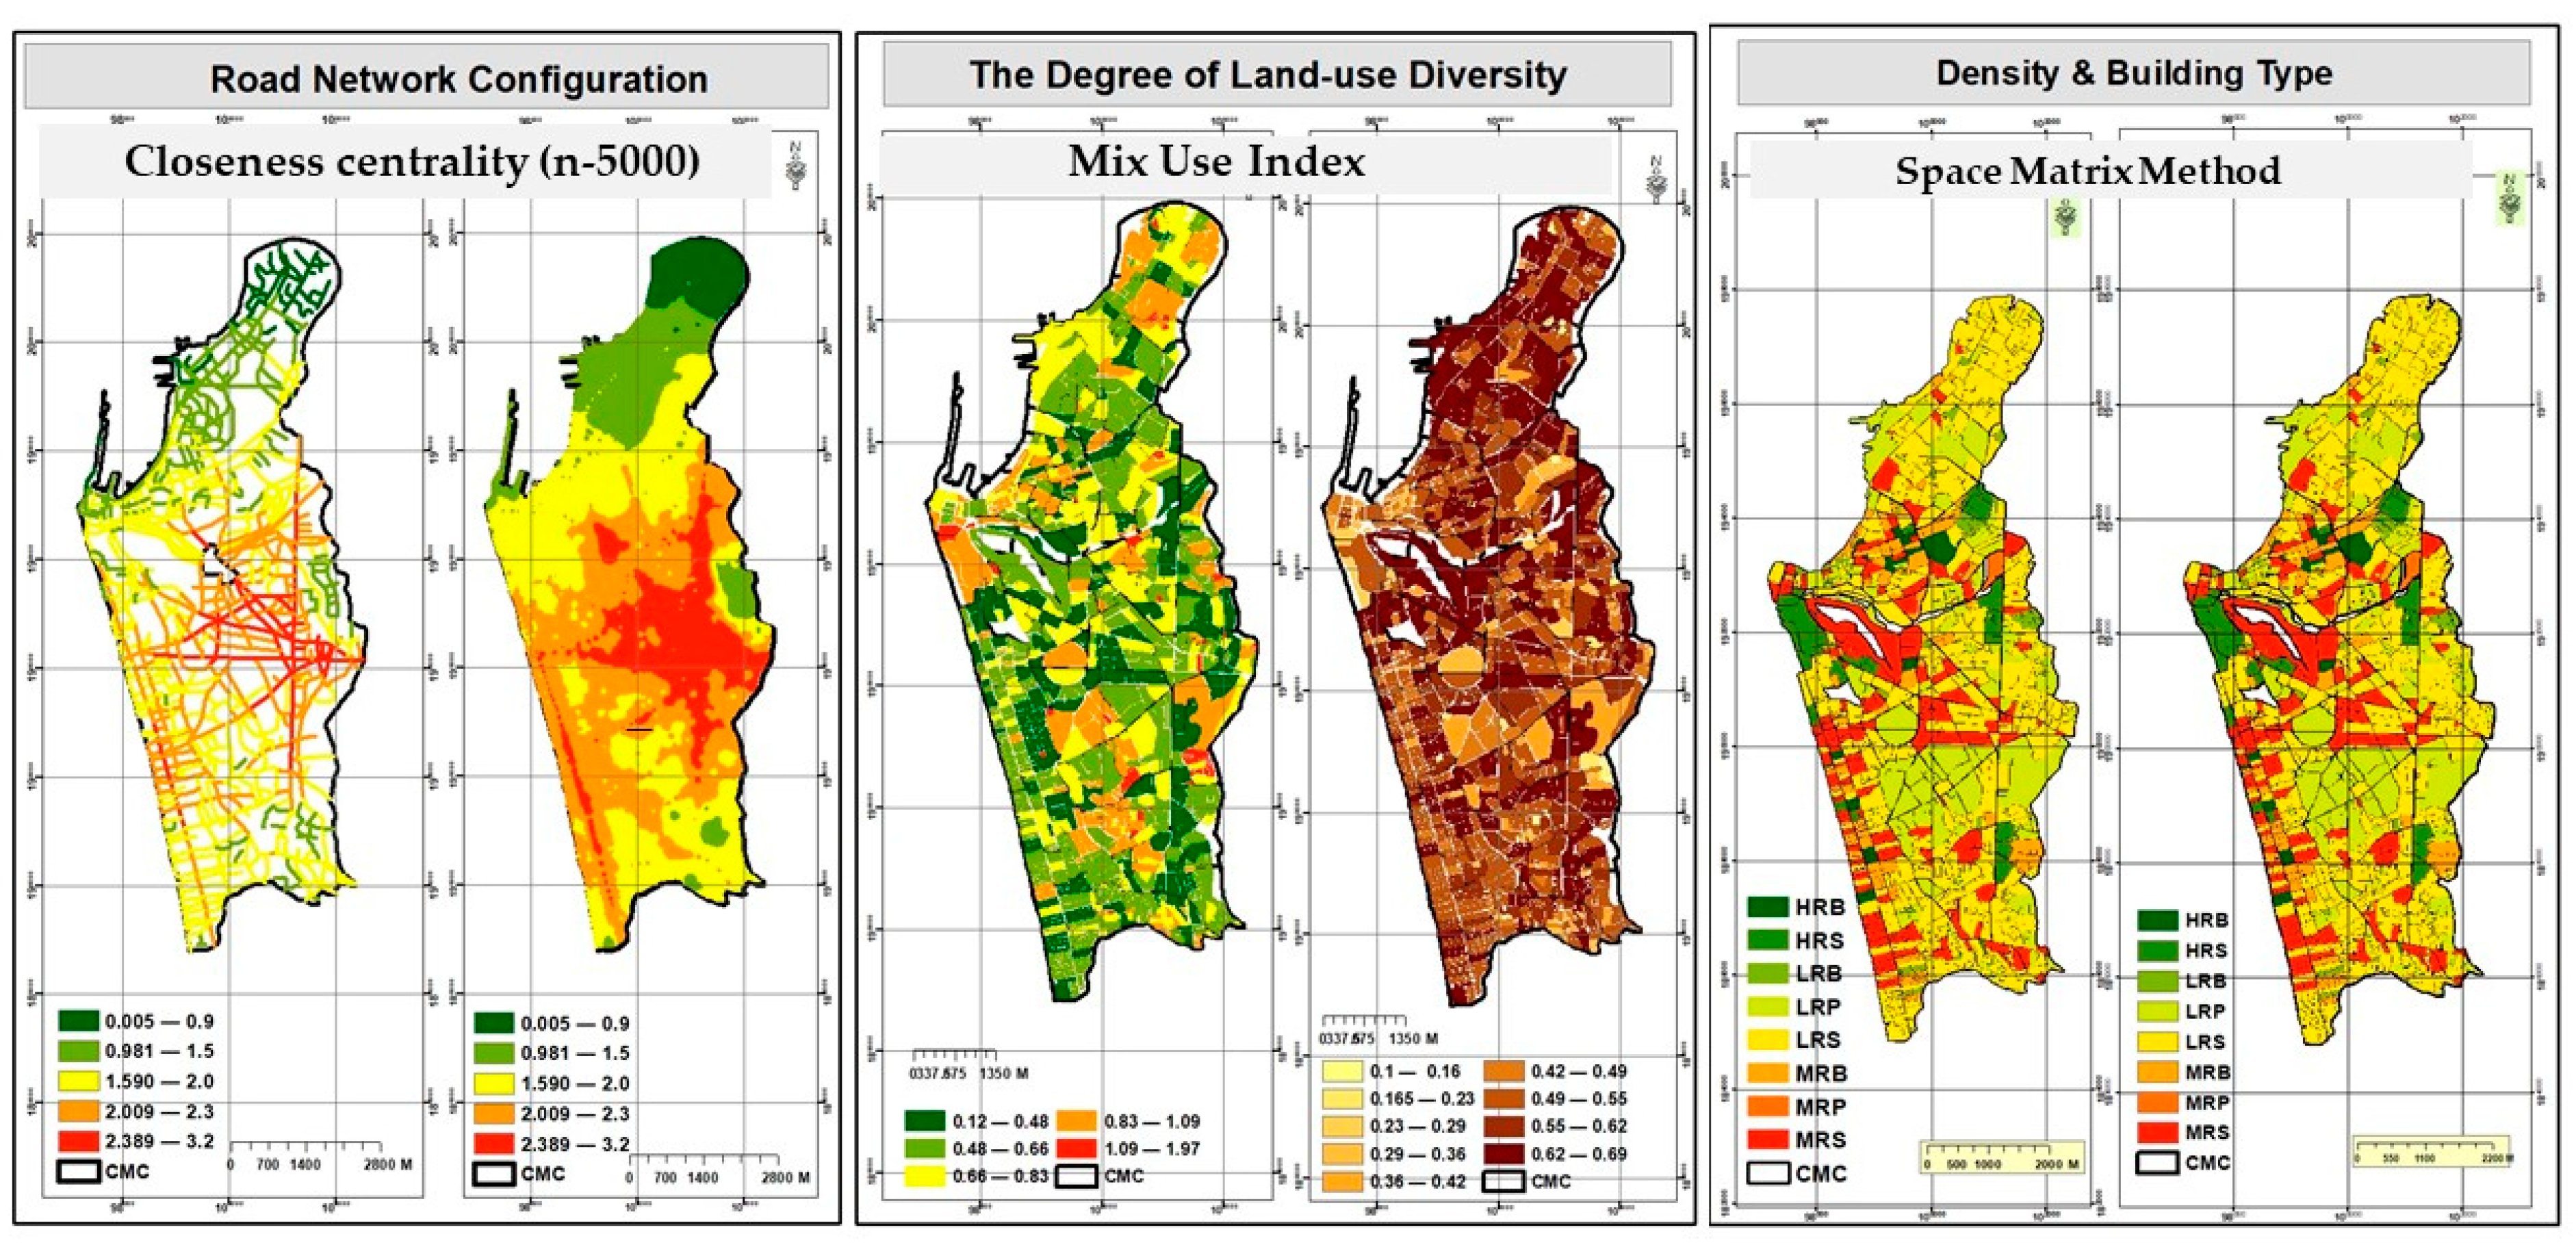
17]. Recently, researchers have introduced new analysis tools such as “space matrix” and “mixed-use index,” to analyze the relationship between land use and density [
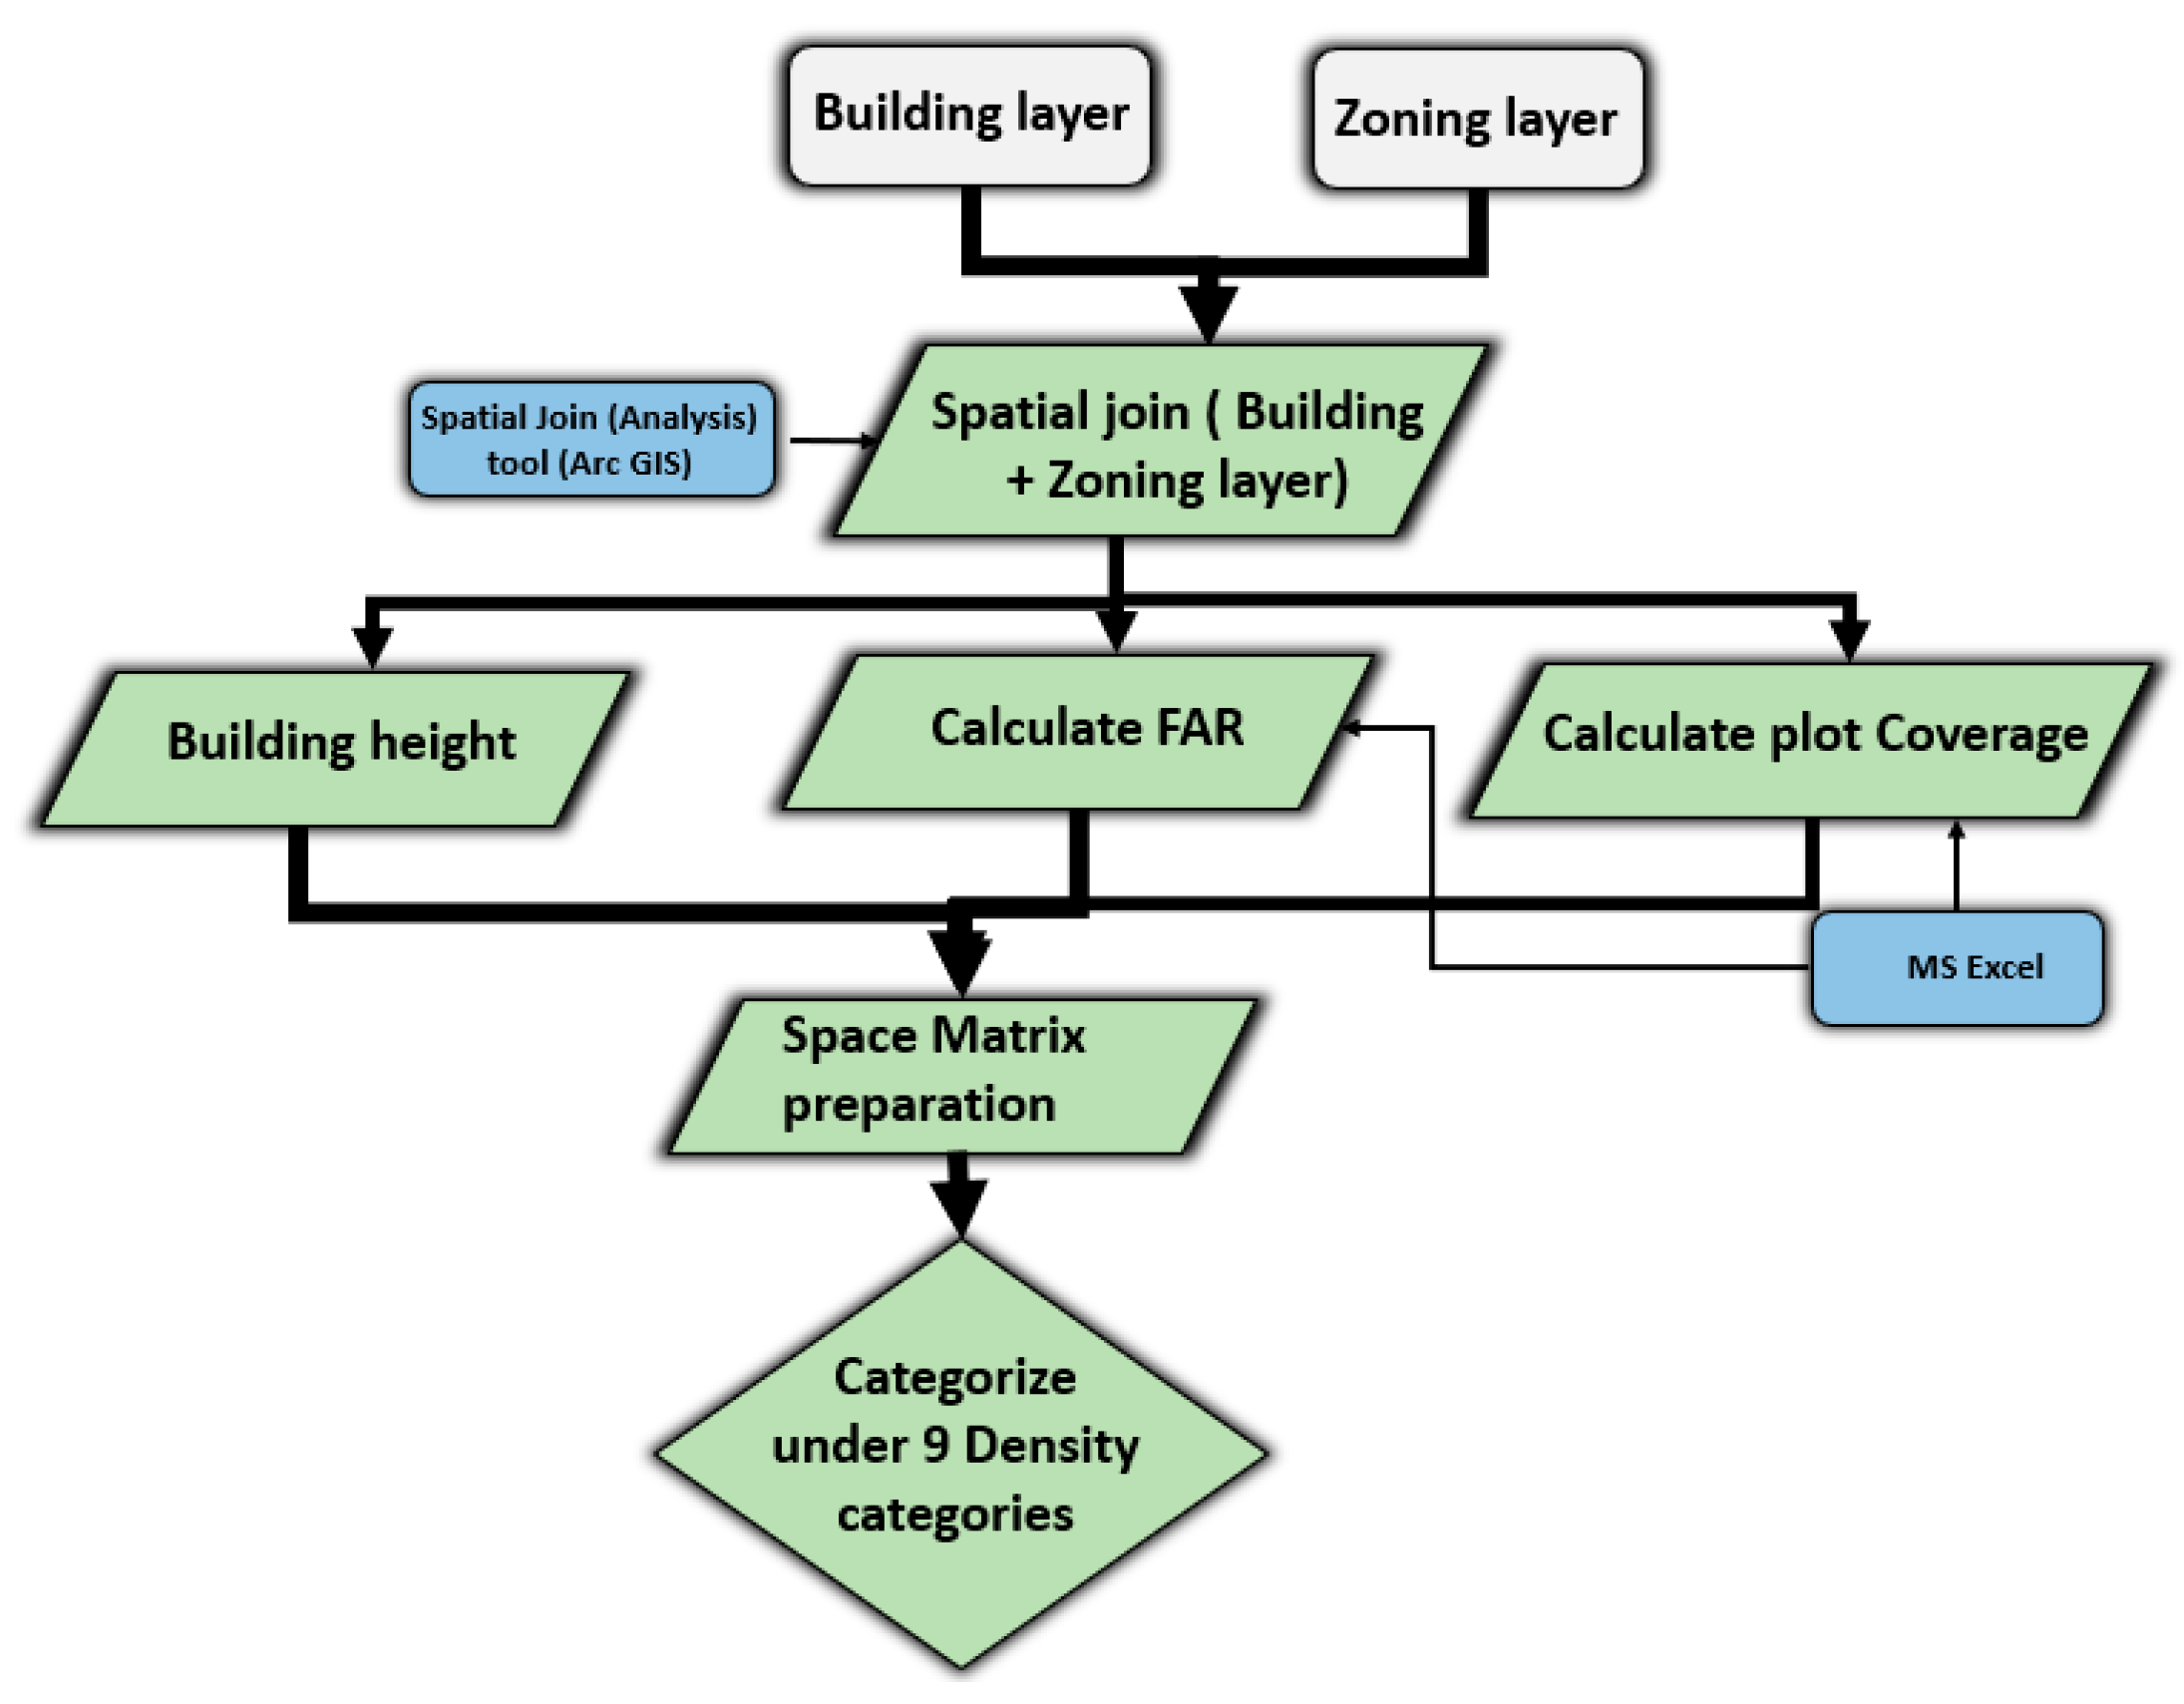
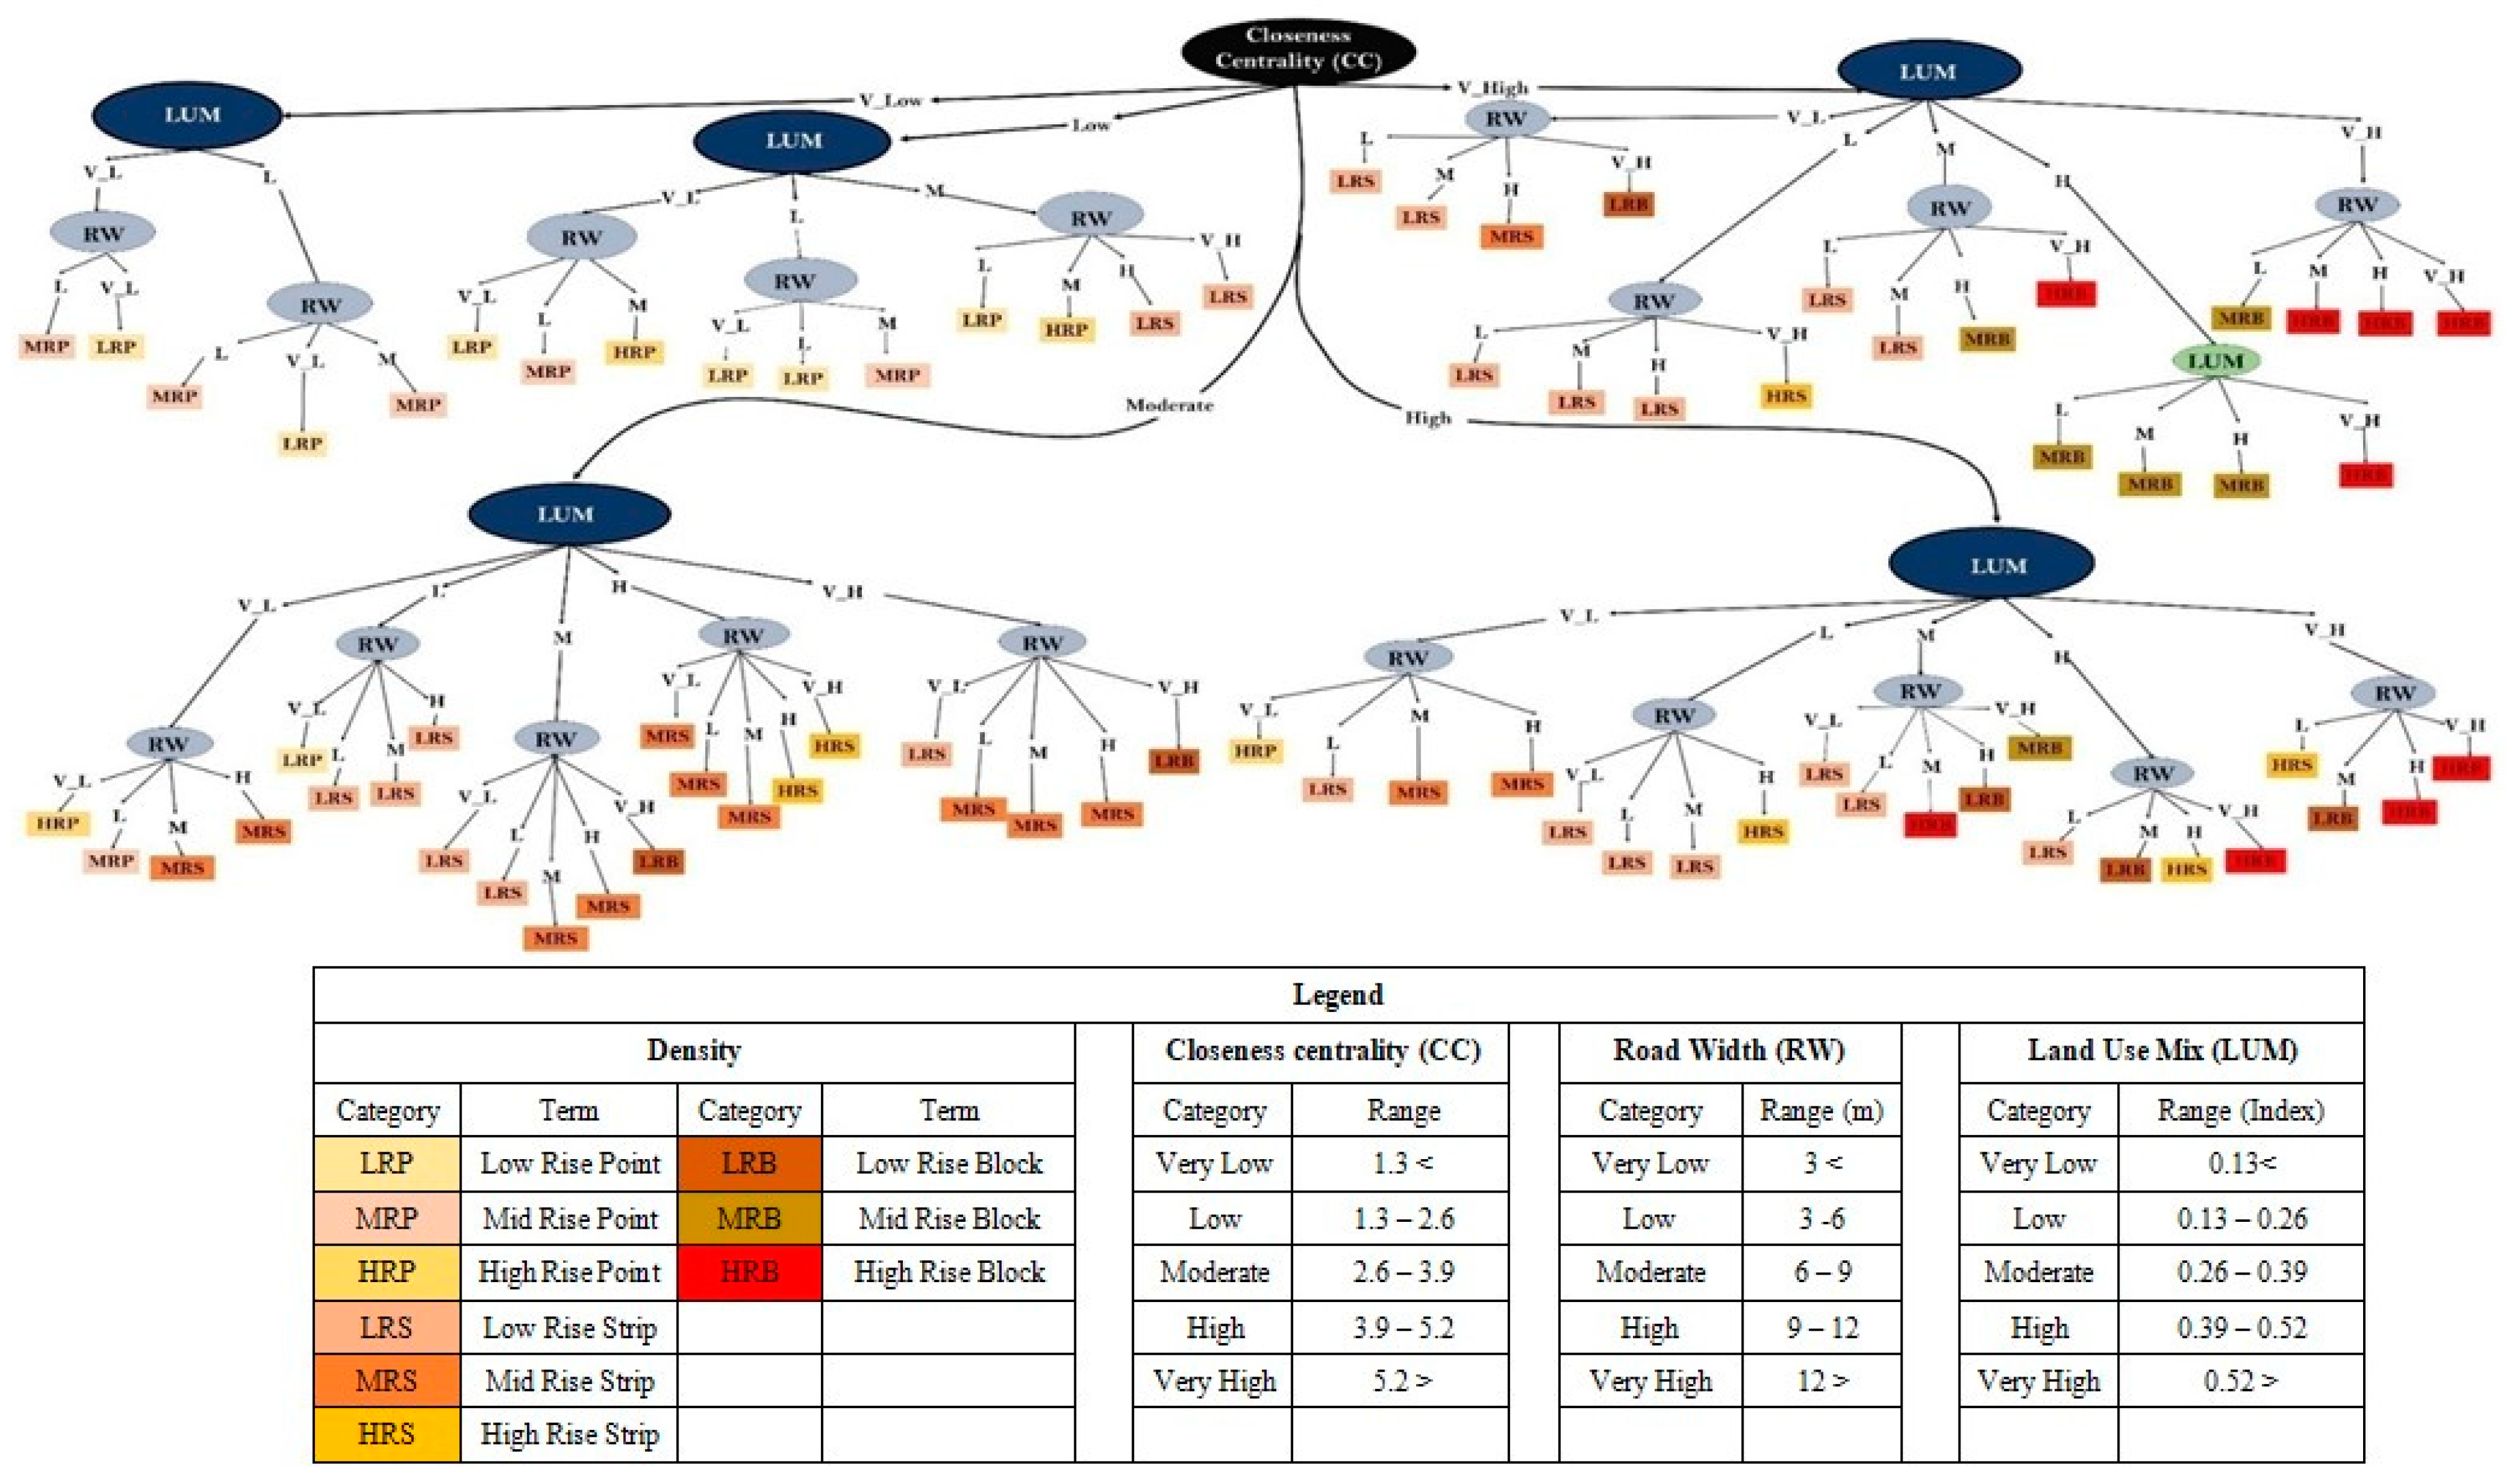
18]. Those studies have utilized the space syntax to compute the configuration (accessibility) of the street network; space matrix method to compute the degrees of building density; and mixed-use index to compute the degree of land use diversity [8,19]. However, those studies have made limited attempts to model the three-dimensional relationship among density, land use, and accessibility (i.e., density ⟷ land use, density ⟷ accessibility, and accessibility ⟷ land use).
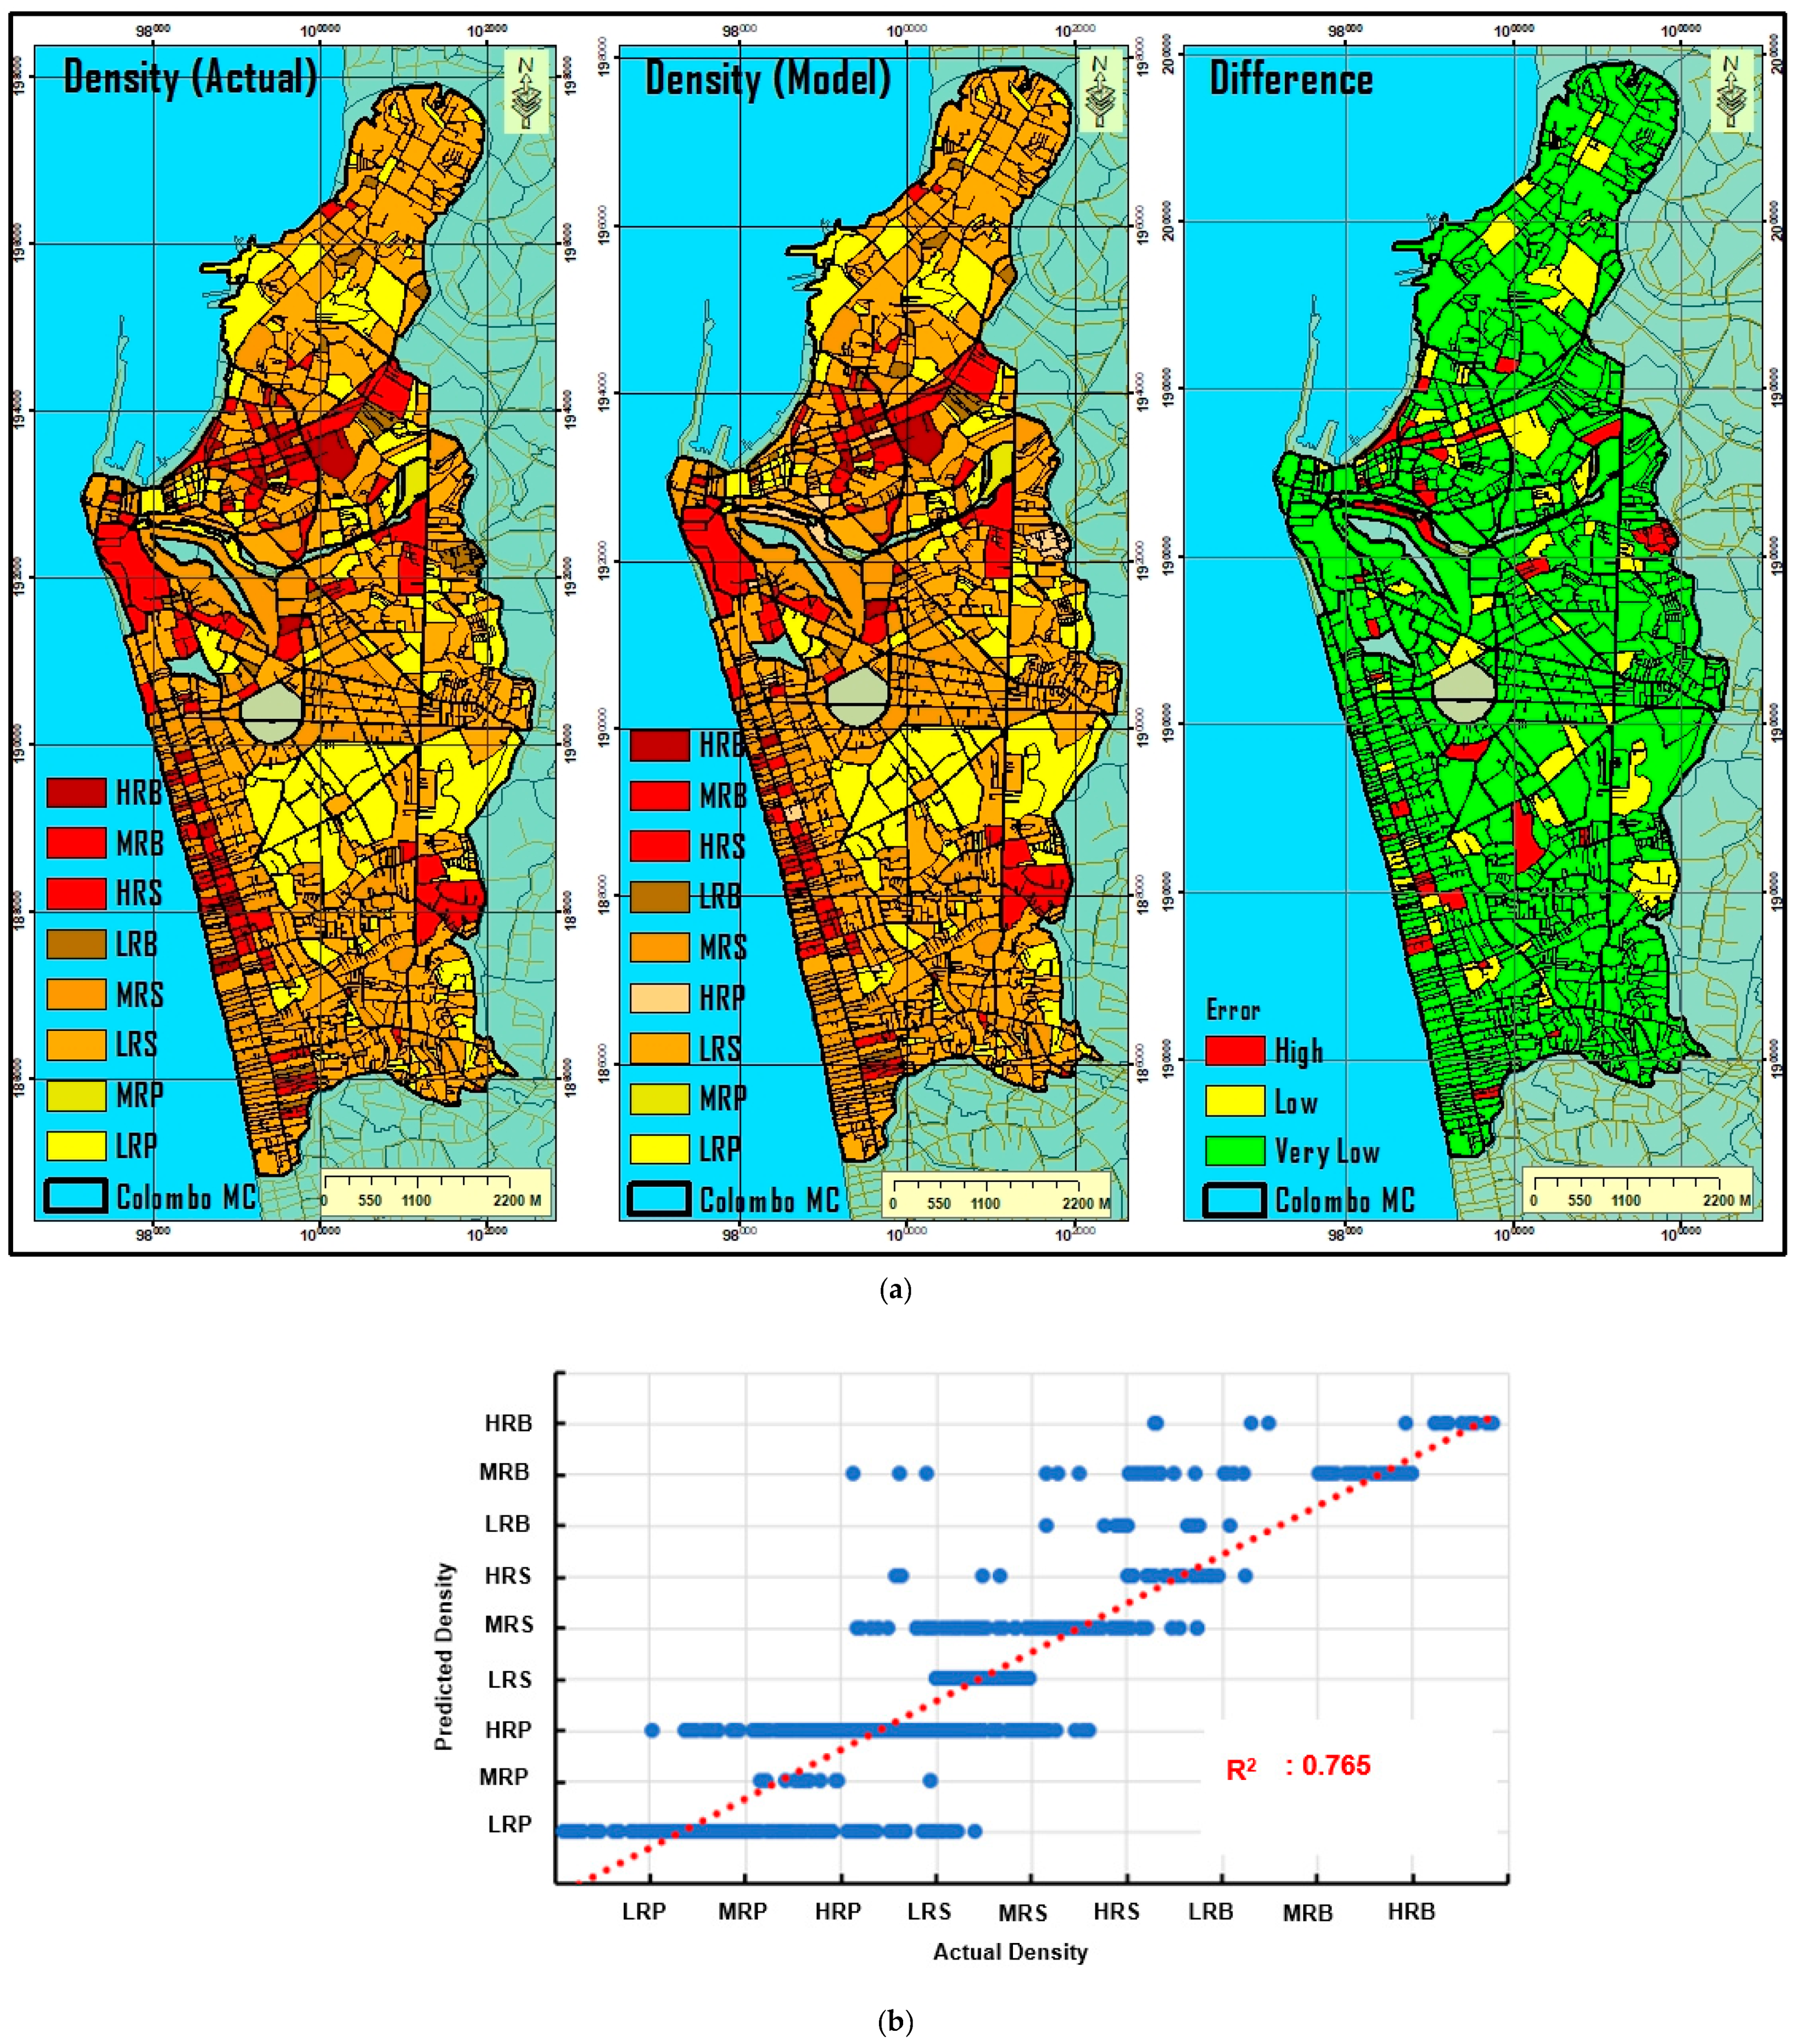
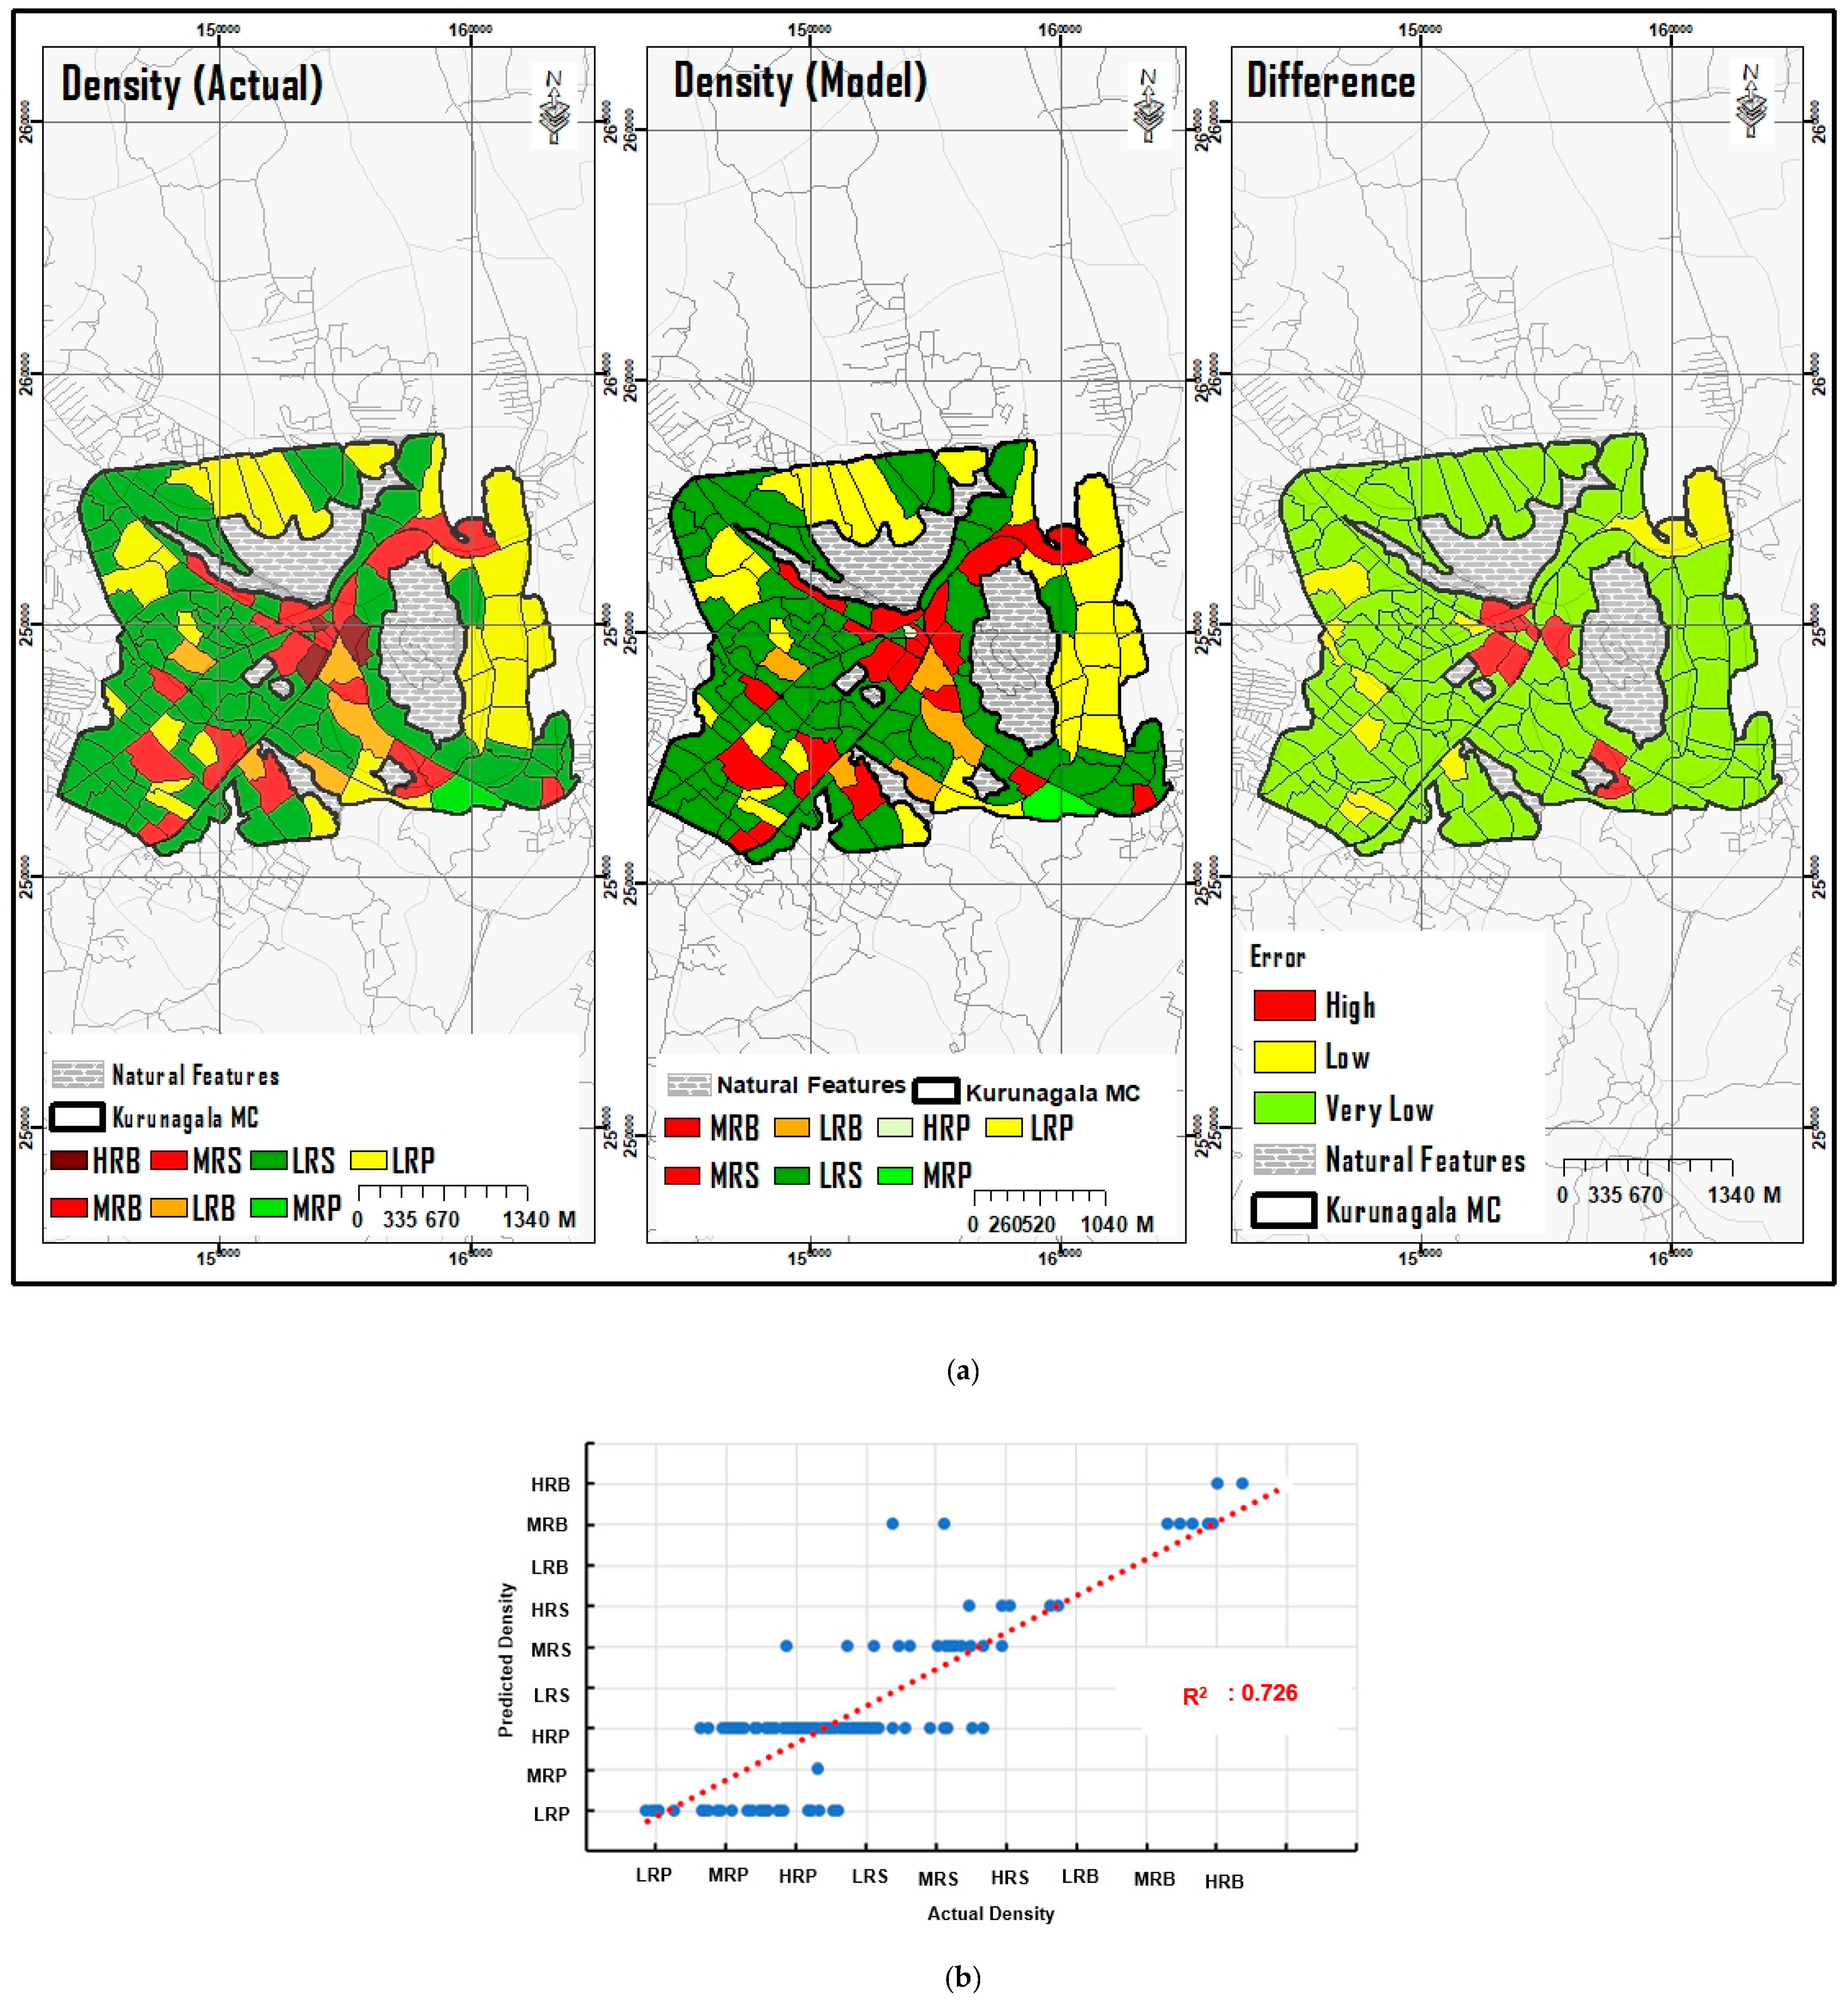
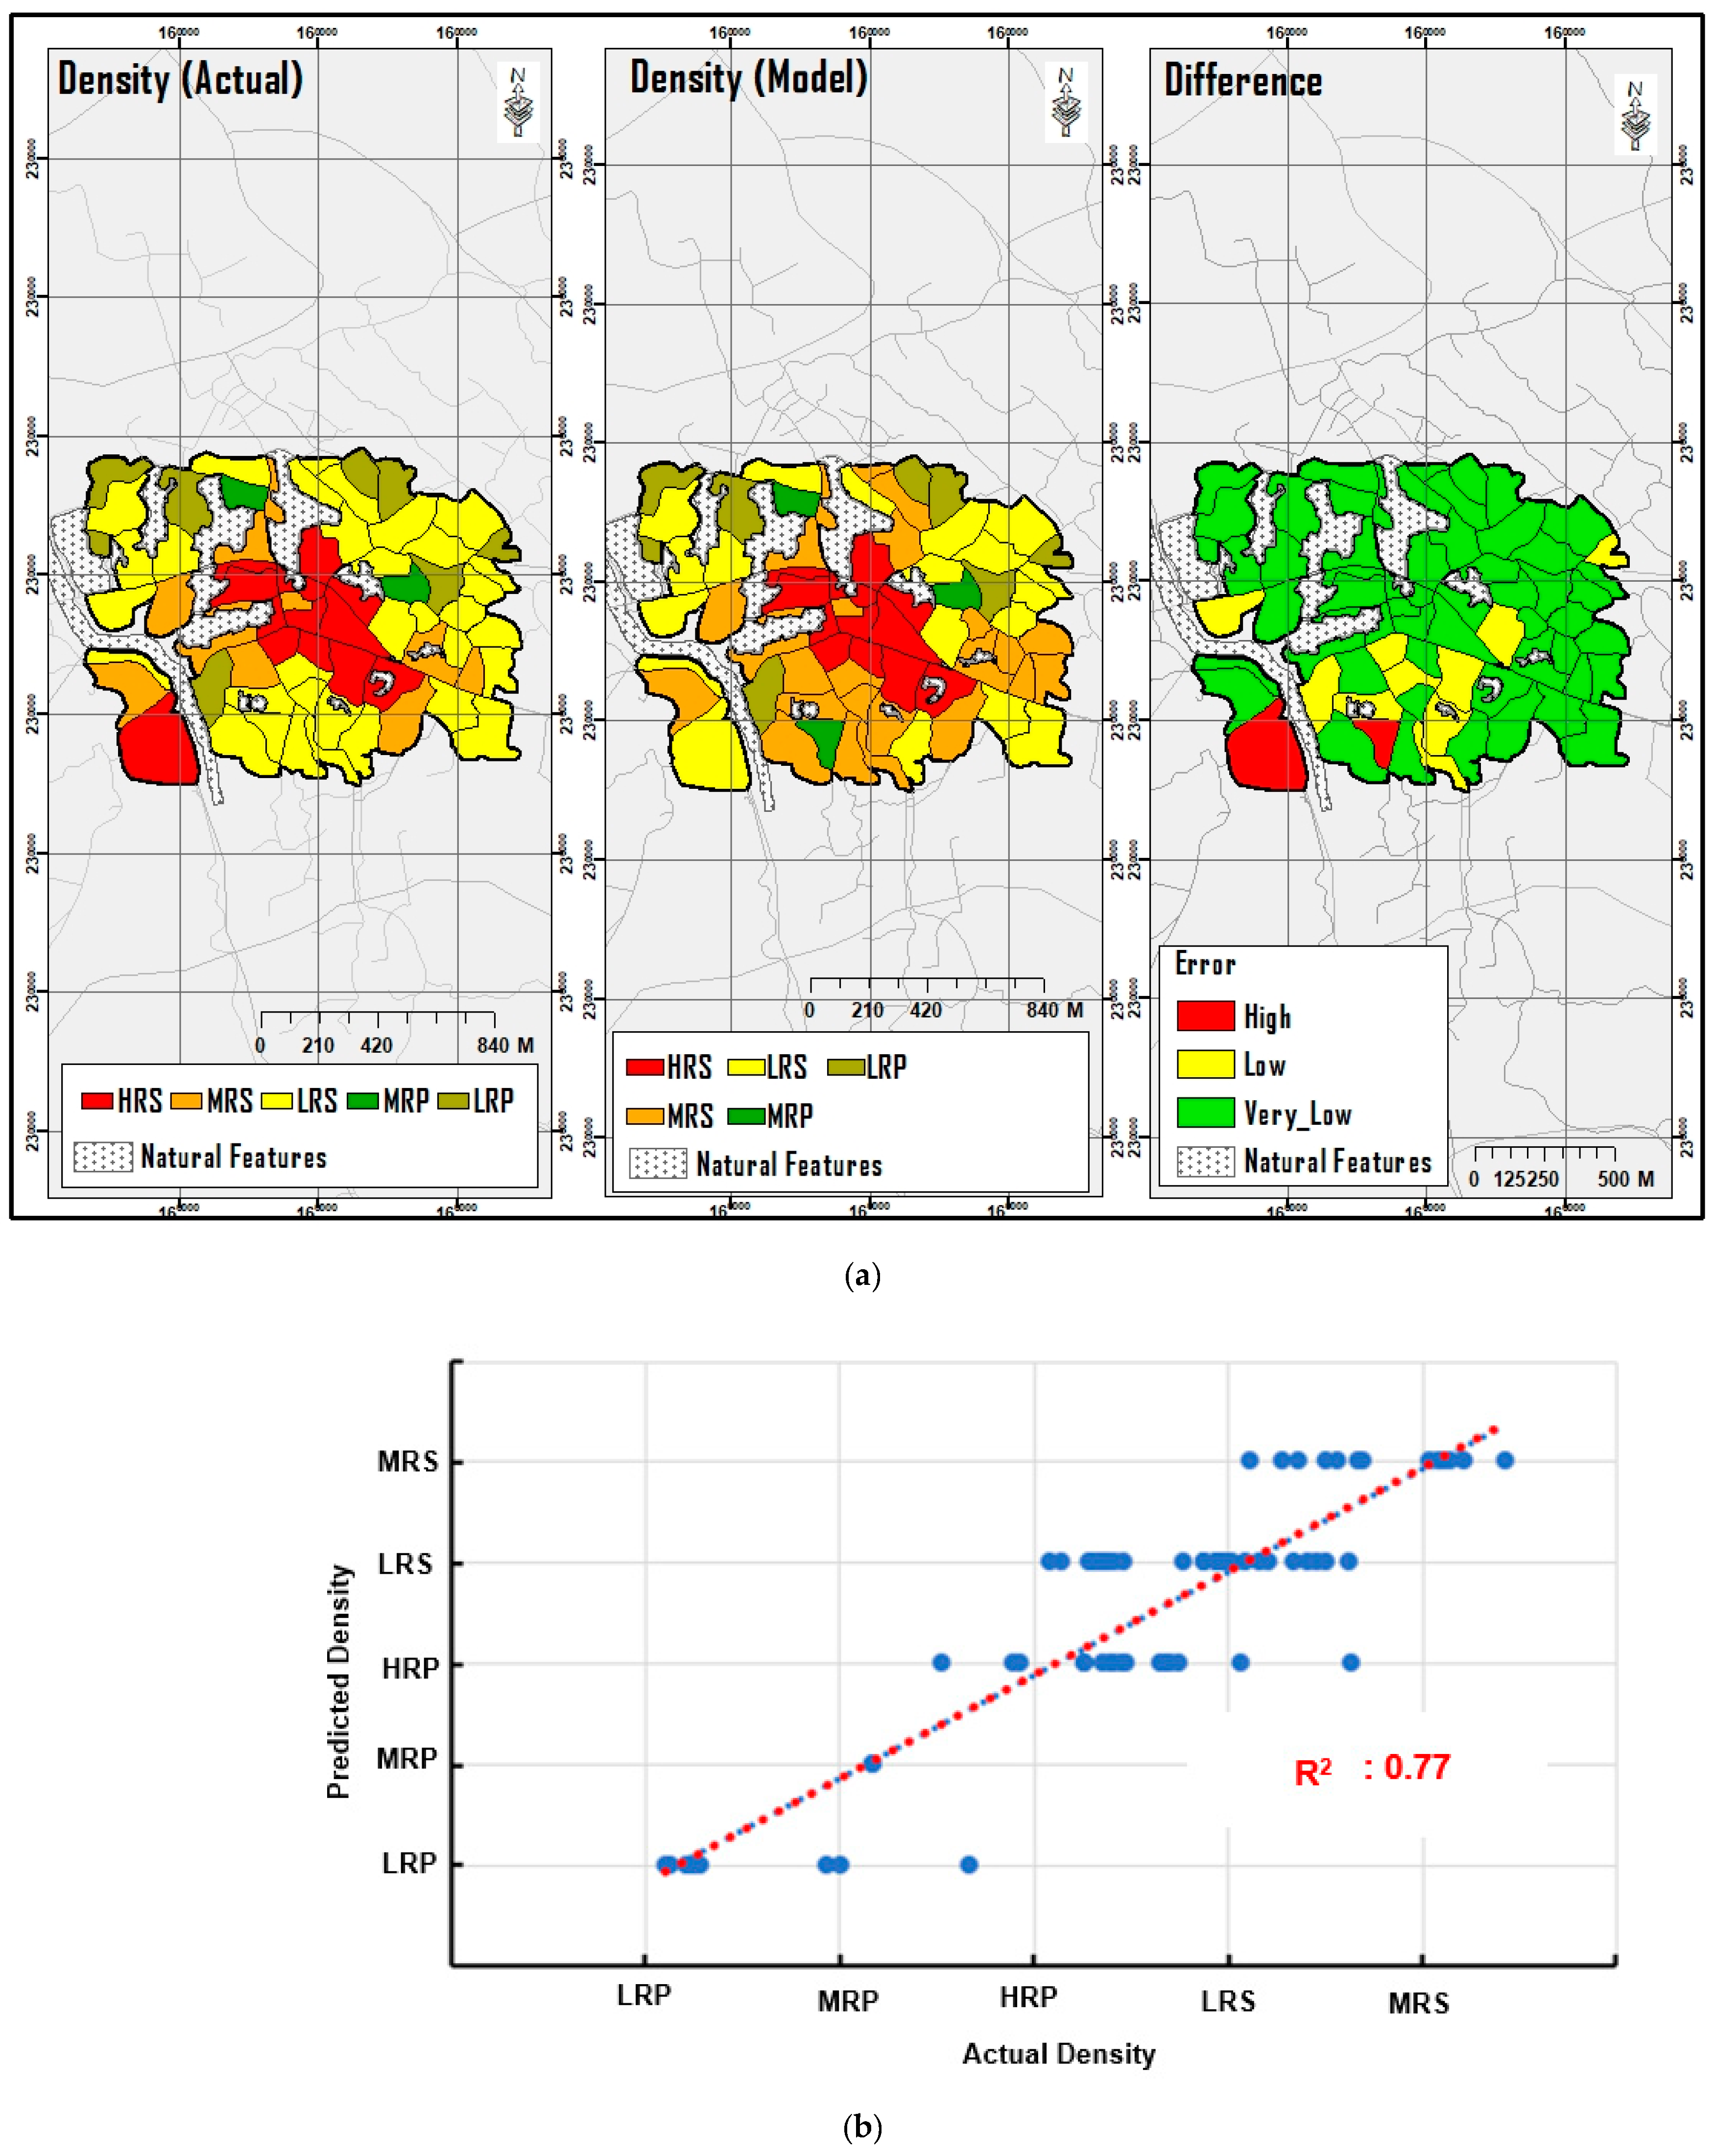
In such a context, this paper attempts to make a significant contribution to overcome the limitations noted in the emerging researches in the domains related to urban planning and transport engineering, through a novel modeling framework to capture and analyze the three-dimensional relationship among density, land use, and accessibility in urban areas, taking into account both topological and roadway characteristics.
The proposed framework is introduced in the next section. The materials and method are presented in the third section. Analysis and results are presented in the fourth section. This includes a relationship analysis among accessibility, land use, and densities in case study areas and model formulation. The conclusion and recommendations are presented in the last section.

2. Proposed Framework

2.1. Conceptual Framework

The objective of the research is to build a framework to model the three-dimensional relationship among density, land use, and accessibility in urban areas. The framework developed is based on the movement economics theory. The movement economics theory proposes that urban places “first generate the distribution pattern of movement flows, then it influences land-use selections, and these generate effects on movement with further feed-back on land-use selections and street-network as it leads to more rigorous urban expansion” [20]. Therefore, the theory cited the reciprocal effects of spatial structure (i.e., road network) (S), and movements of people (i.e., level of accessibility) (A), and the multiplier impacts on both (refer Figure 1 and Equation (1)). Additionally, it has indicated that there is a multiplicity of interconnections among urban structure (S), density (D), and land use (LU) (refer Equation (2)).
S ~ A
S ~ L U ,   S ~ D ,   L U ~ S .
As per the movement economics theory, land use (LU) and density (D) is occured as a function of movements (i.e., accessibility potential) (A) as indicated in Equations (3) and (4) [19]. Further, a series of empirical research studies have discovered that there is a strong relationship between the accessibility and the two variables i.e., land use [6,12,20,21] and density [8,9,10] respectively. Those studies further support the relationship indicated in Equations (3) and (4).
D = f ( A )
L U = f ( A ) .
Nes et al. [13] have explained that the density can be occurred as a function of accessibility. However, the density can be changed with the respective land use. Accordingly, this research hypothesizes that there is a three-dimensional relationship among density, accessibility, and land use in urban areas as depicted in Figure 2.
Therefore, the study suggests that street accessibility, land-use diversity, and building density are not independent variables, and density of a given area can be changed as a function of the changes in accessibility and land use (refer Equation (5)). Accordingly, the study focuses on validating this relationship by using a real ground data set in selected case study areas.
D = f ( A ) ( L U ) .

2.2. Quantifying Variable: Density, Accessibility, and Land Use

The study utilized the land-use mix index, which was introduced by Frank et al. [22], to quantify the land use variable (refer Equation (6)). Land use mix computes the degree of land-use diversity within a particular area.
MUI = ( 1 )   P j ln ( P j ) ln ( j )
Pj represents the ratio of the total sum of land area of the jth land-use type found in the analysis zone being analyzed and j is the number of land use types found in the zone.
Accessibility can be computed, based on the mobility and topological characters. The study utilized the closeness-centrality (CC) parameter to compute the accessibility in terms of topological characteristics. CC computes the accessibility by measuring how close a road-segment is to all other road-segments along the shortest-path [23]. Recent studies on space syntax have found a direct link between the accessibility (CC) and the land use [20,21,23]. The study utilized the formula introduced by Freeman [24] to measure CC of the road network.
C C i = j N ,   J i 1 d i j
CCi represents CC values of the ith road-segment. dij is the distance between “i” and “j” road-segments along the shortest-path. N is the sum of road-segments in a given road network. Additionally, the study utilized the road width to capture the mobility characteristics of accessibility [25].
Density of the urban form can be captured based on the plot coverage (GSI), floor area ratio (FAR) and building height (L). Both vertical and horizontal density is represented by these three dimensions. Nes et al. [13] have utilized the following equations (refer Equations (8) and (9)) to measure GSI and FAR of the urban form.
G S I = j = 1 n B i A
Bi represents the gross floor area (m2) of the ith building and A is the area of the urban block under computation.
F S I = j = 1 n B i     F i A
Bi represents the gross floor area (m2) of the building i, Fi represents the number of floors of the ith building, and A represents the area of the zone under computation. Space matrix is a method to measure and present comprehensive ideas of the urban form density [26]. Space matrix utilizes 9 density categories based on the GSI, FAR, and L (refer Figure 3). The physical nature of these 9 categories is presented by google images on the right side of the Figure 3.

3. Materials and Methods

3.1. Case Study Areas

The proposed formwork was tested in three urban areas in Sri Lanka, namely, Colombo, Kurunegala, and Mawanella. These case studies areas manifest a distinctive urban form, which enables the investigation of the applicability of the proposed method in different areas. Table 1 provides a brief explanation of these areas.

3.2. Data and Preparation

Table 2 provides a brief explanation of the data types and methods of data collection. The study utilized analysis zones—Colombo, Kurunegala, and Mawanella, which have 750, 147, and 68 zones respectively, to capture land use and density data.
The preparation of analysis zones was the first step of the data preparation process of the study. Lu et al. [7] have utilized natural road blocks to develop analysis zones. The same method has been followed in this study, where polyline road network of major roads (A and B classes) was utilized for this purpose. The key steps are indicated in Figure 4. The first step of the figure depicts the condition of the main road network. Natural zones in the study area were demarcated based on the road segments. As the second step, the polyline road segments were converted to polygons by utilizing the tool (feature to polygon) in the geographic information system (GIS) environment. Output of the tool provides natural road block polygons (zones) layer created by joining the corresponding segments of the natural road blocks. Density, land use, and accessibility data preparation was based on the demarcated zones.
In the land-use data preparation, a polygon-based land-use data set was utilized to compute the mixed-use index for the respective zones. Hence, the study joined the land-use layer with the zone-layer, which was developed in the above-mentioned step (refer Figure 4). Then, the study computed the mixed-use index for each zone, based on the index introduced by Frank et al. [22] (refer Equation (6)). Figure 5 indicates the process of preparing the land use mix.
The land use is comprised of 15 land-use classes, which have been coded as follows, Land-use Categories—A: Amenities, C: Commercial, R: Residential, W: working, RW: Residential + Working, AW: Amenities +Working, AR: Amenities + Residential, CR: Commercial + Residential, AC: Amenities + Commercial, CW: Commercial + Working, ARW: Amenities + Residential + Working, ACR: Amenities + Commercial + Residential, CRW: Commercial + Residential + Working, ACW: Amenities + Commercial + Working, ACRW: Amenities + Commercial + Residential + Working.
This study followed the space matrix method (refer Figure 3) to prepare the density data set. First, spatially joined the zone-layer and building layer. Then, computed the plot coverage and floor area ratio of the respective zones, utilizing the Equations (8) and (9), respectively. Next, categorized the zones as per the 9 density categories (refer Table 3) introduced in space matrix. Those categories have been coded as follows. Figure 6 indicates the process of preparing the density data set.
Both mobility and topological characters were computed during the accessibility data preparation. The study computed the CC of each road-segment, utilizing the sDNA tool [12] in QGIS environment. The study utilized “road centerlines”, i.e., the center of the right-of-way on the given road segment, for preparing the road-segments graph. In the road-segments graph, segments represent the locations of trip productions. Then, the study joined the CC road segments with analyzed zones and the prepared data set including the average CC of each zone. Road width represents mobility character of accessibility. The study computed and prepared a data set, which included the average road width of each zone. Figure 7 depicts the process of preparing the accessibility data set.

4. Results and Discussion

The study first analyzed the three-dimensional relationship among density, accessibility, and land use in case studies, utilizing the 4D plot diagram in “MATLAB” environment, and decision tree analysis in “Waikato Environment for Knowledge Analysis” (WEKA) environment. Then, the study developed a set of regression models to capture the density. Figure 8 indicates the process of analysis. For the purpose of analysis, the study stored the land-use values, density values, closeness centrality values, and road width in the GIS database (refer Figure 9). Then, the study extracted the spatial data from the GIS database and prepared a 4D diagram and decision tree.

4.1. Relationship among Accessibility, Land Use, and Density

4.1.1. Result of the 4D Plot Diagram Analysis

The study utilized the 4D plot graphs to represent the 4-dimensional relationship among density, land use, closeness centrality, and road width. Following figures display the 4D plot graphs of the three case study areas (Figure 10a–c). The results clearly depict the relationship between density and accessibility. As an example, in the Colombo case study (refer Figure 10a), high-density areas (i.e., block type density categories such as HRB, MRB, and LRB) recorded a high level of accessibility in terms of closeness centrality values (i.e., CC > 6) and road width (i.e., width > 10 m). Further, low-density zones (i.e., LRP, MRP, and HRP) recorded a low closeness centrality (i.e., CC < 3) and narrow road width (i.e., width < 5 m). The result indicates that high accessibility in terms of topological and roadway characteristics has a strong relationship with high-density zones. Furthermore, high-density zones (i.e., block type density categories such as HRB, MRB and LRB) predominately recorded in highly mixed land-use environments (i.e., ACRW, ARW, CRW, ACR, and ARW), while low-density zones (i.e., LRP, MRP, and HRP) predominately recorded in less mixed land-use zones (i.e., R, C, A, and W) and a low level of accessibility. Similar patterns can be observed in both Kurunegala and Mawanella case study areas. Therefore, these results confirm the argument made by the study—that is density, land use, and accessibility variables have a three-dimensional relationship. Furthermore, the results indicate that density of a given area is dependent on land use and accessibility as indicated in Equation (5) (i.e., (D = f(A) * (LU)).

4.1.2. Result of the Decision Tree Analysis

The study utilized the decision tree analysis to read patterns of a given data set. The output of the analysis generates a tree type flow diagram to explain the patterns of the data set and Figure 11 depicts the summary of the decision tree analysis results in the three urban areas. The results of the decision tree produce a logical explanation as to how density categories are materialized under different land use and accessibility levels in the selected case study areas. All three case study areas recorded a high level of decision tree model accuracy (i.e., accuracy ~ 80%) (refer Table 4). The results indicate that the decision about the density is first made based on closeness centrality, then followed by land-use mix and road width. Accordingly, it indicates that high-density zones with a high level of accessibility (both in terms of topological and roadway characteristics) have a high land-use mix. These results further confirm the argument put forwarded by the study. First, the influence of accessibility in terms of both topological and roadway characteristics must be considered. Secondly, the density of a given area depends on land use and accessibility as indicated in Equation (5) (i.e., (D = f(A) * (LU)).

4.1.3. Regression Analysis

Step by step multiple regression analysis was employed to measure the density in a given zone, (i.e., D) utilizing the accessibility and land-use mix values (i.e., D = f(A) * (LU). Accessibility (i.e., A) was measured in terms of topological characteristics and roadway characteristics, utilizing the CC values and road width (i.e., RW) values, respectively. Therefore, the model explaining the density in a given zone (i.e., D) takes the following form (refer Equation (14)).
D = f(A) * (LU)
A = f (CC) * (RW)
So, D = f(CC) * (RW) * (LU))
D = a [CCb * RWc * LUd]
nD = a + b*lnCC + c*InRW + d*InLU.
The research utilized Ordinary Least Squares Regression for model formulation purposes.
The study checks the multicollinearity among variables and utilized R2 and mean absolute percent error (MAPE) to assess the goodness-of-fit when choosing the most appropriate model. Table 5 and Table 6 depict the statistics and specifications of the best model to estimate the density (D) for each case study. Models of all three case study areas recorded satisfactory level accuracy (i.e., R2 > 0.70) which is an acceptable level of accuracy. Therefore, the study proposes that the developed models are suitable to model density in a given area based on land use and accessibility.
Colombo case study area recorded an accuracy of 76% (i.e., R2 > 0.76) and out of the 750 zones, more than 78% recorded a very low level of error (low error = 10% difference). Figure 12a depicts the spatial distribution of actual density, modeled density, and error, and Figure 12b depicts the relationship between actual values and modeled values in a line plot.
The proposed model has recorded an accuracy of 72% (i.e., R2 > 0.72) in the Kurunegala case study area, and out of 148 zones, more than 81% recorded a very low level of error (Low error = 10% difference). Figure 13a depicts the spatial distribution of actual density, modeled density, and error, and Figure 13b depicts the relationship between actual values and modeled values in a line plot.
The proposed model achieved around 77% (i.e., R2 > 0.77) accuracy in the Mawanella case study area and out of 148 zones, more than 80% recorded a very low level of error (low error = 10% difference). Figure 14a depicts the spatial distribution of actual density, modeled density, and error, and Figure 14b depicts the relationship between actual values and modeled values in a line plot.
Part and Partial correlation statistics were utilized in verifying the importance of predictors, land-use mix (LU), closeness centrality (CC), and road width (RW). Table 7 depicts the summary results of the part and partial correlation analysis. The results indicated that CC is the most influential factor. However, land-use mix (LU) and road width (RW) also have considerable influence on density (D).

5. Conclusions and Recommendation

The study proposed a framework to model the three-dimensional relationship among density, land use, and accessibility in urban areas constructively contributing to overcome the limitations noted in the domains of urban planning and transport planning. First, most of the existing studies have focused on the topological characteristics in capturing the accessibility, but a limited attention has been given on measuring the accessibility by considering both topological and roadway characteristics. Second, the existing research studies have acknowledged the relationship among density, land use, and accessibility while a limited attention has been given to develop a modeling framework to capture the three-dimensional relationship. The study utilized spatial analysis tools such as network centrality, space matrix, and mixed-use index to measure accessibility, density, and land use respectively. The proposed method was tested in three case study areas in Sri Lanka, namely, Colombo, Kurunegala, and Mawanella. These case study areas manifest a unique urban form and road structure, which enable the investigation of the applicability of the proposed method in different geographical areas. The study first analyzed the three-dimensional relationship among accessibility, land use, and densities in case study areas utilizing the 4D plot diagram in MATLAB environment and decision tree analysis in Waikato Environment for Knowledge analysis environment. Then, the study developed a set of regression models to capture the density.
Results revealed from this study can be summarized into four points as follows: The first finding indicated that high accessibility zones in terms of topological and roadway characteristics have recorded a high density whereas low accessibility zones have recorded a low density. Further, high-density zones were predominately located in highly mixed land-use environments. Second, the decision about the density was first made based on the closeness centrality, followed by the land-use mix and the road width. Accordingly, it indicated that high-density zones have high level of accessibility and high land-use mix. Third, the results indicated that the closeness centrality (i.e., topological accessibility) is the most influential factor of density. Nevertheless, land-use mix and road width also have a considerable influence on the density. Fourth, the proposed model, which simulates the density in a given zone based on the accessibility and the land-use mix, recorded a satisfactory level of accuracy (i.e., R2 > 0.70) on a par with internationally accepted standards.
As discussed repeatedly in this paper, the quantification of the relationship among accessibility, land use, and density provide a significant benefit to planners in the preparation of urban plans and zoning regulations. Accordingly, planners can model the suitable accessibility level to achieve the desirable density in a given urban area. Further, planners can develop a set of regulations related to the accessibility and the land use to promote and control the densities in urban zones. Furthermore, the method can be utilized to develop land use and planning regulations effectively. A better understanding of the relationship among the accessibility, land use, and densities in cities allows urban planners and transport planners to create the spatial conditions for urban diversity supporting the envisaged sustainability. In addition, it provides a pathway to the maintenance and management of the existing areas in which the density is needed to be managed, as the city evolves. The findings of the study indicated that the accessibility of a street network and the land use mix influence the degree of density. This finding seems to be contradicted with the popular urban planning ideologies and practices, whereby road networks are planned according to the required functions. Accordingly, the flexible planning and zoning regulations are required to encourage the natural process rather than controlling the urban form artificially.
Decision-makers can utilize the findings of the study to make strategic interventions for achieving the envisaged urban form. On one hand, the findings of this study can be utilized to model the density as per a given land use and accessibility scenario. On the other hand, this study can be directly applied for transport planning interventions. That is to identify the impact of the changes in accessibility on the density. Therefore, the study concludes that this will be an effective tool for decision-makers in the fields of land-use planning and transport planning aiming at the overarching sustainability of future cities.

Author Contributions

A.J. conceived the idea of this paper, conceptualization, formal analysis and acquired the funding for this research. N.B.S.M. performed the writing of the original paper, data preparation, analysis, validation, and visualization under the supervision of A.J. C.A. developed the theoretical framework and reviewed and edited the paper. P.K.S.M. contributed for the organization of the study and signifying the application in planning practice. All authors have read and agreed to the published version of the manuscript.

Funding

Funded by the University of Moratuwa (UOM), Sri Lanka, Senate Research Committee Grant (No. SRC/LT/2019/28) and UoM, Senate Research Committee Conference & Publishing Support Grant 2020.

Institutional Review Board Statement

Not applicable.

Informed Consent Statement

Not applicable.

Data Availability Statement

Not applicable.

Conflicts of Interest

The authors declare no conflict of interest.

References

  1. Batty, M. Urban analytics defined. Environ. Plan. B Urban Anal. City Sci. 2019, 46, 403–405. [Google Scholar] [CrossRef] [Green Version]
  2. Geurs, K.T.; Wee, V. Accessibility evaluation of landuse and transport strategies: Review and research directions. Transp. Geogr. 2004, 12, 127–140. [Google Scholar] [CrossRef]
  3. Hellervik, A.; Nilsson, L.; Andersson, C. Preferential centrality a new measure unifying urban activity, attraction and accessibility. Urban Anal. City Sci. 2019, 46, 1331–1346. [Google Scholar] [CrossRef]
  4. Bramley, G.; Kirk, K. Does planning make a difference in urban form? Recent evidence from Central Scotland. Environ. Plan. A 2005, 1–2. [Google Scholar] [CrossRef]
  5. Marshall, A. Why Strategic Planning Fails to Produce Desired Results. In Proceedings of the Ninth International Space Syntax Symposium, Seoul, Korea, 31 October–3 November 2013; pp. 3–5. [Google Scholar]
  6. Jayasinghe, A.; Sano, K.; Rattanaporn, K. Application for developing countries: Estimating trip attraction in urban zones based on centrality. J. Traffic Transp. Eng. 2017, 4, 464–476. [Google Scholar] [CrossRef]
  7. Lu, S.; Huang, Y.; Shi, C.; Yang, X. Exploring the Associations between Urban form and Neighborhood Vibrancy: A Case Study of Chengdu, China. Int. J. Geoinf. 2019, 8, 165. [Google Scholar] [CrossRef] [Green Version]
  8. Jang, M.; Kang, C. The effects of urban greenways on the geography of office sectors and employment density in Seoul, Korea. Urban Stud. 2016, 53, 1022–1041. [Google Scholar] [CrossRef]
  9. Xiao, Y.; Webster, C. Urban Morphology and Housing Market; Springer Geography: Singapore, 2017. [Google Scholar]
  10. Batty, M. Cities and Complexity: Understanding Cities with Cellular Automata, Agent-Based Models, and Fractals; MIT Press: London, UK, 2017. [Google Scholar]
  11. Carlos, H.A. Density estimation and adaptive bandwidths: A primer for public health practitioners. Int. J. Health Geogr. 2010, 9, 9–39. [Google Scholar] [CrossRef] [PubMed] [Green Version]
  12. Jayasinghe, A.; Sano, K.; Abenayake, C.C.; Mahanama, P.K.S. A novel approach to model traffic on road segments of large-scale urban road networks. MethodsX 2019, 6, 1147–1163. [Google Scholar] [CrossRef] [PubMed]
  13. Nes, A.V.; Pont, M.B.; Mashhoodi, B. Combination of space syntax with spacematrix and the mixed-use index. The Rotterdam south test case. In Proceedings of the Space Syntax Symposium, Santiago de Chile, Chile, 3–6 January 2012; pp. 1–29. [Google Scholar]
  14. Hillier, B.; Vaughan, L. The City as One Thing; UCL Discovery: London, UK, 2007. [Google Scholar]
  15. Paul, A. Understanding the influence of roadway configuration on traffic flows through a conventional traffic assignment model. J. Transp. Lit. 2015, 9, 40–44. [Google Scholar] [CrossRef]
  16. Ratti, C. Urban texture and space syntax: Some inconsistencies. Environ. Plan. B Plan. Des. 2004, 31, 99–487. [Google Scholar] [CrossRef]
  17. Talat, M. Accessibility, Infrastructure Provision and Residential Land Value: Modelling the Relation Using Geographic Weighted Regression in the City of Rajkot, India. Sustainability 2020, 12, 1–5. [Google Scholar]
  18. Ye, Y.; Nes, A.V. Measuring urban maturation processes in Dutch and Chinese new towns: Combining street network configuration with building density and degree of landuse diversification through GIS. J. Space Syntax 2013, 4, 18–37. [Google Scholar]
  19. Lee, S.; Yoo, C.; Seo, K.W. Determinant Factors of Pedestrian Volume in Different Land-Use Zones: Combining Space Syntax Metrics with GIS-Based Built-Environment Measures. Sustainability 2020, 12, 8647. [Google Scholar] [CrossRef]
  20. Hillier, B. Space is the Machine: A Configurational Theory of Architecture Cambridg; Cambridge University Press: Cambridge, UK, 1999. [Google Scholar]
  21. Omer, I.; Goldblatt, R. Spatial patterns of retail activity and street network structure in new and traditional Israeli cities. Urban Geogr. 2016, 37, 629–649. [Google Scholar] [CrossRef]
  22. Frank, L.D.; Schmid, T.L.; Sallis, J.F.; Chapman, J.; Saelens, B.E. Linking objectively measured physical activity with objectively measured urban form: Findings from Smartraq. Am. J. Prev. Med. 2005, 117–125. [Google Scholar] [CrossRef] [PubMed]
  23. Porta, S.; Latora, V.; Wang, F.; Rueda, S.; Strano, E.; Scellato, S.; Cardillo, A.; Belli, E.; Càrdenas, F.; Cormenzana, B. Street Centrality and the Location of Economic Activities in Barcelona. Urban Stud. 2012, 49, 1471–1488. [Google Scholar] [CrossRef] [Green Version]
  24. Freeman, L.C. Centrality in social networks conceptual clarification. Soc. Netw. 1978, 1, 215–239. [Google Scholar] [CrossRef] [Green Version]
  25. Macioszek, E.; Świerk, P.; Kurek, A. The Bike-Sharing System as an Element of Enhancing Sustainable Mobility—A Case Study based on a City in Poland. Sustainability 2020, 12, 3285. [Google Scholar] [CrossRef] [Green Version]
  26. Pont, M.B.; Haupt, P. Space, Density and Urban Form; NAi Publishers: Rotterdam, The Netherlands, 2009. [Google Scholar]
Figure 1. Relationship among movement, function, and configuration [18].
Sustainability 13 00467 g001
Figure 2. Three-dimensional relationship among density, accessibility, and land use.
Sustainability 13 00467 g002
Figure 3. Space matrix to categorize urban density.
Sustainability 13 00467 g003
Figure 4. The process of analysis zone preparation.
Sustainability 13 00467 g004
Figure 5. The process of Land-use mix data preparation.
Sustainability 13 00467 g005
Figure 6. The process of density data preparation.
Sustainability 13 00467 g006
Figure 7. Accessibility data preparation process.
Sustainability 13 00467 g007
Figure 8. The process of Analysis.
Sustainability 13 00467 g008
Figure 9. Conversion of different spatial components comparable units.
Sustainability 13 00467 g009
Figure 10. The relationship among road width, closeness centrality, land use, and density: (a) study area Colombo (b) study area Kurunegala, and (c) study area Mawanella (note: Land use axis A = Amenities, C = Commercial, R = Residential, W = working, ACRW = Amenities + Commercial + Residential + Working, Density axis: LRP = low rise point, MRP = mid-rise point, HRP = high rise point, LRS = low rise strip, MRS = mid-rise strip, HRS = high rise strip, LRB = low rise block, MRB = mid-rise block, HRB = high rise block).
Sustainability 13 00467 g010
Figure 11. Summary of decision tree analysis in all three study areas.
Sustainability 13 00467 g011
Figure 12. Density regression model result in Colombo: (a) spatial distribution of model and actual density categories and (b) relationship between actual values and model values.
Sustainability 13 00467 g012
Figure 13. Density regression model result in Kurunegala: (a) spatial distribution of model and actual density categories and (b) relationship between actual values and model values.
Sustainability 13 00467 g013
Figure 14. Density regression model result in Mawanella: (a) spatial distribution of model and actual density categories and (b) relationship between actual values and model values.
Sustainability 13 00467 g014
Table 1. Attribute comparison three cities.
AttributesCase Study AreasData Source
ColomboKurunegalaMawanella
Type of urban form Polycentric Monocentric Linear city Compiled by authors
Settlement hierarchy First orderSecond orderThird orderNational Physical Plan, Sri Lanka, 2010
Building density index 0.730.530.35Compiled by authors
Population density 115 (p/ha)53 (p/ha)30 (p/ha)Department of Census and Statistics, Sri Lanka, 2012
Table 2. Summary of the acquired data.
VariableIndexData Source
ColomboKurunegalaMawanella
Land use Land use MixUDA, Colombo, 2014UDA, Kurunegala, 2017Bus terminal development project—Mawanella, UDA, Kegalle, 2018
DensityFloor area ratio
Plot coverage
Building height
AccessibilityCentrality of road networkJICA, 2015
Road widthUDA, Colombo, 2017
Table 3. Density categories.
NoDensity CategoryDensity Code
01Low-rise pointLRP
02Mid-rise pointMRP
03High-rise pointHRP
04Low-rise stripLRS
05Mid-rise stripMRS
06High-rise stripHRS
07Low-rise blockLRB
08Mid-rise blockMRB
09High-rise blockHRB
Table 4. Summary of decision tree model accuracy.
ParametersColomboKurunegalaMawanella
Correctly classified instances79.2%83.4179.104%
Incorrectly classified instances20.8%16.5620.89%
Kappa statistic0.710.730.705
Mean absolute error0.1010.0990.114
Relative absolute error29.28%25.78%39.21%
Table 5. Model summary.
Study AreaModelR SquareAdjusted R SquareStd. Error of the EstimateChange Statistics
R Square ChangeF Changedf1df2F Change
Colombo10.667 a0.6671.258850.6671499.64217480.000
20.746 b0.7461.099880.079232.83317470.000
30.766 c0.7651.057320.02062.34817460.000
Kurunegala10.606 a0.6031.148600.606224.44411460.000
20.687 b0.6821.027900.08137.30311450.000
30.726 c0.7200.964600.03920.65411440.000
Mawanella10.703 a0.6990.657840.703153.9411650.000
20.762 b0.7550.593650.05915.8171640.000
a Predictors: (constant), closeness. b Predictors: (constant), closeness, LU. c Predictors: (constant), closeness, LU, Road Width. d Dependent variable: density.
Table 6. Coefficients.
Study AreaModelVariablesaUnstandardized CoefficientsStandardized CoefficientstPartialPartSignificanceCollinearity Statistics
BBetaBetaVIF
Colombo1(Constant)−0.5320.120 −4.447 0.000
Closeness1.1680.0300.81738.7250.8170.8170.0001.000
2(Constant)1.6790.129 −13.045 0.000
Closeness0.9270.0310.64830.1380.7410.5550.0001.361
LU5.3910.3530.32815.2590.4870.2810.0001.361
3(Constant)1.5810.124 −12.719 0.000
Closeness0.8020.0340.56123.9120.6590.4290.0001.751
LU4.0010.3830.24310.4600.3580.1850.0001.726
Roa Width0.1660.0210.2057.8960.2780.1400.0002.144
Kurunegala1(Constant)−2.4350.390 −6.241 0.000
Closeness1.3550.0900.77814.9810.7780.7780.0001.000
2(Constant)−2.3400.350 −6.694 0.000
Closeness0.9430.1050.5428.9630.5970.4170.0001.692
LU4.6980.7690.3696.1080.4520.2840.0001.692
3(Constant)−3.0990.368 −8.419 0.000
Closeness0.8490.1010.4888.4140.5740.3670.0001.767
LU3.8140.7480.3005.1030.3910.2230.0001.815
Roa Width0.3080.0680.2284.5450.3540.1980.0001.319
Mawanella1(Constant)−0.2420.313 −0.775 0.441
Closeness7.0690.5700.83912.4070.8390.8390.0001.000
2(Constant)0.1530.299 0.512 0.610
Closeness4.8460.7590.5756.3810.6240.3890.0002.182
LU1.8580.4670.3583.9770.4450.2430.0002.182
a. Dependent variable: density.
Table 7. Summary results of part and partial correlation analysis model accuracy.
Case Study AreaColomboKurunegalaMawanella
R2 0.760.720.77
PartialLand-use mix0.350.350.27
Closeness centrality0.590.560.67
Road width0.350.380.32
PartLand-use mix0.1850.2230.141
Closeness centrality0.4240.3670.312
Road width0.1400.1980.089
(Partial^2)%Land-use mix12%12%7%
Closeness centrality35%31%45%
Road width12%14%10%
(Part^2)%Land-use mix3.44.91.9
Closeness centrality17.913.49.7
Road width1.93.90.79
Publisher’s Note: MDPI stays neutral with regard to jurisdictional claims in published maps and institutional affiliations.

