Addressing the Urban Heat Islands Effect: A Cross-Country Assessment of the Role of Green Infrastructure

 ,
,  ,
,  ,
,  , , , and
Abstract
:1. Introduction
2. Urban Heat Islands: Definition, Facts and Trends
- Surface UHIs are typically present day and night but strongest during the day and typically largest in summer, with up to 12 °C differences in daily urban versus rural surface temperatures [32].
- Atmospheric UHIs, typically observed during predawn and night during the winter time, are further distinguished into the canopy layer UHI, i.e., the layer of air where people live from ground to roof/tree tops, and the boundary layer UHI from roof top level to about a height of 1.5 km, with a temperature range between 7–12 °C [32].
3. The Potential of Green Infrastructure for Urban Adaptation
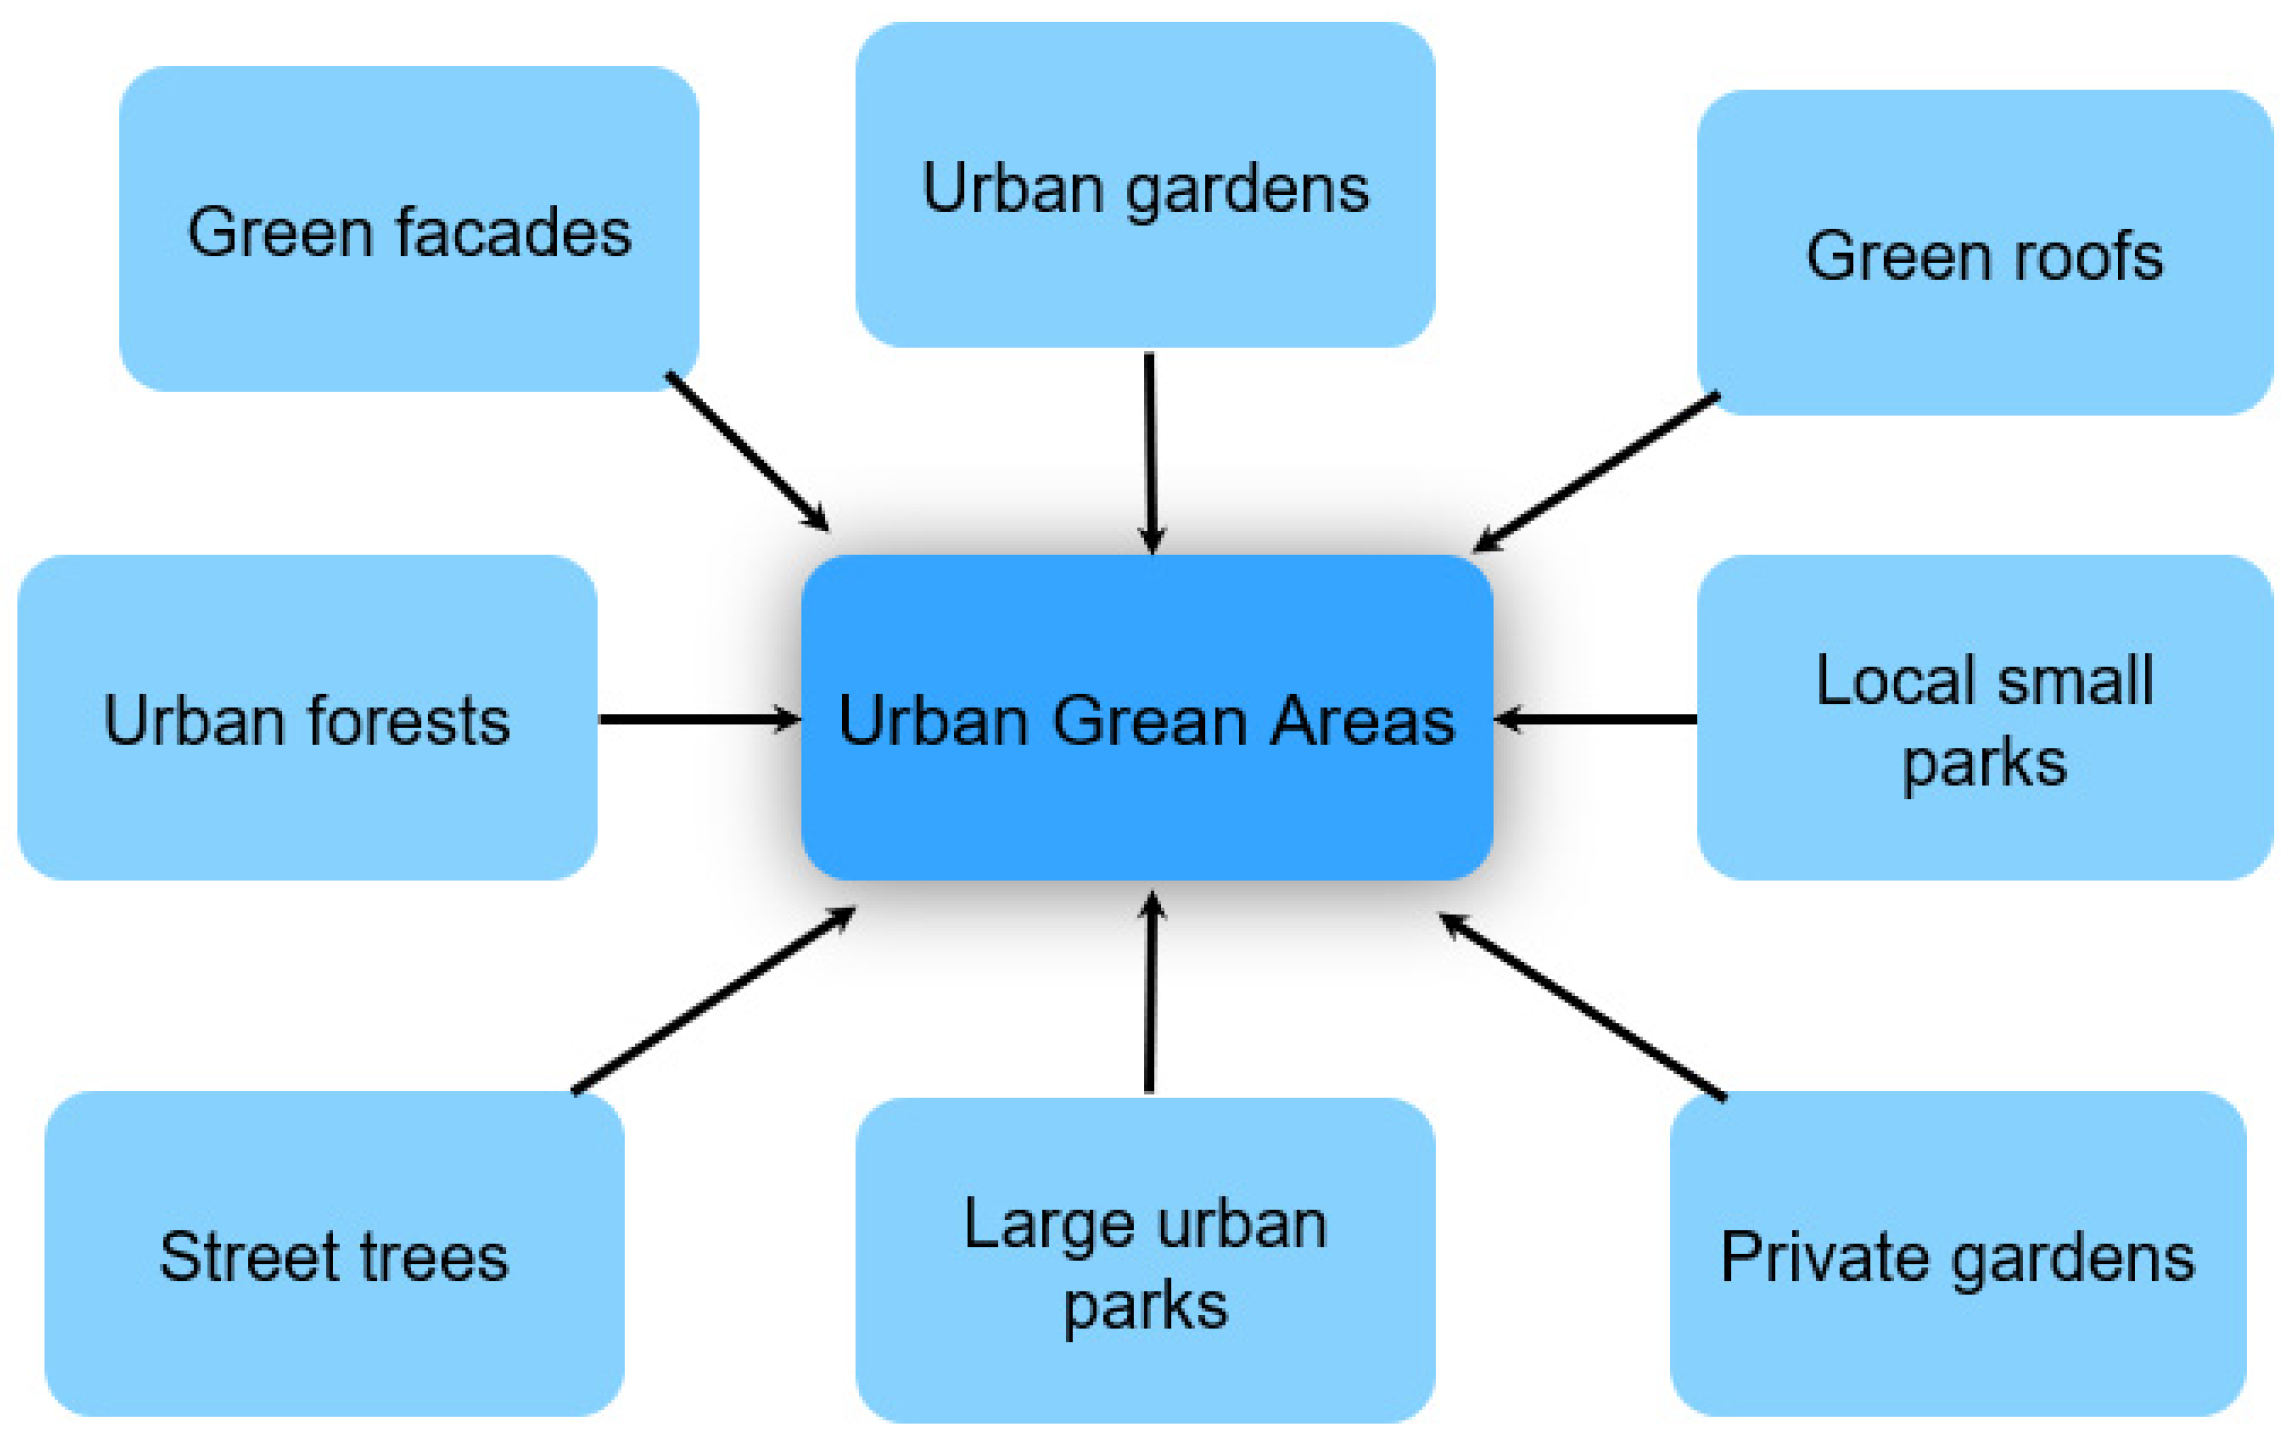
- Public parks and gardens, including urban parks, open space reserves, cemeteries and formal gardens
- Greenways, including river and creek corridors, cycle ways and routes along significant transport (road, rail and tram) corridors
- Residential and other streets, comprising street verges and associated open space pockets
- Sports and recreational facilities, including tracks, golf courses, school and other institutional playing fields, and other significant parks
- Private/semi-private gardens, including shared (communal) spaces around apartment buildings, backyards, balconies, roof gardens and community (productive) gardens
- Green roofs and walls, including roof gardens and living walls
- Squares and plazas, including both public and private courtyards and forecourts
- Natural green space, including national parks and nature reserves, wetlands and coastal margins
- Utility areas, including quarries, airports, and large institutional and manufacturing sites. This category also includes unused land reserved for future use
- Agricultural and other productive lands, including vineyards, market gardens, orchards and farms
4. Methodology
5. Results and Discussion
- Green areas play, in general, a key role as adaptation tools and also in the process of building resilience of urban dwelling [141,144]. This is especially true in relation to the thermal regulation of urbanized areas to counteract the UHI effect, due to the interception of direct solar radiation and increased evapotranspiration [145]. This may decrease the radiant temperature, profoundly influencing the thermal comfort (TC), usually measured as physiological equivalent temperature [146].
- Tree covers are believed to have a useful effect on outside TC in cities [82,143,147]. Tree groves and forested parks have an average cooling effect of about 1 °C in air temperature [148], but could have a significant improvement on TC especially during heat waves [146,149]. However, denser tree canopies could have an adverse effect due to their increase of local humidity and reduction of wind speed that then results in a higher heat sensation [150,151]. The TC may be favored by shrub and grass cover in open areas or combined with trees [149,152], changing tree locations on artificial surfaces, e.g., parking lots or footways [153], integrating water bodies and irrigation systems [141,147,152,154] and also using green façades [143].
- The positioning of the urban green resources can also strengthen the cooling effect, for instance, by placing trees or other green cover in more exposed street canyons or on façades [82,141,143,149,155], thereby increasing the green cover and the impervious surfaces ratio [156], as well as creating a well-distributed net of green spaces. Moreover, the size of the urban green resources matters: A recent study suggests that large urban parks with an area of at least 0.1 km2 have the largest cooling effect in terms of cooling distance and intensity [72].
6. Conclusions
Author Contributions
Funding
Institutional Review Board Statement
Informed Consent Statement
Data Availability Statement
Conflicts of Interest
References
- Food and Agriculture Organization of the United Nations. 2008. Available online: http://www.fao.org/faostat/en/#data/QC (accessed on 17 October 2020).
- Moran, D.; Kanemoto, K.; Jiborn, M.; Wood, R.; Többen, J.R.; Seto, K.C. Carbon footprints of 13 000 cities. Environ. Res. Lett. 2018, 13, 064041. [Google Scholar] [CrossRef]
- Busch, R. The Green City Index-A Summary of the Green City Index Research Series; Siemens AG Corporate Communications and Government Affairs, Siemens AG: Munich, Germany, 2012. [Google Scholar]
- Tana, S.; Yang, J.; Yan, J. Development of the Low-carbon City Indicator (LCCI) Framework. In Proceedings of the 7th International Conference on Applied Energy—ICAE2015, Abu Dhabi, UAE, 28–31 March 2015; pp. 2516–2522. [Google Scholar]
- Glaeser, E.L.; Kahn, M.E. The greenness of cities: Carbon dioxide emissions and urban development. J. Urban Econ. 2010, 67, 404–418. [Google Scholar] [CrossRef] [Green Version]
- Jones, C.; Kammen, D.M. Spatial Distribution of U.S. Household Carbon Footprints Reveals Suburbanization Undermines Greenhouse Gas Benefits of Urban Population Density. Environ. Sci. Technol. 2014, 48, 895–902. [Google Scholar] [CrossRef] [PubMed]
- Ng, E. Designing High-Density Cities: For Social and Environmental Sustainability; Routledge: London, UK, 2009. [Google Scholar]
- Liu, Y.; Song, Y.; Arp, H.P. Examination of the relationship between urban form and urban eco-efficiency in china. Habitat Int. 2012, 36, 171–177. [Google Scholar] [CrossRef]
- Mindali, O.; Raveh, A.; Salomon, I. Urban density and energy consumption: A new look at old statistics. Transp. Res. Part A Policy Pract. 2004, 38, 143–162. [Google Scholar] [CrossRef]
- The World Bank. Population Density (People per sq. km of Land Area). 2017. Available online: https://data.worldbank.org/indicator/EN.POP.DNST?end=2016&start=1961&view=chart (accessed on 10 October 2020).
- United Nations Department of Economic and Social Affairs (UN-DES). Nationen. In The World’s Cities in 2016; UN-DES: Washington, DC, USA, 2016. [Google Scholar]
- United Nations (UN). World Urbanization Prospects: The 2014 Revision, Highlights; Department of Economic and Social Affairs. United Nations: New York, NY, USA, 2014. [Google Scholar]
- United Nations. 2018 Revision of World Urbanization Prospects. 2018. Available online: https://www.un.org/development/desa/publications/2018-revision-of-world-urbanization-prospects (accessed on 19 July 2020).
- Filho, W.L.; Icaza, L.E.; Neht, A.; Klavins, M.; Morgan, E.A. Coping with the impacts of urban heat islands. A literature based study on understanding urban heat vulnerability and the need for resilience in cities in a global climate change context. J. Clean. Prod. 2018, 171, 1140–1149. [Google Scholar] [CrossRef] [Green Version]
- Li, D.; Bou-Zeid, E. Synergistic Interactions between Urban Heat Islands and Heat Waves: The Impact in Cities Is Larger than the Sum of Its Parts. J. Appl. Meteorol. Clim. 2013, 52, 2051–2064. [Google Scholar] [CrossRef] [Green Version]
- Founda, D.; Santamouris, M. Synergies between Urban Heat Island and Heat Waves in Athens (Greece), during an extremely hot summer (2012). Sci. Rep. 2017, 7, 1–11. [Google Scholar] [CrossRef] [Green Version]
- Zhao, L.; Oppenheimer, M.; Zhu, Q.; Baldwin, J.W.; Ebi, K.; Bou-Zeid, E.; Guan, K.; Liu, X. Interactions between urban heat islands and heat waves. Environ. Res. Lett. 2018, 13, 034003. [Google Scholar] [CrossRef]
- Rogers, C.D.; Gallant, A.J.; Tapper, N.J. Is the urban heat island exacerbated during heatwaves in southern Australian cities? Appl. Clim. 2019, 137, 441–457. [Google Scholar] [CrossRef]
- Venter, Z.S.; Krog, N.H.; Barton, D.N. Linking green infrastructure to urban heat and human health risk mitigation in Oslo, Norway. Sci. Total. Environ. 2020, 709, 136193. [Google Scholar] [CrossRef] [PubMed]
- Environmental Protection Agency (EPA). Climate Change and Heat Islands. 2019. Available online: https://www.epa.gov/heat-islands/climate-change-and-heat-islands (accessed on 1 May 2019).
- Perkins-Kirkpatrick, S.; Alexander, L.V.; Nairn, J.R. Increasing frequency, intensity and duration of observed global heatwaves and warm spells. Geophys. Res. Lett. 2012, 39. [Google Scholar] [CrossRef]
- Meehl, G.A.; Tebaldi, C.; Tilmes, S.; Lamarque, J.-F.; Bates, S.; Pendergrass, A.G.; Lombardozzi, D.L. Future heat waves and surface ozone. Environ. Res. Lett. 2018, 13, 064004. [Google Scholar] [CrossRef]
- Carbon Brief. Media Reaction: The 2018 Summer Heatwaves and Climate Change. 2018. Available online: https://www.carbonbrief.org/media-reaction-2018-summer-heatwaves-and-climate-change (accessed on 11 November 2019).
- Watts, N.; Amann, M.; Arnell, N.; Ayeb-Karlsson, S.; Belesova, K.; Boykoff, M.; Byass, P.; Cai, W.; Campbell-Lendrum, D.; Capstick, S.; et al. The 2019 report of The Lancet Countdown on health and climate change: Ensuring that the health of a child born today is not defined by a changing climate. Lancet 2019, 394, 1836–1878. [Google Scholar] [CrossRef] [Green Version]
- World in German (WELT). Hitze in Deutschland. 2019. Available online: https://www.welt.de/vermischtes/article195745337/Hitze-in-Deutschland-Jetzt-kommt-noch-eine-hohe-UV-Belastung-hinzu.html (accessed on 22 July 2019).
- Deutche Wetterdienst (DWD). Wetterlexikon. Hitzewelle. 2018. Available online: https://www.dwd.de/DE/service/lexikon/Functions/glossar.html?lv2=101094&lv3=624852 (accessed on 22 July 2019).
- Rosenzweig, C.; Solecki, W.; Romero-Lankao, P.; Mehrotra, S.; Dhakal, S.; Bowman, T.; Ibrahim, S.A. Climate Change and Cities: Second Assessment Report of the Urban Climate Change Research Network; Cambridge University Press (CUP): Cambridge, UK, 2018. [Google Scholar]
- Peng, S.; Piao, S.; Ciais, P.; Friedlingstein, P.; Ottle, C.; Bréon, F.-M.; Nan, H.; Zhou, L.; Myneni, R.B. Surface Urban Heat Island Across 419 Global Big Cities. Environ. Sci. Technol. 2012, 46, 696–703. [Google Scholar] [CrossRef]
- Bai, Y.; Xing, Y.; Guo, R. Relationship between urban heat island and green infrastructure fraction in Harbin. Remote Sens. Technol. Appl. Urban Environ. III 2018, 10793, 107930D. [Google Scholar] [CrossRef]
- Oke, T.R. The energetic basis of the urban heat island. Q. J. R. Meteorol. Soc. 1982, 108, 1–24. [Google Scholar] [CrossRef]
- Depietri, Y.; Renaud, F.G.; Kallis, G. Heat waves and floods in urban areas: A policy-oriented review of ecosystem services. Sustain. Sci. 2011, 7, 95–107. [Google Scholar] [CrossRef]
- Environmental Protection Agency (EPA). Urban Heat Island Basics. In Reducing Urban Heat Islands: Compendium of Strategies; US-EPA: Washington, DC, USA, 2008. [Google Scholar]
- Paolini, L. Análisis de la respuesta de la temperatura de superficie al crecimiento urbano utilizando series temporales MODIS. Revista de Teledetección 2012, 38, 28–35. [Google Scholar]
- Anđelković, G. Urban Heat Island in Belgrade—Features, Causes and Consequences; University of Belgrade: Belgrade, Serbia, 2005. [Google Scholar]
- Mirzaei, P.A.; Haghighat, F. Approaches to study Urban Heat Island—Abilities and limitations. Build. Environ. 2010, 45, 2192–2201. [Google Scholar] [CrossRef]
- Gartland, L.M. Heat Islands: Understanding and Mitigating Heat in Urban Areas; Routledge: London, UK, 2012. [Google Scholar]
- Mohajerani, A.; Bakaric, J.; Jeffrey-Bailey, T. The urban heat island effect, its causes, and mitigation, with reference to the thermal properties of asphalt concrete. J. Environ. Manag. 2017, 197, 522–538. [Google Scholar] [CrossRef] [PubMed]
- Gago, E.J.; Roldan, J.; Pacheco-Torres, R.; Ordonez, J. The city and urban heat islands: A review of strategies to mitigate adverse effects. Renew. Sustain. Energy Rev. 2013, 25, 749–758. [Google Scholar] [CrossRef]
- He, B.-J. Potentials of meteorological characteristics and synoptic conditions to mitigate urban heat island effects. Urban Clim. 2018, 24, 26–33. [Google Scholar] [CrossRef]
- Yuan, Y.; Xi, C.; Qian, J.; Felix, N. Seasonal Variations of the Urban Thermal Environment Effect in a Tropical Coastal City. Adv. Meteorol. 2017, 2017, 1–18. [Google Scholar] [CrossRef] [Green Version]
- Hart, M.A.; Sailor, D.J. Quantifying the influence of land-use and surface characteristics on spatial variability in the urban heat island. Appl. Clim. 2009, 95, 397–406. [Google Scholar] [CrossRef]
- Zhou, B.; Rybski, D.; Kropp, J.P. The role of city size and urban form in the surface urban heat island. Sci. Rep. 2017, 7, 4791. [Google Scholar] [CrossRef]
- Oke, T.R. City size and the urban heat island. Atmos. Environ. (1967) 1973, 7, 769–779. [Google Scholar] [CrossRef]
- Park, H.-S. Features of the heat island in seoul and its surrounding cities. Atmos. Environ. (1967) 1986, 20, 1859–1866. [Google Scholar] [CrossRef]
- Oke, T.R. Canyon geometry and the nocturnal urban heat island: Comparison of scale model and field observations. J. Clim. 1981, 1, 237–254. [Google Scholar] [CrossRef]
- Alcoforado, M.-J.; Andrade, H. Nocturnal urban heat island in Lisbon (Portugal): Main features and modelling attempts. Appl. Clim. 2006, 84, 151–159. [Google Scholar] [CrossRef]
- Gál, T.; Skarbit, N.; Unger, J. Urban heat island patterns and their dynamics based on an urban climate measurement network. Hung. Geogr. Bull. 2016, 65, 105–116. [Google Scholar] [CrossRef] [Green Version]
- Eliasson, I. Urban nocturnal temperatures, street geometry and land use. Atmos. Environ. 1996, 30, 379–392. [Google Scholar] [CrossRef]
- Memon, R.A.; Leung, D.Y.; Liu, C.-H. An investigation of urban heat island intensity (UHII) as an indicator of urban heating. Atmos. Res. 2009, 94, 491–500. [Google Scholar] [CrossRef]
- Tzavali, A.; Paravantis, J.P.; Mihalakakou, G.; Fotiadi, A.; Stigka, E. Urban heat island intensity: A literature review. Fresen Environ. Bull. 2015, 24, 4537–4554. [Google Scholar]
- Filho, W.L.; Icaza, L.E.; Emanche, V.O.; Al-Amin, A.Q. An Evidence-Based Review of Impacts, Strategies and Tools to Mitigate Urban Heat Islands. Int. J. Environ. Res. Public Health 2017, 14, 1600. [Google Scholar] [CrossRef] [Green Version]
- Savić, S.; Lužanin, Z.; Milošević, D.; Kresoja, M. Intra-urban analysis of air temperature in central European city. In Proceedings of the 10th International Conference on Urban Climate (ICUC10) with the 14th Symposium on the Urban Environment (SUE), New York, NY, USA, 6–10 August 2018; p. 6. [Google Scholar]
- Conde, C.; Pabón, D.; Sánchez Rodríguez, R. La importancia de la información climática para la planificación del crecimiento y el desarrollo urbano. Respuestas urbanas al cambio climático en América Latina. Available online: https://repositorio.cepal.org/bitstream/handle/11362/36622/S2013813_es.pdf;jsessionid=527EB6246252382FDAD40D6DC0FF380C?sequence=1 (accessed on 19 July 2020).
- Buchin, O.; Hoelscher, M.-T.; Meier, F.; Nehls, T.; Ziegler, F. Evaluation of the health-risk reduction potential of countermeasures to urban heat islands. Energy Build. 2016, 114, 27–37. [Google Scholar] [CrossRef]
- Unger, J.; Savić, S.; Gál, T.; Milošević, D. Urban Climate and Monitoring Network System in Central European Cities; University of Novi Sad-University of Szeged: Szeged, Hungary, 2014; p. 101. [Google Scholar]
- Roth, M. Urban Heat Islands. In Handbook of Environmental Fluid Dynamics; Fernando, H.J.S., Ed.; CRC Press/Taylor & Francis Group LLC.: Boca Raton, FL, USA, 2013; pp. 143–159. [Google Scholar]
- Stewart, I.D. A systematic review and scientific critique of methodology in modern urban heat island literature. Int. J. Clim. 2011, 31, 200–217. [Google Scholar] [CrossRef]
- Wilhelmi, O.V.; Hayden, M.H. Connecting people and place: A new framework for reducing urban vulnerability to extreme heat. Environ. Res. Lett. 2010, 5, 14021. [Google Scholar] [CrossRef]
- Huang, G.; Cadenasso, M.L. People, landscape, and urban heat island: Dynamics among neighborhood social conditions, land cover and surface temperatures. Landsc. Ecol. 2016, 31, 2507–2515. [Google Scholar] [CrossRef]
- Depietri, Y.; Welle, T.; Renaud, F.G. Social vulnerability assessment of the Cologne urban area (Germany) to heat waves: Links to ecosystem services. Int. J. Disaster Risk Reduct. 2013, 6, 98–117. [Google Scholar] [CrossRef]
- Santamouris, M.; Paraponiaris, K.; Mihalakakou, G. Estimating the ecological footprint of the heat island effect over Athens, Greece. Clim. Chang. 2007, 80, 265–276. [Google Scholar] [CrossRef]
- Ward, K.; Lauf, S.; Kleinschmit, B.; Endlicher, W. Heat waves and urban heat islands in Europe: A review of relevant drivers. Sci. Total Environ. 2016, 569, 527–539. [Google Scholar] [CrossRef] [PubMed]
- Masson, V.; Marchadier, C.; Adolphe, L.; Aguejdad, R.; Avner, P.; Bonhomme, M.; Bretagne, G.; Briottet, X.; Bueno, B.; De Munck, C.; et al. Adapting cities to climate change: A systemic modelling approach. Urban Clim. 2014, 10, 407–429. [Google Scholar] [CrossRef]
- Filho, W.L.; Al-Amin, A.Q.; Nagy, G.J.; Azeiteiro, U.M.; Wiesböck, L.; Ayal, D.Y.; Morgan, E.A.; Mugabe, P.; Aparicio-Effen, M.; Fudjumdjum, H.; et al. A Comparative Analysis of Climate-Risk and Extreme Event-Related Impacts on Well-Being and Health: Policy Implications. Int. J. Environ. Res. Public Health 2018, 15, 331. [Google Scholar] [CrossRef] [PubMed] [Green Version]
- Marando, F.; Salvatori, E.; Sebastiani, A.; Fusaro, L.; Manes, F. Regulating Ecosystem Services and Green Infrastructure: Assessment of Urban Heat Island effect mitigation in the municipality of Rome, Italy. Ecol. Model. 2019, 392, 92–102. [Google Scholar] [CrossRef]
- Block, A.H.; Livesley, S.J.; Williams, N.S.G. Responding to the Urban Heat Island: A Review of the Potential of Green Infrastructure. 2012. Available online: http://www.vcccar.org.au/sites/default/files/publications/VCCCAR%20Urban%20Heat%20Island%20-WEB.pdf (accessed on 27 April 2020).
- Susca, T.; Gaffin, S.R.; Dell’Osso, G.R. Positive effects of vegetation: Urban heat island and green roofs. Environ. Pollut. 2011, 159, 2119–2126. [Google Scholar] [CrossRef]
- Herath, H.; Halwatura, R.; Jayasinghe, G. Evaluation of green infrastructure effects on tropical Sri Lankan urban context as an urban heat island adaptation strategy. Urban Urban Green. 2018, 29, 212–222. [Google Scholar] [CrossRef]
- Emmanuel, R.; Loconsole, A. Green infrastructure as an adaptation approach to tackling urban overheating in the Glasgow Clyde Valley Region, UK. Landsc. Urban Plan. 2015, 138, 71–86. [Google Scholar] [CrossRef] [Green Version]
- Li, X.-X.; Norford, L.K. Evaluation of cool roof and vegetations in mitigating urban heat island in a tropical city, Singapore. Urban Clim. 2016, 16, 59–74. [Google Scholar] [CrossRef]
- Feysa, G.L.; Dons, K.; Meilby, H. Efficiency of parks in mitigating urban heat island effect: An example for Addis Ababa. Land Urb Plan. 2014, 123, 87–95. [Google Scholar] [CrossRef]
- Aram, F.; García, E.H.; Solgi, E.; Mansournia, S. Urban green space cooling effect in cities. Heliyon 2019, 5, e01339. [Google Scholar] [CrossRef] [PubMed] [Green Version]
- Stanganelli, M.; Ferundo, C. Understanding the role of urban morphology and green areas configuration during heat waves. Int. J. Agric. Environ. Inf. Sys. 2017, 8, 4. [Google Scholar] [CrossRef]
- Smith, C.; Levermore, G.J. Designing urban spaces and buildings to improve sustainability and quality of life in a warmer world. Energy Policy 2008, 36, 4558–4562. [Google Scholar] [CrossRef]
- Kleerekoper, L.; Van Esch, M.; Salcedo, T.B. How to make a city climate-proof, addressing the urban heat island effect. Resour. Conserv. Recycl. 2012, 64, 30–38. [Google Scholar] [CrossRef]
- Gunawardena, K.; Wells, M.; Kershaw, T. Utilising green and bluespace to mitigate urban heat island intensity. Sci. Total Environ. 2017, 584, 1040–1055. [Google Scholar] [CrossRef]
- Wang, K.; Aktas, Y.D.; Stocker, J.; Carruthers, D.; Hunt, J.; Malki-Epshtein, L. Urban heat island modelling of a tropical city: Case of Kuala Lumpur. Geosci. Lett. 2019, 6, 4. [Google Scholar] [CrossRef]
- Giseke, U. Urban redevelopment—Enlivening open-space culture. Ger. J. Urban Stud. 2007, 46, 7–16. [Google Scholar]
- Adedeji, J.A.; Fadamiro, J.A. Urban open space transition and management in Lagos, Nigeria. Manag. Environ. Qual. Int. J. 2015, 26, 951–965. [Google Scholar] [CrossRef]
- Yiannakou, A.; Salata, K.-D. Adaptation to Climate Change through Spatial Planning in Compact Urban Areas: A Case Study in the City of Thessaloniki. Sustainability 2017, 9, 271. [Google Scholar] [CrossRef] [Green Version]
- Pizzaro, R. Urban Form and Climate Change: Towards Appropriate Development Patterns to Mitigate and Adapt to Global Warming. In Planning for Climate Change: Strategies for Mitigation and Adaptation for Spatial Planners; Davoudi, S., Crawford, J., Mehmood, A., Eds.; Earthscan: London, UK, 2009; pp. 33–45. [Google Scholar]
- Norton, B.A.; Coutts, A.M.; Livesley, S.J.; Harris, R.J.; Hunter, A.M.; Williams, N.S. Planning for cooler cities: A framework to prioritise green infrastructure to mitigate high temperatures in urban landscapes. Landsc. Urban Plan. 2015, 134, 127–138. [Google Scholar] [CrossRef]
- Natural England. Green Infrastructure Guidance; Landscape Institute: London, UK, 2009.
- Sandstrom, U.G. Green Infrastructure Planning in Urban Sweden. Plan. Pract. Res. 2002, 17, 373–385. [Google Scholar] [CrossRef]
- Tzoulas, K.; Korpela, K.; Venn, S.; Yli-Pelkonen, V.; Kaźmierczak, A.; Niemelä, J.; James, P. Promoting ecosystem and human health in urban areas using Green Infrastructure: A literature review. Landsc. Urban Plan. 2007, 81, 167–178. [Google Scholar] [CrossRef] [Green Version]
- Wolf, K.L. Ergonomics of the City: Green Infrastructure and Social Benefits; American Forestry Association: Washington, DC, USA, 2003. [Google Scholar]
- Naumann, S.; McKenna, D.; Timo, K.; Mav, P.; Matt, R. Design, Implementation and Cost Elements of Green Infrastructure Projects; Ecologic Institute and GHK Consulting: Berlin, Germany, 2011. [Google Scholar]
- Hansen, R.; Pauleit, S. From multifunctionality to multiple ecosystem services? A conceptual framework for multifunctionality in green infrastructure planning for urban areas. AMBIO 2014, 43, 516–529. [Google Scholar] [CrossRef] [PubMed] [Green Version]
- International Energy Agency (IEA). Energy Technology Perspectives 2017. 2017. Available online: https://www.iea.org/topics/energy-technology-perspectives (accessed on 4 December 2019).
- Organisation for Economic Co-operation and Development (OECD), OECD Factbook 2015-2016: Economic, Environmental and Social Statistics, OECD Publishing, Paris, 2016. Available online: http://dx.doi.org/10.1787/factbook-2015-en (accessed on 19 July 2020).
- Kennedy, C.A.; Steinberger, J.; Gasson, B.; Hansen, Y.; Hillman, T.; Havránek, M.; Pataki, D.; Phdungsilp, A.; Ramaswami, A.; Mendez, G.V. Greenhouse Gas Emissions from Global Cities. Environ. Sci. Technol. 2009, 43, 7297–7302. [Google Scholar] [CrossRef]
- Castleton, H.; Stovin, V.; Beck, S.B.; Davison, B. Green roofs; building energy savings and the potential for retrofit. Energy Build. 2010, 42, 1582–1591. [Google Scholar] [CrossRef]
- McPherson, E.G.; Simpson, J.R. Potential energy savings in buildings by an urban tree planting programme in California. Urban Urban Green. 2003, 2, 73–86. [Google Scholar] [CrossRef]
- Song, X.P.; Tan, P.Y.; Edwards, P.; Richards, D. The economic benefits and costs of trees in urban forest stewardship: A systematic review. Urban Urban Green. 2018, 29, 162–170. [Google Scholar] [CrossRef]
- Zinzi, M.; Agnoli, S. Cool and green roofs. An energy and comfort comparison between passive cooling and mitigation urban heat island techniques for residential buildings in the Mediterranean region. Energy Build. 2012, 55, 66–76. [Google Scholar] [CrossRef]
- Nowak, D.J.; Crane, D.E. Carbon storage and sequestration by urban trees in the USA. Environ. Pollut. 2002, 116, 381–389. [Google Scholar] [CrossRef]
- Wang, Y.-C.; Lin, J.-C. Air quality enhancement zones in Taiwan: A carbon reduction benefit assessment. Policy Econ. 2012, 23, 40–45. [Google Scholar] [CrossRef]
- Zhao, M.; Kong, Z.-H.; Escobedo, F.J.; Gao, J. Impacts of urban forests on offsetting carbon emissions from industrial energy use in Hangzhou, China. J. Environ. Manag. 2010, 91, 807–813. [Google Scholar] [CrossRef] [PubMed]
- Nieuwenhuijsen, M.J.; Khreis, H. Car free cities: Pathway to healthy urban living. Environ. Int. 2016, 94, 251–262. [Google Scholar] [CrossRef] [PubMed]
- Yang, P.; Ren, G.; Liu, W. Spatial and Temporal Characteristics of Beijing Urban Heat Island Intensity. J. Appl. Meteorol. Clim. 2013, 52, 1803–1816. [Google Scholar] [CrossRef]
- Meng, Q.; Zhang, L.; Sun, Z.; Meng, F.; Wang, L.; Sun, Y. Characterizing spatial and temporal trends of surface urban heat island effect in an urban main built-up area: A 12-year case study in Beijing, China. Remote. Sens. Environ. 2018, 204, 826–837. [Google Scholar] [CrossRef]
- Bejaran, R.A.; Camilloni, A.I. Objective method for classifying air masses: An application to the analyses of Buenos Aires’ (Argentina) urban heat island intensity. Theor. Appl. Clim. 2003, 74, 93–103. [Google Scholar] [CrossRef]
- Camilloni, I.; Barrucand, M. Temporal variability of the Buenos Aires, Argentina, urban heat island. Appl. Clim. 2012, 107, 47–58. [Google Scholar] [CrossRef]
- Dewan, A.M.; Yamaguchi, Y. Land use and land cover change in Greater Dhaka, Bangladesh: Using remote sensing to promote sustainable urbanization. Appl. Geogr. 2009, 29, 390–401. [Google Scholar] [CrossRef]
- Das, M.K.; Karmakar, S. Urban Heat Island Assessment for a Tropical Urban Air-shed in Bangladesh. In Proceedings of the ICUC9 9th International Conference on Urban Climate Jointly with 12th Symposium on the Urban Environment, Toulouse, France, 20–24 July 2015. [Google Scholar]
- Ayanlade, A. Variation in diurnal and seasonal urban land surface temperature: Landuse change impacts assessment over Lagos metropolitan city. Model. Earth Syst. Environ. 2016, 2, 1–8. [Google Scholar] [CrossRef] [Green Version]
- Dissanayake, D.; Morimoto, T.; Murayama, Y.; Ranagalage, M.; Handayani, H.H. Impact of Urban Surface Characteristics and Socio-Economic Variables on the Spatial Variation of Land Surface Temperature in Lagos City, Nigeria. Sustainability 2018, 11, 25. [Google Scholar] [CrossRef] [Green Version]
- Hoffmann, P. Quantifying the Influence of Climate Change on the Urban Heat Island of Hamburg Using Different Downscaling Methods. Ph.D. Dissertation, University of Hamburg, Hamburg, Germany, 2012. [Google Scholar]
- Hoffmann, P.; Schoetter, R.; Schlünzen, K.H. Statistical-dynamical downscaling of the urban heat island in Hamburg, Germany. Meteorol. Z. 2018, 27, 89–109. [Google Scholar] [CrossRef]
- Ramakreshnan, L.; Aghamohammadi, N.; Fong, C.S.; Ghaffarian Hoseini, A.; Ghaffarian Hoseini, A.; Wong, L.P.; Hassan, N.; Sulaiman, N.M. A critical review of Urban Heat Island phenomenon in the context of Greater Kuala Lumpur, Malaysia. Sustain. Cities Soc. 2018, 39, 99–113. [Google Scholar] [CrossRef]
- Programa de las Naciones Unidas para el Desarrollo (PNUD). Plan Climático de la Región Metropolitana de Uruguay. 2012. Available online: http://montevideo.gub.uy/sites/default/files/plan_climatico_region_metropolitana_uruguay.pdf (accessed on 31 October 2019).
- Sharma, R.; Hooyberghs, H.; Lauwaet, D.; De Ridder, K. Urban Heat Island and Future Climate Change—Implications for Delhi’s Heat. J. Hered. 2019, 96, 235–251. [Google Scholar] [CrossRef] [PubMed]
- The Energy and Resources Institute (TERI). Urban Planning Characteristics to Mitigate Climate Change in Context of Urban Heat Island Effect; TERI: New Delhi, India, 2017; p. 82. [Google Scholar]
- Unger, J.; Savić, S.; Gál, T. Modelling of the Annual Mean Urban Heat Island Pattern for Planning of Representative Urban Climate Station Network. Adv. Meteorol. 2011, 2011, 1–9. [Google Scholar] [CrossRef]
- Savić, S.; Unger, J.; Gál, T.; Milošević, D.; Popov, Z. Urban heat island research of Novi Sad (Serbia): A review. Geographica Pannonica 2013, 17, 32–36. [Google Scholar] [CrossRef] [Green Version]
- Rio Prefeitura. Mapeamento Da Cobertura Vegetal E Do Uso Das Terras Do Municipio Do Rio de Janeiro. 2016. Available online: http://prefeitura.rio/web/smac/exibeconteudo;jsessionid=A34B446E3255F4224981FABB05C84BD6.liferay-inst5?id=2367968 (accessed on 29 June 2019).
- de Faria Peres, L.; De Lucena, A.J.; Filho, O.C.R.; França, J.R.D.A. The urban heat island in Rio de Janeiro, Brazil, in the last 30 years using remote sensing data. Int. J. Appl. Earth Obs. Geoinf. 2018, 64, 104–116. [Google Scholar] [CrossRef]
- Kim, Y.H.; Baik, J.-J. Spatial and Temporal Structure of the Urban Heat Island in Seoul. J. Appl. Meteorol. 2005, 44, 591–605. [Google Scholar] [CrossRef]
- Sharifi, E.; Lehmann, S. Comparative Analysis of Surface Urban Heat Island Effect in Central Sydney. J. Sustain. Dev. 2014, 7. [Google Scholar] [CrossRef] [Green Version]
- Santamouris, M.; Haddad, S.; Saliari, M.; Vasilakopoulou, K.; Synnefa, A.; Paolini, R.; Ulpiani, G.; Garshasbi, S.; Fiorito, F. On the energy impact of urban heat island in Sydney: Climate and energy potential of mitigation technologies. Energy Build. 2018, 166, 154–164. [Google Scholar] [CrossRef]
- Kuchcik, M.; Błażejczyk, K.; Milewski, P.; Szmyd, J. Urban climate research in Warsaw: The results of microclimatic network measurements. Geogr. Pol. 2014, 87, 491–504. [Google Scholar] [CrossRef] [Green Version]
- Xinhuanet. Beijing to Add More Green Space in 2018. 2018. Available online: http://www.xinhuanet.com/english/2018-02/06/c_136953544.htm (accessed on 5 June 2019).
- Statistical Office of the Republic of Serbia. Statistical Yearbook of the Republic of Serbia. 2017. Available online: https://publikacije.stat.gov.rs/G2017/PdfE/G20172022.pdf (accessed on 12 September 2020).
- Beograd. Plan of General Regulation of the Green Space System of Belgrade (Draft Version). 2018. Available online: http://www.beograd.rs/cir/gradski-oglasi-konkursi-i-tenderi/1751510-javni-uvid-u-nacrt-plana-generalne-regulacije-sistema-zelenih-povrsina-beograda_2/ (accessed on 11 May 2019).
- Gobierno de la Ciudad de Buenos Aires. “Espacios Verdes” en Buenos Aires Data. 2019. Available online: https://data.buenosaires.gob.ar/dataset/espacios-verdes (accessed on 15 May 2019).
- Dirección General de Estadística y Censos. Distribución Especial, Composición y Crecimiento. 2018. Available online: https://www.estadisticaciudad.gob.ar/eyc/wp-content/uploads/2018/10/2017_05_buenosaires_en_numeros.pdf (accessed on 15 May 2019).
- Byomkesh, T.; Nakagoshi, N.; Dewan, A.M. Urbanization and green space dynamics in Greater Dhaka, Bangladesh. Landsc. Ecol. Eng. 2012, 8, 45–58. [Google Scholar] [CrossRef]
- Naidrenalin. Ten Green Spaces in Lagos You Should Know. 2019. Available online: https://naidrenalin.com.ng/2019/01/14/ten-green-spaces-lagos-know/ (accessed on 8 June 2019).
- National Conservation Foundation (NCF) Lekki Conservation Center (LCC): Treasure on the Peninsula, Proud Legacy of NCF. Available online: https://www.ncfnigeria.org/projects/lekki-conservation-centre (accessed on 8 June 2019).
- Statista. Anteil der Grünfläche deutscher Großstädte im Jahr 2016. 2016. Available online: https://de.statista.com/statistik/daten/studie/417098/umfrage/deutschlands-gruenste-staedte/ (accessed on 7 May 2019).
- Hamburg, Hamburg Green Capital 2011. Green Cities—Fit for Life. Available online: http://ec.europa.eu/environment/europeangreencapital/wp-content/uploads/2011/04/Hamburg-Leaflet-Final-Printed-EN-Sept-2011.pdf (accessed on 5 June 2019).
- Nath, T.K.; Han, S.S.Z.; Lechner, A.M. Urban green space and well-being in Kuala Lumpur, Malaysia. Urban Urban Green. 2018, 36, 34–41. [Google Scholar] [CrossRef]
- Times of Infos (TOI). Delhi’s Forest Cover Is up 0.3% since 2015 but Nothing to Cheer About. 2018. Available online: http://timesofindia.indiatimes.com/articleshow/62891909.cms?utm_source=contentofinterest&utm_medium=text&utm_campaign=cppst (accessed on 5 June 2019).
- Geletič, J.; Lehnert, M.; Savić, S.; Milošević, D. Inter-/intra-zonal seasonal variability of the surface urban heat island based on local climate zones in three central European cities. Build. Environ. 2019, 156, 21–32. [Google Scholar] [CrossRef]
- City of Novi Sad. Population Number by Settlements. 2019. Available online: https://www.nsinfo.co.rs/cyr/broj-stanovnika-po-naseljima (accessed on 2 July 2019).
- City of Sydney. Research and Statistics. 2019. Available online: https://www.cityofsydney.nsw.gov.au/learn/research-and-statistics/the-city-at-a-glance/greater-sydney (accessed on 4 June 2019).
- City of Warsaw. Land Use Within the City, Architecture and Spatial Planning Department of the Capital City of Warsaw. 2015. Available online: https://infrastruktura.um.warszawa.pl/sites/infrastruktura.um.warszawa.pl/files/indicator_3_warsaw_0.pdf (accessed on 5 June 2019).
- Wu, X.; Zhang, L.; Zang, S. Examining seasonal effect of urban heat island in a coastal city. PLoS ONE 2019, 14, e0217850. [Google Scholar] [CrossRef] [PubMed] [Green Version]
- Broto, V.C.; Bulkeley, H. A survey of urban climate change experiments in 100 cities. Glob. Environ. Chang. 2013, 23, 92–102. [Google Scholar] [CrossRef] [Green Version]
- Nowak, D.J.; Greenfield, E.J. Declining urban and community tree cover in the United States. Urban Urban Green. 2018, 32, 32–55. [Google Scholar] [CrossRef]
- Gill, S.E.; Handley, J.F.; Ennos, A.R.; Pauleit, S. Adapting Cities for Climate Change: The Role of the Green Infrastructure. Built Environ. 2007, 33, 115–133. [Google Scholar] [CrossRef] [Green Version]
- Middel, A.; Chhetri, N.; Quay, R. Urban forestry and cool roofs: Assessment of heat mitigation strategies in Phoenix residential neighborhoods. Urban Urban Green. 2015, 14, 178–186. [Google Scholar] [CrossRef]
- Zölch, T.; Maderspacher, J.; Wamsler, C.; Pauleit, S. Using green infrastructure for urban climate-proofing: An evaluation of heat mitigation measures at the micro-scale. Urban Urban Green. 2016, 20, 305–316. [Google Scholar] [CrossRef]
- Foster, J.; Lowe, A.; Winkelman, S. The Value of Green Infrastructure for Urban Climate Adaptation; The Center for Clean Air Policy: Washington, DC, USA, 2011; pp. 1–52. [Google Scholar]
- Oke, T.R.; Crowther, J.M.; McNaughton, K.G.; Monteith, J.L.; Gardiner, B. The micrometeorology of the urban forest. Philos. Trans. R. Soc. B Biol. Sci. 1989, 324, 335–349. [Google Scholar] [CrossRef]
- Matzarakis, A.; Mayer, H.; Iziomon, M. Applications of a universal thermal index: Physiological equivalent temperature. Int. J. Biometeorol. 1999, 43, 76–84. [Google Scholar] [CrossRef]
- Du, H.; Wang, D.; Wang, Y.; Zhao, X.; Qin, F.; Jiang, H.; Cai, Y.L. Influences of land cover types, meteorological conditions, anthropogenic heat and urban area on surface urban heat island in the Yangtze River Delta Urban Agglomeration. Sci. Total. Environ. 2016, 571, 461–470. [Google Scholar] [CrossRef] [PubMed]
- Bowler, D.E.; Buyung-Ali, L.; Knight, T.M.; Pullin, A.S. Urban greening to cool towns and cities: A systematic review of the empirical evidence. Landsc. Urban Plan. 2010, 97, 147–155. [Google Scholar] [CrossRef]
- Lee, H.; Mayer, H.; Chen, L. Contribution of trees and grasslands to the mitigation of human heat stress in a residential district of Freiburg, Southwest Germany. Landsc. Urban Plan. 2016, 148, 37–50. [Google Scholar] [CrossRef]
- Spronken-Smith, R.A.; Oke, T.R. Scale Modelling of Nocturnal Cooling in Urban Parks. Bound. Layer Meteorol. 1999, 93, 287–312. [Google Scholar] [CrossRef]
- Wang, Y.; Ni, Z.; Peng, Y.; Xia, B. Local variation of outdoor thermal comfort in different urban green spaces in Guangzhou, a subtropical city in South China. Urban Green. 2018, 32, 99–112. [Google Scholar] [CrossRef]
- Amani-Beni, M.; Zhang, B.; Xie, G.-D.; Xu, J. Impact of urban park’s tree, grass and waterbody on microclimate in hot summer days: A case study of Olympic Park in Beijing, China. Urban Urban Green. 2018, 32, 1–6. [Google Scholar] [CrossRef]
- Milošević, D.D.; Bajšanski, I.V.; Savić, S. Influence of changing trees locations on thermal comfort on street parking lot and footways. Urban For. Urban Green. 2017, 23, 113–124. [Google Scholar] [CrossRef]
- Park, K.; Kim, D.; Lee, M.; Choi, C. Analysis of micro-climate on the programs of urban infrastructure regeneration in J city, Republic of Korea. Urban Urban Green. 2017, 27, 43–49. [Google Scholar] [CrossRef]
- Jänicke, B.; Meier, F.; Hoelscher, M.-T.; Scherer, D. Evaluating the Effects of Façade Greening on Human Bioclimate in a Complex Urban Environment. Adv. Meteorol. 2015, 2015, 1–15. [Google Scholar] [CrossRef]
- Du, H.; Cai, W.; Xu, Y.; Wang, Z.; Wang, Y.; Cai, Y. Quantifying the cool island effects of urban green spaces using remote sensing Data. Urban Urban Green. 2017, 27, 24–31. [Google Scholar] [CrossRef]
- Lee, H.; Mayer, H. Maximum extent of human heat stress reduction on building areas due to urban greening. Urban Urban Green. 2018, 32, 154–167. [Google Scholar] [CrossRef]
- Jauregui, E. Influence of a large urban park on temperature and convective precipitation in a tropical city. Energy Build. 1990, 15, 457–463. [Google Scholar] [CrossRef]
- Kurban-López, A.K.; Cúnsulo, M.C. Confort térmico en espacios verdes urbanos de ambientes áridos. Hábitat Sustentable 2017, 7, 32–43. [Google Scholar]
- Upmanis, H.; Eliasson, I.; Lindqvist, S. The influence of green areas on nocturnal temperatures in a high latitude city (Göteborg, Sweden). Int. J. Clim. 1998, 18, 681–700. [Google Scholar] [CrossRef]
- Bottalico, F.; Travaglini, D.; Chirici, G.; Garfì, V.; Giannetti, F.; De Marco, A.; Fares, S.; Marchetti, M.; Nocentini, S.; Paoletti, E.; et al. A spatially—explicit method to assess the dry deposition of air pollution by urban forests in the city of Florence, Italy. Urban Urban Green. 2017, 27, 221–234. [Google Scholar] [CrossRef]
- Liang, J.; Fang, H.; Zhang, T.; Wang, X.; Liu, Y. Heavy metal in leaves of twelve plant species from seven different areas in Shanghai, China. Urban Urban Green. 2017, 27, 390–398. [Google Scholar] [CrossRef]
- Nowak, D.J.; Crane, D.E.; Stevens, J.C. Air pollution removal by urban trees and shrubs in the United States. Urban Urban Green. 2006, 4, 115–123. [Google Scholar] [CrossRef]
- Castro-Díaz, R. Spatial approach for modeling Tropospheric Ozone and its interaction with the infrared wave and temperature in Bogota, Colombia. Int. J. Res. Geogr. (IJRG) 2015, 1, 29–37. [Google Scholar]
- Hewitt, N.C.; Ashworth, K.; MacKenzie, A.R. Using green infrastructure to improve urban air quality (GI4AQ). AMBIO 2020, 49, 62–73. [Google Scholar] [CrossRef] [Green Version]
- Ambrey, C.; Shahni, T.J. Greenspace and wellbeing in Tehran: A relationship conditional on a neighbourhood’s crime rate? Urban Urban Green. 2017, 27, 155–161. [Google Scholar] [CrossRef]
- Estevo, C.A.; Nagy-Reis, M.B.; Silva, W.R. Urban parks can maintain minimal resilience for Neotropical bird communities. Urban Urban Green. 2017, 27, 84–89. [Google Scholar] [CrossRef]
- Säumel, I.; Weber, F.; Kowarik, I. Toward livable and healthy urban streets: Roadside vegetation provides ecosystem services where people live and move. Environ. Sci. Policy 2016, 62, 24–33. [Google Scholar] [CrossRef]
- Heaviside, C.; MacIntyre, H.; Vardoulakis, S. The Urban Heat Island: Implications for Health in a Changing Environment. Curr. Environ. Health Rep. 2017, 4, 296–305. [Google Scholar] [CrossRef] [PubMed]
- Natenzon, C.E. Mapa de Vulnerabilidad Social en la Ciudad Autónoma de Buenos Aires; City of Buenos Aires: Buenos Aires, Argentina, 2018; p. 122. [Google Scholar]


| City/Country | Literature Source: |
|---|---|
| Beijing/China | [100,101] |
| Belgrade/Serbia | [34] |
| Buenos Aires/Argentina | [102,103] |
| Dhaka/Bangladesh | [104,105] |
| Lagos/Nigerai | [106,107] |
| Hamburg/Germany | [108,109] |
| Kuala Lumpur/Malaysia | [77,110] |
| Montevideo/Uruguay | [111] |
| New Delhi/India | [112,113] |
| Novi Sad/Serbia | [114,115] |
| Rio de Janeiro/Brasil | [116,117] |
| Seoul/Korea | [117,118] |
| Sydney/Australia | [119,120] |
| Warsaw/Poland | [121] |
| City, Country, No of Inhabitants, Total Area | Koeppen-Geiger Classification | Examples of Areas Affected by the Urban Heat Islands Problem | Green Space (% of Total Area) | Examples of Available Green Resources | Data Source: |
|---|---|---|---|---|---|
| Beijing, China 21.7 m 16,808 km2 | Dwa | Dongcheng district | 46.2% | Jingshan Park | [122] |
| Belgrade city territory, Serbia,1.7 mio., 3234 km2 | Cfa | City Municipality Vračar, Vračarski plato | 1.8% | Karađorđev park, Svetosavski plato | [123,124] |
| Autonomous City of Buenos Aires, Argentina, 3.072 mio., 203 km2 | Cfa | Retiro, Recoleta, Villa Soldati, Villa Riachuelo and La Boca | 9.65% | Costanera Sur Ecological Reserve, Palermo Forest, Pres. Sarmiento Park, Indoamerican Park. | [125,126] |
| Dhaka, Bangladesh, 8.9 mio., 306 km2; Greater D. region 18 mio., 2161.17 km2 | Aw | Commercial district | 14.5% | Gulshan Lake Park | [127] |
| Lagos, Nigeria, 21 mio., 1.171 km2 | Aw | City Hall, Yaba, Ikeja, Mushin, Ejigbo | 5% | Tinubu Square Broad Street, Johnson Jakande (JJK) Park, Lekki Conservation Centre, Lakowe Lakes and Golf Resort | [79,128,129] |
| Hamburg, Germany, 1.7 mio., 755 km2 | Dfb | Hafen City, Hamburg Altona | 44.1% | City Parks, District parks, Nature Reserves, e.g., Heuckenlock | [130,131] |
| Kuala Lumpur, Malaysia 1.58 mio., 243 km2 | Af | Kuala Lumpur city | 30% | Bukit Nanas, Bukit Sungai Putih, Bukit Sungai Besi, Templer Park and Sir Gerald Templer | [132] |
| Montevideo Urban Area, 1 Mio, 231 km2; Metro-politan Area (AMM), Uruguay, 1.6 Mio., 1.641 km² | Cfa | Ciudad Vieja, Centro, Aguada, Cordón | >10% (Urban) 25–30% (AMM) | Batlle Park, Golf Park, Prado Park, Rivera Park, Rodó Park, Rambla Waterfront, Villa Biarritz | https://www.inumet.gub.uy/clima/estadisticas-climatologicas/tablas-estadisticas and http://sig.montevideo.gub.uy/ |
| New Delhi, India 21.7 mio., 42.7 km2 | Cwa | Central Delhi and northern area | 20.6% | Deer Park | [133] |
| Novi Sad, Serbia, 0.3 mio.,129 km2 | Cfb | Stari Grad, Grbavica and Nova Detelinara districts | 7.6% (5% downtown; 15% outskirts) | Kamenički Park, Futoški Park, Limanski Park, Dunavski Park | [134,135] |
| Rio de Janeiro, Brazil 6.32 mio., 1.255 km2 | Aw, bordering on Am | Northern Zone | 28,3% | Tijuca Forest, Flamengo Park | [116] |
| Seoul, Korea 9.8 mio., 605 km2 | Dwa | Commercial district | 27.8% | Seoul Park, Tapgol Park | Seoul Metropolitan Government (2016; http://english.seoul.go.kr/2016-may-special-issue-2/) |
| Greater Sydney, Australia 5.64 mio., 12,367 km2 | Cfa | Penrith area | 46% | Sydney Park, Sydney Olympic Park | [136] |
| Warsaw, Poland 1.73 mio, 516.9 km2 | Dfb | Central Śródmieście area | 44.2% | Łazienki Park | [137] |
Publisher’s Note: MDPI stays neutral with regard to jurisdictional claims in published maps and institutional affiliations. |
© 2021 by the authors. Licensee MDPI, Basel, Switzerland. This article is an open access article distributed under the terms and conditions of the Creative Commons Attribution (CC BY) license (http://creativecommons.org/licenses/by/4.0/).
Share and Cite
Leal Filho, W.; Wolf, F.; Castro-Díaz, R.; Li, C.; Ojeh, V.N.; Gutiérrez, N.; Nagy, G.J.; Savić, S.; Natenzon, C.E.; Quasem Al-Amin, A.; et al. Addressing the Urban Heat Islands Effect: A Cross-Country Assessment of the Role of Green Infrastructure. Sustainability 2021, 13, 753. https://doi.org/10.3390/su13020753
Leal Filho W, Wolf F, Castro-Díaz R, Li C, Ojeh VN, Gutiérrez N, Nagy GJ, Savić S, Natenzon CE, Quasem Al-Amin A, et al. Addressing the Urban Heat Islands Effect: A Cross-Country Assessment of the Role of Green Infrastructure. Sustainability. 2021; 13(2):753. https://doi.org/10.3390/su13020753
Chicago/Turabian StyleLeal Filho, Walter, Franziska Wolf, Ricardo Castro-Díaz, Chunlan Li, Vincent N. Ojeh, Nestor Gutiérrez, Gustavo J. Nagy, Stevan Savić, Claudia E. Natenzon, Abul Quasem Al-Amin, and et al. 2021. "Addressing the Urban Heat Islands Effect: A Cross-Country Assessment of the Role of Green Infrastructure" Sustainability 13, no. 2: 753. https://doi.org/10.3390/su13020753