Clean Development, Energy Substitution, and Carbon Emissions: Evidence from Clean Development Mechanism (CDM) Project Implementation in China

School of Economics and Management, Northwest University, Xi’an 710127, China
*
Author to whom correspondence should be addressed.
Sustainability 2021, 13(2), 860; https://doi.org/10.3390/su13020860
Submission received: 14 December 2020
/
Revised: 8 January 2021
/
Accepted: 13 January 2021
/
Published: 16 January 2021
(This article belongs to the Special Issue Energy and Environmental Policies)
Abstract
:In the face of increasingly severe climate change and its disastrous effects, how to effectively tackle it and reduce carbon dioxide emissions has become an important global issue. Clean development mechanism (CDM) project implementation provides an opportunity for more developing countries to actively participate in global climate governance. As the largest global emitter of carbon dioxide, have China’s CDM projects slowed down carbon dioxide emissions? In order to answer this question, the study constructs panel data at the provincial level from 2000 to 2017 to investigate the emission-reduction effects of China’s CDM projects. Results showed that China’s CDM projects’ implementation significantly reduced carbon dioxide emissions per unit of gross domestic product (GDP) and the growth rate of carbon dioxide emissions. The emission reduction effects of different types of CDM projects have obvious heterogeneity. In addition, this study further found that China’s CDM projects’ implementation can not only effectively substitute traditional fossil energy, but also improve energy-utilization efficiency.
1. Introduction
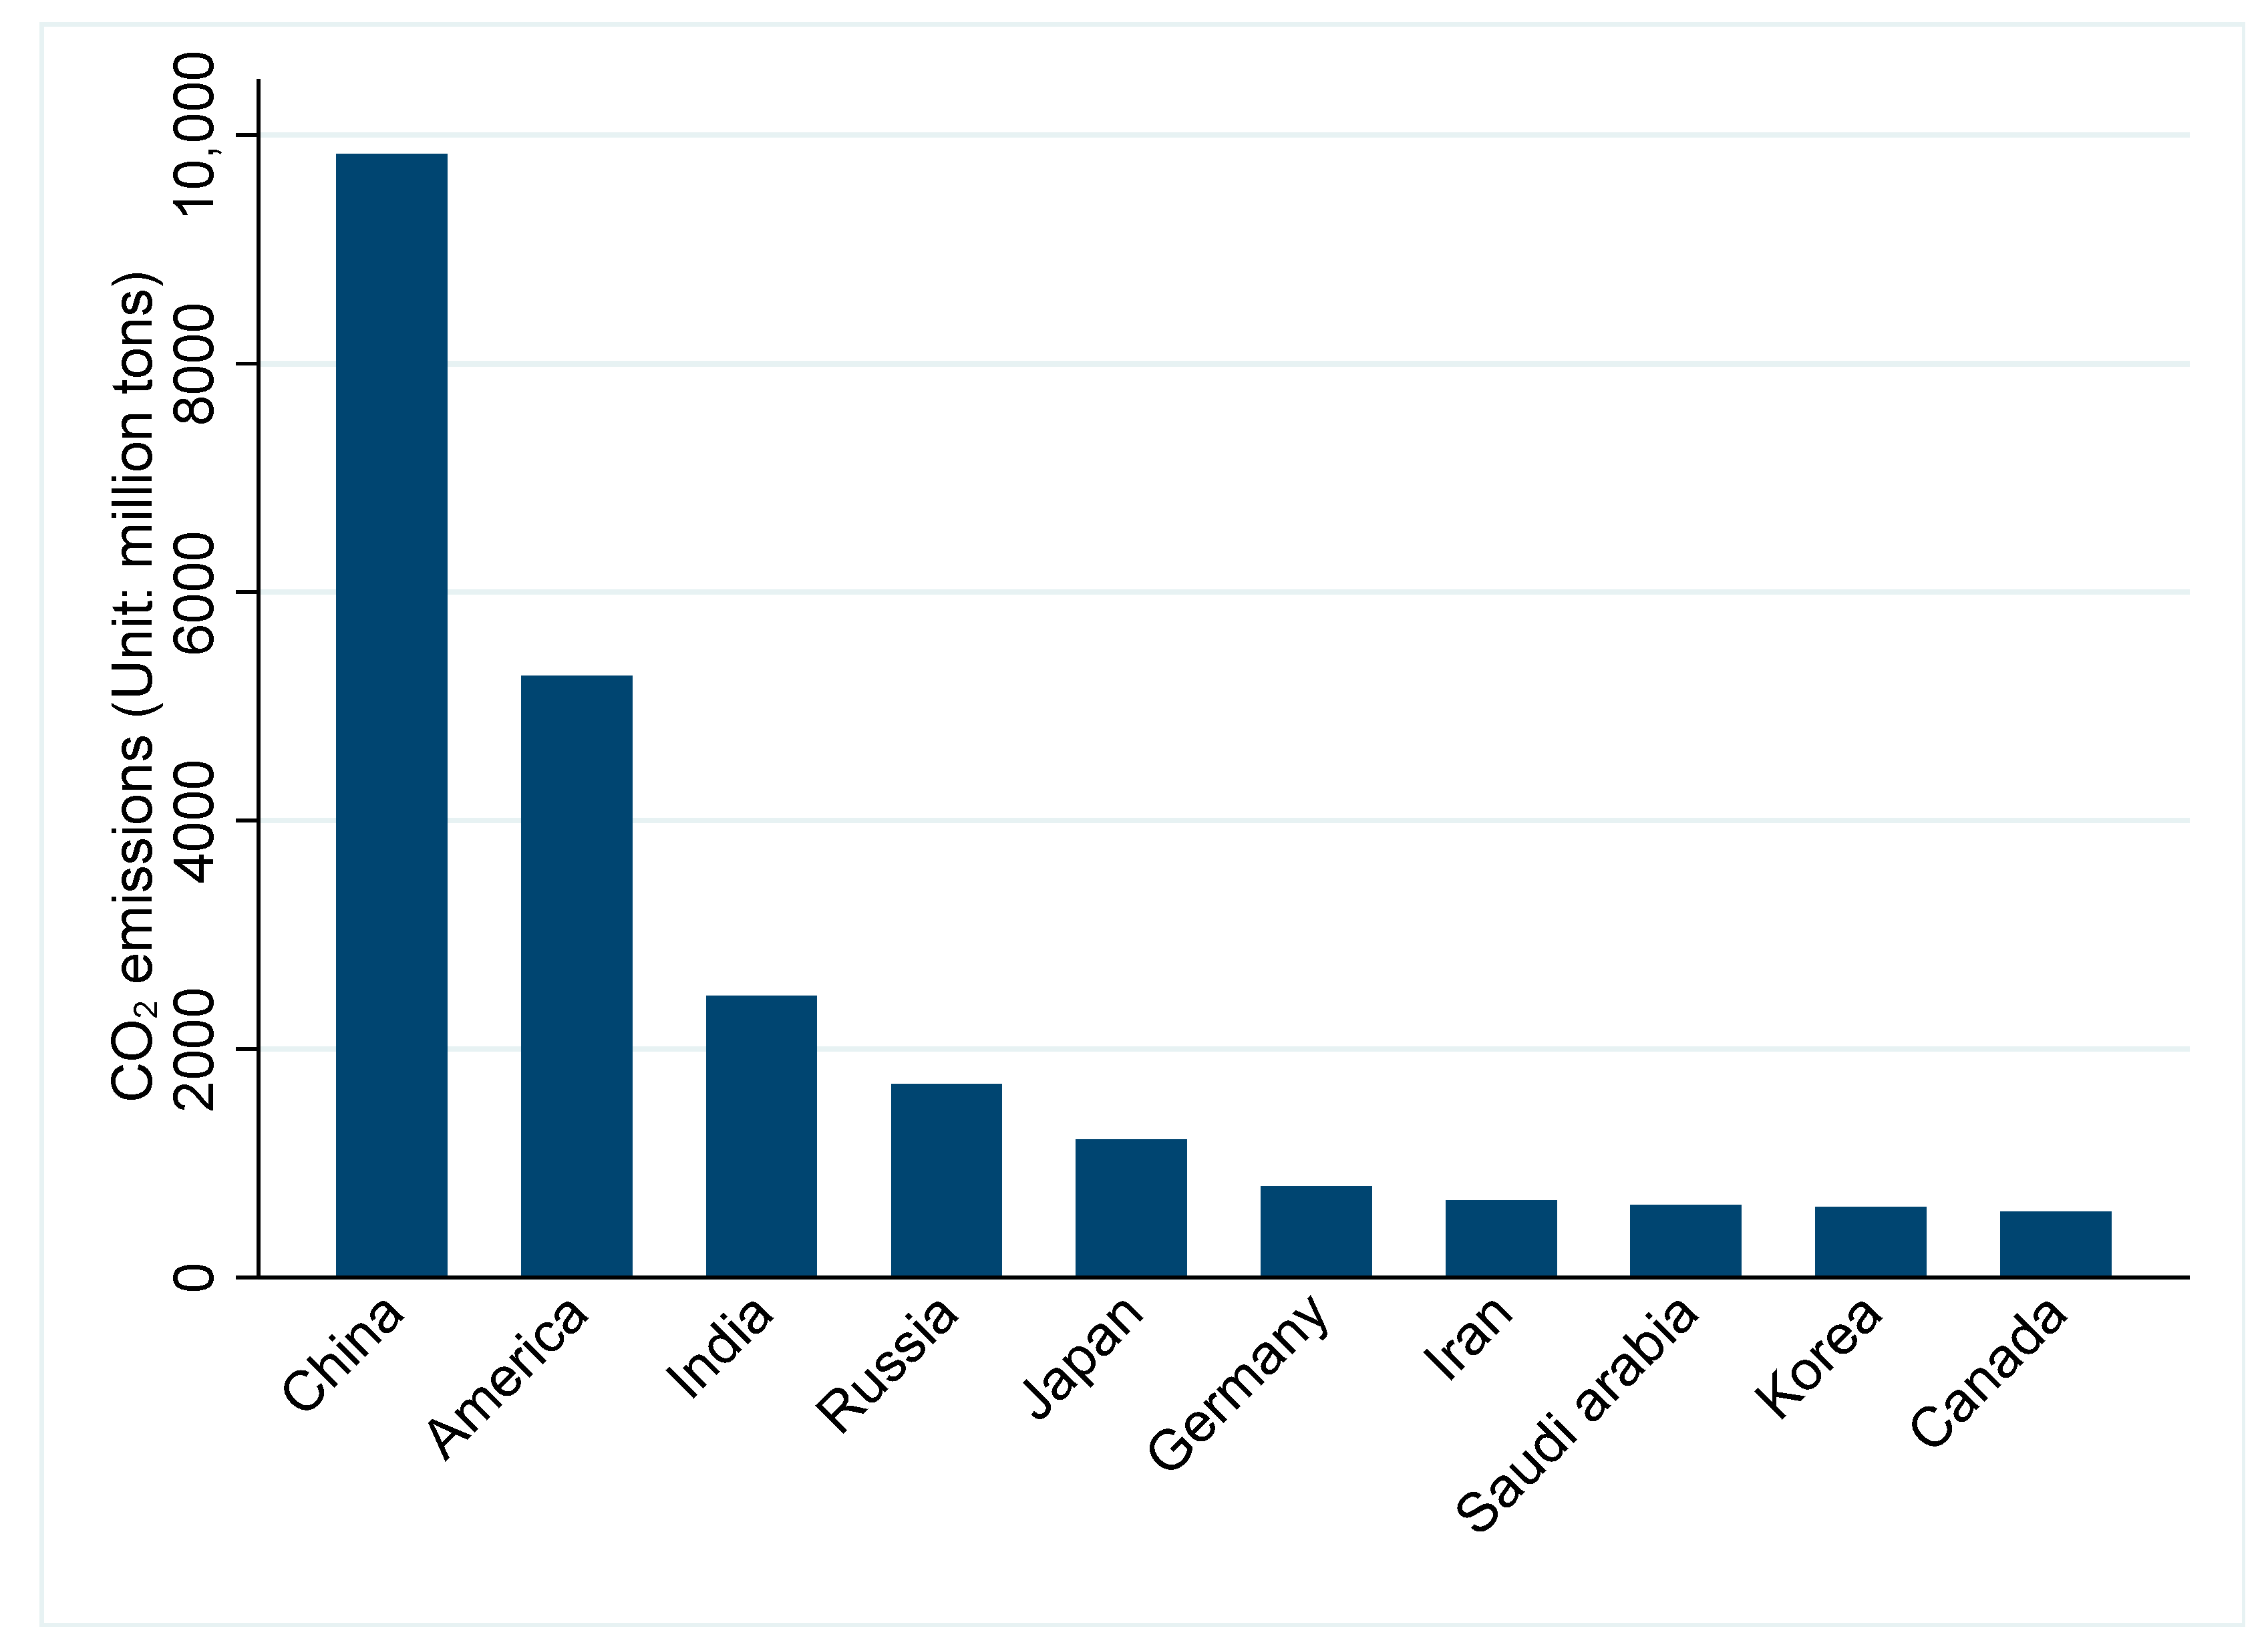
As one of the most pressing current issues, global warming is rapidly endangering human survival. It has not only caused serious loss of economic efficiency, but also brought about population migration and the loss of social welfare. With ongoing human activities, this problem is becoming increasingly serious. It is estimated that, by the end of the 21st century, global surface temperature will be 0.3 to 4.8 °C higher than that at the beginning of this century [1]. In the face of this serious climate change, how to tackle it is a common global issue. Scholars almost unanimously agree that reducing greenhouse-gas emissions is the only way, and the top priority is to reduce carbon dioxide emissions, because they are the main cause of global warming. Unfortunately, global carbon dioxide emissions are persistently rising. According to data collected by the Carbon Dioxide Information and Analysis Center (CDIAC), in 2015, the top 10 countries and regions accounted for 69.80% of the world’s total carbon dioxide emissions, most of which were developed countries. Among them, as the largest developing country, China’s carbon dioxide emissions were 10,641,889 kilotons, accounting for 30.48% (Figure 1).
China’s huge carbon emission levels have become the focus of global attention. The successful reduction in China’s carbon emissions would greatly contribute to global environmental governance. Therefore, it is important to analyze China’s carbon emissions. Figure 2 shows carbon dioxide emissions from 1960 to 2017 in China. Their growth was divided into three stages: a slow growth stage from 1960 to 1980, a rapid growth stage from 1981 to 2010, and a balanced growth stage since 2010.
According to the Kaya Identity, global warming is affected by economic growth and carbon emission intensity [2]. Some researchers believe that high emissions derive from rapid economic growth and the use of fossil fuels [3]. Combined with the actual conditions of China’s economic development, the reason why China produces so much carbon dioxide emissions is that since the reform and opening up in 1978, the rapid outward development of China’s economy has mainly depended on the high input and consumption of land, labor, capital, and other resources, especially fossil energy. Therefore, before 1980, the growth of carbon emissions was slow, but with the consumption of huge fossil fuels resulting from the rapid development of China’s economy, growth later rose sharply. However, as the Chinese government gradually realized the seriousness of environmental problems and attempted a series of environmental governance measures, China’s carbon emissions were effectively slowed down after 2000. Unfortunately, they are still at a high level.
It is difficult to rely on the Chinese government alone to reduce carbon emissions. The international community’s climatic assistance to China is an effective way to rapidly achieve dramatic reduction. For example, the Kyoto Protocol, which came into force in 2005, proposed the clean development mechanism (CDM). As a flexible implementation mechanism, the CDM allows for developed countries to meet greenhouse-gas emission targets set under the Kyoto Protocol by helping developing countries to implement projects reducing or absorbing greenhouse gases. According to statistics on the official website of the United Nations Framework Convention on Climate Change (UNFCCC), since CDM project implementation, it was estimated that by 2020, all CDM projects would have certified emission reductions of 7.767 billion tons, a tremendous contribution to emission reduction. As the largest developing country, China is the focus to fulfill targets of the Kyoto Protocol, and a major country to implement CDM projects. According to the statistics of number of CDM project implementation, China’s CDM projects account for half of the total number of projects.
As international assistance provided by the international community led by developed countries, CDM projects aim to reduce carbon emissions. Our focus is whether they have achieved the expected reduction target. If so, what is the internal mechanism of emission reductions? In order to answer the above questions, this study investigates the impact of China’s CDM projects on carbon emission reduction and its internal mechanism. Results showed that CDM project implementation significantly lowered the rate of carbon dioxide emissions, reduced the emission of carbon dioxide per unit of gross domestic product (GDP), and improved the efficiency of the green economy. Noncooperative CDM and new-energy projects have greater emission-reduction effects. The mechanism test found that carbon reductions are achieved by substituting traditional fossil-energy consumption. The conclusions of this study provide theoretical support and practical experience for developing countries to actively participate in global climate governance, and they are also conducive to the development of international CDM projects.
2. Literature Review
The academic community has agreed on the cause of carbon dioxide emissions. Some researchers believe that high carbon emissions caused by energy consumption derive from rapid economic growth and the use of fossil fuels [3]. According to the Intergovernmental Panel on Climate Change (IPCC), about 65% of carbon dioxide emissions from human activities are attributed to the use of fossil fuels since 1750 [4]. More than 90% of energy-related carbon dioxide emissions are generated from the burning of fossil fuels, which account for more than 80% of total primary energy demand [5]. In its Environmental Outlook Report for 2050, the Organization for Economic Co-operation and Development (OECD) predicted that global greenhouse-gas emissions would increase by 50% by 2050, 70% of which would come from energy consumption, and especially fossil-energy consumption [6]. Mensah et al. studied the causal relationship between fossil-energy consumption and carbon emissions in 22 African countries from 1990 to 2015 and found that fossil-energy consumption produced huge carbon emissions [7].
Many studies showed that traditional fossil-energy consumption is the main reason for the rapid increase in carbon dioxide emissions. Therefore, an effective measure for reducing emissions is to decrease the proportion of fossil energy in energy consumption, promote clean development and energy substitution, and improve energy-utilization efficiency [8]. Moreover, many scholars studied the feasibility and effectiveness of clean development and energy substitution for carbon emission reduction and agreed that non-fossil energy can substitute fossil energy [9,10,11], and energy substitution and the development of clean energy are conducive to reducing carbon emissions [12,13,14].
The clean development mechanism (CDM) is a mechanism for Annex A countries in the United Nations Framework Convention on Climate Change (UNFCCC) to fulfill some of their emission-reduction commitments overseas. CDM projects provide vast environmental benefits to developing countries and can make consumption and production patterns more environmentally friendly. Developed countries can also meet their emission-reduction standards at a lower cost. Many scholars have discussed and studied the role of the CDM, which can create opportunities for large-scale renewable-energy projects [15,16] and is critical for the deployment of renewable-energy industries in many countries [17,18,19]. CDM project implementation promotes the development of energy technologies and enables more countries to widely use energy technologies and clean energy [20,21].
Moreover, many scholars have studied the emission-reduction effect of the CDM. Lim and Lam analyzed the status of CDM projects in Malaysia and concluded that CDM projects in the energy sector contributed to greenhouse-gas emission reduction [22]. Lewis found that the CDM promoted the development of China’s renewable energy and greatly reduced greenhouse-gas emissions [23]. Stua found that the CDM promoted the transformation of China’s power system [24]. Bayer, Urpelainen, and Wallace found that China’s CDM projects could both reduce greenhouse gas emissions in provinces with low-cost emission reduction and promote sustainable development in areas overly dependent on coal; therefore, China could continuously benefit from the CDM and promote the development of China’s underdeveloped and remote regions through it [25].
However, some scholars also question the emission-reduction effect of the CDM, which includes the following two aspects: first, its emission-reduction effect is uncertain. Strand and Rosendahl said that the CDM is likely to reduce the emissions of a single project, while it is likely to generally reduce other emission-reduction measures in the host countries [26]. Costa-Junior, Pasini, and Andrade studied 75 CDM projects in Brazil before December 31, 2007, and found that CDM projects could not effectively promote clean development in a market-oriented way [27]. Schneider systematically investigated 93 CDM projects and found that they failed to effectively achieve emission-reduction goals. Second, its additionality was questioned [28]. Due to difficulties in the project’s identification, some CDM projects without additionality may increase carbon emissions [29]. Alexeew found that most wind-energy and hydropower projects are less likely to have additionality [30]. On the basis of China’s prefecture-level cities, Zhang and Wang indirectly assessed CDM additionality, and empirical results were inconsistent with the model prediction; thus, they raised doubts about the additionality of the CDM [31].
Therefore, two points can be drawn from the above literature review: first, most studies mainly analyzed the overall emission-reduction effect of CDM projects in a country or region while ignoring the differential reduction effects of type of CDM projects. Second, almost no studies explored the internal mechanism, which is the core of understanding the reduction effect of CDM projects. In view of this, on the basis of China’s CDM project implementation, this study investigates its reduction effects and internal mechanism in detail. Its contributions are as follows: first, we investigate the emission-reduction effect of China’s CDM project implementation, strongly supporting the view that CDM projects can effectively achieve carbon reduction. Second, on the basis of the overall effect assessment, we studied the differential emission-reduction effects of different types of CDM projects in detail, especially the nine specific types of CDM projects, making up for the shortcomings of existing research. Third, we explored in detail the internal mechanism of achieving an emission-reduction effect, and the results showed that carbon reductions are achieved not only by substituting traditional fossil-energy consumption, but also by improving energy-utilization efficiency, which expands previous studies on internal mechanism. This study is a supplement to existing studies and a new interpretation of CDM project implementation.
3. Development of CDM Projects in China
With the Kyoto Protocol taking effect in 2005, China’s CDM projects began to develop. According to CDM project operation-management measures issued by China, development should focus on areas such as new and renewable energy, energy conservation and efficiency improvement, and the recycling and utilization of coal-bed methane. Figure 3 shows the line graphs of the trends of CDM projects in China and the rest of the world (solid line, China’s trend; dotted line, global trend). After the world’s first registered CDM projects in 2004, the number of China’s new registered CDM projects has basically maintained the same trend with that of the rest of the world: the boom period of China’s CDM projects was from 2007 to 2012; especially in 2012, the number of China’s new registered CDM projects was 1819, accounting for more than 56% of the global total, which was 3233, from which we can see China’s dominance in the CDM market. However, after the Kyoto Protocol expired in 2012, CDM project implementation, both globally and in China, significantly slowed down, and the number of new registered CDM projects dramatically decreased. In 2012, the Executive Council of the United Nations CDM Projects implemented a strict policy on the CDM projects, which increased the difficulty of project registration, caused the review process to be more complicated, and its direct result is a sudden drop in the numbers of CDM project in China and elsewhere. This drop directly led to the uncertainty of the CDM projects’ implementation after 2012, making the investment more cautious (Cui et al., 2020; Maraseni, 2013) [32,33]. At the same time, as the largest implementer of CDM projects, the EU drastically cut the carbon quotas of CDM used in the emissions trading system from 2012 to 2020, which further led to a reduction in the number of projects (Koch et al., 2014) [34]).
According to the contents of the projects, China’s top three CDM projects were new and renewable energy, energy conservation and efficiency improvement, and methane recycling and utilization. Among the 1553 issued CDM projects, 1264 were new and renewable energy projects, accounting for 81%, and the others 19%. New and renewable energy projects were mainly concentrated in the energy industry, and especially the power industry, including wind-, hydro-, and new-energy power generation. In addition, the spatial distribution of China’s CDM projects was not consistent with the economic development level, and most were in central and western provinces.
4. Research Design
4.1. Model Building
This study mainly evaluates the impact of China’s CDM projects’ implementation on carbon emissions. Therefore, model (1) is set as follows:
where represents the provincial carbon dioxide emissions, and the regional growth rate of carbon dioxide emissions and the carbon dioxide emissions per unit of GDP are used to measure it. indicates the number of CDM projects’ implementation of province i in year t; is the selected series of control; and represent the city fixed effect and the year fixed effect, respectively; is a disturbance, and is under the basic assumption of econometric model, namely independent identical distribution. is the focus of our concern, and it measures the net effect of CDM projects’ implementation on carbon emissions.
Moreover, we think different projects types and ways of cooperation should have different impacts on carbon emissions. In order to empirically test this, model (1) is expanded to model (2), and model (2) is set as follows:
where indicates the number of the different types of CDM projects, mainly including the number of cooperative and non-cooperative of CDM projects, as well as the nine specific types of CDM projects. is used to measure the impact of different types of CDM projects on provincial carbon dioxide emissions. If , it shows that different types of CDM projects can reduce carbon emissions, otherwise, they cannot.
4.2. Index Selection
Explained variable. In this study, the explained variable is regional carbon dioxide emissions. The growth rates of carbon dioxide and carbon dioxide emissions per unit of GDP were used to measure regional carbon dioxide emissions. The smaller the indices are, the less carbon dioxide a city emits. Total regional carbon dioxide emissions were not selected, mainly because the CDM is more about reducing fossil-energy inputs and improving energy efficiency (Pechak et al., 2011, [35]; Nautiyal and Varun, 2012, [36]; Kim and Park, 2018, [13]), and it is more reasonable to select indicators from the perspective of efficiency.
Due to a lack of data of carbon emissions from the government, this study uses an indirect measurement method to estimate carbon emissions after referring to many studies. Carbon dioxide emissions were calculated according to the following formula:
where Energy consumption indicates the consumption amounts of various energies, mainly including coal, oil, and gas. Emission coefficient represents the sensitivity coefficient of carbon emissions of different types of energies, and it is the average values calculated mainly according to the carbon emission coefficients published by United States Department of Energy, the Japan Institute of Energy Economics, the Climate Change Projects of National Science and Technology Commission, and the Energy Research Institute of National Development and Reform Commission. The United States Department of Energy published the carbon emission coefficients of coal, oil, and natural gas as: 0.7020, 0.4780, 0.3890; the Japan Institute of Energy Economics published the carbon emission coefficients of coal, oil, and natural gas as: 0.7560, 0.5860, 0.4490; the Climate Change Projects of National Science and Technology Commission published the carbon emission coefficients of coal, oil, and natural gas as: 0.7260, 0.5830, 0.4090; the Energy Research Institute of National Development and Reform Commission published the carbon emission coefficients of coal, oil, and natural gas as: 0.7476, 0.5825, 0.4435. We averaged the coefficients published by the above four organizations, and the carbon emission coefficients of coal, oil, and natural gas are as follows: 0.7329, 0.5574, 0.4226. Therefore, the specific calculation formula was as follows:
In addition, in mechanism analysis, in order to investigate the substitution effect of CDM projects on fossil-energy consumption, we selected the total consumption of gas, oil, and coal to measure regional energy consumption.
Explanatory variable. This study investigates the impact of CDM project implementation on carbon dioxide emissions, so CDM project implementation was the explanatory variable. We selected the total number of China’s CDM projects and the numbers of cooperative and non-cooperative projects.
Control variables. In order to better control the impact of other relevant factors on carbon emissions, in this study, we selected the proportion of total output value of different industries in GDP to measure the level of development of regional industry, the proportion of fixed-asset investment in GDP to illustrate the overall regional investment level, the proportion of foreign direct investment (FDI) in GDP to measure the inflow of regional foreign investment, the proportion of total imports and exports in GDP to explain the degree of opening to the outside world, and the proportion of gross regional industrial output value in GDP to measure industrial development level. The above economic variables are all adjusted in price based on 2000, and the exchange rate of FDI is converted. The selection of specific variables and descriptive statistical analyses are shown in Table 1.
4.3. Data Sources
In order to comprehensively analyze the impact of CDM project implementation on carbon dioxide emissions, we collected data from various sources. Specific data sources were as follows: first, the basic information of CDM projects was from the website of the China clean development mechanism (CCDM); then, we manually collated the implementation regions and matched the samples, thus sorting out the specific information of all CDM projects in China from 2000 to 2017. Second, the focus of this study was to explain changes in China’s carbon emissions, while its calculation mainly depended on energy consumption. Therefore, we searched for and sorted the total consumption amount of gas, oil, and coal in the China Environmental Statistical Yearbook. Lastly, data of the control variables were from the China Statistical Yearbook. In addition, since the CCDM website has not released the latest progress of CDM projects since 2013, we searched the UNFCCC website and manually collated the latest data from 2014 to 2019. However, since the China Energy Statistical Yearbook only reports provincial energy-consumption data before 2017, we could only calculate the data of carbon emissions before 2017, which also limited the period of this study to 2000–2017.
5. Main Results
5.1. Impact of CDM Projects on Carbon Emissions
Model (1) was estimated to analyze the impact of the implementation of CDM projects on carbon emissions. Results are shown in Table 2, where Columns (1) and (3) are the regression results without adding control variables, and Columns (2) and (4) are the results with the control variables. After adding the control variables, regression results did not substantially change. The coefficient was significantly negative at the 10% confidence level, which indicated that the implementation of CDM projects had a positive impact on reducing carbon emissions and slowing down the growth of regional carbon dioxide emissions. From the perspective of whether to implement CDM projects, compared with provinces without CDM projects, their implementation reduced carbon emissions per unit of GDP by 36.3% and the growth rate of carbon emissions by 7.9% at the 5% confidence level.
From the perspective of control variables, total output value of different industries used to measure economic growth, especially the total output value growth of the secondary industry, significantly increased regional carbon dioxide emissions. This may be due to the rapid development of industry and construction, which are the main industries of the secondary industry. In addition, it is found that although regional direct investment and FDI cannot effectively reduce carbon dioxide emissions per unit of GDP, they can achieve a significant decrease in the growth rate of carbon dioxide emissions. Unlike previous studies, Open had no significant impact on carbon emissions.
In order to further investigate the above conclusion, according to the expected emission-reduction amount before the projects’ implementation, we constructed the expected emission-reduction intensity. The specific results are shown in Table 3. In the table, CDM project_total emission represents the total expected emission-reduction amount of all CDM projects, and CDM project_average emission represents the average expected emission-reduction amount—both were used to measure the implementation intensity of CDM projects. The specific regression results showed that the implementation intensity of CDM projects has a significant inhibitory effect on carbon dioxide emissions, especially in reducing their growth rate. Specifically, they reduced the growth rate by 2.5% and 3.4%, respectively, at the 1% confidence level.
Moreover, we investigated the long-term impact of CDM project implementation on carbon emissions. Regression results in Table 4 show that, since 2009, results without and with control variables demonstrated that CDM project implementation could reduce the intensity of carbon emissions and slow down the growth of regional carbon dioxide emissions. Regression results gradually changed with time, from not significant to significant impact. The absolute value of the regression coefficient gradually increased with time, indicating that the impact was also gradually stronger. It may be due to the lag of the impact that the effect of the carbon emission reduction in CDM projects can be clearly observed after a certain period. To sum up, the implementation of CDM projects can have a sustained impact on reducing carbon emissions and slowing down the growth of carbon dioxide emissions over time, which shows that it can have a long-term impact on regional carbon dioxide emission reduction.
Figure 4 and Figure 5 show the long-term dynamic effect of CDM project implementation on emission reduction according to the results of Columns (2) and (4) in Table 4. Whether the explained variables were measured by carbon dioxide emissions per unit of GDP or the growth rate of carbon dioxide emissions, the emission-reduction effects were not significant in the first five years, but after 2011, they gradually became significant, and this effect became more obvious with time. From this perspective, CDM project implementation has a long-term dynamic impact on carbon emissions.
5.2. Impact of CDM Projects with Different Cooperation Modes on Carbon Emissions
The above analysis fully proves that CDM project implementation has a positive impact on reducing carbon emissions and slowing down the growth of regional carbon dioxide emissions. In order to investigate the impact of CDM projects with different cooperation modes on carbon emissions according to whether they had foreign partners, we divided CDM projects into cooperative and non-cooperative projects. The specific regression results are shown in Table 5. Both cooperative and non-cooperative projects significantly reduced carbon dioxide emissions per unit of GDP. However, from the perspective of a specific coefficient, non-cooperative projects have a greater effect than that of cooperative ones. Specifically, non-cooperative projects reduced carbon emissions per unit of GDP by 3.8% at the 5% confidence level. The above results showed that the emission-reduction effects of CDM projects with different cooperation modes are different. In order to analyze the reason for this difference, we further investigated the implementation of CDM projects, found that the expected average annual emission reduction of cooperative projects is 1.58 million tons, and that of non-cooperative ones is 3.32 million tons, so we believe the difference in the expected average annual emission reduction of projects may be the main reason for the difference in the emission-reduction effects of them.
5.3. Impact of Different Types of CDM Projects on Carbon Emissions
CDM projects are generally divided into the nine following types: energy-saving and efficiency improvement, new and renewable energy sources, fuel substitution, methane recovery, N2O decomposition and elimination, HFC-23 decomposition, waste burning power generation, afforestation and reforestation, and others. In this study, we investigated the emission-reduction effects of these nine types, and the specific regression results are shown in Table 6.
Results showed that among the nine types, only implementation of new and renewable energy sources projects and methane recovery ones could reduce carbon emissions, and the other seven types could not significantly reduce the carbon emissions. From the specific effect, the implementation of methane recovery projects can reduce carbon emissions per unit of GDP by 14% at the 1% confidence level, while the implementation of new and renewable energy sources ones only can reduce it by 2% per unit of GDP at the 10% confidence level. In order to analyze the reason of this difference, we further investigated the implementation of CDM projects and found that the main types of projects’ implementation are new and renewable energy sources, energy-saving and efficiency improvement, and methane recovery. In addition, the expected average annual emission reduction of methane recovery projects is 2.76 million tons, that of new and renewable energy sources ones is 1.95 million tons, and that of energy-saving and efficiency improvement ones is 0.59 million tons. The above shows that the difference in the expected average annual emission reduction of projects may be the main reason for the difference in the emission-reduction effects of them.
6. Discussion
As a response to climate change, CDM projects have been widely implemented in various areas of China. On this basis, the above sections analyzed the impact of CDM projects on carbon emissions and proved that its implementation has a positive and sustained impact on reducing carbon emissions and slowing down the growth of regional carbon dioxide emissions, finding the different kinds of impact of different types of CDM projects. In order to further analyze this issue, we explore its internal mechanism here from the perspective of energy substitution. Specifically, we summarize the trend of China’s fossil-energy consumption over the years, and further discuss the impact of CDM project implementation on China’s energy substitution to investigate the carbon emission-reduction effect of China’s CDM projects.
6.1. Fossil-Energy Consumption and Carbon Emissions in China
Figure 6 shows the trend of China’s fossil-energy fuel source consumption from 2000 to 2019. Since 2000, all three sources (coal, oil, and gas) have been in a growing trend. Although total coal consumption has shown a downward trend after 2013, it is still China’s main energy-consumption source. China’s consumption structure of fossil energy is dominated by coal, followed by oil, and the lowest proportion is gas consumption. According to the calculations of relevant data from the National Bureau of Statistics of China, China’s major fossil-energy consumption accounted for 87.9% of China’s total energy consumption, 23.43% of the world’s fossil energy consumption, and 20.16% of the world’s total energy consumption. The above analysis shows that China’s consumption of the three major fossil-energy sources accounts for a large proportion of China’s and the world’s energy consumption.
The most direct consequence of the high consumption of China’s three major fossil-energy sources is the huge carbon emissions. Figure 7 shows the trend of carbon emissions caused by the different energy-consumption levels from 2006 to 2017, which show that carbon emissions had a rising trend, and their main origin was the consumption of the three major fossil-energy sources. Specifically, carbon emissions caused by consumption of the three major fossil-energy sources, accounting for 99% of the total carbon emissions in China; among them, coal accounts for the largest proportion, more than 80%. Energy CDM projects can directly promote the use of clean energy, thereby reducing the consumption demand of the three major fossil-energy sources. China has implemented a large number of energy CDM projects, accounting for 81% of the total. On the above basis, from the perspective of energy substitution, the carbon emission reduction effect of China’s CDM projects may be achieved by increasing the use of clean energy and reducing the use of fossil energy.
6.2. Impact of CDM Projects on Energy Substitution
In order to prove the above view on the impact mechanism, that is, China’s CDM projects achieving carbon emission reduction by increasing the use of clean energy and reducing the use of fossil energy, we empirically tested the substitution effect of CDM projects on fossil-fuel consumption. Specifically, we used the logarithm of the total consumption of natural gas, crude oil, and coal, and their growth rates as proxy variables of fossil-energy consumption and conducted regression analysis. Specific results are shown in Table 7.
First, regression results showed that the implementation of CDM projects does not reduce coal consumption, which was not in line with our expectations. The possible reason is that, in the background of China’s fossil-energy consumption structure dominated by coal consumption, more than 60% of coal consumption is mainly used for coal-fired power generation to meet the needs of economic development, which is a rigid demand, so the implementation of CDM projects cannot reduce the carbon dioxide emissions in the short term. Fortunately, the implementation of CDM projects has a positive impact on slowing down the growth rate of coal consumption at the 1% confidence level.
Second, the implementation of CDM projects has significantly reduced growth rate of crude-oil consumption at the 1% confidence level. New and renewable energy CDM projects, accounting for up to 81% of China’s total CDM projects, have promoted the rapid transformation of China’s new energy technology and the development of the new energy industry, which greatly reduced China’s transportation industry’s demand for crude-oil consumption. Similarly, the study also showed that the overall energy efficiency of China’s transportation industry increased by an average of 7.08% from 2008 to 2017, with the eastern region having the largest increase of 28.99% [37].
Third, the implementation of CDM projects significantly reduced the growth rate of natural-gas consumption at the 1% confidence level, which was in line with our expectations. However, it had no significant impact on consumption, which may be related to the promotion of clean heating projects such as “coal to gas” and the relatively low proportion of gas consumption in China’s fossil-energy consumption.
The above analysis fully proves that the implementation of CDM projects can substitute crude-oil consumption to a certain extent, and gradually slow down the growth of coal and gas consumption. However, it is still difficult to change the energy-consumption structure dominated by coal consumption in China in a short amount of time.
Considering that carbon dioxide emissions are caused by the extensive use of fossil energy on the one hand, and low energy efficiency on the other hand, we further analyzed the impact of CDM project implementation on the use efficiency of fossil energy, which is measured by the consumption amounts of various types of energy per unit of GDP. Specific regression results are shown in Table 8, where Columns (1) and (2) mainly show coal utilization efficiency, Columns (3) and (4) display crude-oil utilization efficiency, and Column (5) shows natural-gas utilization efficiency. For the three kinds of traditional fossil energy, the implementation of CDM projects significantly reduced the energy consumption amount per unit of GDP, that is, implementation is conducive to the improvement in energy efficiency. This is another internal mechanism to achieve carbon emission reduction.
7. Conclusions
Global warming has seriously hindered the sustainable development of the global economy and human society, and controlling and reducing carbon dioxide emissions are the main measures to tackle this problem. This study discussed the impact of clean development on carbon emissions through China’s CDM projects. China’s CDM projects can help to continuously reduce carbon emissions and slow down their growth rate. This conclusion is consistent with most existing studies on the emission-reduction effects of CDM projects (Lim and Lam, 2014, [22]; Stua, 2013, [24]; Bayer et al., 2013, [25]). In order to further investigate the impact of clean development on carbon emissions, we divided CDM projects into cooperative and noncooperative. The impact of cooperative projects on carbon emissions is more significant than that of noncooperative ones. In addition, from the emission-reduction effects of specific CDM projects, the effects of new and renewable energy sources and methane recovery projects are the most obvious. Mechanism exploration showed that CDM project implementation can substitute crude-oil consumption, thus gradually slowing down the growth of coal and gas consumption (Jin & Li, 2018, [13]; Zhao et al., 2014, [16]; Lewis, 2010, [23]); at the same time, it can also improve the use efficiency of fossil energy to achieve carbon emission reduction.
Policy recommendations are as follows: first, due to the long-term impact of CDM projects on carbon emissions, as CDM project builders, developing countries should continuously promote the development of CDM projects and expand the scope of its implementation. Second, since there are differences in the emission-reduction effects of different types of CDM projects, and the projects with the most obvious emission-reduction effects are new and renewable energy sources and methane recovery projects, the investment in these two types of projects can be appropriately increased in the future. Of course, considering the impact of implementation strength, the projects with strong carbon emission reduction should be implemented in the future. Third, since carbon emission-reduction effects of CDM projects are achieved by substituting traditional fossil energy and by improving energy efficiency, the government should vigorously develop renewable energy, gradually reducing the consumption of fossil energy to further promote the emission-reduction effects.
Author Contributions
Data curation: L.W.; formal analysis: B.S.; project administration: R.K.; visualization: R.K.; writing–original draft: L.W.; writing–review and editing: B.S. All authors have read and agreed to the published version of the manuscript.
Funding
This research was funded by the Incubation Program on The National Social Science Fund in 2020 of Northwest University of China (No. 20XNZX004), Shaanxi Provincial Department of Education 2020 General Special Scientific Research Project (No. 20JK0367), China-Central Eastern European Countries Higher Joint Education Project (No. 202028) Shaanxi Provincial Social Scientific Circles 2020 Major Theoretical and Practical Research Project(No. 2020Z287), Shaanxi Financial Assets 2021 Major Research Project (No. 20JZ-41).
Institutional Review Board Statement
Not applicable.
Informed Consent Statement
Not applicable.
Data Availability Statement
Publicly available datasets were analyzed in this study. This data can be found here: http://www.stats.gov.cn/; https://cdm.unfccc.int/.
Conflicts of Interest
The authors declare no conflict of interest.
References
- IPCC. Climate Change 2014: Impacts, Adaptation and Vulnerability. Contribution of Working Group II to the Fifth Assessment Report of the Intergovernmental Panel on Climate Change; Cambridge University Press: Cambridge, UK, 2014. [Google Scholar]
- Kaya, Y.; Yokobori, K. Environment, Energy, and Economy: Strategies for Sustainability; United Nations University Press: Tokyo, Japan, 1997. [Google Scholar]
- Andreoni, V.; Galmarini, S. Drivers in CO2 emissions variation: A decomposition analysis for 33 world countries. Energy 2016, 103, 27–37. [Google Scholar] [CrossRef]
- Solomon, S.D.; Qin, D.W.; Manning, M.; Chen, Z.N.; Marquis, M.; Avery, K.B.; Tignor, M.; Miller, H.L. Climate Change 2007: The Physical Science Basis. Working Group I Contribution to the Fourth Assessment Report of the IPCC; Cambridge University Press: Bristol, UK, 2007. [Google Scholar]
- Ucal, M.; Xydis, G. Multidirectional Relationship between Energy Resources, Climate Changes and Sustainable Development: Technoeconomic Analysis. Sustain. Cities Soc. 2020, 60, 102–210. [Google Scholar] [CrossRef]
- Marchal, V.; Dellink, R.; Vuuren, D.V.; Clapp, C.; Château, J.; Magné, B.; Lanzi, E.; Vliet, J.V. OECD Environmental Outlook to 2050: Climate Change Chapter. OECE Publ. 2012, 39, 232–240. [Google Scholar]
- Mensah, I.A.; Sun, M.; Gao, C.; Omari-Sasu, A.Y.; Zhu, D.; Ampimah, B.C.; Quarcoo, A. Analysis on the nexus of economic growth, fossil fuel energy consumption, CO2 emissions and oil price in Africa based on a PMG panel ARDL approach. J. Clean. Prod. 2019, 228, 161–174. [Google Scholar] [CrossRef]
- Huang, J.P. Energy substitution to reduce carbon dioxide emission in China. Energy 1993, 18, 281–287. [Google Scholar]
- Marchetti, C. Primary energy substitution models: On the interaction between energy and society. Technol. Forecast. Soc. Chang. 1977, 10, 345–356. [Google Scholar] [CrossRef] [Green Version]
- Wang, Z.; Zhu, Y.S.; Zhu, Y.B.; Shi, Y. Energy structure change and carbon emission trends in China. Energy 2016, 115 Pt 1, 369–377. [Google Scholar] [CrossRef]
- Xie, H.L.; Yu, Y.N.; Wang, W.; Liu, Y.C. The substitutability of non-fossil energy, potential carbon emission reduction and energy shadow prices in China. Energy Policy 2017, 107, 63–71. [Google Scholar] [CrossRef]
- Weng, Y.Y.; Zhang, X.L. The role of energy efficiency improvement and energy substitution in achieving China’s carbon intensity target. Energy Procedia 2017, 142, 2786–2790. [Google Scholar] [CrossRef]
- Jin, T.; Kim, J. What is better for mitigating carbon emissions—Renewable energy or nuclear energy? A panel data analysis. Renew Sustain. Energy Rev. 2018, 91, 464–471. [Google Scholar] [CrossRef]
- Lin, B.Q.; Li, Z. Is more use of electricity leading to less carbon emission growth? An analysis with a panel threshold model. Energy Policy 2020, 137, 111–121. [Google Scholar] [CrossRef]
- Jin, S.W.; Li, Y.P.; Huang, G.H.; Nie, S. Analyzing the performance of clean development mechanism for electric power systems under uncertain environment. Renew. Energy 2018, 123, 382–397. [Google Scholar] [CrossRef]
- Zhao, Z.Y.; Li, Z.W.; Xia, B. The impact of the CDM (clean development mechanism) on the cost price of wind power electricity: A China study. Energy 2014, 69, 179–185. [Google Scholar] [CrossRef] [Green Version]
- Schroeder, M. Utilizing the clean development mechanism for the deployment of renewable energies in China. Appl. Energy 2009, 86, 237–242. [Google Scholar] [CrossRef]
- Kim, J.; Park, K. Effect of the Clean Development Mechanism on the deployment of renewable energy: Less developed vs. well-developed financial markets. Energy Econ. 2018, 75, 1–13. [Google Scholar] [CrossRef]
- Banuri, T.; Gupta, S. The Clean Development Mechanism and sustainable development: An economic analysis. In Implementation of the Kyoto Protocol: Opportunities and Pitfalls for Developing Countrie; Manila, G.P., Ed.; Asian Development Bank: Mandaluyong, Philippines, 2000; Available online: https://pdfs.semanticscholar.org/d938/ebb4b4d3a42929e38c43b896d7545a4756a9.pdf (accessed on 14 January 2021).
- Nallapaneni, M.K. Impact of Clean Development Mechanism on Eco-friendly Energy Recovery Technology. Procedia Technol. 2015, 21, 54–58. [Google Scholar] [CrossRef] [Green Version]
- Huang, Y.; Barker, T. The Clean Development Mechanism and low carbon development: A panel data analysis. Energy Econ. 2012, 34, 1033–1040. [Google Scholar] [CrossRef]
- Lim, X.L.; Lam, W.H. Review on Clean Development Mechanism (CDM) implementation in Malaysia. Renew Sustain. Energy Rev. 2014, 29, 276–285. [Google Scholar] [CrossRef]
- Lewis, J.I. The evolving role of carbon finance in promoting renewable energy development in China. Energy Policy 2010, 38, 2875–8286. [Google Scholar] [CrossRef]
- Stua, M. Evidence of the clean development mechanism impact on the Chinese electric power system’s low-carbon transition. Energy Policy 2013, 62, 1309–1319. [Google Scholar] [CrossRef]
- Bayer, P.; Urpelainen, J.; Wallace, J. Who uses the Clean Development Mechanism? An empirical analysis of projects in Chinese provinces. Glob. Environ. Chang. 2013, 23, 512–521. [Google Scholar] [CrossRef] [Green Version]
- Strand, J.; Rosendahl, K.E. Global emissions effects of CDM projects with relative baselines. Resour. Energy Econ. 2012, 34, 533–548. [Google Scholar] [CrossRef]
- Costa, A.; Pasini, K.; Andrade, C. Clean development mechanism in Brazil: An instrument for technology transfer and the promotion of cleaner technologies? J. Clean. Prod. 2013, 46, 67–73. [Google Scholar] [CrossRef]
- Schneider, L. Is the CDM Fulfilling its Environmental and Sustainable Development Objectives? Öko-Institut Report Prepared for the World Wildlife Fund: Berlin, Germany, 2007; Available online: http://www.monitoringmatters.org/ppdfc/cdm.pdf (accessed on 14 January 2021).
- Michaelowa, A. Interpreting the Additionality of CDM Projects: Changes in Additionality Definitions and Regulatory Practices over Time. In Legal Aspects of Carbon Trading; Oxford University Press: Oxford, UK, 2009; pp. 248–272. [Google Scholar]
- Alexeew, J.; Bergset, L.; Meyer, K.; Petersen, J.; Schneider, L.; Unger, C. An analysis of the relationship between the additionality of CDM projects and their contribution to sustainable development. Int. Environ. Agreem. Politics Law Econ. 2010, 10, 233–248. [Google Scholar] [CrossRef]
- Zhang, J.; Wang, C. Co-benefits and additionality of the clean development mechanism: An empirical analysis. J. Environ. Econ. Manag. 2011, 62, 140–154. [Google Scholar] [CrossRef]
- Cui, J.; Liu, X.; Sun, Y.; Yu, H. Can CDM projects trigger host countries’ innovation in renewable energy? Evidence of firm-level dataset from China. Energy Policy 2020, 139, 111349. [Google Scholar] [CrossRef]
- Maraseni, T.N. Selecting a CDM investor in China: A critical analysis. Energy Policy 2013, 53, 484–489. [Google Scholar] [CrossRef]
- Koch, N.; Fuss, S.; Grosjean, G.; Edenhofer, O. Causes of the EU ETS price drop: Recession, CDM, renewable policies or a bit of everything?-New evidence. Energy Policy 2014, 73, 676–685. [Google Scholar] [CrossRef] [Green Version]
- Pechak, O.; Mavrotas, G.; Diakoulaki, D. Role and contribution of the clean development mechanism to the development of wind energy. Renew. Sustain. Energy Rev. 2011, 15, 3380–3387. [Google Scholar] [CrossRef]
- Nautiyal, H. Progress in renewable energy under clean development mechanism in India. Renew. Sustain. Energy Rev. 2012, 16, 2913–2919. [Google Scholar] [CrossRef]
- Zhang, Y.J.; Jiang, L.; Shi, W. Exploring the growth-adjusted energy-emission efficiency of transportation industry in China. Energy Econ. 2020, 90, 104873. [Google Scholar] [CrossRef]
Figure 1.
Carbon dioxide emissions of some countries in 2017.

Figure 2.
China’s total carbon emission trend over the years.

Figure 3.
Number of CDM projects registered in China and the world.

Figure 4.
Long-term dynamic impact of CDM projects on gdpCO2.

Figure 5.
Long-term dynamic impact of CDM project on gCO2.

Figure 6.
Trend of fossil energy consumption in China from 2000 to 2019.

Figure 7.
The trend of carbon emissions caused by different energy consumption from 2006 to 2017.


Table 1.
Descriptive statistical analysis of major variables.
| Variable | Variable Meaning (Unit) | Obs | Mean | SD | Min | Max |
|---|---|---|---|---|---|---|
| gdpCO2 | Carbon dioxide emissions per unit of GDP (ton/yuan) | 540 | 1.107 | 0.787 | 0.067 | 3.522 |
| gCO2 | Growth rate of regional carbon dioxide emissions (%) | 510 | 0.147 | 0.632 | −0.865 | 4.466 |
| CDM | If the CDM project is implemented in the region, the value is 1, otherwise it is 0 | 558 | 0.455 | 0.498 | 0 | 1 |
| CDM project | Total number of CDM projects (one) | 558 | 1.441 | 1.689 | 0 | 5.429 |
| cooperation CDM project | Number of cooperative projects in CDM projects (one) | 558 | 1.329 | 1.635 | 0 | 5.204 |
| non-cooperation CDM project | Number of non-cooperative projects in CDM projects (one) | 558 | 0.664 | 0.963 | 0 | 3.850 |
| fristgdp | (total output value of the primary industry/GDP) * 100 (%) | 558 | 12.4 | 6.6 | 0.4 | 37.3 |
| secondgdp | (total output value of the secondary industry/GDP) * 100 (%) | 558 | 45.3 | 8.5 | 19 | 66.4 |
| thridgdp | (total output value of the tertiary industry/GDP) * 100 (%) | 558 | 41.1 | 8.4 | 27.4 | 80.6 |
| Investment | (Fixed asset investment/GDP) * 100 (%) | 558 | 61.4 | 25.2 | 23.7 | 150.7 |
| Open | (Total import and export/GDP) * 100 (%) | 558 | 13.1 | 18.2 | 0 | 91.6 |
| FDI | (Total foreign direct investment/GDP) * 100 (%) | 558 | 39 | 52 | 0 | 57.05 |
| Coal | Logarithm of coal consumption (million tons) | 536 | 8.936 | 0.936 | 5.256 | 10.668 |
| Crude oil | Logarithm of crude oil consumption (million tons) | 481 | 7.419 | 0.927 | 4.652 | 9.834 |
| Gas | Logarithm of gas consumption (million tons) | 510 | 2.888 | 1.497 | −4.605 | 5.471 |
Table 2.
Impact of CDM projects on carbon emission.
| gdpCO2 | gCO2 | |||||
|---|---|---|---|---|---|---|
| (1) | (2) | (3) | (4) | (5) | (6) | |
| CDM project | −0.047 ** | −0.038 * | −0.039 *** | −0.026 ** | ||
| (0.022) | (0.023) | (0.012) | (0.011) | |||
| CDM | −0.363 *** | −0.079 * | ||||
| (0.083) | (0.042) | |||||
| fristgdp | 2.095 | 2.211 | 4.774 *** | 4.836 *** | ||
| (1.786) | (1.754) | (0.880) | (0.880) | |||
| secondgdp | 1.845 ** | 1.774 ** | 1.667 *** | 1.685 *** | ||
| (0.792) | (0.778) | (0.400) | (0.401) | |||
| thridgdp | 1.653 ** | 1.732 ** | 0.409 | 0.418 | ||
| (0.726) | (0.714) | (0.369) | (0.370) | |||
| Investment | −0.311 | −0.166 | −0.330 *** | −0.334 *** | ||
| (0.225) | (0.222) | (0.113) | (0.114) | |||
| Open | 0.200 | 0.287 | −0.092 | −0.077 | ||
| (0.281) | (0.277) | (0.141) | (0.142) | |||
| FDI | 0.047 | 0.078 | −0.074 ** | −0.070 * | ||
| (0.070) | (0.069) | (0.036) | (0.036) | |||
| Region fixed effect | YES | YES | YES | YES | YES | YES |
| Year fixed effect | YES | YES | YES | YES | YES | YES |
| _cons | −0.178 * | −1.898 *** | −1.997 *** | 1.555 *** | 0.031 | 0.006 |
| (0.097) | (0.713) | (0.701) | (0.048) | (0.359) | (0.360) | |
| N | 510 | 510 | 510 | 540 | 540 | 540 |
| F | 19.796 | 15.595 | 16.831 | 42.662 | 37.346 | 37.173 |
| r2 | 0.435 | 0.451 | 0.470 | 0.609 | 0.648 | 0.647 |
Note: (1) *, **, *** are significant at the level of 10%, 5% and 1%, respectively; (2) In parentheses is the value of standard error.
Table 3.
Impact of CDM project implementation intensity on carbon emissions.
| gdpCO2 | gCO2 | |||
|---|---|---|---|---|
| (1) | (2) | (3) | (4) | |
| CDM project_total emission | −0.006 ** | −0.025 *** | ||
| (0.003) | (0.006) | |||
| CDM project_average emission | −0.007 * | −0.034 *** | ||
| (0.004) | (0.007) | |||
| control variable | YES | YES | YES | YES |
| Region fixed effect | YES | YES | YES | YES |
| Year fixed effect | YES | YES | YES | YES |
| _cons | 0.005 | 0.003 | −1.988 *** | −2.026 *** |
| (0.360) | (0.360) | (0.702) | (0.699) | |
| N | 540 | 540 | 510 | 510 |
| F | 37.261 | 37.146 | 16.706 | 16.995 |
| r2 | 0.648 | 0.647 | 0.468 | 0.472 |
Note: (1) *, **, *** are significant at the level of 10%, 5%, and 1%, respectively; (2) In parentheses is the value of standard error.
Table 4.
The long-term impact of CDM projects on carbon emissions.
| gdpCO2 | gCO2 | |||
|---|---|---|---|---|
| (1) | (2) | (3) | (4) | |
| CDM project × year2004 | −0.319 | −0.317 | −0.938 | −0.790 |
| (0.401) | (0.384) | (0.742) | (0.740) | |
| CDM project × year2005 | −0.004 | 0.010 | −0.062 | −0.050 |
| (0.054) | (0.052) | (0.100) | (0.099) | |
| CDM project × year2006 | 0.005 | 0.010 | −0.046 | −0.049 |
| (0.029) | (0.027) | (0.055) | (0.055) | |
| CDM project × year2007 | 0.009 | 0.005 | −0.035 | −0.027 |
| (0.034) | (0.033) | (0.063) | (0.063) | |
| CDM project × year2008 | −0.032 | −0.040 | −0.057 | −0.047 |
| (0.048) | (0.046) | (0.089) | (0.089) | |
| CDM project × year2009 | −0.010 | 0.004 | −0.156 ** | −0.137 * |
| (0.040) | (0.039) | (0.075) | (0.075) | |
| CDM project × year2010 | −0.016 | −0.006 | −0.035 | −0.030 |
| (0.048) | (0.046) | (0.088) | (0.088) | |
| CDM project × year2011 | −0.058 | −0.034 | −0.010 | 0.015 |
| (0.051) | (0.049) | (0.094) | (0.094) | |
| CDM project × year2012 | −0.074 ** | −0.063 * | 0.129 ** | 0.136 ** |
| (0.034) | (0.033) | (0.064) | (0.064) | |
| CDM project × year2013 | −0.033 | −0.027 | −0.241 ** | −0.247 ** |
| (0.059) | (0.057) | (0.110) | (0.110) | |
| CDM project × year2014 | −0.094 *** | −0.068 ** | 0.007 | 0.030 |
| (0.033) | (0.032) | (0.063) | (0.063) | |
| CDM project × year2015 | −0.068 ** | −0.057 ** | −0.058 | −0.052 |
| (0.028) | (0.027) | (0.052) | (0.052) | |
| CDM project × year2016 | −0.076 ** | −0.059 ** | −0.089 | −0.072 |
| (0.030) | (0.029) | (0.056) | (0.056) | |
| CDM project × year2017 | −0.013 | 0.013 | −0.082 | −0.071 |
| (0.030) | (0.030) | (0.058) | (0.059) | |
| Control variable | NO | YES | NO | YES |
| Region fixed effect | YES | YES | YES | YES |
| Year fixed effect | YES | YES | YES | YES |
| _cons | 1.565 *** | 2.660 ** | −0.425 *** | −1.932 |
| (0.049) | (1.043) | (0.093) | (2.072) | |
| N | 540 | 540 | 510 | 510 |
| F | 23.033 | 23.706 | 10.864 | 10.438 |
| r2 | 0.629 | 0.669 | 0.461 | 0.487 |
Note: (1) *, **, *** are significant at the level of 10%, 5% and 1%, respectively; (2) In parentheses is the value of standard error.
Table 5.
The impact of CDM projects with different cooperation modes on carbon emissions.
| gdpCO2 | gCO2 | |||
|---|---|---|---|---|
| (1) | (2) | (3) | (4) | |
| cooperation CDM project | −0.020 * | −0.025 | ||
| (0.012) | (0.023) | |||
| non-cooperation CDM project | −0.038 ** | −0.029 | ||
| (0.016) | (0.032) | |||
| Control variable | YES | YES | YES | YES |
| Region fixed effect | YES | YES | YES | YES |
| Year fixed effect | YES | YES | YES | YES |
| _cons | 0.026 | 0.053 | −1.911 *** | −1.884 *** |
| (0.360) | (0.359) | (0.714) | (0.715) | |
| N | 540 | 540 | 510 | 510 |
| F | 37.090 | 37.418 | 15.472 | 15.447 |
| r2 | 0.647 | 0.649 | 0.449 | 0.448 |
Note: (1) *, **, *** are significant at the level of 10%, 5% and 1%, respectively; (2) In parentheses is the value of standard error.
Table 6.
The impact of different types of CDM projects on carbon emissions.
| (1) | (2) | (3) | (4) | (5) | (6) | (7) | (8) | (9) | |
|---|---|---|---|---|---|---|---|---|---|
| energy-saving and efficiency improvement | −0.024 | ||||||||
| (0.022) | |||||||||
| new and renewable energy | −0.020 * | ||||||||
| (0.012) | |||||||||
| fuel substitution | 0.023 | ||||||||
| (0.042) | |||||||||
| methane recovery | −0.140 *** | ||||||||
| (0.022) | |||||||||
| N2O decomposition and elimination | −0.060 | ||||||||
| (0.048) | |||||||||
| HFC-23 decomposition | 0.055 | ||||||||
| (0.060) | |||||||||
| waste burning power generation | −0.048 | ||||||||
| (0.046) | |||||||||
| afforestation and reforestation | 0.041 | ||||||||
| (0.166) | |||||||||
| others | 0.021 | ||||||||
| (0.098) | |||||||||
| Control variable | YES | YES | YES | YES | YES | YES | YES | YES | YES |
| Region fixed effect | YES | YES | YES | YES | YES | YES | YES | YES | YES |
| Year fixed effect | YES | YES | YES | YES | YES | YES | YES | YES | YES |
| _cons | 0.036 | 0.037 | 0.029 | 0.042 | 0.048 | 0.013 | 0.106 | 0.036 | 0.043 |
| (0.361) | (0.360) | (0.361) | (0.347) | (0.361) | (0.362) | (0.368) | (0.361) | (0.364) | |
| N | 540 | 540 | 540 | 540 | 540 | 540 | 540 | 540 | 540 |
| F | 36.893 | 37.103 | 36.798 | 41.430 | 36.951 | 36.857 | 36.887 | 36.769 | 36.767 |
| r2 | 0.646 | 0.647 | 0.645 | 0.672 | 0.646 | 0.645 | 0.646 | 0.645 | 0.645 |
Note: (1) *, **, *** are significant at the level of 10%, 5% and 1%, respectively; (2) In parentheses is the value of standard error.
Table 7.
The impact of CDM projects on energy substitution.
| Coal | gcoal | Crude | gCrude | Gas | gGas | |
|---|---|---|---|---|---|---|
| (1) | (2) | (3) | (4) | (5) | (6) | |
| CDM project | 0.013 | −0.162 *** | −0.022 | −0.050 *** | −0.036 | −7.269 *** |
| (0.009) | (0.026) | (0.031) | (0.013) | (0.036) | (2.161) | |
| Control variable | YES | YES | YES | YES | YES | YES |
| Region fixed effect | YES | YES | YES | YES | YES | YES |
| Year fixed effect | YES | YES | YES | YES | YES | YES |
| _cons | 8.402 *** | 0.441 | 7.436 *** | −0.149 | 3.123 *** | 95.020 |
| (0.285) | (0.791) | (1.046) | (0.427) | (1.164) | (66.889) | |
| N | 536 | 506 | 490 | 455 | 510 | 461 |
| F | 78.438 | 9.681 | 8.594 | 2.552 | 32.390 | 1.805 |
| r2 | 0.796 | 0.340 | 0.321 | 0.132 | 0.630 | 0.096 |
Note: (1) *, **, *** are significant at the level of 10%, 5%, and 1%, respectively; (2) in parentheses is the value of standard error; (3) coal consumption refers to the total consumption amount of coal and coke, while crude oil consumption refers to the total consumption amount of crude oil, kerosene, fuel oil, gasoline, and diesel.
Table 8.
The impact of CDM project on energy efficiency.
| Coal Efficiency | Crude Efficiency | Gas Efficiency | |||
|---|---|---|---|---|---|
| (1) | (2) | (3) | (4) | (5) | |
| CDM project | −0.021 *** | −0.020 *** | −0.003 ** | −0.002 ** | −0.000 ** |
| (0.008) | (0.007) | (0.001) | (0.001) | (0.000) | |
| Control variable | YES | YES | YES | YES | YES |
| Region fixed effect | YES | YES | YES | YES | YES |
| Year fixed effect | YES | YES | YES | YES | YES |
| _cons | 0.316 | 0.156 | 0.217 *** | 0.139 *** | 0.000 |
| (0.244) | (0.223) | (0.039) | (0.033) | (0.001) | |
| N | 534 | 538 | 481 | 490 | 558 |
| F | 25.355 | 26.069 | 33.051 | 20.792 | 1.102 |
| r2 | 0.559 | 0.564 | 0.650 | 0.533 | 0.050 |
Note: (1) *, **, *** are significant at the level of 10%, 5%, and 1%, respectively; (2) in parentheses is the value of standard error; (3) the first column only investigates the coal, the second column investigates coal and coke; the third column only investigates crude oil, and the fourth column investigates crude oil, kerosene, fuel oil, gasoline, and diesel.
Publisher’s Note: MDPI stays neutral with regard to jurisdictional claims in published maps and institutional affiliations. |
© 2021 by the authors. Licensee MDPI, Basel, Switzerland. This article is an open access article distributed under the terms and conditions of the Creative Commons Attribution (CC BY) license (http://creativecommons.org/licenses/by/4.0/).
Share and Cite
MDPI and ACS Style
Shi, B.; Wu, L.; Kang, R. Clean Development, Energy Substitution, and Carbon Emissions: Evidence from Clean Development Mechanism (CDM) Project Implementation in China. Sustainability 2021, 13, 860. https://doi.org/10.3390/su13020860
AMA Style
Shi B, Wu L, Kang R. Clean Development, Energy Substitution, and Carbon Emissions: Evidence from Clean Development Mechanism (CDM) Project Implementation in China. Sustainability. 2021; 13(2):860. https://doi.org/10.3390/su13020860
Chicago/Turabian StyleShi, Beibei, Lei Wu, and Rong Kang. 2021. "Clean Development, Energy Substitution, and Carbon Emissions: Evidence from Clean Development Mechanism (CDM) Project Implementation in China" Sustainability 13, no. 2: 860. https://doi.org/10.3390/su13020860
Note that from the first issue of 2016, this journal uses article numbers instead of page numbers. See further details here.