Article

Combining Life Cycle Assessment and Circularity Assessment to Analyze Environmental Impacts of the Medical Remanufacturing of Electrophysiology Catheters

Fraunhofer Institute for Environmental, Safety, and Energy Technology UMSICHT, 46047 Oberhausen, Germany
*
Author to whom correspondence should be addressed.
Sustainability 2021, 13(2), 898; https://doi.org/10.3390/su13020898
Submission received: 14 December 2020 / Revised: 9 January 2021 / Accepted: 13 January 2021 / Published: 17 January 2021
(This article belongs to the Collection Circular Economy and Sustainable Strategies)

Abstract

:
Sustaining value after the end-of-life to improve products’ circularity and sustainability has attracted an increasing number of industrial actors, policymakers, and researchers. Medical products are considered to have great remanufacturing potential because they are often designated as single-use products and consist of various complex materials that cannot be reused and are not significant in municipal recycling infrastructure. The remanufacturing of electrophysiology catheters is a well-established process guaranteeing equivalent quality compared to virgin-produced catheters. In order to measure if using a remanufactured product is environmentally beneficial compared to using a virgin product, life cycle assessment (LCA) is often used. However, focusing on one life cycle to inform on the environmental-beneficial use fails to guide policymakers from a system perspective. This study analyzes the environmental consequences of electrophysiology catheters considering two modeling perspectives, the implementation of LCA, including a cut-off approach and combining LCA and a circularity indicator measuring multiple life cycles. Investigating the LCA results of using a remanufactured as an alternative to a newly-manufactured catheter shows that the global warming impact is reduced by 50.4% and the abiotic resource use by 28.8%. The findings from the system perspective suggest that the environmental savings increase with increasing collection rates of catheters.

1. Introduction

The growing resource demand of society is approaching limits concerning resource consumption and the carrying capacity of waste and harmful emissions in the environment [1]. In order to overcome this dependency between the growing resource throughput and resource depletion or rather carrying capacity, the concept of a circular economy (CE) was proposed [2]. The CE represents a theoretical concept that aims to decouple economic growth and development from the consumption of finite resources in order to preserve the raw materials, components, and products, enabling their highest value and utility at all times [3]. Implementing CE measures and business models for closing resource cycles are seen as a key strategy to support the sustainable development goals (SDG) and especially SDG 12 “sustainable consumption and production” set by the United Nations in 2015 for 2030 [4]. The importance of CE is also highlighted in the European Circular Economy Action Plan [5]. Since 2015, the European Commission developed and updated an action plan to help accelerate Europe’s transition to a CE, boost global competitiveness, promote sustainable economic growth, and create new jobs [5]. The action plan sets out measures to close the loop of product life cycles: from production and consumption to waste management and the market for secondary raw materials [5].
Whereas the potentials of CE are broadly discussed within recent literature reviewing CE [2,6,7], the possible adverse outcomes are less distinctively clarified [8,9,10]. Traditional manufacturing processes are hardly adaptable to the CE principles as they currently rely on the “take-make-dispose” paradigm [11]. An aspect of current CE definitions is sustaining value after the end-of-life (EoL) to improve products’ circularity and sustainability [12,13]. The EoL is the life cycle stage where products are discarded or disposed, for instance, due to technological obsolescence, deterioration, or changes in consumer needs. However, sustaining value after the EoL is particularly challenging for medical products and devices because they are subjected with regulatory requirements, e.g., specific hygienic requirements [14]. Original equipment manufacturers (OEM) designate them for these and other reasons as single-use only [14].
A common classification of strategies to foster the CE concept is the taxonomy of ‘R-strategies’ [13]. Potting et al. [15] defined CE strategies as measures “to reduce natural resources and materials consumption and minimize the production of waste”. The authors identified ten R-strategies [15]: Refuse, rethink, reduce, reuse, repair, refurbishment, remanufacturing, repurpose, recycle, and recover. Refuse, rethink, and reduce are strategies for designing smarter product use and manufacture [15], and are therefore out of the scope because those strategies do not take place at the end of a products’ life. Repair, reuse, refurbishment, remanufacturing, and repurpose are defined as strategies to extend the lifetime of products and their parts [15]. However, according to the British Standard Institution, of the mentioned lifetime extending measures for products and parts, remanufacturing exclusively guarantees that the quality and performance are equivalent or even better than that of a newly-manufactured product [16]. Moreover, recycling complex medical products might play an insignificant role, as recycling needs extensive material flows to make it economically and ecologically reasonable [17]. The more complex a product, the more process steps, energy, and resources are needed for recycling [18]. The recycling process of specific materials or complex products itself might be more resource-intensive than the extraction of the raw materials, meaning that recycling can only recuperate a fraction of the input [18]. Medical products might have specific requirements for their collection and disposal after use from an infection-prevention perspective. Furthermore, those products often contain special and complex materials that do not play a role in municipal waste disposal, management, and recycling infrastructure. It follows that remanufacturing might be the most promising R-strategy for medical products for sustaining value after the EoL. This statement is supported by several studies that indicate that the production of medical equipment and products have been identified as having great importance and remanufacturing potential [19,20,21].
As a CE strategy, remanufacturing could increase companies’ profitability, create new job opportunities, and reduce environmental impacts [22,23]. D’Adamo and Rosa [19] identified that remanufacturing in the medical sector has a high profitability, as public administrations’ limited budgets could lead them to prefer remanufactured products instead of virgin products. In addition to financial benefits, remanufacturing can be seen as an alternative manufacturing route that can reduce virgin production. By avoiding the use of virgin materials, remanufacturing can reduce the environmental impacts of resource consumption and emissions, such as reducing abiotic resource use and the global warming impact (GWI) [24,25]. Both impacts are adequately addressed by impact categories used in life cycle assessment (LCA). LCA is a method that has been established to compare the environmental burdens of the products’ life cycle. LCA results are used in a wide range of applications and for decision-making, such as in marketing information, product or material selection, design decisions, or strategic planning [26]. In the context of remanufacturing, LCA is used to measure whether and to what extent a remanufactured product is environmentally more beneficial than the newly-manufactured equivalent [27]. Compared to newly-manufactured products, the environmental advantages of remanufactured products have already been proven in LCA studies [24,25,27,28,29,30]. For example, the LCA results of remanufactured alternators showed that remanufacturing causes about 12% of the emissions and costs compared to producing new parts [24]. Krystofik et al. [25] found that adaptive remanufacturing is both an environmentally preferable and economically viable business strategy for office furniture production. Although medical devices are identified as a relevant sector for applying remanufacturing processes, we did not find any study conducting a comprehensive LCA to quantify the environmental impacts of remanufactured medical products. However, sustainability aspects of remanufactured medical devices have been discussed in Eze et al. [20].
To address this research gap, we conducted a comparative LCA on electrophysiology catheters as medical products concerning two scenarios; the provision through the production of a newly-manufactured catheter compared to the provision through a medical remanufacturing process (remanufactured catheter). Due to decisions made by the OEM manufactures, electrophysiology catheters are designated as single use devices [14]. They consist of various materials, mainly high-performance polymers that cannot be reused nor economically and ecologically recycled as described above. Even if the recycling of some used polymers is technically possible, we assume that collection, sorting, and recycling are not economically and environmentally reasonable, because of too small material flows. However, the remanufacturing of these catheters is a well-established process that guarantees equivalent or even better quality of the remanufactured product than the newly-manufactured catheter [31]. This study investigates the remanufacturing process carried out by the European Medical Remanufacturer Vanguard AG in Germany. However, methodological challenges exist for conducting a comparative LCA for remanufactured and newly-manufactured products because those products pass the product system multiple times due to the remanufacturing loop compared to non-remanufactured products, leading to inconsistent system boundaries [27]. CE indicators that capture multiple product cycles can enhance decision-making to improve the eco-efficiency of resource use [32]. However, these CE indicators are usually calculated separately from LCA studies and LCA results do not provide information on the circularity of products. Since remanufacturing is named a valuable R-strategy to support the CE, we combine LCA and a CE metric in Section 2.2 to gain insights from both evaluation methods. The combination of these two methodologies allows quantifying the environmental impacts for multiple product cycles of the medical remanufacturing process. Combining a CE metric and LCA for assessing environmental impacts and the contribution towards a CE of remanufactured products was not found in the literature and improves on current LCA and CE methodologies. The underlying assumptions regarding the remanufacturing process and the newly-manufactured catheter as well as the application of the LCA and CE indication method are explained in Section 2. The results of the study are presented and discussed in Section 3. A summary and outlook are given in Section 4.

2. Methodology

In the Section 2.1, the application of LCA to the newly-manufactured and the remanufactured catheter is explained. The approach for combining LCA and the CE metric is described in Section 2.2.

2.1. Life Cycle Assessment

The LCA was conducted following the ISO standards 14040 and 14044 [26,33]. ISO 14040 and 14044 [26,33] specify the methodological approach for LCA by division into four phases. In the first phase of an LCA, the goal and scope are defined, presented in Section 2.1.1. An LCA’s goal comprises the intended application, the reasons for conducting the analysis, the intended audience, and whether the study is a comparative assertion [26,33]. An LCA’s scope should contain the investigated product system, the functional unit’s definition, the system boundaries, and a description of how to handle multi-functional processes [26,33]. In Section 2.1.2, the second phase of an LCA, the inventory analysis is described, which comprises data collection and calculation approaches to quantify the product system’s inputs and outputs under study [26,33]. The impact assessment follows in Section 2.1.3 and is based on the quantified inputs and outputs of the inventory analysis and targets to evaluate the product system’s potential environmental impacts. In the last step of an LCA, the inventory analysis and impact assessment results are considered together and are interpreted in Section 3.1.

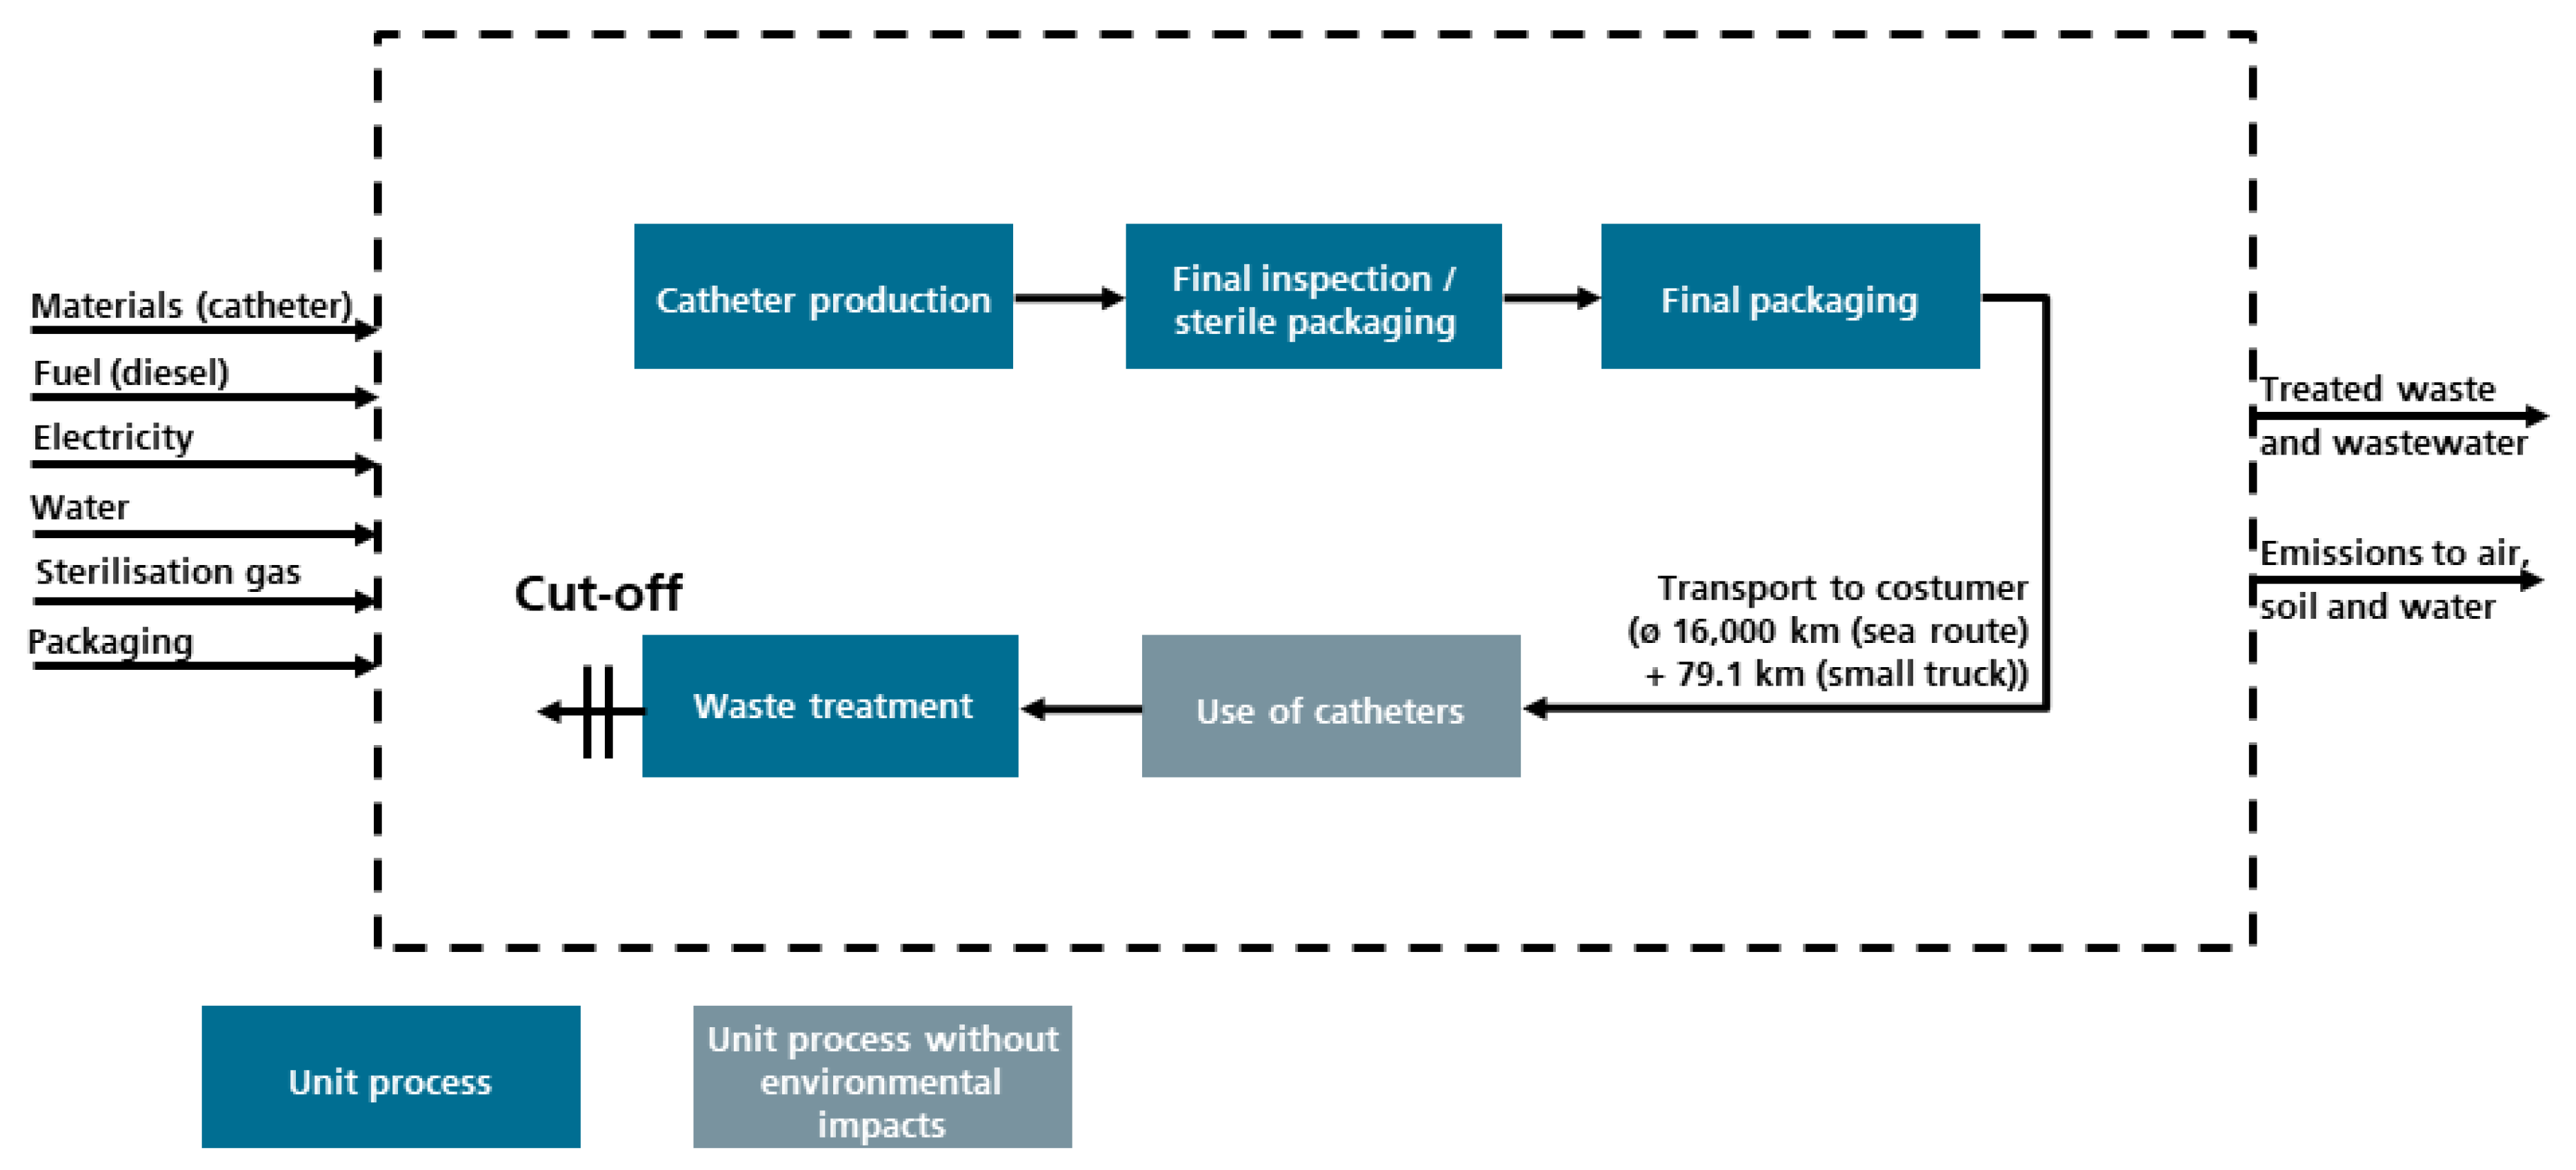
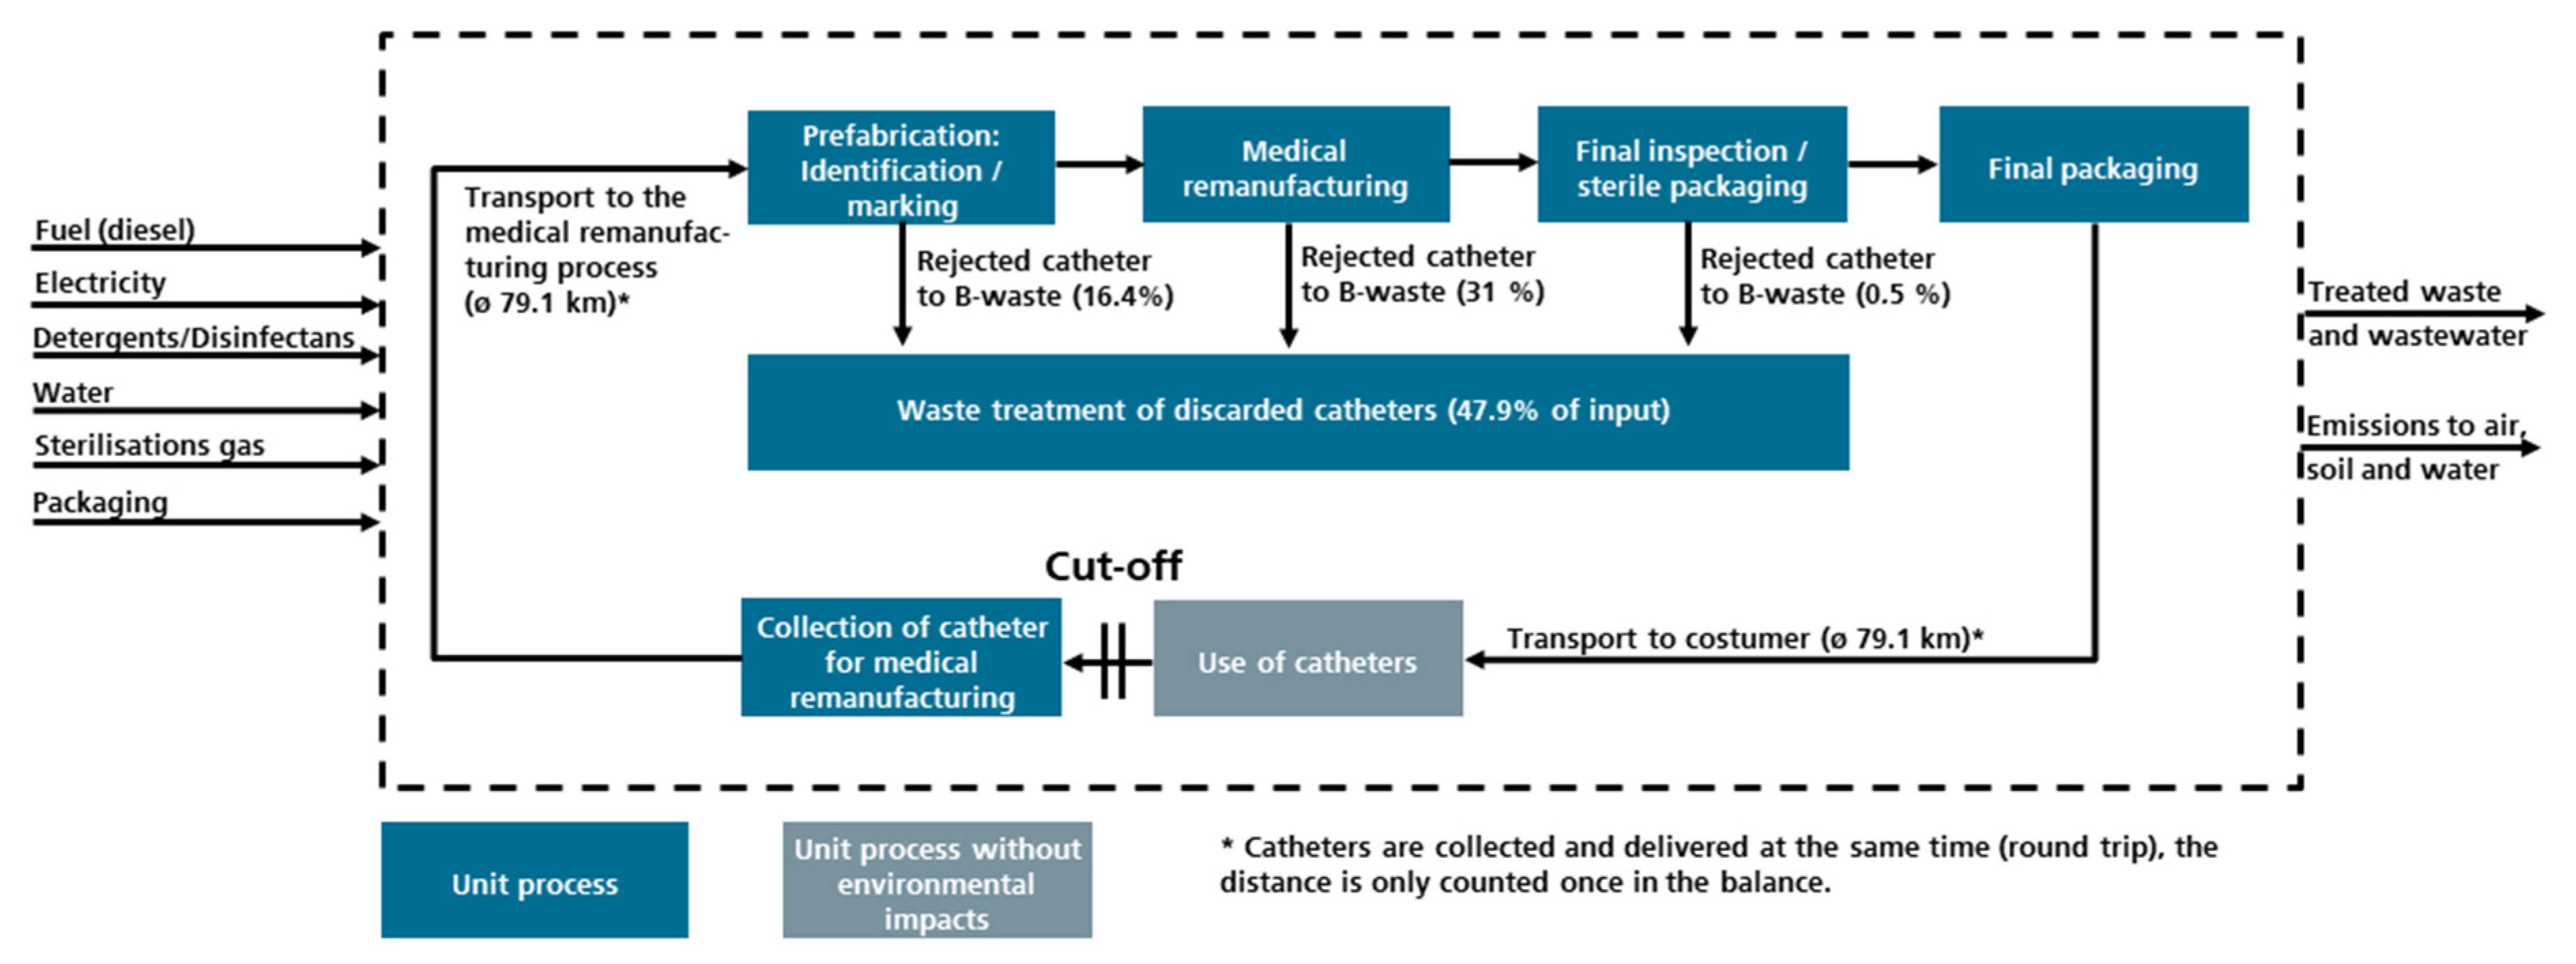
2.1.1. Goal and Scope of the Study

The study aims to compare the environmental impacts of using a virgin to using a remanufactured electrophysiology catheter. The electrophysiological diagnostic catheter is mainly used in cardiac ablations procedures, a procedure to alleviate or eliminate specific cardiac arrhythmia forms (see Figure 1).
We defined the functional unit as the provision of an electrophysiological diagnostic catheter for single-use. Further product specifications and a bill of materials of the investigated catheter are found in the Supplementary Materials of the article (see table sheet “BoM_specification_catheter”). The system boundaries are set from cradle-to-grave in this study, including all life cycle stages. For the newly-manufactured catheter, the system boundaries comprise the provision of raw materials for the catheter production, followed by the process steps of final inspection, sterile packaging, final packaging, transportation to the client, the use of the catheter, and waste treatment of the disposed catheter after single-use, which is shown in Figure 2. Consequently, the manufacturing or provision of chemicals and materials, required energy, transportation processes, water, and packaging materials to distribute a catheter are included within the scope. The catheter production location in the case of the newly-manufactured catheter is assumed to be in the United States (US), as the collected catheter for medical remanufacturing is initially produced in California. The hospitals, where the virgin catheters are used, are located in Germany. Hence, the study considers German conditions regarding the waste management system. Accordingly, the disposed catheter is treated as municipal waste since catheters are classified as hospital waste with high moisture content with no special requirements (B-waste) according to German demands for hospital waste [35].
An essential aspect of the remanufactured catheter’s system boundaries is whether the original product’s environmental burden should be considered [27]. In existing LCA standards and guidelines, limited information is found on the specific LCA approaches of a remanufactured product. In this study, the assessment of using a remanufactured catheter begins with the collection of pre-used catheters as burden-free products in order to analyze the environmental impacts of using a remanufactured catheter compared to newly-manufactured catheters that are disposed after single-use. The collected catheters are remanufactured, used again, and can then be collected for remanufacturing again. This approach investigates whether a user or client should buy a virgin catheter or a remanufactured catheter with the same functionality and quality based on environmental criteria.
The described approach is in line with the so-called “supporter perspective” for modeling comparative LCAs of remanufactured and newly-manufactured products [27]. The supporter perspective is rather reasonable for the decision-making of an environment-conscious user or client deciding whether to buy a remanufactured product for its use over a short time horizon [27]. Besides the supporter perspective, another modeling option is the so-called “neutral perspective” that focuses on long-term environmental impacts [27]. The neutral perspective needs other types of functional units, usually with extended time horizons and numerous product or solution alternatives as well as using system expansion for setting the system boundaries [27]. However, a new technology or product solution could lower the environmental impacts of the newly-manufactured or remanufactured product, subjected to uncertainties in both modeling perspectives [27]. We agree with the author that these uncertainties arising from new technologies and product solutions might be higher in the neutral perspective than in the supporter perspective [27], because the neutral perspective has a long-term focus and might be not suitable for covering rapid market and technology changes. Additionally, each newly-manufactured product can be remanufactured several times and therefore passing multiple product life cycles. Whereas the supporter perspective focuses on one product life cycle through the cut-off approach, the neutral perspective includes impacts on other product systems through system expansion, which could further increase the uncertainty of the LCA results [27]. In this study, we first decided to model the supporter perspective in order to provide information on short-term impacts. In order to analyze long-term impacts on a system perspective in the context of a CE, we introduced a new modeling approach including a circularity metric in Section 2.2.
For the medical remanufacturing route, the system boundaries comprise the collection of the catheters at hospitals in Germany, the transportation to the remanufacturing site, a prefabrication process, the medical remanufacturing, the final inspection, the sterile packaging, the final packaging, the transportation to the hospitals again and the use of a catheter (Figure 3). The prefabrication process step includes goods receipt, decontamination and identification of products. The medical remanufacturing process includes disassembly steps, assembly steps, cleaning steps, disinfection steps and test steps (e.g., 100% product tests, batch tests, functional tests). The final inspection and sterile packaging step include packing in sterilization pouches and sealing of the sterilization pouches, assignment of the sterile-packaged products to the sterilization process, as well as the sterilization process and final visual inspection. Sterilization is a method for the liberation of a medical device or other product from viable microorganisms [36]. A medical device that is free of viable microorganisms is called sterile. In order to eliminate the risk of possible infection, medical devices that are intended to penetrate the skin and thus come into contact with blood or internal tissues must be free of microbiological germs [36]. Electrophysiological diagnostic catheters for use in the heart are surgically invasively inserted through the skin into blood vessels and must therefore be sterile [31].
All rejected catheters that were sorted out due to failed identification, failed functional test after medical remanufacturing, or failed sterile packaging are included and are treated as municipal waste according to the reference process (waste treatment of discarded catheters in Figure 3). The proportion of remanufactured catheters leaving the process after final packaging per all collected catheters entering the identification process step is aggregated to 52.1% (and consequently 47.9% losses). In the final packaging step, the products are packed into the item-specific outer packaging, and the product labels are generated and applied. After the catheter is used in hospitals, a cut-off is placed as we assume that catheters from hospitals that participate in the medical remanufacturing process are collected again for remanufacturing. In line with the reference process from virgin production, all material and energy demands are modeled, starting with the provision of raw materials. Further modeling choices and assumptions regarding the life cycle inventory are discussed in Section 2.1.2.

2.1.2. Life Cycle Inventory

For the foreground system, we applied the so-called cut-off approach. The cut-off approach treats “allocatable by-products” with allocation, “recyclable materials” are cut off from the producing activity and are burden-free for other activities, and finally wastes are modeled as disposed in treatment activities and burdens caused by this treatment activity are attributed to the waste-producing activity [37]. Consequently, and in line with the cut-off approach, no credits for energy recovery and recycled materials are granted. For background data, the GaBi database service pack 40 and the GaBi software version 9.5.2.49 were used [38]. The environmental impacts that occur due to using the catheter, i.e., the electricity needed for the cardiac ablation, are not considered in this case study, as no data were available. However, the required electricity can be assumed to be the same for both catheter life cycles because the application, including its functionality and quality, are assumed to be equivalent. For primary data collection, if data ranges were given, average values were calculated. A bill of materials of the virgin manufactured catheter and a detailed description of both life cycle inventories of using a virgin and remanufactured catheter, including the providers of selected unit processes, can be found in the Supplementary Materials of this article. The input and output flows of the modelled virgin production route are given in Table 1.
As data for the newly-manufactured catheter’s production process is not available, we modeled the virgin catheter product system in accordance with the bill of materials of the catheter to be remanufactured (assembly of the catheter is neglected). Since the virgin catheter is manufactured in the US, we applied, if available, datasets with providers from the US. For instance, the US electricity mix was chosen for the production and processing of virgin plastic for the catheter components because the production site is located in California. However, if US-specific data were missing, we selected the providers according to countries or regions with similar production conditions, such as the European Union or comparable industrialized countries. Furthermore, the process steps, final inspection, sterile packaging, and final packaging were assumed to be identical to the medical remanufacturing route except for the transport distance to the customer, as no further data are available. Two transportation processes were modeled for the transport of a newly-manufactured catheter to the customer in Germany. Firstly, an average sea route from California to Germany (approximately 16,000 km) is assumed and the final transport to the customer is carried out with a small truck. The transportation distance to the customer within Germany was adapted from the remanufacturer to the customer (average value 79.1 km). Concerning the provision of materials for virgin catheter production consisting of a plug, a handle, a curvature, a loop, and a shaft, few simplifications are made. The incorporated filler of polyurethane in the curvature and loop (barium sulfate) is neglected in this study because we do not know the proper concentration of the filler in the polyurethane. The modeled curvature and loop is assumed to contain polyurethane exclusively. This simplified assumption should not influence the LCA result because the curvature and loop correspond in total to 0.7 wt.% of the catheter. The plastic of the catheter shaft (PEBAX®) is a specific block copolymer obtained by polycondensation of a polyamide (e.g., PA6, PA11, PA12) with an alcohol termination polyether (Polytetramethylene glycol or polyethylene glycol PEG) [39]. As no LCA dataset is available for the production of PEBAX®, we modeled the material by two possible preliminary products, namely polyethylene glycol (PEG) and polyamide 6 (PA6). The shaft of the catheter has a small sleeve at the top (7.5 × 10⁻³ g), which is made of polyether ether ketone (PEEK). The small-sized shaft sleeve is neglected in this study because it is assumed that the sleeve does not significantly affect the LCA result.
The data for the provision of a catheter through medical remanufacturing was gathered from Vanguard AG in Germany. The investigated remanufacturing process guarantees the safety and functionality of its remanufactured medical products in full compliance with the specifications of the original products and with CE-certified products also in compliance with the requirements of the Medical Device Directive 93/42/EEC [31]. A few assumptions are made to model the medical remanufacturing process. The German electricity mix was chosen to provide the electricity demand for medical remanufacturing because the company is located in Germany. The pre-used catheters are collected at hospitals in reusable polypropylene boxes. However, the reusable boxes’ production is neglected because the estimated number of reuses is higher than 250. The primary packaging at the collection point in hospitals is not considered for medical remanufacturing, as the plastic bag with the original label is attributed to the virgin production. The detergents and disinfectants for remanufacturing as well as for sterile packaging are modeled by their identifiable main components (>10.0%) according to the available safety data sheets on the internet. However, the ingredient glutaral in the disinfectant Neodischer Endo Sept GA is represented by a proxy dataset for steam cracking products, as no specific LCA dataset for the production process of glutaral is available in the GaBi database. The input and output flows of the medical remanufacturing production route catheter are given in Table 2.

2.1.3. Impact Assessment

The impact assessment is conducted following the recommendations of the environmental footprint (EF) 3.0 method published by the European Joint Research Centre (JRC) [40]. The method covers the following life cycle impact categories: Acidification (terrestrial and freshwater), cancer human health effects, climate change, ecotoxicity freshwater, eutrophication (freshwater, marine, terrestrial), ionizing radiation, land use, non-cancer human health effects, ozone depletion, photochemical ozone formation, resource use (energy carriers and minerals and metals), respiratory inorganics and water scarcity. As explained in the introduction, remanufacturing is expected to influence mainly the two impact categories concerning global warming and abiotic resource use. Hence, our analysis will focus on these two impact categories:
  • Climate change (determination of the GWI)
  • Resource use, mineral and metals (determination of the abiotic resource use)

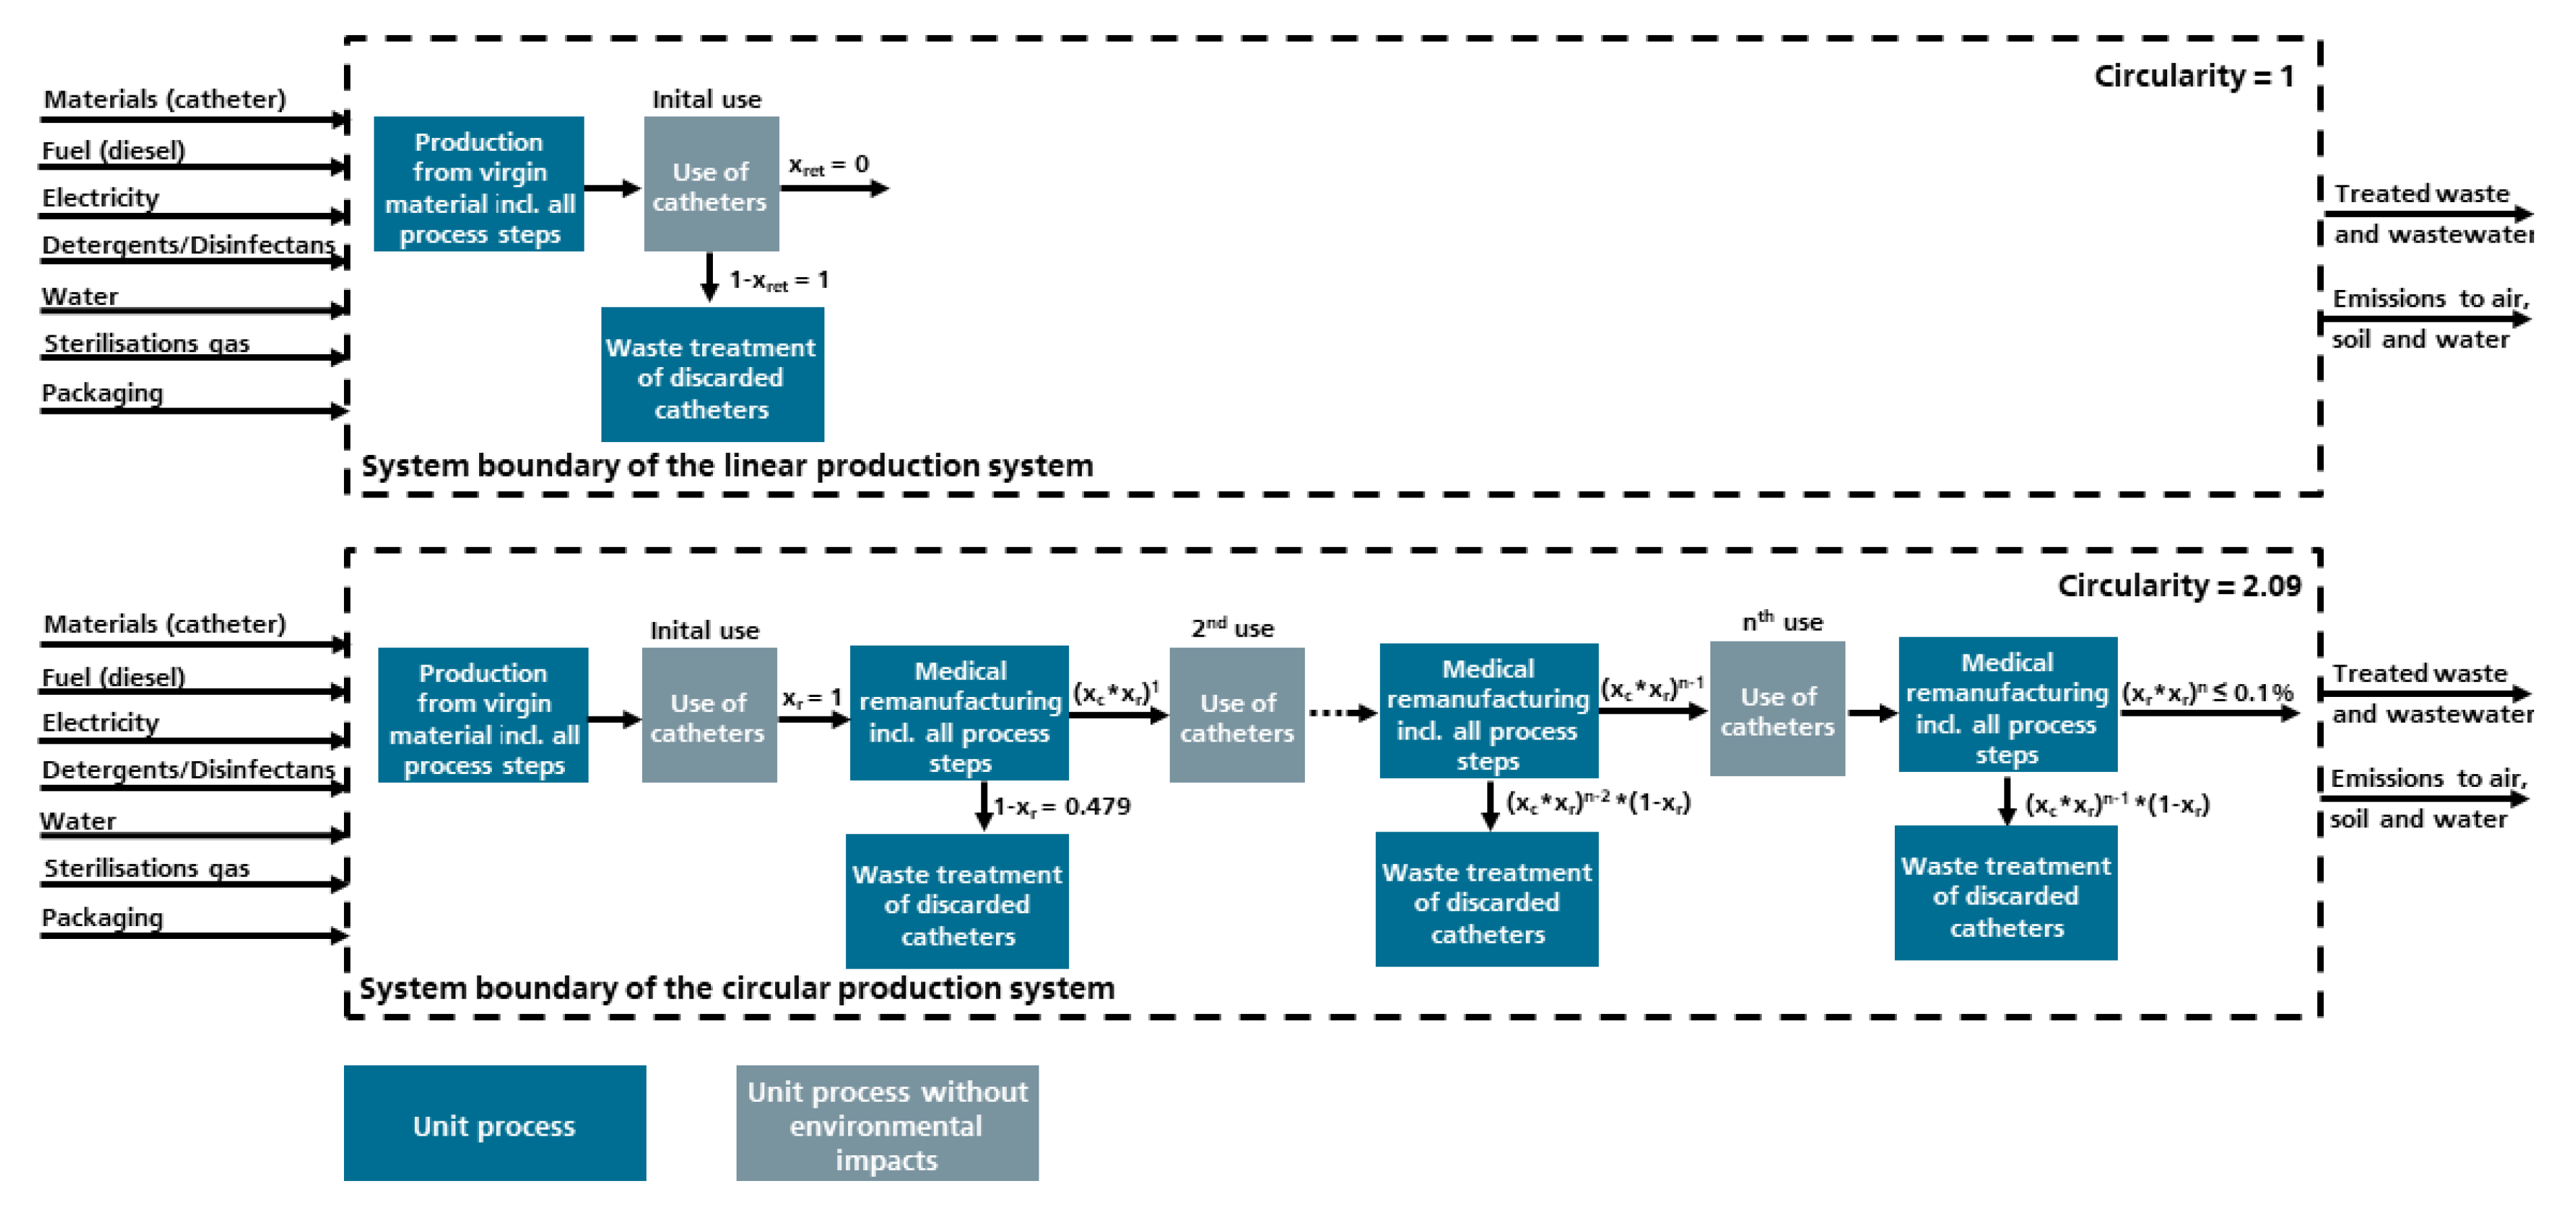
2.2. Combining Circularity and Life Cycle Assessment

The selected LCA approach could be meaningful to environmental-conscious clients deciding whether to buy a remanufactured product or a newly-manufactured one. However, this perspective is less meaningful to others, such as decision-makers who want to know whether remanufacturing is a more stimulating strategy than linear manufacturing [27]. This audience requires a broader view over an extended time horizon on the environmental benefits of a particular remanufactured product, including, for example, multiple remanufacturing cycles [27]. Using CE indication methods could help to analyze the contribution to CE by implementing either the remanufacturing process or linear production from virgin materials. Therefore, this section aims to describe how LCA and CE indicators could be combined to compare newly-manufactured catheters for single-use and remanufactured catheters that can be used multiple times.
Applying CE indicators for assessing products and materials is increasingly recommended and currently, a wide range of CE indicators exist in the scientific literature [4,41,42]. Various review papers and two reports supported by the EU on circular indication methods are found in the literature [4,41,42,43,44,45,46,47,48,49,50,51,52,53,54,55,56,57,58,59,60,61]. Currently, most CE indicators and assessment methods aim to measure the circularity degree of resource flows yet fail to quantify the product preserving cycles, such as reuse or remanufacturing [41]. An essential difference in CE indicators is the implementation level, which can be at the micro, meso, or macro level [4]. In this study, we consider the micro level, which focuses on the product or company level.
Four reviews are focusing on CE indications on the micro level [44,49,59,61]. Furthermore, two recent publications present comprehensive overviews of existing indicators analyzing 55 and 63 metrics or indicator sets across all implementation [4,56]. In these six reviews, we searched for quantitative indicators that indicate the remanufacturing loop and can be linked to LCA methods. Environmental impacts are broadly implemented into circularity indicators, for instance, by the metrics from [62,63,64,65]. However, none of them addresses remanufacturing because they instead focus on preserving the material as an end-of-life strategy. Indicators that focus on remanufacturing are either quantitative [66], focus on design for remanufacturing [67], or are based on economic values as a basis for measuring product circularity [68], but are not sufficiently designed for a combination with LCA, i.e., so that the metric can be used in life cycle impact assessment.
However, Figge et al. [32] proposed a circularity indicator that quantifies the number of times a resource passes a product system through different product cycles in the value chain. The authors state that this indicator could be applied in further research on the combination of circularity measures and life cycle sustainability indicators indicating life cycle benefits [32]. The proposed circularity metric is a simple indicator that calculates the number of times a resource is used on average in a product system circulating in a specific loop [32]. Although the circularity indicator calculates the contribution to the CE due to refurbishment and recycling, the idea of the indicator could be transferred to a remanufacturing loop. As mentioned above, medical products, such as catheters, cannot be reused and recycling is assumed to play an insignificant role. Therefore, the circularity indicator from Figge et al. [32] is transformed to the needs of the study, i.e., the product is recirculated within the value chain due to remanufacturing only. Thus, Equation (1) calculates the circularity of remanufactured products.
C i r c u l a r i t y = C i n i t a l + C r = 1 + i = 1 n ( x c * x r ) i
Herein, circularity is the sum of circularity provided by the initial use (Cinital) and additional circularity due to remanufacturing (Cr). Initial use means that the product is made from virgin resources and is used once. The contribution of remanufacturing to circularity (Cr) is indicated by the sum of collected products for remanufacturing (xc), and the proportion of those that are collected, which are then remanufactured and enter another product cycle i (xr). The variable i addresses the number of passed cycles. Hence, Equation (1) reflects the number of times a resource is used on average in a product system. The parameter Cr indicates how often the catheter is remanufactured on average. The circularity can vary between 1 and infinity. A circularity of 1 describes an entirely linear system; a circularity of infinity means a fully circular production system without losses. A direct proposal for linking the circularity indicator to LCA is not given in the original publication [32]. However, the circularity can be measured via “path length”, defined as the average number of product systems in which a resource is involved before products or materials leave as non-recoverable waste that cannot be retained in the value chain [69]. Building on this principle, the path length of a newly-manufactured catheter, which is then remanufactured on average Cr-times before being treated as waste, can be modeled as a circular production system. This circular production system can then be compared to a linear production system, where newly-manufactured catheters are used once and treated as waste without a remanufacturing process. The results of the circularity indicator can be used in combination with the LCA results of the supporter perspective to analyze the environmental impacts of remanufacturing catheters multiple times (circular-used catheters) in comparison to disposal of those catheters after single-use (linear-used catheters). The combination of the LCA results and the circularity metric is described in the following.
For the linear production system, 0% of the non-remanufactured and linear-used catheters are collected, which corresponds to a circularity of 1 in Equation (1). For the circular production system, we assume that 100% of the catheters to be remanufactured are collected (xc = 100%). The catheters are collected and stored separately so that no losses occur here. The collected catheters for remanufacturing are then identified, medically remanufactured, and sterilely packaged before returning to the customer. Losses occur in each of these process steps as described for the medical remanufacturing route (see Figure 3). The proportion of remanufacturable catheters of the collected catheters is 52.1%, which corresponds to xr. This corresponds to a circularity of 2.09 for the circular production system. Furthermore, this means that for infinite n, the catheters are remanufactured 1.09-times on average in the circular production system (see Figure 4).
For the combination of LCA and circularity, the average path length is used to set the system boundaries. In particular, the investigated product system is expanded from one product cycle to the average number of passed product cycles that occur due to circulating a product through remanufacturing (calculated with Equation (1)). Subsequently, the environmental impacts are calculated according to the path length of the linear and circular production system. However, after modeling the average path length, including multiple product cycles, the analyzed impact categories’ results are divided through the respective calculated circularity to receive the same functional unit as described in Section 2.1, namely the provision of one catheter. This proposed modeling approach can be used to understand the environmental consequences of applying a linear or circular production system, including multiple product cycles resulting from remanufacturing in this study.
For the linear production system, the input and output flows from Table 1 can be used because the linear production system corresponds to the production of a newly-manufactured catheter from virgin material, which is disposed after single-use (0% collection rate). For the circular production system, the different processes are summed up proportionally according to the path length until the fraction of circular-used catheters in the value chain is insignificant after n remanufacturing cycles (if (xc * xr)n ≤ 0.1%, the fraction is considered to be negligible). For this purpose, the process of a newly-manufactured catheter from virgin material is modeled once, but without waste treatment, since it is assumed that all catheters are collected for remanufacturing in the circular production system. Subsequently, the impacts of remanufacturing are added up proportionately, which corresponds to add Cr-times the process for medical remanufacturing, as described in Figure 3 and the resulting life cycle inventory in Table 2. Since the collection of all catheters represents an ideal circular production system, we performed a sensitivity analysis regarding the collection rate (xc) between 0% and 100%. The results of this section are presented and interpreted in Section 3.2.
The modeling perspective described in this section allows taking the number of passed product cycles into account and takes a broader system perspective. Table 3 gives an overview of the two used modeling perspectives in this study. First, the LCA approach for modeling comparative LCAs of using either remanufactured or virgin-produced products. Second, the calculation of multiple product cycles by using the circularity metric in LCA modeling.

3. Results and Discussion

The results presented here reflect the analyzed impact categories of the used EF 3.0 methodology. As mentioned above, the interpretation of results focuses on the GWI and abiotic resource use of the selected methodology described in Section 2.1.3. Results of other EF 3.0 impact categories were also obtained for the medical remanufacturing and virgin production route for the supporter perspective and the used cut-off approach, but are not interpreted in detail in this study. The results of the supporter perspective without considering the circularity in multiple product cycles are discussed in the following Section 3.1, whereas the LCA results taking the circularity into account are presented in Section 3.2.

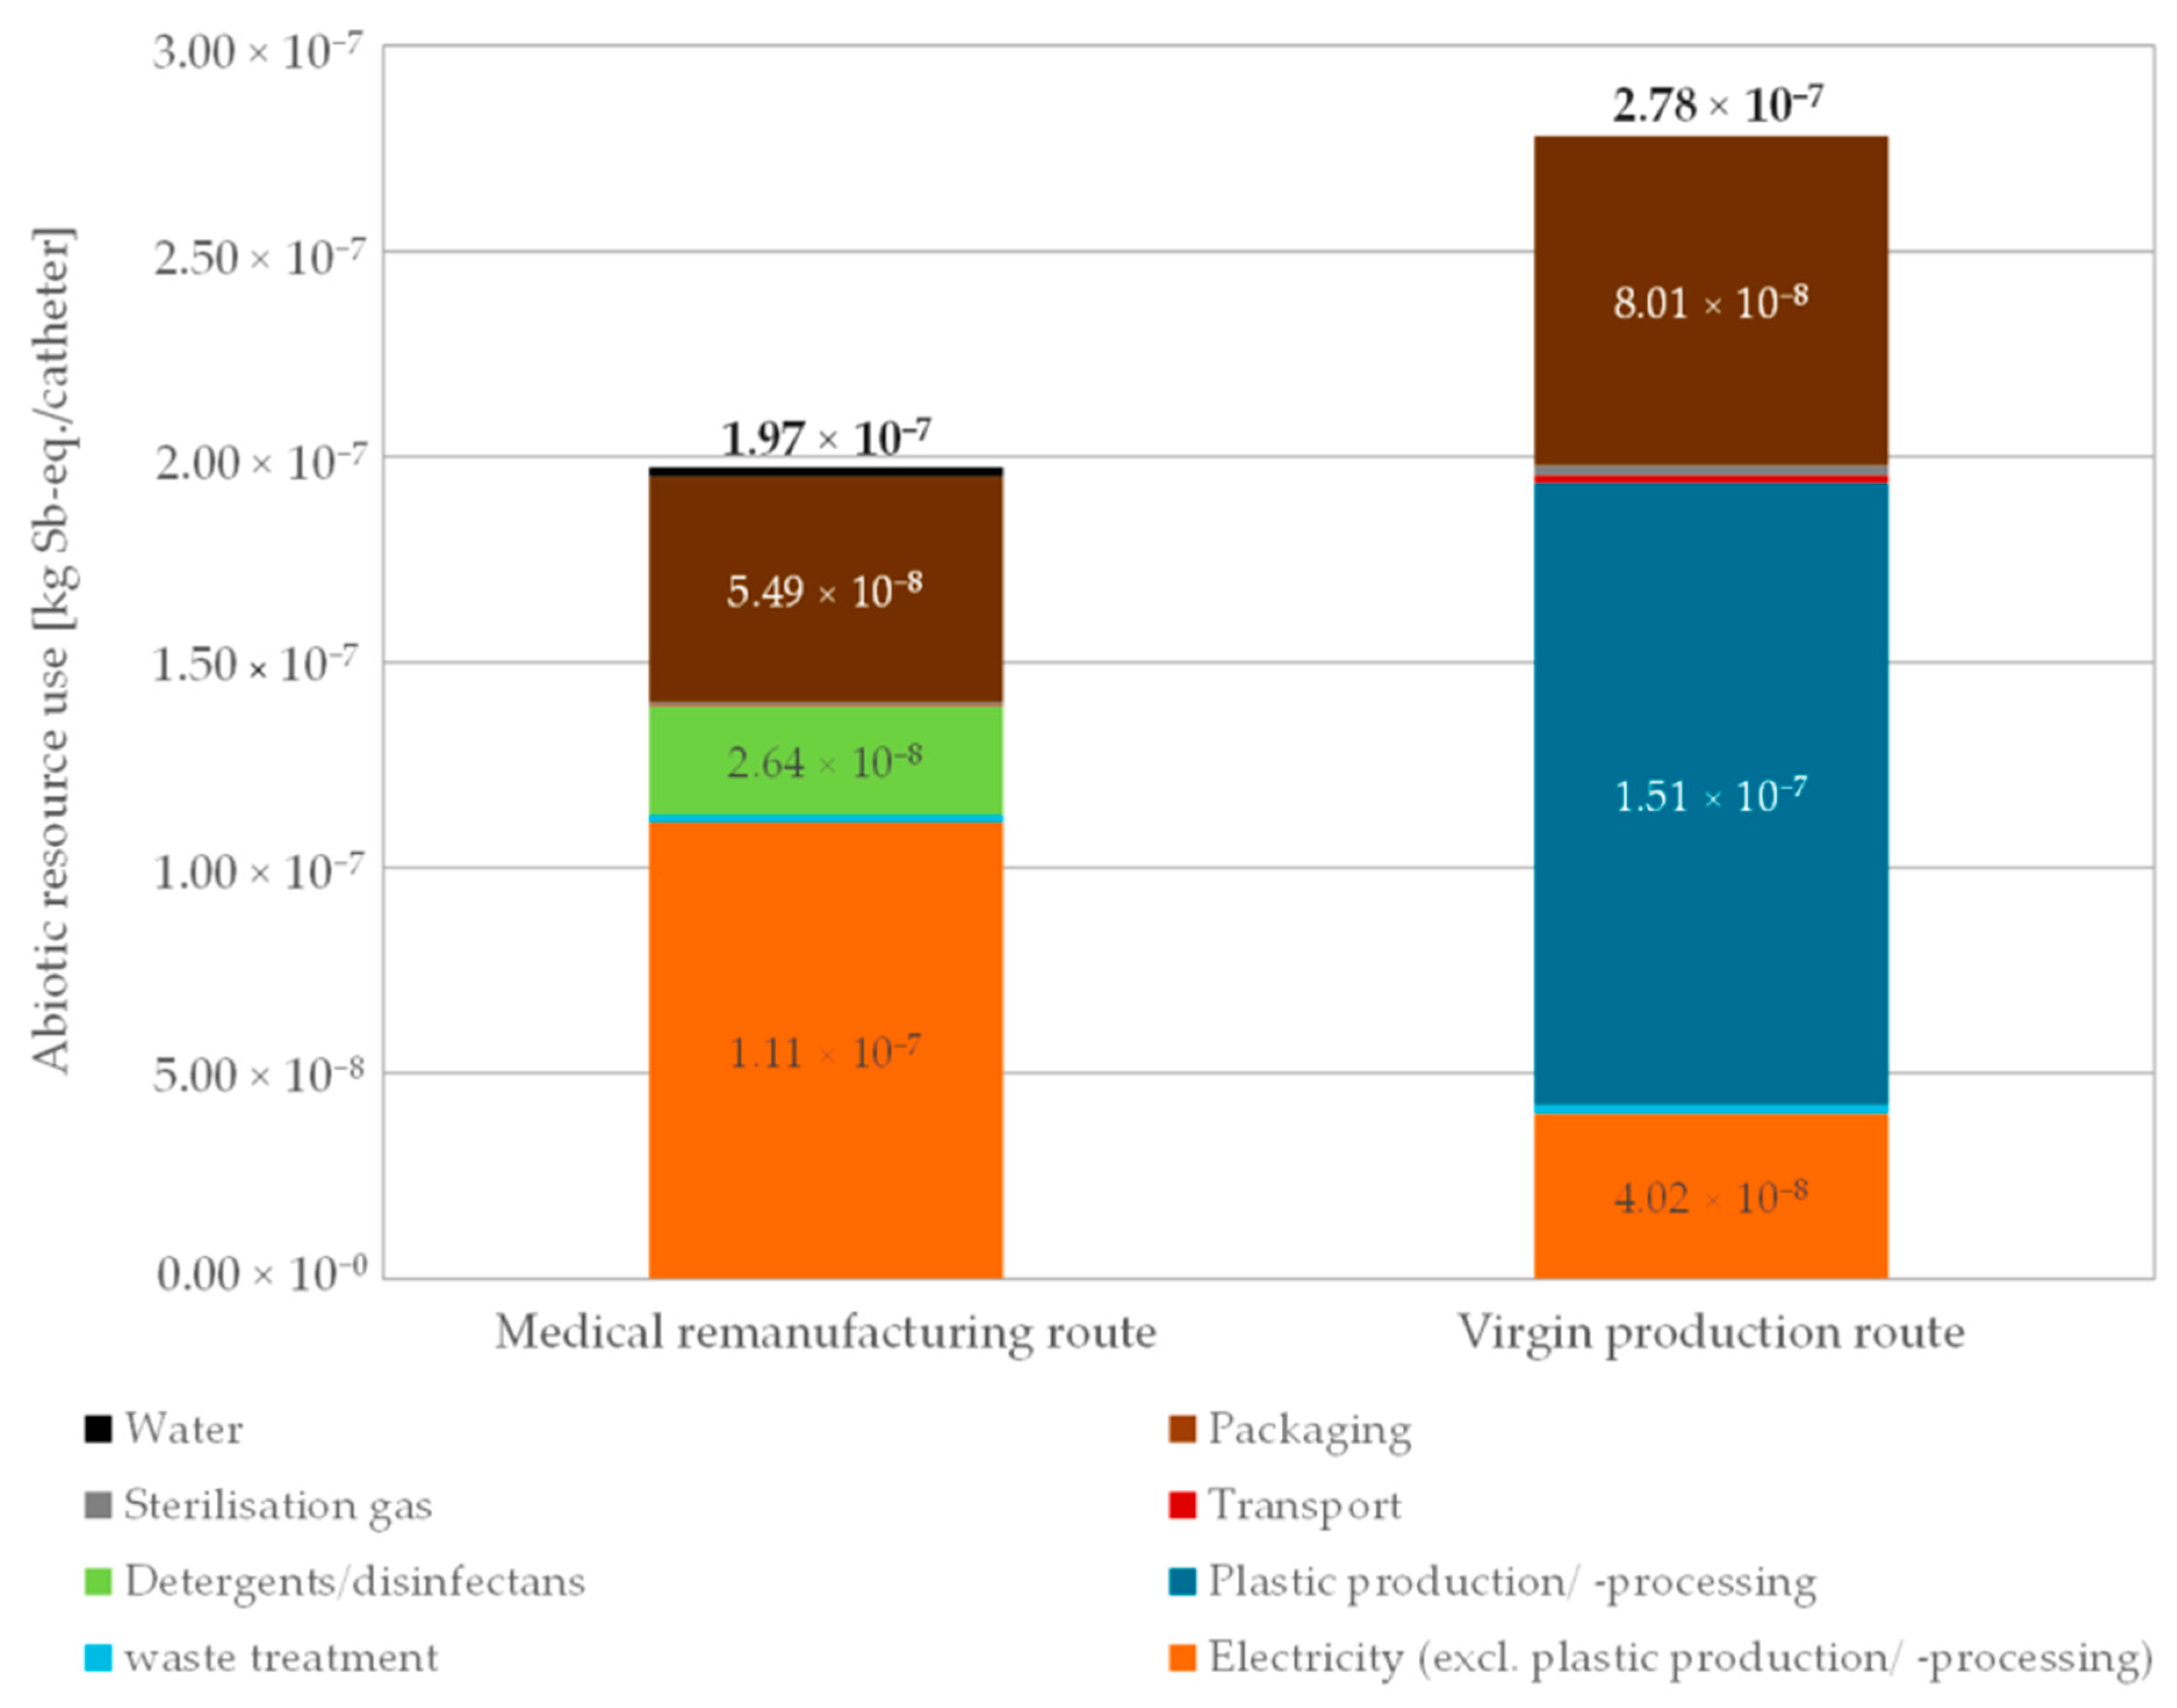
3.1. Environmental Impacts of the Medical Remanufacturing and Virgin Production Routes

According to the used cut-off approach, the provision and use of a catheter from virgin manufacturing are compared to the remanufacturing route. In order to interpret the results, recommendations for interpreting the results of a comparative LCA between remanufactured and newly-manufactured products will be used as proposed by Peters and Plevin et al. [27,70]. All calculated results of the EF 3.0 impact categories are listed in Table 4.
In 13 out of 16 calculated impact categories, we identified environmental benefits (>20%) of using a remanufactured catheter compared to a virgin catheter that is being disposed after single use. Environmental drawbacks were calculated in the categories eutrophication freshwater, land use, and water scarcity for the medical remanufacturing route compared to the virgin manufacturing route. The difference between medical remanufacturing and virgin production in water scarcity can be regarded as insignificant (<5%). The medical remanufacturing route has a 15.2% higher impact on land use and a 25.1% higher impact on eutrophication freshwater compared to virgin production. The higher impacts for the medical remanufacturing route in these two categories mainly result from the use of disinfectants and cleaning agents with active organic ingredients such as citric acid. Citric acid is often industrially produced by fermenting sugar-containing raw materials such as molasses and corn [71], which might need extensive land use and can cause eutrophication in freshwater. However, it must be considered that primary data for virgin production are missing, e.g., regarding the assembly process of the virgin-manufactured catheter. Due to a lower level of detail for the virgin production route, we expect that the calculated environmental impacts of the virgin production route tend to be underestimated compared to the medical remanufacturing route. In the following, the focus is set on the GWI and the abiotic resource use because these two impacts are most relevant and discussed in the CE context.
The impact category of climate change reflects global warming. The results show that using a remanufactured medical catheter has a lower impact on global warming (0.87 kg CO2-eq./catheter) than using a catheter from the virgin production route (1.75 kg CO2-eq./catheter) (see Figure 5). The calculated impacts are itemized according to the impacts resulting from using water, sterilization gas, detergents and disinfectants, packaging materials, electricity (excluding the used electricity for plastic production and processing) as well as resulting from waste treatment, transportation, and plastic production and processing (including used electricity) per provided catheter. The results of the analyses of both routes are additionally listed in the Supplementary Materials.
As shown in Figure 5, the production and processing of the plastics (dark blue) for producing a virgin catheter is most contributing to the GWI of using a newly-manufactured catheter for single-use (59.4%). The carbon footprint of the plastic production and processing for a newly-manufactured catheter (1.04 kg CO2-eq./catheter) is greater than the GWI of the entire medical remanufacturing process (0.87 kg CO2-eq./catheter). In the medical remanufacturing route, electricity consumption contributes the most to the GWI (34.5%), followed by waste treatment (32.0%) and packaging materials (18.2%). The GWI of the waste treatment (light blue) is similar for the medical remanufacturing (0.28 kg CO2-eq./catheter) and the new production (0.30 kg CO2-eq./catheter). The reason for this is the loss rate of the collected but not-remanufactured catheters in the medical remanufacturing process (47.9%). Approximately two catheters have to be collected for each remanufactured catheter. It follows that approximately one collected but rejected catheter for each remanufactured catheter is treated as waste. For each remanufactured catheter, approximately one catheter is treated as waste resulting in similar GWIs caused by waste treatment in both routes. The savings achieved by using a catheter from medical remanufacturing compared to virgin production are 0.88 kg CO2-eq./catheter or 50.4%. The findings suggest that the environmental benefits result from avoiding virgin plastic production and processing when using a virgin catheter. The contribution to the GWI from the transport (<2%) and sterilization process (<0.5%) are negligible in both manufacturing routes. The plastic PEI causes 56.9% of the GWI (90.9 wt.% per catheter) in the virgin production route. In the case of using a catheter from virgin production, the main contributing processes (>10% to the total GWI) plastics production and processing, electricity provision (excl. plastics production and processing), packaging materials, and waste treatment account for about 98.2% of the total GWI. In the medical remanufacturing route, the main contributing processes cause 98.1% of the GWI is caused (electricity provision, waste treatment of discarded catheters, packaging materials, and the use of cleaning and disinfecting agents).
The second analyzed impact category is abiotic resource use. Figure 6 shows that using a catheter from medical remanufacturing causes lower environmental impacts concerning abiotic resources (1.97 × 10⁻⁷ kg Sb-eq./catheter) than using a virgin-produced catheter (2.78 × 10⁻⁷ kg Sb-eq./catheter).
Figure 6 compares the use of abiotic resources when selecting a remanufactured medical catheter in contrast to a virgin catheter. When using a medical-remanufacturing catheter, the provision of electricity (1.11 × 10⁻⁷ kg Sb-eq./catheter), the use of packaging materials (5.49 × 10⁻⁸ kg Sb-eq./catheter) as well as cleaning detergents and disinfectants (2.64 × 10⁻⁸ kg Sb-eq./catheter) show the greatest contribution to the use of abiotic resources. In the medical remanufacturing route, electricity consumption contributes the most to the abiotic resource use (56.1%), followed by the use of packaging materials (27.8%). In the case of using a virgin-produced catheter, the greatest proportion of abiotic resource use results from virgin plastics production and processing of the catheter (1.51 × 10⁻⁷ kg Sb-eq./catheter) as well as the use of packaging materials (8.01 × 10⁻⁸ kg Sb-eq./catheter). In the virgin production route, the plastic production and processing is the main contributor and causes 54.5% of abiotic resource use. The medical remanufacturing route shows overall lower use of abiotic resources by 28.8% compared to virgin production. As no primary data are available for the virgin production process, the results of using a virgin-produced and single-used catheter are subjected to higher uncertainties compared to the remanufacturing route, where primary data were collected. Therefore, the impacts of the virgin production route tend to be conservatively estimated. The contribution to abiotic resource use through transport, use of sterilization gas, water, and waste treatment is low in both cases (all contributions are less than 1.1% in each route). As for the GWI, the plastic PEI processing and manufacture in the virgin production process (90.9 wt.% of the catheter) account for approximately 48.6% of the total abiotic resource use. Nevertheless, the relative savings in the abiotic resource use impact category (28.8%) are lower than in the GWI category (50.4%).

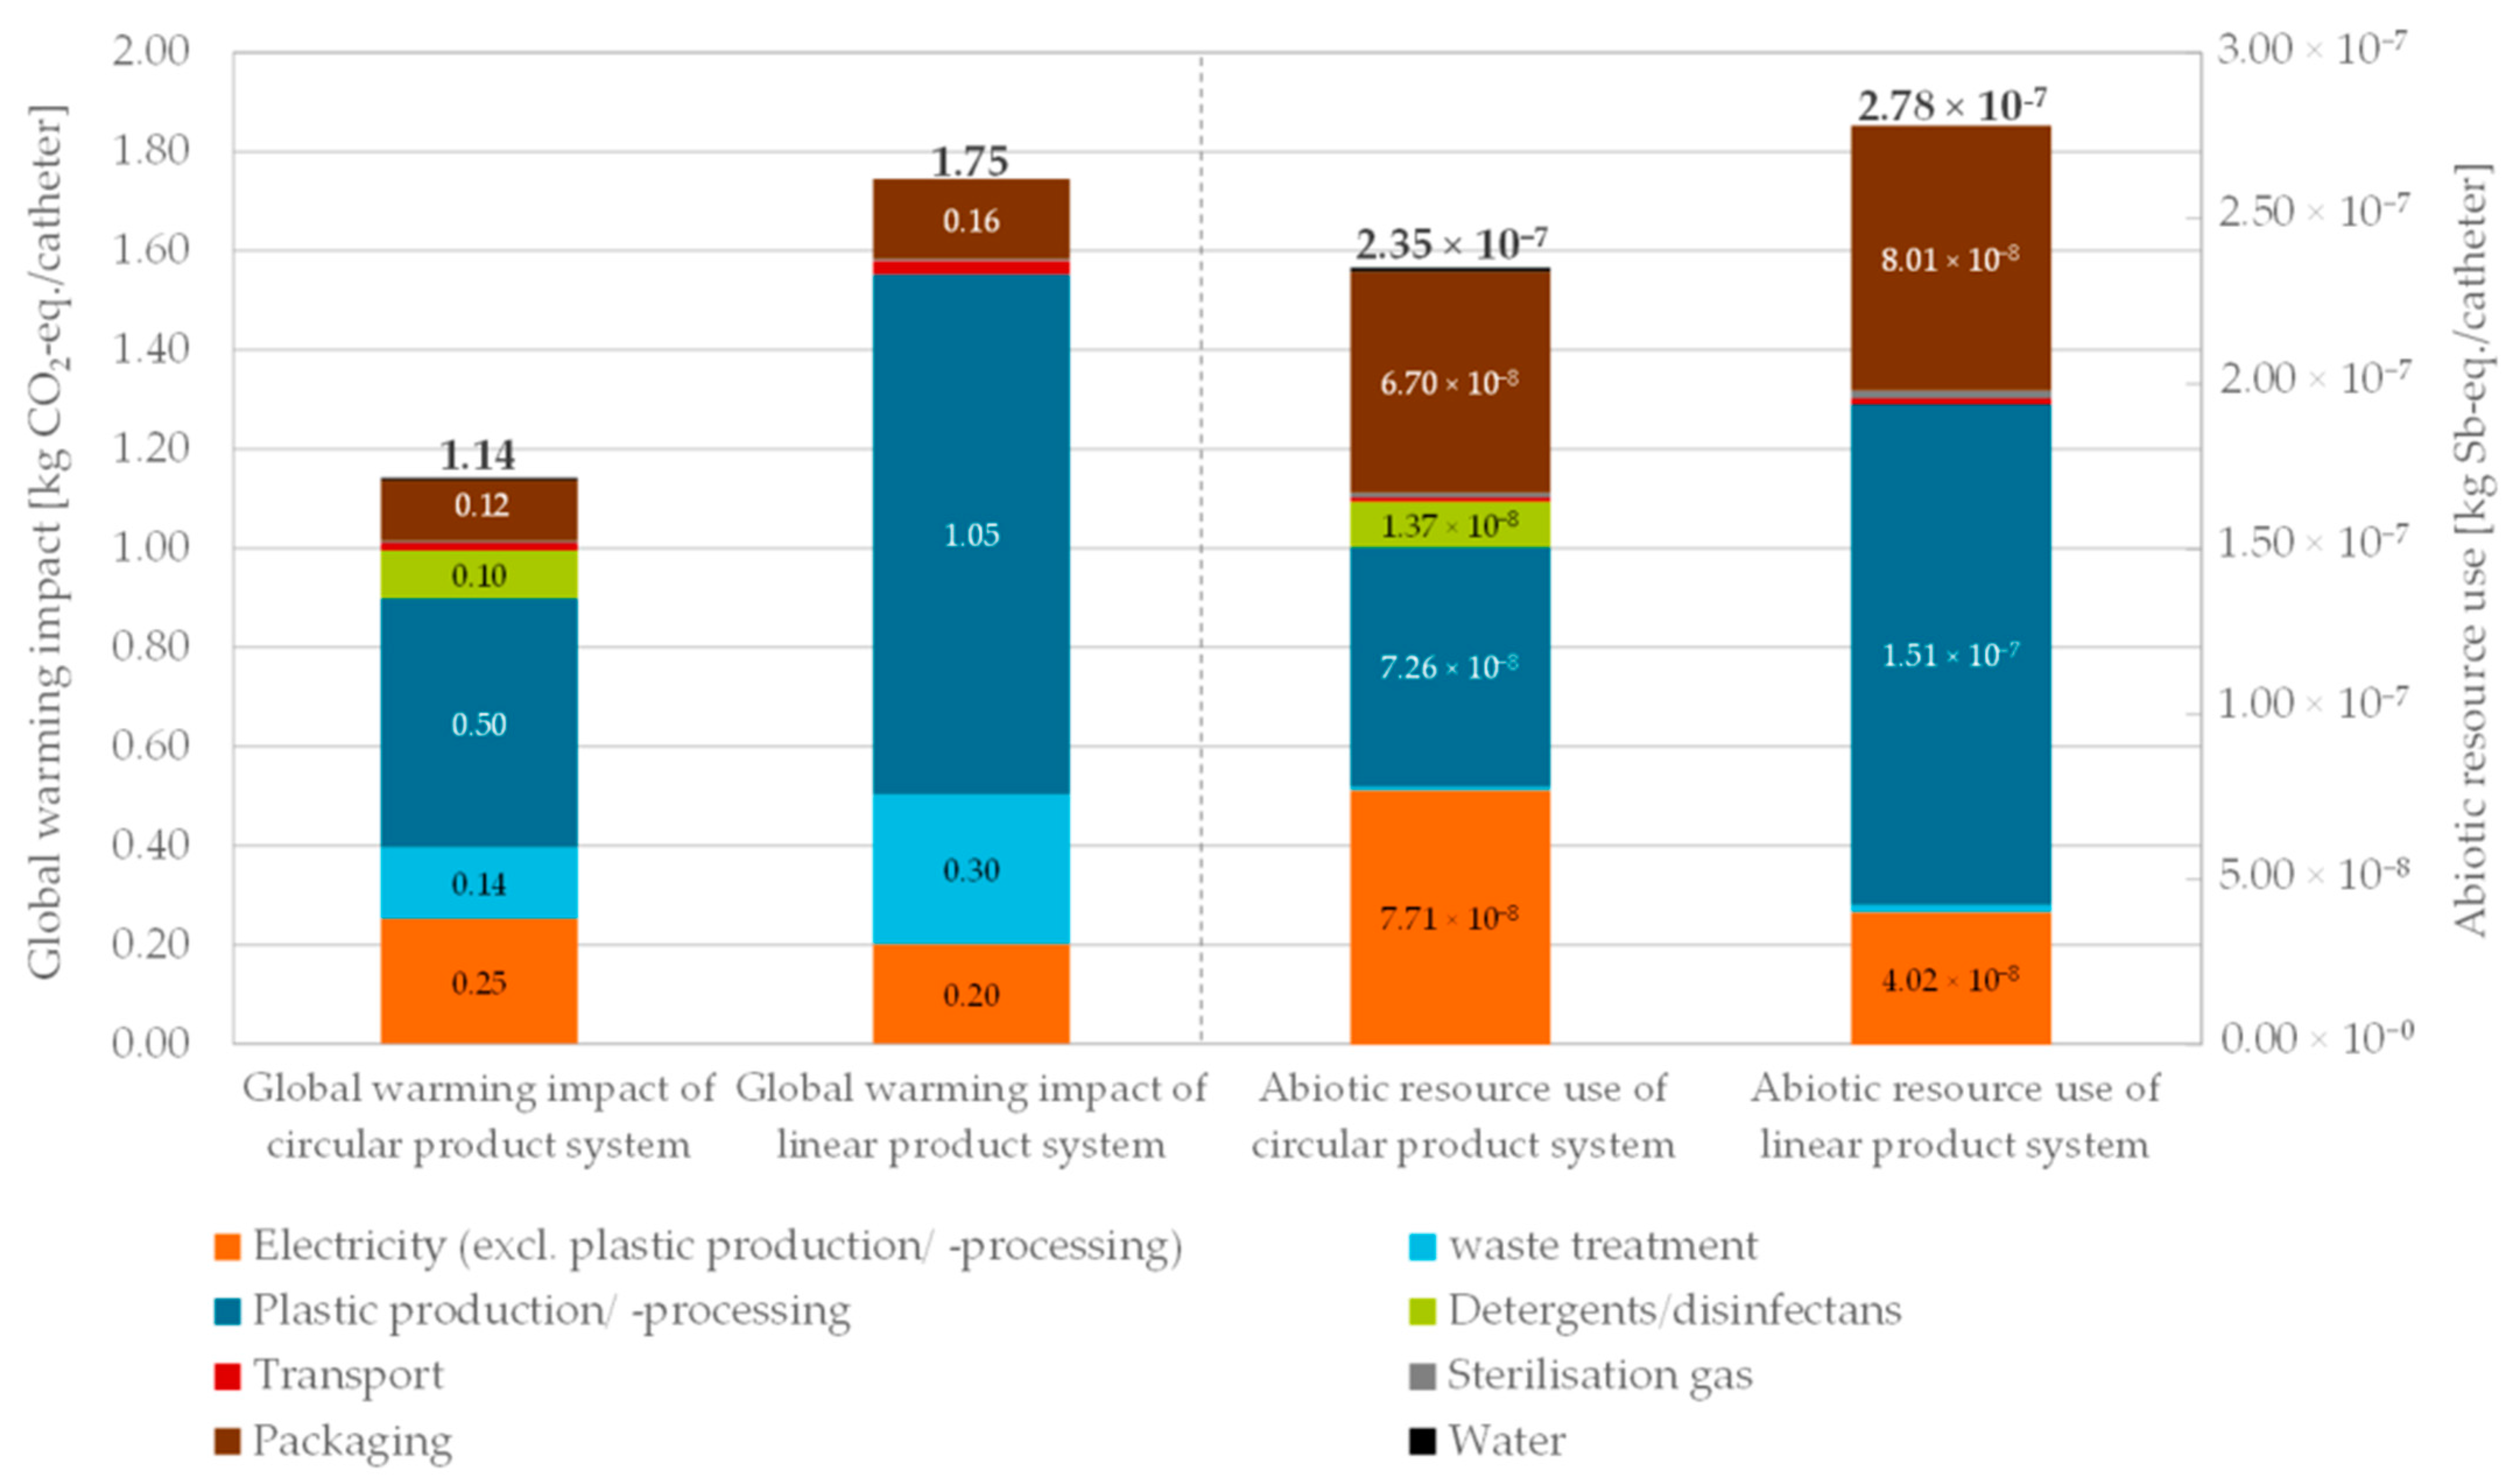
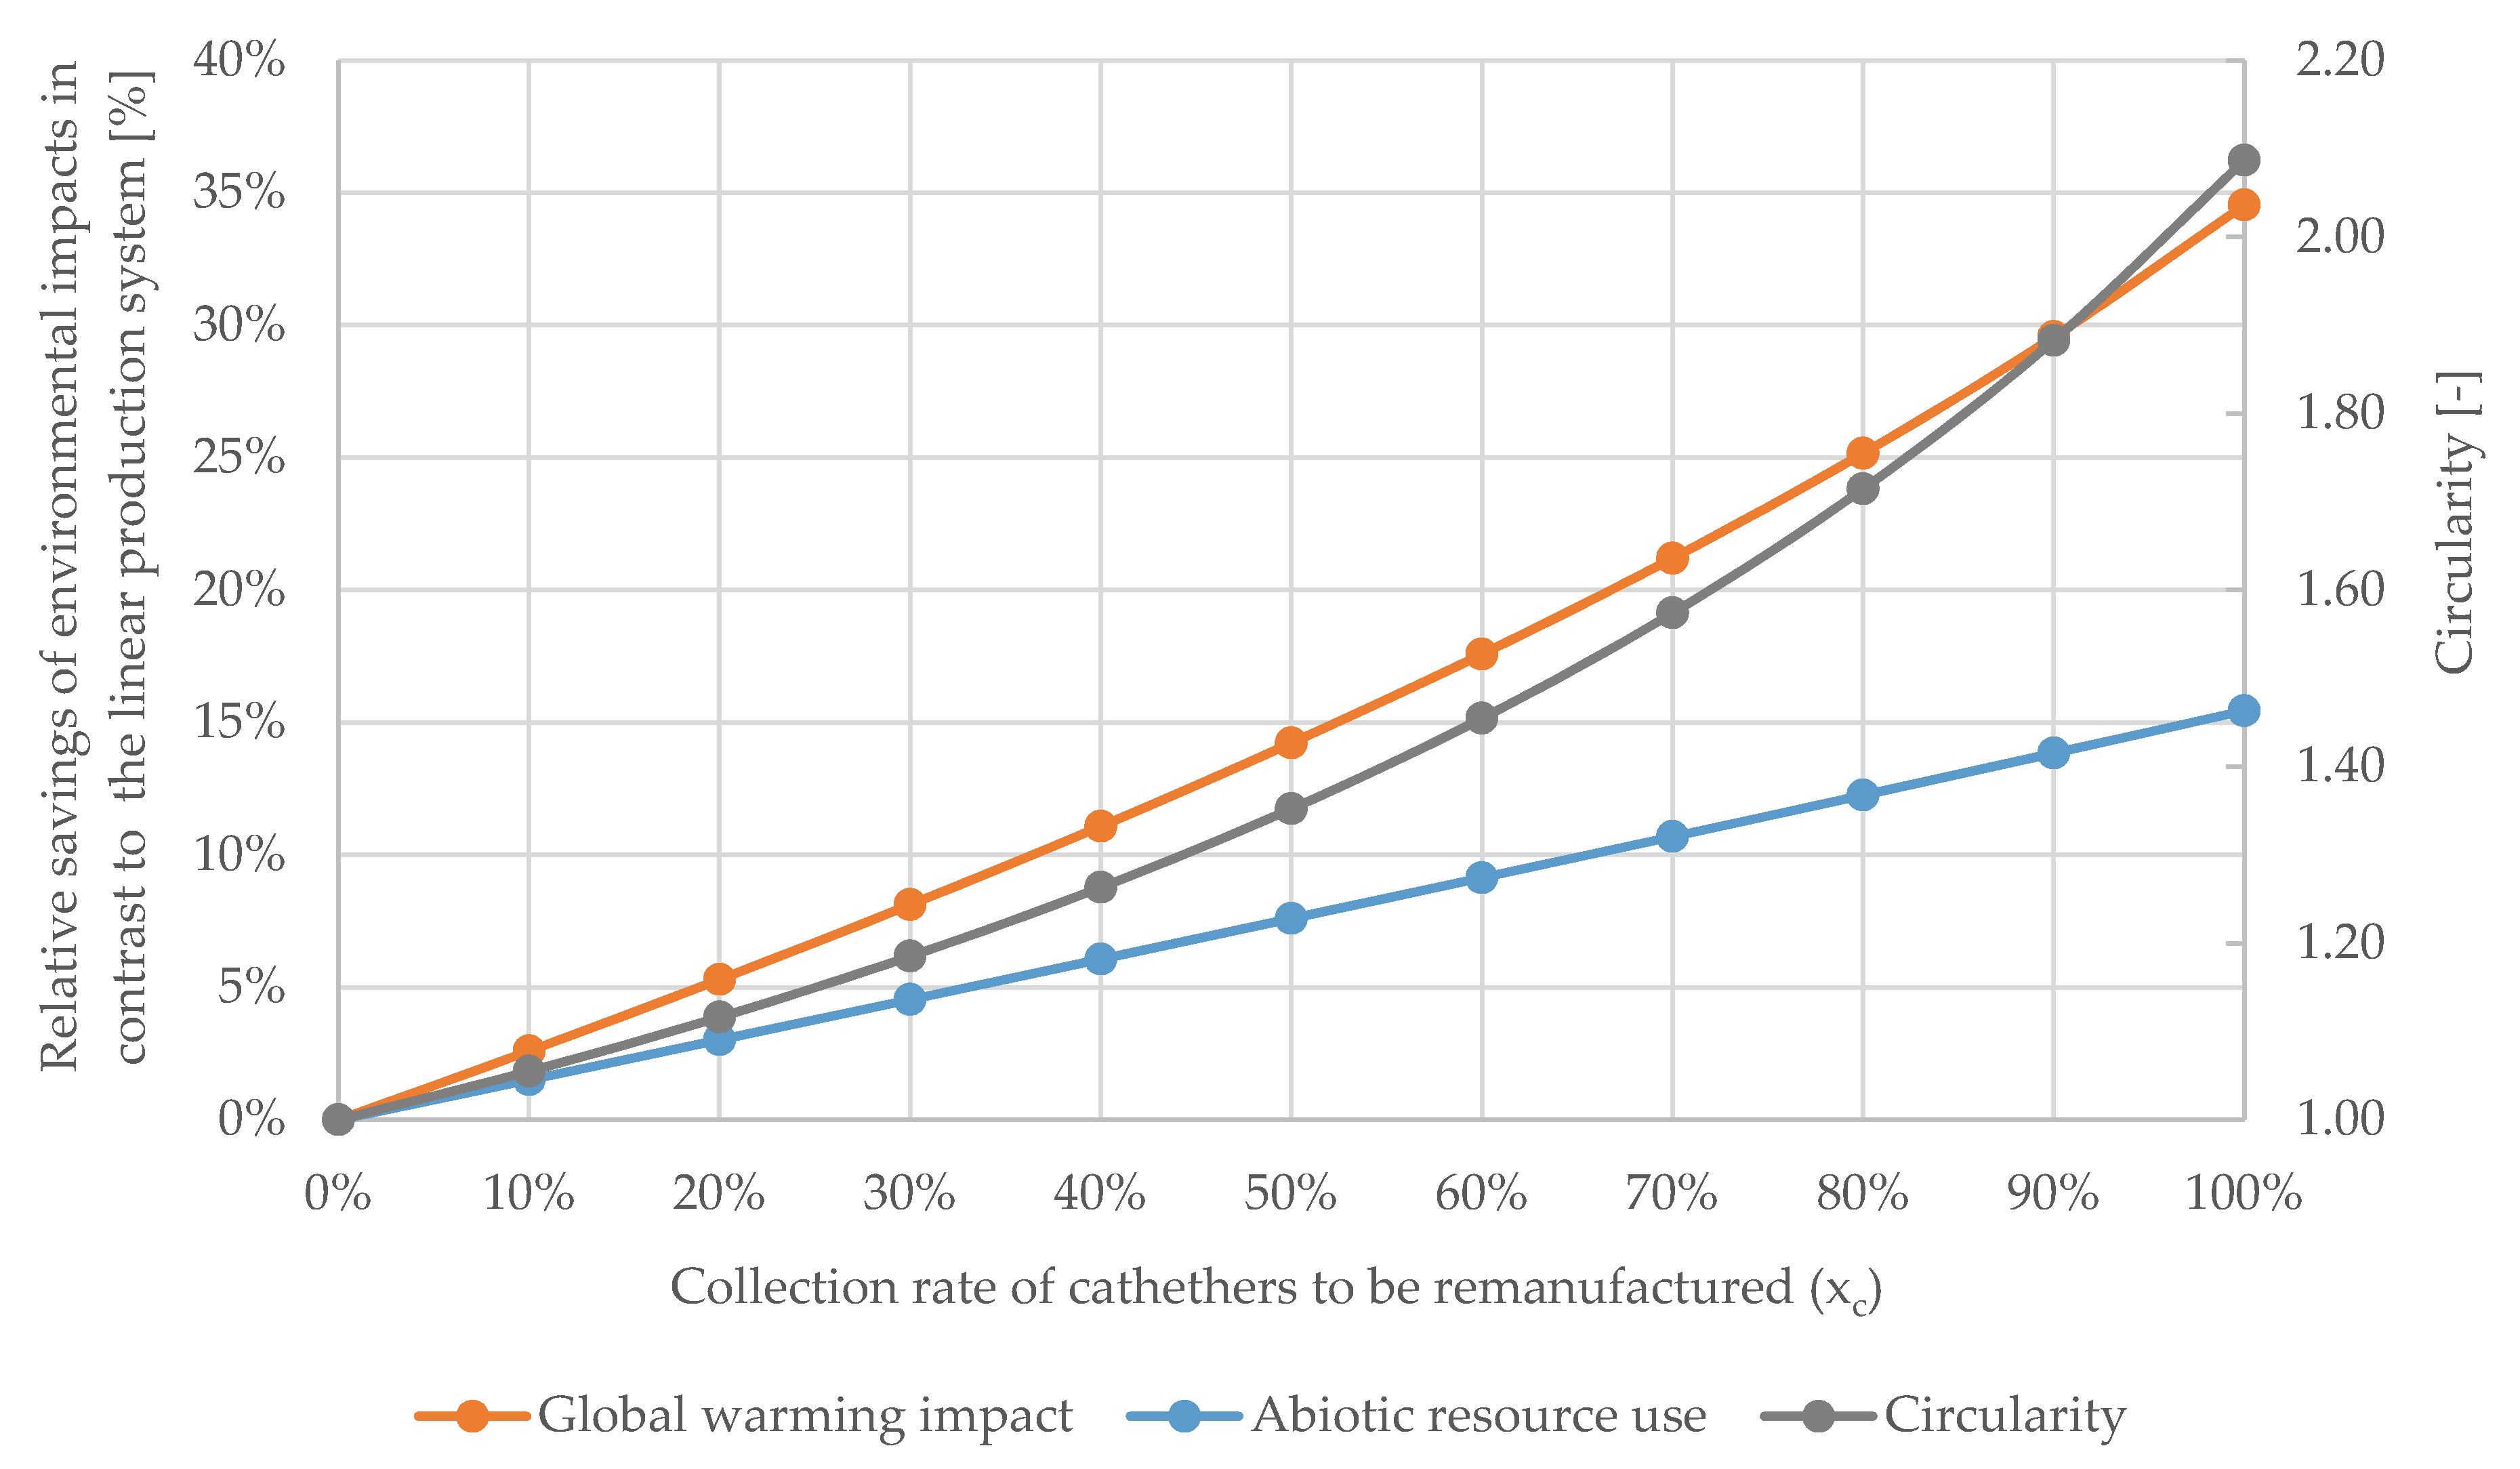
3.2. Results of Linking LCA and Circularity

In this section, the environmental impacts caused by a linear production system is compared to a circular production system where the remanufacturing of catheters takes place according to the analyzed remanufacturing process. According to the described method of combing the circularity metric from Figge et al. [32] and LCA, the impact assessment results show that savings can be achieved in the circular production system, including medical remanufacturing in both analyzed impact categories compared to the linear production system. In Figure 7, the results of the linear and circular production systems considering the GWI are depicted on the left primary y-axis and the results of the abiotic resource use are shown on the right secondary y-axis.
At first, the GWI results of the modeled circular and linear production system are explained (see the left side of Figure 7). Applying a fully circular production system would emit 1.14 kg CO2-eq./catheter, if all catheters are collected and remanufactured according to the analyzed remanufacturing process. The result of the linear production system corresponds to the result of the virgin manufacturing route in Section 3.1 (1.75 kg CO2-eq./catheter). In contrast to the results of a linear production system, where catheters are produced from virgin material and finally disposed after single-use, the circular production system generates a saving of 0.61 kg CO2-eq./catheter. Regarding the abiotic resource use on the right side of Figure 7, the circular production system shows an absolute impact of 2.35 × 10⁻⁷ kg Sb-eq./catheter. The abiotic resource use of the circular production system entails a relative saving of 4.30 × 10⁻⁸ kg Sb-eq./catheter compared to the linear production system. However, the absolute and relative savings of the compared production systems in Figure 7 are lower in both observed impact categories compared to the absolute and relative savings of the results in Section 3.1 (compare with Figure 5 and Figure 6). However, this section’s findings are suitable to be interpreted from a broader CE perspective, including multiple product cycles in the circular production system. It can be concluded that applying a collection and remanufacturing system for all pre-used catheters would result in GWI saving of 34.5% per catheter and abiotic resource use savings of 15.5% per catheter in contrast to a linear production system without remanufacturing in Germany.
As described above, these results are more meaningful to decision-makers, such as policymakers, comparing two possible production systems. Due to expanding the system boundaries to multiple product cycles instead of using a cut-off approach to investigate one life cycle, this section’s results depict the environmental impacts per catheter of a production system from a long-term perspective. The circularity metric allows to reflect the average number of passed cycles and normalize the results based on one passed product cycle to compare different production systems based on the same functional unit. The findings suggest which product system can be beneficial as a whole or how many times the product can be remanufactured from a more long-term perspective. Figure 7 shows that virgin material production is now also modeled upstream for remanufactured catheters in the circular production system, which allows a more comprehensive interpretation of the environmental benefits of implementing a remanufacturing process for catheters. The results suggest that the contribution to the GWI caused by the virgin plastic production can be reduced by 0.54 kg CO2-eq./catheter when the remanufacturing of a catheter is conducted according to the assumed medical remanufacturing process. The contribution to the GWI can be reduced by more than half relating to the virgin plastic production and processing (52.1%) by collecting all pre-used catheters in hospitals and remanufacturing them according to the assumed process several times. For abiotic resource use, a reduction of virgin plastic production contributes to 7.88 × 10⁻⁸ kg Sb eq./catheter, which corresponds to 52.1%. The finding of this section suggests that although remanufacturing causes additional impacts in the circular production system in both observed impact categories, mainly due to the use of detergents and disinfectants as well as additional electricity needed; these do not exceed the impacts from the savings in the primary production of the plastics for the newly-manufactured catheter.
The two scenarios (linear and circular production system) represent two reference values that reflect the environmental impacts in the analyzed impact categories if either none (0%) or all (100%) of the catheters are collected for medical remanufacturing. In reality, however, the collection rate of catheters for remanufacturing might be below 100%. Thus, in a particular economic area, the transformation from a linear to a circular production system might lie in-between the depicted values shown in Figure 7. In order to provide information for policy and other decision-makers, we conducted a sensitivity analysis varying the collection rate (xc) of the catheters from 0% to 100% and calculated the resulting relative savings in both analyzed impact categories (Figure 8).
Figure 8 shows that with an increasing collection rate (xc), the circularity of the catheters increases more strongly. The remanufacturing rate from collected catheters (xr) remains constant. Moreover, the relative saving of both analyzed impact categories increases more strongly with increasing collection rate, although less strongly than the circularity metric and hardly visible in Figure 8. In the Supplementary Material, second and third-degree polynomials were added in the form of a trend line including the associated coefficient of determination (R2) to quantify the increasing relative savings with increasing collection rate (see table sheet “sensitivity_analysis”). Although this increase is barely significant, especially for abiotic resource use, the conclusion can be drawn that the more catheters are collected for remanufacturing, the higher the relative savings in environmental impacts. The increasing correlation is explained by the variation in the collection rate and the consequent avoided waste treatment of virgin-produced catheters collected in the circular production system. As described above, due to the high loss of collected but rejected catheters, almost one catheter needs to be treated as waste per remanufactured catheter. For a remanufactured catheter, the waste treatment contribution to GWI is 0.02 kg CO2-eq./catheter lower than for the virgin manufactured catheters (compare with Figure 5). If the ratio of remanufactured catheters from collected catheters (xc) would increase, the exponential correlation between linear and circular production systems will increase when varying the collection rate.
In order to quantify the potential of reducing the GWI by establishing a collection and medical remanufacturing system for all catheters in Germany, we calculated the total savings of the analyzed environmental impact categories per year in Germany. Approximately 750,000 electrophysiology catheter interventions are conducted per year in Germany [72]. Assuming that one electrophysiology catheter is used per intervention and the environmental impact per catheter is always the same, collecting 100% of all used catheters in Germany for remanufacturing would result in a saving of 451.96 t CO2-eq./year (35.4% relative savings) in contrast to the linear production system (0% collection rate). Moreover, if 50% of all used catheters are collected for remanufacturing, a reduction of around 186.17 t CO2-eq./year could be realized compared to zero collection for remanufacturing (relative saving of 14.2%). Assuming a target of saving 100 t CO2-eq./year by applying a collection and remanufacturing system in Germany, approximately 28.4% of catheters need to be collected. These comparisons show that the transition to a circular production system in the field of medical remanufacturing for electrophysiology catheters allows significant reductions of greenhouse gas emissions.

3.3. Limitations of the Study

As described in the methodology section, methodological challenges exist in the goal and scope phase that need to be addressed with caution when conducting an LCA of remanufactured products [27]. The authors analyzed different perspectives when setting the system boundaries and modeling perspective in LCAs for remanufactured products. The authors distinguish between a supporter perspective and neutral perspective that could be taken when comparing remanufactured to newly-manufactured products while pointing out that both perspectives have been applied across LCAs. In this study, the results in Section 3.1 illustrate the supporter perspective and indicate the beneficial use of a remanufactured catheter compared to a newly-manufactured catheter from virgin material. In Section 3.2, we combined a circularity metric and LCA to interpret the results on a broader CE perspective by modeling a circular production system including remanufacturing and a linear production system where the catheter is disposed after single-use. Even though this modeling approach allows us to compare multiple product cycles in the investigated product systems, this is not in line with the proposed neutral perspective proposed by Peters [27]. Such a perspective would need multiple functional units and multiple alternative reference flow models and alternatives. The introduced approach including the circularity metric in Section 3.2 has not yet been used in LCAs for remanufactured products or other circular used products, such as reused or recycled products. However, we argue that this new approach could be used as an extended approach for the supporter perspective in order to interpret the results of a system perspective in the context of a CE.
Another limitation of this study is that we did not conduct a comprehensive interpretation of all covered environmental impact categories according to EF 3.0 method. However, the focus on the selected two impact categories, GWI and abiotic resource use, is regarded to be representative since 13 out of 16 impact categories show environmental benefits for the medical remanufacturing route including the two selected categories (compare Table 4). Possible drawbacks were calculated for the impact categories land use, water scarcity, and eutrophication freshwater, which might result from bio-based disinfectants and cleaning agents. As mentioned above, the impact results of the virgin production route are expected to be afflicted with higher uncertainties than the remanufacturing process. The virgin catheter was modeled according to the bill of materials. Due to missing data, e.g., the proper concentration of the filler of polyurethane or the weight of the shaft sleeve, the uncertainties in terms of completeness and reliability are assumed to be higher for the virgin manufactured catheter. Furthermore, missing US-specific datasets might cause a higher uncertainty in the flied of geographic correlation for the virgin production route. We expect that the impact results of the virgin production route could tend to be higher, but the results of the medical remanufacturing route are assumed to be more certain due to primary data. Therefore, it is questionable whether the environmental advantages of the virgin production in the categories land use, water scarcity and eutrophication could be revealed. Since we did not conduct an uncertainty analysis in this study, we cannot state the savings’ significance in the respective impact categories. However, we would like to point out that the analyzed results’ differences of GWI and abiotic resource use are greater than 10% in all analyzed product systems, and therefore the conclusions drawn by us are assumed to be robust.

4. Conclusions and Outlook

This study’s main goal was to conduct a comparative LCA of remanufactured and virgin-produced electrophysiology catheters to analyze the impacts of medical remanufacturing as a relevant CE strategy for medical products. Different perspectives can be considered when conducting a comparative LCA study of remanufactured and virgin products. To give a broad picture, we decided to model two different perspectives that provide different information for various decision-makers. First, the so-called “supporter perspective” was applied to analyze the environmental impacts of using a remanufactured catheter compared to a virgin manufactured catheter focusing on a short-term perspective of a single product life cycle. Secondly, we modeled a broader system perspective representing multiple product cycles on a long-term perspective using a circularity metric combined with LCA. We modeled a linear catheter production without remanufacturing and a circular production system, including its first life cycle from virgin material and further life cycles from the medical remanufacturing process.
Besides the environmental benefits of medical remanufacturing, the main result of this study is that both modeling perspectives can provide information for decision-makers, but for different audiences. The present case study shows that remanufacturing, as a CE strategy for electrophysiology catheters, leads to environmental benefits in both impact categories, climate change and abiotic resource use, on a short-term perspective. In addition, implementing a remanufacturing system for all pre-used catheters to contribute to the CE principle on a long-term and system perspective will support lowering the GWI and use of abiotic resources. The circular production system would result in the catheter being used on average 2.09 times and remanufacturing on average 1.09 times. A sensitivity analysis of the collection rate demonstrates that the relative savings increase more strongly with the increasing share of catheters collected for medical remanufacturing. We explained that the newly presented approach allows for the assessment of environmental impacts based on collection rates from a system perspective instead of focusing on a single product life cycle.
In the future, the newly introduced modeling approach, including a circularity metric, could be transferred to the needs of other products and sectors to analyze the impacts of implementing different CE strategies from a system perspective. For instance, this approach could be used for evaluating other characteristic parameters of the CE in further case studies, such as recycling rates. So far, the case study examined considers a single CE strategy, namely remanufacturing, and does not compare different CE strategies. As described above, remanufacturing might be the most eco-efficient CE strategy for most medical products. For other sectors and products, different CE strategies could be relevant as well. Future work will further develop the methodology for combining LCA and circularity as average passed product cycles, incorporating different CE strategies into one circularity metric. This enhanced methodology should address the challenges of different CE strategies and contributions to circularity, such as reuse, refurbishment, remanufacturing, or recycling. Since the CE provokes innovation, LCA and circularity assessment can be applied and referenced to ensure that innovations lead to decreased environmental impacts. Besides circularity, the longevity of products as well as the use intensity could also be relevant metrics for analyzing the contribution to the CE. In order to quantify the influence of product’s longevity and use intensity, indicators will be developed in future research and validated in case studies. Quantifying product circularity, longevity, and use intensity are seen as useful metrics in combination with LCA metrics to ensure an environmental benefit and not just any implementation of CE strategies.

Supplementary Materials

The following are available online at https://www.mdpi.com/2071-1050/13/2/898/s1, excel file: SI_catheters_LCI_LCIA.xlsx.

Author Contributions

Conceptualization, A.S.; data curation, A.S.; formal analysis, A.S.; Funding acquisition, A.S. and D.M.; investigation, A.S.; methodology, A.S. and N.T.; project administration, A.S.; software, A.S.; visualization, A.S.; writing—original draft, A.S.; writing—review & editing, D.M. and N.T. All authors have read and agreed to the published version of the manuscript.

Funding

This research and APC was funded in part by the Fraunhofer-Gesellschaft with sponsored research agreement with industry partner Vanguard AG, Germany.

Data Availability Statement

Data available within the article or its supplementary materials.

Acknowledgments

The life cycle analysis presented in this paper stems from the research conducted for the project for the European Medical Remanufacturer Vanguard AG from Germany. The Fraunhofer Institute for Environmental, Safety, and Energy Technology UMSICHT conducted this research with a sponsored research agreement with the industry partner Vanguard AG, Germany. The Vanguard AG provided the primary data for the medical remanufacturing route and the bill of materials for the investigated catheter. We would like to thank Vanguard AG for providing the data and for supporting the research.

Conflicts of Interest

The data for the provision of a catheter through medical remanufacturing was gathered from the company Vanguard AG in Germany. However, the Vanguard AG had no role in the design of the study, the analyses and the interpretation of data or in the writing of the manuscript. The authors declare no conflict of interest.

References

  1. Behrens, A.; Giljum, S.; Kovanda, J.; Niza, S. The material basis of the global economy. Ecol. Econ. 2007, 64, 444–453. [Google Scholar] [CrossRef]
  2. Ghisellini, P.; Cialani, C.; Ulgiati, S. A review on circular economy: The expected transition to a balanced interplay of environmental and economic systems. J. Clean. Prod. 2016, 114, 11–32. [Google Scholar] [CrossRef]
  3. Ellen MacArthur Foundation. Circularity Indicators. An Approach to Measuring Circularity: Methodology; Ellen MacArthur Foundation: Cowes, UK, 2015. [Google Scholar]
  4. Saidani, M.; Yannou, B.; Leroy, Y.; Cluzel, F.; Kendall, A. A taxonomy of circular economy indicators. J. Clean. Prod. 2019, 207, 542–559. [Google Scholar] [CrossRef] [Green Version]
  5. European Comission. Circular Economy Action Plan. For a Cleaner and More Competitive Europe; European Comission: Brussels, Belgium, 2020. [Google Scholar]
  6. Rizos, V.; Tuokko, K.; Behrens, A. The Circular Economy: A Review of Definitions, Processes and Impacts; Centre for European Policy Studies: Brussels, Belgium, 2017. [Google Scholar]
  7. Lüdeke-Freund, F.; Gold, S.; Bocken, N.M.P. A Review and Typology of Circular Economy Business Model Patterns. J. Ind. Ecol. 2019, 23, 36–61. [Google Scholar] [CrossRef] [Green Version]
  8. Stewart, R.; Niero, M. Circular economy in corporate sustainability strategies: A review of corporate sustainability reports in the fast-moving consumer goods sector. Bus. Strat. Environ. 2018, 27, 1005–1022. [Google Scholar] [CrossRef] [Green Version]
  9. Millar, N.; McLaughlin, E.; Börger, T. The Circular Economy: Swings and Roundabouts? Ecol. Econ. 2019, 11–19. [Google Scholar] [CrossRef] [Green Version]
  10. Djuric Ilic, D.; Eriksson, O.; Ödlund, L.; Åberg, M. No zero burden assumption in a circular economy. J. Clean. Prod. 2018, 182, 352–362. [Google Scholar] [CrossRef]
  11. Blomsma, F.; Brennan, G. The Emergence of Circular Economy: A New Framing around Prolonging Resource Productivity. J. Ind. Ecol. 2017, 21, 603–614. [Google Scholar] [CrossRef]
  12. Ellen MacArthur Foundation. Towards the Circular Economy. Economic and Business Rationale for an Accelerated Transition; Ellen MacArthur Foundation: Cowes, UK, 2013. [Google Scholar]
  13. Kirchherr, J.; Reike, D.; Hekkert, M. Conceptualizing the circular economy: An analysis of 114 definitions. Resour. Conserv. Recycl. 2017, 127, 221–232. [Google Scholar] [CrossRef]
  14. U.S. Food and Drug Administration. Medical Devices; Reprocessed Single-Use Devices; Termination of Exemptions from Premarket Notification; Requirement for Submission of Validation Data: List of SUDs Known to Be Reprocessed or Considered for Reprocessing (Attachment 1). Federal Register, 29 September 2005. [Google Scholar]
  15. Potting, J.; Hekkert, M.; Worrell, E.; Hanemaaijer, A. Circular Economy: Measuring Innovation in the Product Chain; PBL Publishers: Netherlands Environmental Assessment Agency, The Hague, The Netherlands, 2017. [Google Scholar]
  16. British Standards Institution. Framework for Implementing the Principles of the Circular Economy in Organizations—Guide; BSI: Frankfurt am Main, Germany, 2017; ISBN 9780580926440. [Google Scholar]
  17. Gopinath, K.P.; Nagarajan, V.M.; Krishnan, A.; Malolan, R. A critical review on the influence of energy, environmental and economic factors on various processes used to handle and recycle plastic wastes: Development of a comprehensive index. J. Clean. Prod. 2020, 274, 123031. [Google Scholar] [CrossRef]
  18. De Decker, K. How Circular Is the Circular Economy? Available online: https://www.lowtechmagazine.com/2018/11/how-circular-is-the-circular-economy.html (accessed on 5 January 2021).
  19. D’Adamo, I.; Rosa, P. Remanufacturing in industry: Advices from the field. Int. J. Adv. Manuf. Technol. 2016, 86, 2575–2584. [Google Scholar] [CrossRef]
  20. Eze, S.; Ijomah, W.; Wong, T.C. Remanufacturing: A potential sustainable solution for increasing medical equipment availability. J. Remanuf. 2020, 10, 141–159. [Google Scholar] [CrossRef] [Green Version]
  21. Lee, C.-M.; Woo, W.-S.; Roh, Y.-H. Remanufacturing: Trends and issues. Int. J. Precis. Eng. Manuf. Green Technol. 2017, 4, 113–125. [Google Scholar] [CrossRef]
  22. Krystofik, M.; Wagner, J.; Gaustad, G. Leveraging intellectual property rights to encourage green product design and remanufacturing for sustainable waste management. Resour. Conserv. Recycl. 2015, 97, 44–54. [Google Scholar] [CrossRef]
  23. Shen, W.; Pang, K.; Liu, C.; Ge, M.; Zhang, Y.; Wang, X. The quality control method for remanufacturing assembly based on the Jacobian-torsor model. Int. J. Adv. Manuf. Technol. 2015, 81, 253–261. [Google Scholar] [CrossRef]
  24. Schau, E.M.; Traverso, M.; Lehmann, A.; Finkbeiner, M. Life Cycle Costing in Sustainability Assessment—A Case Study of Remanufactured Alternators. Sustainability 2011, 3, 2268–2288. [Google Scholar] [CrossRef] [Green Version]
  25. Krystofik, M.; Luccitti, A.; Parnell, K.; Thurston, M. Adaptive remanufacturing for multiple lifecycles: A case study in office furniture. Resour. Conserv. Recycl. 2018, 135, 14–23. [Google Scholar] [CrossRef]
  26. International Organization for Standardization (ISO). Environmental Management—Life Cycle Assessment—Requirements and Guidelines; 13.020.10 (14044); International Organization for Standardization: Geneva, Switzerland, 2006. [Google Scholar]
  27. Peters, K. Methodological issues in life cycle assessment for remanufactured products: A critical review of existing studies and an illustrative case study. J. Clean. Prod. 2016, 126, 21–37. [Google Scholar] [CrossRef]
  28. Zhang, X.; Zhang, M.; Zhang, H.; Jiang, Z.; Liu, C.; Cai, W. A review on energy, environment and economic assessment in remanufacturing based on life cycle assessment method. J. Clean. Prod. 2020, 255, 120160. [Google Scholar] [CrossRef]
  29. Schau, E.M.; Traverso, M.; Finkbeiner, M. Life cycle approach to sustainability assessment: A case study of remanufactured alternators. J. Remanuf. 2012. [Google Scholar] [CrossRef] [Green Version]
  30. Liu, Z.; Li, T.; Jiang, Q.; Zhang, H. Life Cycle Assessment-based Comparative Evaluation of Originally Manufactured and Remanufactured Diesel Engines. J. Ind. Ecol. 2014, 18, 567–576. [Google Scholar] [CrossRef]
  31. Vanguard AG. Information Provided by the Vanguard AG; Vanguard AG: Berlin, Germany, 2020. [Google Scholar]
  32. Figge, F.; Thorpe, A.S.; Givry, P.; Canning, L.; Franklin-Johnson, E. Longevity and Circularity as Indicators of Eco-Efficient Resource Use in the Circular Economy. Ecol. Econ. 2018, 150, 297–306. [Google Scholar] [CrossRef]
  33. International Organization for Standardization (ISO). Environmental Management—Life Cycle Assessment—Principles and Framework; 13.020.10 (14040); ISO: Geneva, Switzerland, 2009. [Google Scholar]
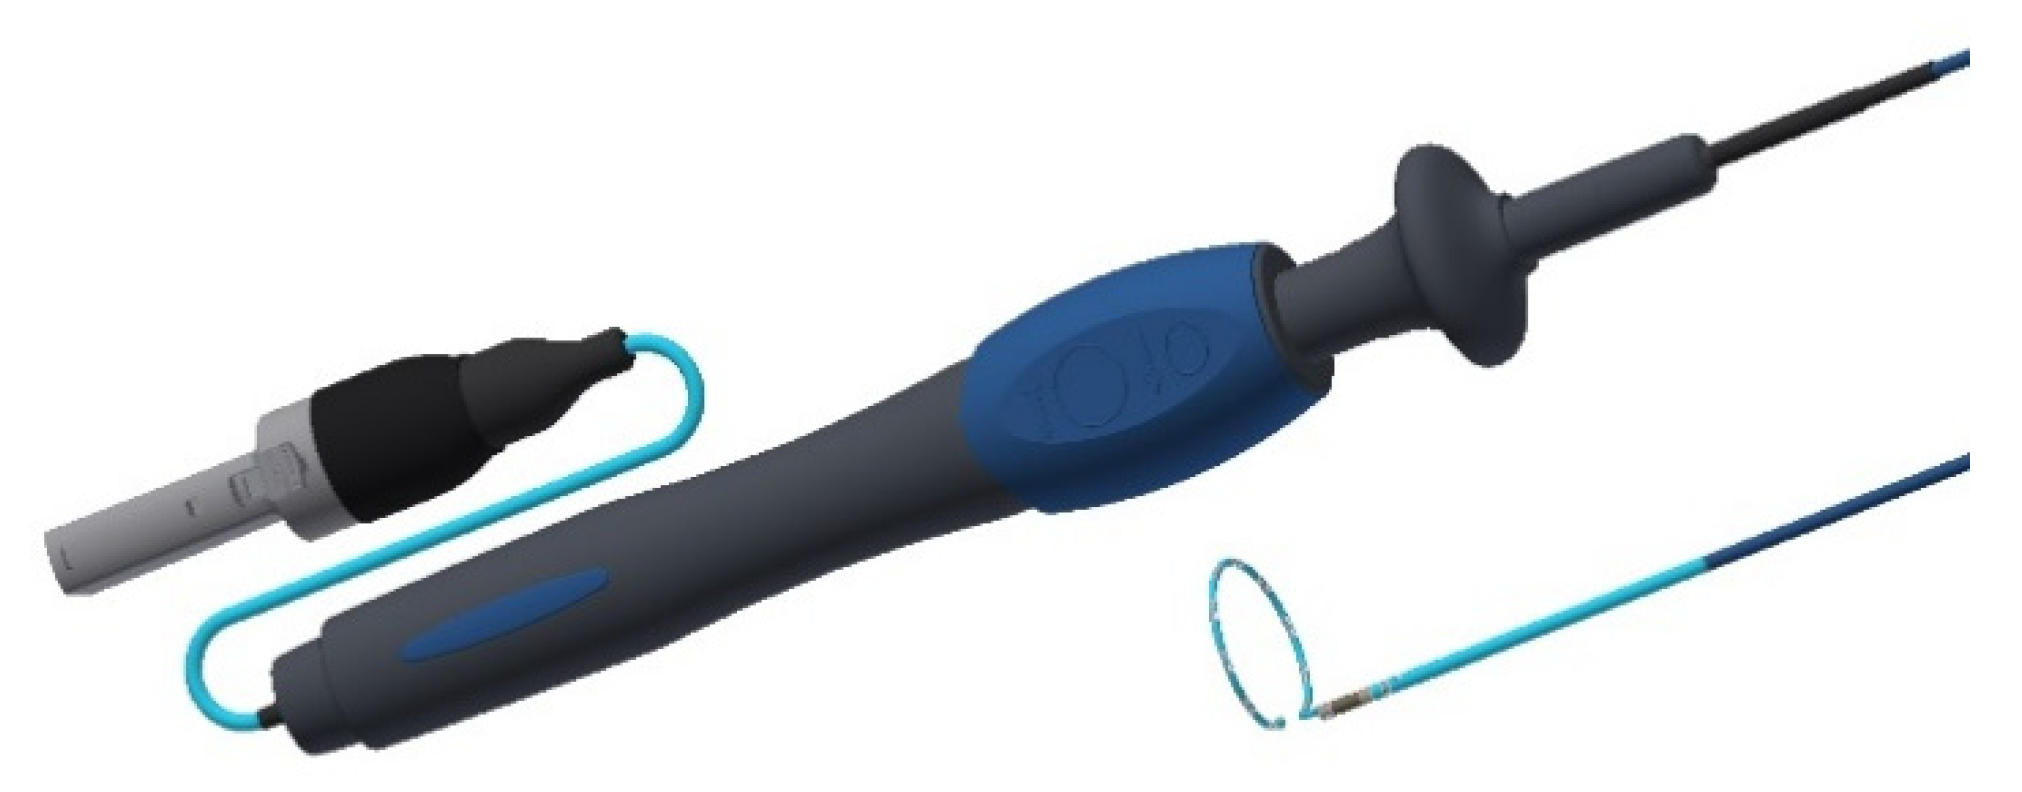
  34. Vanguard AG. Picture of Electrophysiological Diagnostic Catheter; Vanguard AG: Berlin, Germany, 2020. [Google Scholar]
  35. Berufsgenossenschaft für Gesundheitsdienst und Wohlfahrtspflege. Abfallentsorgung. Informationen zur Sicheren Entsorgung von Abfällen im Gesundheitsdienst; Berufsgenossenschaft für Gesundheitsdienst und Wohlfahrtspflege: Hamburg, Germany, 2019; Available online: https://www.bgw-online.de/SharedDocs/Downloads/DE/Medientypen/BGW%20Broschueren/BGW09-19-000_Abfallentsorgung_Download.pdf?__blob=publicationFile (accessed on 1 July 2020).
  36. U.S. Food and Drug Administration. Ethylene Oxide Sterilization for Medical Devices. Available online: https://www.fda.gov/medical-devices/general-hospital-devices-and-supplies/ethylene-oxide-sterilization-medical-devices (accessed on 6 January 2021).
  37. Wernet, G.; Bauer, C.; Steubing, B.; Reinhard, J.; Moreno-Ruiz, E.; Weidema, B. The ecoinvent database version 3 (part I): Overview and methodology. Int. J. Life Cycle Assess. 2016, 21, 1218–1230. [Google Scholar] [CrossRef]
  38. Thinkstep. GaBi Software-System and Database for Life Cycle Engineering: DB Version 40. Available online: http://www.gabi-software.com/international/databases/ (accessed on 29 April 2016).
  39. Car, A. Polyether Block Amide (PEBAX). In Encyclopedia of Membranes; Drioli, E., Giorno, L., Eds.; Springer: Berlin/Heidelberg, Germany, 2016; pp. 1–2. ISBN 978-3-642-40872-4. [Google Scholar]
  40. Zampori, L.; Pant, R. Suggestions for Updating the Product Environmental Footprint (PEF) Method; EUR 29682 EN. 2019. Available online: https://ec.europa.eu/jrc (accessed on 30 November 2020).
  41. Moraga, G.; Huysveld, S.; Mathieux, F.; Blengini, G.A.; Alaerts, L.; van Acker, K.; de Meester, S.; Dewulf, J. Circular economy indicators: What do they measure? Resour. Conserv. Recycl. 2019, 146, 452–461. [Google Scholar] [CrossRef]
  42. Elia, V.; Gnoni, M.G.; Tornese, F. Measuring circular economy strategies through index methods: A critical analysis. J. Clean. Prod. 2017, 142, 2741–2751. [Google Scholar] [CrossRef]
  43. Banaitê, D. Towards Circular Economy: Analysis of Indicators in the Context of Sustainable Development. Soc. Transform. Contemp. Soc. 2016, 4, 142–150. [Google Scholar]
  44. Camacho-Otero, J.; Boks, C.; Pettersen, I. Consumption in the Circular Economy: A Literature Review. Sustainability 2018, 10, 2758. [Google Scholar] [CrossRef] [Green Version]
  45. Corona, B.; Shen, L.; Reike, D.; Carreón, J.R.; Worrell, E. Towards sustainable development through the circular economy—A review and critical assessment on current circularity metrics. Resour. Conserv. Recycl. 2019, 151, 104498. [Google Scholar] [CrossRef]
  46. EASAC. Indicators for a Circular Economy; EASAC Secretariat Deutsche Akademie der Naturforscher Leopoldina: Halle (Saale), Germany, 2016; ISBN 9783804736801. [Google Scholar]
  47. Helander, H.; Petit-Boix, A.; Leipold, S.; Bringezu, S. How to monitor environmental pressures of a circular economy: An assessment of indicators. J. Ind. Ecol. 2019, 139, 1011. [Google Scholar] [CrossRef]
  48. Howard, M.; Hopkinson, P.; Miemczyk, J. The regenerative supply chain: A framework for developing circular economy indicators. Int. J. Prod. Res. 2019, 57, 7300–7318. [Google Scholar] [CrossRef] [Green Version]
  49. Iacovidou, E.; Velis, C.A.; Purnell, P.; Zwirner, O.; Brown, A.; Hahladakis, J.; Millward-Hopkins, J.; Williams, P.T. Metrics for optimising the multi-dimensional value of resources recovered from waste in a circular economy: A critical review. J. Clean. Prod. 2017, 166, 910–938. [Google Scholar] [CrossRef]
  50. Ioannidou, D.; Heeren, N.; Sonnemann, G.; Habert, G. The future in and of criticality assessments. J. Ind. Ecol. 2019, 23, 751–766. [Google Scholar] [CrossRef]
  51. Jain, S.; Jain, N.K.; Metri, B. Strategic framework towards measuring a circular supply chain management. Benchmarking 2018, 25, 3238–3252. [Google Scholar] [CrossRef]
  52. Janik, A.; Ryszko, A. [Duplikat] Circular economy in companies: An analysis of selected indicators from a managerial perspective. Multidiscip. Asp. Prod. Eng. 2019, 2, 523–535. [Google Scholar] [CrossRef] [Green Version]
  53. Mayer, A.; Haas, W.; Wiedenhofer, D.; Krausmann, F.; Nuss, P.; Blengini, G.A. Measuring Progress towards a Circular Economy: A Monitoring Framework for Economy-wide Material Loop Closing in the EU28. J. Ind. Ecol. 2019, 23, 62–76. [Google Scholar] [CrossRef] [Green Version]
  54. Mishra, S.; Singh, S.P.; Johansen, J.; Cheng, Y.; Farooq, S. Evaluating indicators for international manufacturing network under circular economy. Manag. Decis. 2019, 57, 811–839. [Google Scholar] [CrossRef]
  55. Moriguchi, Y. Material flow indicators to measure progress toward a sound material-cycle society. J. Mater. Cycles Waste Manag. 2007, 9, 112–120. [Google Scholar] [CrossRef]
  56. Parchomenko, A.; Nelen, D.; Gillabel, J.; Rechberger, H. Measuring the circular economy—A Multiple Correspondence Analysis of 63 metrics. J. Clean. Prod. 2019, 210, 200–216. [Google Scholar] [CrossRef]
  57. Pauliuk, S. [Duplikat] Critical appraisal of the circular economy standard BS 8001:2017 and a dashboard of quantitative system indicators for its implementation in organizations. Resour. Conserv. Recycl. 2018, 129, 81–92. [Google Scholar] [CrossRef]
  58. Sheldon, R.A. Metrics of Green Chemistry and Sustainability: Past, Present and Future. ACS Publ. 2017, 6. [Google Scholar] [CrossRef] [Green Version]
  59. Saidani, M. How to Assess Product Performance in the Circular Economy? Proposed Requirements for the Design of a Circularity Measurement Framework. Recycling 2017, 2, 6. [Google Scholar] [CrossRef] [Green Version]
  60. Walker, S.; Coleman, N.; Hodgson, P.; Collins, N.; Brimacombe, L. Evaluating the Environmental Dimension of Material Efficiency Strategies Relating to the Circular Economy. Sustainability 2018, 10, 666. [Google Scholar] [CrossRef] [Green Version]
  61. World Business Council for Sustainable Development (WBCSD). Circular Metrics Landscape Analysis. A Joint Report on the Current Landscape of Circular Metrics Use and Recommendations for a Common Measurement Framework; WBCSD: Geneva, Switzerland, 2018. [Google Scholar]
  62. Niero, M.; Kalbar, P.P. Coupling material circularity indicators and life cycle based indicators: A proposal to advance the assessment of circular economy strategies at the product level. Resour. Conserv. Recycl. 2019, 140, 305–312. [Google Scholar] [CrossRef]
  63. Spierling, S.; Venkatachalam, V.; Behnsen, H.; Herrmann, C.; Endres, H.-J. Bioplastics and Circular Economy—Performance Indicators to Identify Optimal Pathways. In Progress in Life Cycle Assessment; Schebek, L., Herrmann, C., Cerdas, F., Eds.; Springer International Publishing: Cham, Switerland, 2019; pp. 147–154. ISBN 978-3-319-92236-2. [Google Scholar]
  64. Huysman, S.; de Schaepmeester, J.; Ragaert, K.; Dewulf, J.; de Meester, S. Performance indicators for a circular economy: A case study on post-industrial plastic waste. Resour. Conserv. Recycl. 2017, 120, 46–54. [Google Scholar] [CrossRef]
  65. Kuznecova, I.; Babica, V.; Melecis, V.; Baranenko, D.; Ozarskis, M.; Gusca, J. Initial indicator analysis of bioethylen production pathways. Energy Procedia 2018, 147, 544–548. [Google Scholar] [CrossRef]
  66. Evans, J.; Bocken, N. Circular Economy Toolkit. Available online: http://circulareconomytoolkit.org (accessed on 6 November 2020).
  67. Gehin, A.; Zwolinski, P.; Brissaud, D. A tool to implement sustainable end-of-life strategies in the product development phase. J. Clean. Prod. 2008, 16, 566–576. [Google Scholar] [CrossRef]
  68. Linder, M.; Sarasini, S.; van Loon, P. A Metric for Quantifying Product-Level Circularity. J. Ind. Ecol. 2017, 21, 545–558. [Google Scholar] [CrossRef] [Green Version]
  69. Bailey, R.; Bras, B.; Allen, J.K. Applying Ecological Input-Output Flow Analysis to Material Flows in Industrial Systems: Part II: Flow Metrics. J. Ind. Ecol. 2004, 8. [Google Scholar] [CrossRef]
  70. Plevin, R.J.; Delucchi, M.A.; Creutzig, F. Using Attributional Life Cycle Assessment to Estimate Climate-Change Mitigation Benefits Misleads Policy Makers. J. Ind. Ecol. 2014, 18, 73–83. [Google Scholar] [CrossRef]
  71. Lotfy, W.A.; Ghanem, K.M.; El-Helow, E.R. Citric acid production by a novel Aspergillus niger isolate: II. Optimization of process parameters through statistical experimental designs. Bioresour. Technol. 2007, 98, 3470–3477. [Google Scholar] [CrossRef]
  72. Ärtzeblatt. Knapp 750.000 Herz-katheter-Eingriffe pro Jahr in Deutschland. Available online: https://www.aerzteblatt.de/nachrichten/60394/Knapp-750-000-Herzkatheter-Eingriffe-pro-Jahr-in-Deutschland (accessed on 16 January 2021).
Figure 1. Electrophysiological diagnostic catheter [34].
Sustainability 13 00898 g001
Figure 2. System boundary of the reference process (manufacturing of a catheter from virgin material).
Sustainability 13 00898 g002
Figure 3. System boundary of the remanufactured catheter.
Sustainability 13 00898 g003
Figure 4. System boundary of the circularity assessment of the linear and circular production system.
Sustainability 13 00898 g004
Figure 5. Results of the GWI for using a remanufactured medical catheter and using a catheter from virgin production disposed after single-use.
Sustainability 13 00898 g005
Figure 6. Results of abiotic resource use for using a remanufactured medical catheter and using a catheter from virgin production disposed after single-use.
Sustainability 13 00898 g006
Figure 7. Results of GWI (left) and abiotic resource use (right) for a circular production system, including a remanufacturing system and a linear production system without a remanufacturing process.
Sustainability 13 00898 g007
Figure 8. Primary y-axis: Relative savings of the GWI (orange) and abiotic resource use (blue) for a circular production system including a medical manufacturing process in contrast to the linear production system at a collection rate between 0% and 100% (xc). Secondary y-axis: Resulting circularity of the catheter (grey) at a collection rate between 0% and 100%.
Sustainability 13 00898 g008
Table 1. Input and output flows of a newly-manufactured catheter through virgin production route.
NameValueUnitDescription
Input flows
Carbon dioxide2.82 × 10−3kgIngredient of sterilization gas
Corrugated board0.14kgSecondary packaging
Ethylene oxide1.80 × 10−4kgIngredient of sterilization gas
Polyamide 6 fibres (PA 6)3.20 × 10⁻³kgPre-product for PEBAX® (shaft)
Polyetherimide granulate (PEI)0.11kgPlug and handle
Polyethylene glycol (PEG)1.25 × 10⁻³kgPre-product for PEBAX® (shaft)
Polyethylene high density granulate0.02kgPrimary packaging
Polyethylene low density granulate3.00 × 10−4kgShaft stiffener
Polyurethane flexible foam (PU)8.00 × 10⁻⁴kgCurvature and loop
Transporting capacity18.34kgkmSmall truck for final distribution in Germany
Transporting capacity2725.16kgkmSea route from California to Germany
Water (desalinated; deionized)2.00 × 10⁻³kgProcess water of manufacturing
Electricity; consumption mix0.36kWhElectricity needed except for plastic production and processing
Output flows
Produced catheter1.00ItemReference flow
Incineration good0.12kgWaste treatment
Table 2. Input and output flows of the medical remanufacturing route.
NameValueUnitDescription
Input flows
Aromatics (steam cracking products)3.96 × 10⁻³kgPre-product of gluteral (ingredient of disinfectant Neodisher endo Sept GA)
Carbon dioxide2.82 × 10−3kgIngredient of sterilization gas
Citric acid8.80 × 10−3kgIngredient of detergent Sekusept aktiv
Corrugated board0.14kgSecondary packaging
Electricity; consumption mix0.52kWhElectricity needed expect plastic production and processing
Ethylene oxide1.80 × 10−4kgIngredient of sterilization gas
Hydrogen peroxide (100%)0.02kgIngredient of detergent Sekusept aktiv
Polyethylene high density granulate 0.02kgPrimary packaging
Soda (sodium carbonate)5.77 × 10⁻³kgIngredient of detergent Sekusept aktiv
Sodium cumene sulphonate (40%)3.50 × 10⁻³kgIngredient of Neodisher endo CLEAN
Transporting capacity 18.34kgkmSmall truck for distribution
Water (desalinated; deionized)5.00kgProcess water
Tap water7.00kgProcess water
Output flows
Produced catheter1.00ItemReference flow
Incineration good0.11kgWaste treatment
Table 3. Overview of the selected modeling perspectives in this study.
LCA Method Described in Section 2.1LCA Method Combined with the Circularity Metric Described in Section 2.2
Perspective of modeled comparison indicating environmental benefits ofUsing a remanufactured or virgin catheterApplying a linear or circular production system including remanufacturing
Functional unitIdentical (provision of a catheter)
Method for setting system boundaries is based onCut-offSystem expansion to consider several life cycles
Time horizonShort-termLong-term
Observed product cyclesSingleMultiple
Table 4. Life cycle impact assessment results for the provision of one electrophysiology catheter through a medical remanufacturing route compared to virgin production route (cut off approach).
Impact CategoryVirgin Production RouteMedical Remanufacturing RouteSavings from Medical Remanufacturing Compared to Virgin Production per Catheter
Acidification terrestrial and freshwater [Mole of H+ eq.]4.73 × 10−31.18 × 10−375.1%
Cancer human health effects [CTUh]3.30 × 10−101.29 × 10−1060.9%
Climate Change [kg CO2-eq.]1.750.8750.4%
Ecotoxicity freshwater [CTUe]11.94.6960.6%
Eutrophication freshwater [kg P eq.]6.29 × 10−67.87 × 10−6−25.1%
Eutrophication marine [kg N eq.]1.36 × 10−34.12 × 10−369.7%
Eutrophication terrestrial [Mole of N eq.]1.44 × 10−24.41 × 10−369.4%
Ionising radiation—human health [kBq U235 eq.]5.37 × 10−24.20 × 10−221.8%
Land Use [Pt]9.0310.4−15.2%
Non-cancer human health effects [CTUh]1.56 × 10−87.39 × 10−952.6%
Ozone depletion [kg CFC-11-eq.]1.96 × 10−112.01 × 10−1289.7%
Photochemical ozone formation—human health [kg NMVOC eq.]3.89 × 10−31.06 × 10−372.8%
Resource use, energy carriers [MJ]29.39.0269.2%
Resource use, mineral and metals [kg Sb eq.]2.78 × 10−71.98 × 10−728.8%
Respiratory inorganics [Disease incidences]4.22 × 10−81.40 × 10−866.8%
Water scarcity [m³ world equiv.]1.09 × 10−11.13 × 10−1−3.7%
Publisher’s Note: MDPI stays neutral with regard to jurisdictional claims in published maps and institutional affiliations.

