Article

Comparative Environmental Life Cycle and Cost Assessment of Electric, Hybrid, and Conventional Vehicles in Lithuania

by
Kamilė Petrauskienė
1,*,
Arvydas Galinis
2,
Daina Kliaugaitė
1 and
Jolanta Dvarionienė
1
1
Institute of Environmental Engineering, Kaunas University of Technology, 44239 Kaunas, Lithuania
2
Lithuanian Energy Institute, 44403 Kaunas, Lithuania
*
Author to whom correspondence should be addressed.
Sustainability 2021, 13(2), 957; https://doi.org/10.3390/su13020957
Submission received: 8 December 2020 / Revised: 10 January 2021 / Accepted: 15 January 2021 / Published: 19 January 2021

Abstract

:
Electric mobility is promoted as a future transport option that has environmental and economic benefits and encourages sustainable urban transportation. The aim of this study is to reveal the changes in environmental and economic performance if we switched from internal combustion engine vehicles (ICEVs) to battery electric (BEV) or hybrid electric (HEV) vehicles. Therefore, this research presents a comparative environmental life cycle assessment (LCA) from the Cradle-to-Grave perspective of the vehicles and a Well-to-Wheel analysis of their fuel supply. Moreover, an LCA of a BEV was performed under diverse electricity mix scenarios, which are forecasted for 2015–2050 in Lithuania. From an economic point of view, a life cycle costing was conducted for the same vehicles to estimate the economic impacts over the vehicle life cycles under Lithuanian conditions. The results show that ICEV-petrol contributes the major environmental damage in all damage categories. BEVs with the electricity mix of 2020–2050 scenarios, which are composed mainly of renewable energy sources, provide the least environmental impact. The economic results reveal that BEV and ICEV-diesel are the most cost-efficient vehicles, with the total consumer life cycle costs of approximately 5% and 15% less than ICEV-petrol and HEV, respectively.

1. Introduction

The European Union (EU) faces the challenge of achieving goals set for the 2020 and 2030 climate and energy frameworks and the 2050 long-term strategy [1]. The EU’s ambition to become climate-neutral by 2050 is described in the European Green Deal, which claims a new growth strategy and aims to accelerate the shift to smart and sustainable mobility [2]. The EU According to the European Environmental Protection Agency, the transport sector, accounts for a quarter of the EU’s total greenhouse gas (GHG) emissions. In addition, as of 2018, GHG emissions from transport have increased by 32% compared with 1990. Moreover, road transport is the most significant factor with nearly three-quarters of the transport-related GHG emissions [3]. To achieve climate neutrality, a 90% reduction in all modes of transport emissions is necessary by 2050 [2].
Road transport is the most substantial emissions source in the transportation area in Lithuania. In 2018, GHG emissions from road transport increased by 6.4% compared with the previous year, and this increase is primarily caused by a 7% increase in diesel oil fuel and 9% in gasoline consumption by road transportation. According to Lithuania’s GHG Inventory report of 2018, transport is responsible for 30.2% of the total GHG emissions (6111.4 kt CO2 eq), of which 95.7% comes from road transport and passenger cars account for 56% (3421 kt CO2 eq). As a result, passenger cars contribute 17% of the total GHG emissions [4].
In terms of air pollution, passenger cars are one of the most predominant contributors of air pollutants of all vehicle types and are responsible for 7.2% of NOx, 3.5% of NMVOC, 9.3% of PM2.5, 4.8% of PM10, and 10.2% Pb of the total emissions from all sectors [4]. It has been assessed that the health-related external costs from air pollution in Lithuania are over 1 billion Eur/year (income adjusted, 2010), which includes not only the essential value of living a complete healthy life but also direct costs to the economy. These direct economic costs relate to 488,000 workdays lost every year due to illness related to air pollution, with related costs for employers of 37 million Eur/year and of more than 5 million Eur/year for healthcare (income adjusted, 2010) [5].
Air pollution is caused by passenger cars, which are the most fuel-consuming vehicle type, followed by heavy-duty and light-duty vehicles, and two-wheelers, in decreasing order [4]. Higher fuel consumption also depends on the vehicle age. According to the statistics of State Enterprise “Regitra”, the average age of passenger cars is approximately 16 years old, with European emission standards of EURO 3 and EURO 4 [6].
Electric vehicles (EVs) are considered to be environmentally friendly modes of transport and offer significant opportunities to reduce local air pollution, GHG emissions, and traffic noise. EVs do not release tailpipe emissions of air pollutants such as nitrogen oxides and particulate matter. In addition, EVs are quiet during operation, especially at lower speeds, and they are less noisy than conventional vehicles [7]. Furthermore, electric mobility is supposed to play a significant role in achieving these goals for three reasons: (1) electric powertrains are considerably more energy efficient than conventional engines; (2) electricity can directly use renewable energy sources (RES) for transport, and (3) when connected to the power grid, EV batteries can stabilise the grid and balance the supply and demand, facilitating the integration of RES [8].
Moreover, EVs would be even more favourable if the electricity for charging the battery is produced by RES [9,10,11,12]. The EU agreed to set a common target for the share of RES (including biomethane, liquid biofuels, “green electricity”, and hydrogen) of 10% of the total used in transport by 2020. In the EU transport area, RES equalled to 8.3% in 2018 (boosted from 1.5% in 2004) [13].
In Lithuania, the part of RES of the final energy consumption in the transportation should be raised to at least 10% by 2020 in all means of transport, yet unfortunately, the aim has not been achieved, with only 3.69% achieved in 2017 [14]. Furthermore, according to the National Energy Independence Strategy, future goals are even more ambitious, increasing the part of RES used in the transport sector to 15% by 2030 and 50% by 2050 [15].
One of the planned policy tools in the transport area from the National Energy and Climate Action Plan of the Republic of Lithuania 2021–2030 is promoting the use of EVs and expanding the recharging infrastructure. As a result, EVs are required to account for 10% of annual class M1 purchase transactions in 2025 and 50% in 2030 [16].
According to recent vehicle registration statistics, the largest market share is occupied by internal combustion engine vehicles (ICEVs) powered with diesel (68.3%), followed by ICEVs powered with petrol (23.4%), then ICEVs powered with liquefied petroleum gas (6.4%) while hybrid electric vehicles (HEVs) accounts for only 1.7% and battery electric vehicles (BEVs)—0.15%. Notwithstanding, such BEV statistics show a huge improvement in recent years in Lithuania.
According to the recent data of European Automobile Manufacturers Association, not only in Lithuania, but also in other Baltic states—Latvia and Estonia, in 2020, a significant increase was occurred in new BEVs registration in the car fleet. As a result, in 1–3 quarters of 2020, there were around three times more new BEVs registrations than in 1–3 quarters of 2019. The number of new BEVs registered in Lithuania was the highest, with 52% and 43% higher number than in Estonia and Latvia, respectively, in quarters 1–3 of 2020 [17].
In Lithuania, at the beginning of December 2020, 2390 battery electric passenger cars (new and used) were registered, while at the end of 2019, a total of 1397 were registered, and at the end of 2018, there were only 969 [6]. Such an increase in the BEV reveals a successful financial incentive that was implemented in the spring of 2020. For individuals, there is a possibility of receiving a compensation of 2000 Eur to purchase a second-hand electric vehicle up to 5 years of age and 4000 Eur for the purchase of a new electric car [18]. An additional compensation of 1000 Eur is paid to the old cars’ owners, who deposited their vehicles at an authorised treatment facility for the proper treatment and recovery and have already obtained a certificate of destruction for the old car [19]. Furthermore, additional business support for the purchase of new electric cars and buses has been recently implemented, offering a 4000 Eur compensation for a new electric passenger car or 10,000 Eur compensation for the purchase of a new electric bus [20]. Such financial incentives are great opportunities for the promotion of EV integration into city transport systems.
Economic feasibility will always be a driving force in the decision-making process when integrating EVs in city life, especially when people have low purchasing power and countries face other challenges and barriers [21]. Therefore, an economic assessment is necessary to present an overall impression of the benefits that EVs may provide.
This research provides a comprehensive life cycle environmental and economic assessment, which are also called life cycle assessment (LCA) and life cycle costing (LCC). According to Hauschild et al. (2018), LCA and LCC in the field of mobility can be used to: (1) compare different engines; (2) analyse and compare different fuel types and the impact of the vehicle operation; (3) compare various end-of-life scenarios and treatment options; (4) identify hotspots of the analysis and main benefits and drawbacks of different vehicles across three major life cycle phases (production, use, and end-of-life) [22]. LCA and LCC are versatile techniques applicable to a range of purposes and at various stages of the product or system in order to support decision-making from the environmental and economic perspectives, respectively. In addition, LCC has been found to positively drive life cycle management by spreading the life cycle idea [23]. Moreover, LCA and LCC are parts of a life cycle sustainability assessment (LCSA). The development of the LCSA originates from the need to combine the three aspects of sustainable development (environmental, economic, and social) in a single formulation, supporting life cycle thinking [24,25].
Some studies have been explored regarding the LCCs of BEVs and ICEVs in various countries: Australia [26], France [27], Germany [28,29,30], Italy [31], Switzerland [32], and the USA [33,34,35,36]. However, no studies have been performed on the LCCs of passenger electric, conventional, or hybrid cars in Lithuania. Moreover, Lithuania was chosen as a representative country, as it initiates the integration of electric vehicles and renewable energy resources into city transport systems, which pursues both national and EU goals to become climate-neutral by 2050. Therefore, the goal of this research is to (1) analyse and compare the environmental impacts and costs of electric, hybrid, and internal combustion engine vehicles under Lithuanian conditions; (2) assess the BEV’s operation stage under different electricity generation scenarios prognosticated for the years 2015–2050; and (3) assess the electricity mix scenario with the minimum environmental impact. Our research goals examine the hypothesis that electricity mix is a crucial factor for the environmental performance of the BEV.
This research used LCA and LCC methodologies to evaluate the impact on the environment and costs all over the life cycle of BEVs, HEVs, and ICEVs powered with petrol and diesel. In addition, the LCA of BEVs was carried out under various electricity mix scenarios and electricity production technologies for the years 2015–2050 in Lithuania. The novelty of this research is a combined LCA and LCC analysis of different engine-type passenger cars under Lithuanian conditions, where the LCCs are performed from the consumer and manufacturer points of view. Moreover, the forecasted electricity production costs for the electricity mix scenarios of 2020 and 2040 under Lithuanian conditions were compared.

2. Methodology

In this research, LCA and LCC methodologies were used to evaluate the environmental impacts and costs related to the process, product, or activity all over the product’s life cycle. The LCAs and LCCs of electric, hybrid, and conventional vehicles were performed according to the procedures specified in the European standards series ISO 14040/14044 [37,38]. The methods are both aligned with these ISO standards on LCA in terms of system scope, functional units, and methodological steps and regard all phases in the life cycle.
The aim of the LCA and LCC was to assess and compare the environmental impacts and costs related with the production, use, and end-of-life stages of electric, hybrid, and conventional vehicles powered with diesel and petrol. The environmental emissions of selected vehicles were based on a functional unit of “1 km driving distance”, and the impact/costs were assessed for 150,000 km driving distance. The environmental impacts and costs were calculated for the life cycle assuming that for electric cars, no battery replacement is required (the lithium-ion battery has an 8-year or 160,000 km mileage warranty [39]). Therefore, in this analysis, one battery for the BEV is used during the total mileage. It is important to mention that 150,000 km mileage of all types of selected vehicles will not lead to the end-of-life stage in the current practise, as the average age of passenger cars in the Lithuanian vehicle fleet is 16 years [6]. However, this is a scientific analysis, and a 150,000 km mileage was determined according to the analyses conducted also by other researchers [40,41,42]. Therefore, the study assumed that the ICEVs, HEV, and BEV could drive 150,000 km as the baseline for the comparative LCA and LCC analyses.

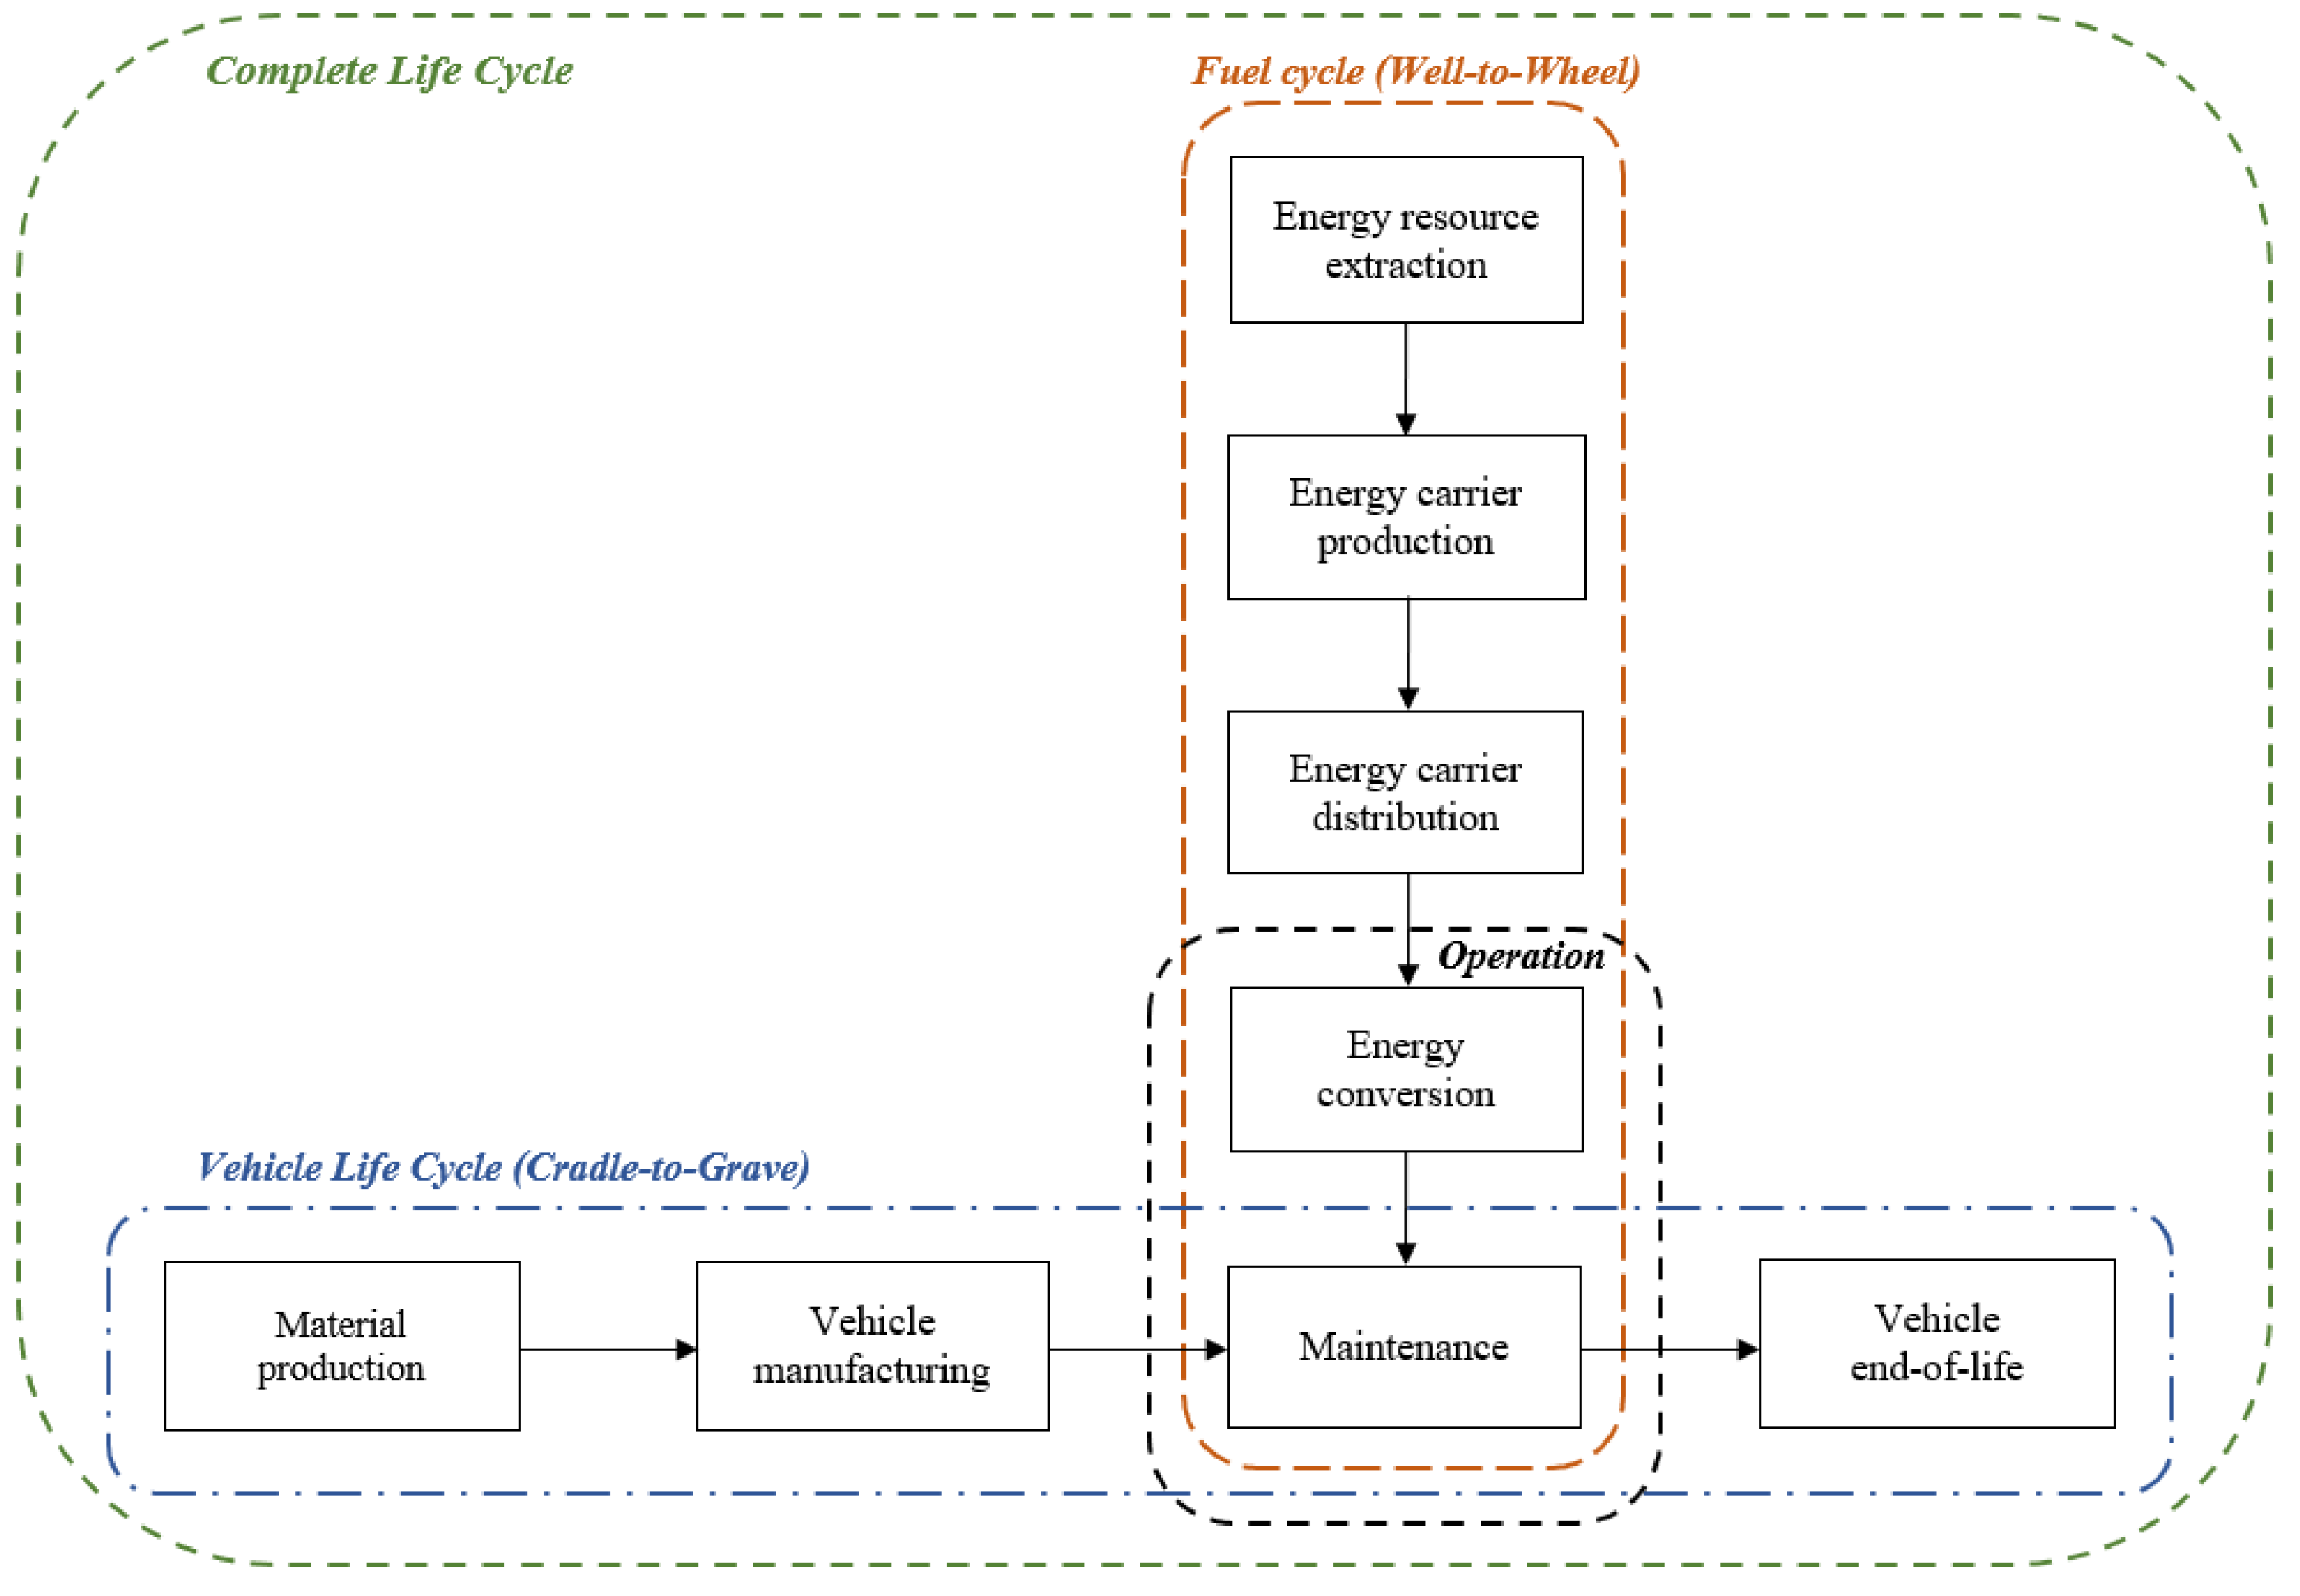
2.1. Scope of Analysis and Life Cycle Impact Assessment Method for the LCA

The scope of this study shows a “complete LCA”, which includes the vehicle life cycle as Cradle-to-Grave analysis, and the fuel cycle that follows a Well-To-Wheel (WTW) approach. The WTW parts combine energy resource extraction, energy production and distribution, and energy conversion in the vehicle. The vehicle life cycle or Cradle-to-Grave investigation involves the materials production, vehicle manufacture, maintenance, and end-of-life. The system boundaries of a “complete LCA” are presented in Figure 1.
The results of the LCA are described in three stages: production, use, and end-of-life. The production stage includes the production of the vehicle and the batteries: an Li-ion battery for the BEV and an Ni-metal hydride battery for the HEV. Next, the use phase includes car and road maintenance as well as exhaust emissions caused by fuel combustion (for HEV-petrol, ICEV-petrol, and ICEV-diesel) and non-exhaust emissions caused from road wear, tires, and brakes. BEVs do not release direct emissions during the use phase, but indirect emissions are caused by electricity production. Therefore, it is crucial to determine how the electricity for charging the battery is produced. Therefore, the scope of the BEV case involves the electricity mix scenarios 2015–2050, which were forecasted by the Lithuanian Energy Institute (2017) under Lithuanian conditions. Consequently, this research used the LCA method to assess and parallel the environmental impact of BEVs in 2015, 2020, 2025, 2030, 2040, and 2050, including diverse electricity mixes and electricity generation technologies. The end-of-life phase, which includes manual dismantling of a vehicle, treatment (shredding) of the used glider, internal combustion engine, and powertrain, treatment of the used Li-ion battery by a hydrometallurgical process, treatment of the used Ni-metal hydride battery by a pyrometallurgical process, and sorting and remelting of the lead contained in the lead acid battery. In the end-of-life stage, all types of vehicle were treated by the same processes, which are chosen from the LCA database.
In this research, the ReCiPe method at the midpoint and endpoint levels was used to fulfil the impact assessment [43]. At the midpoint level, the environmental impact categories were determined as those with the highest values identified in the study. At the endpoint level, three higher combination levels were evaluated: damage to human health, ecosystems, and resource availability.
The LCA database Ecoinvent v3.5 was applied as the background source for life cycle impact analysis [44]. The life cycle environmental weights and potential impacts were calculated using the LCA software SimaPro 9.1 [45].

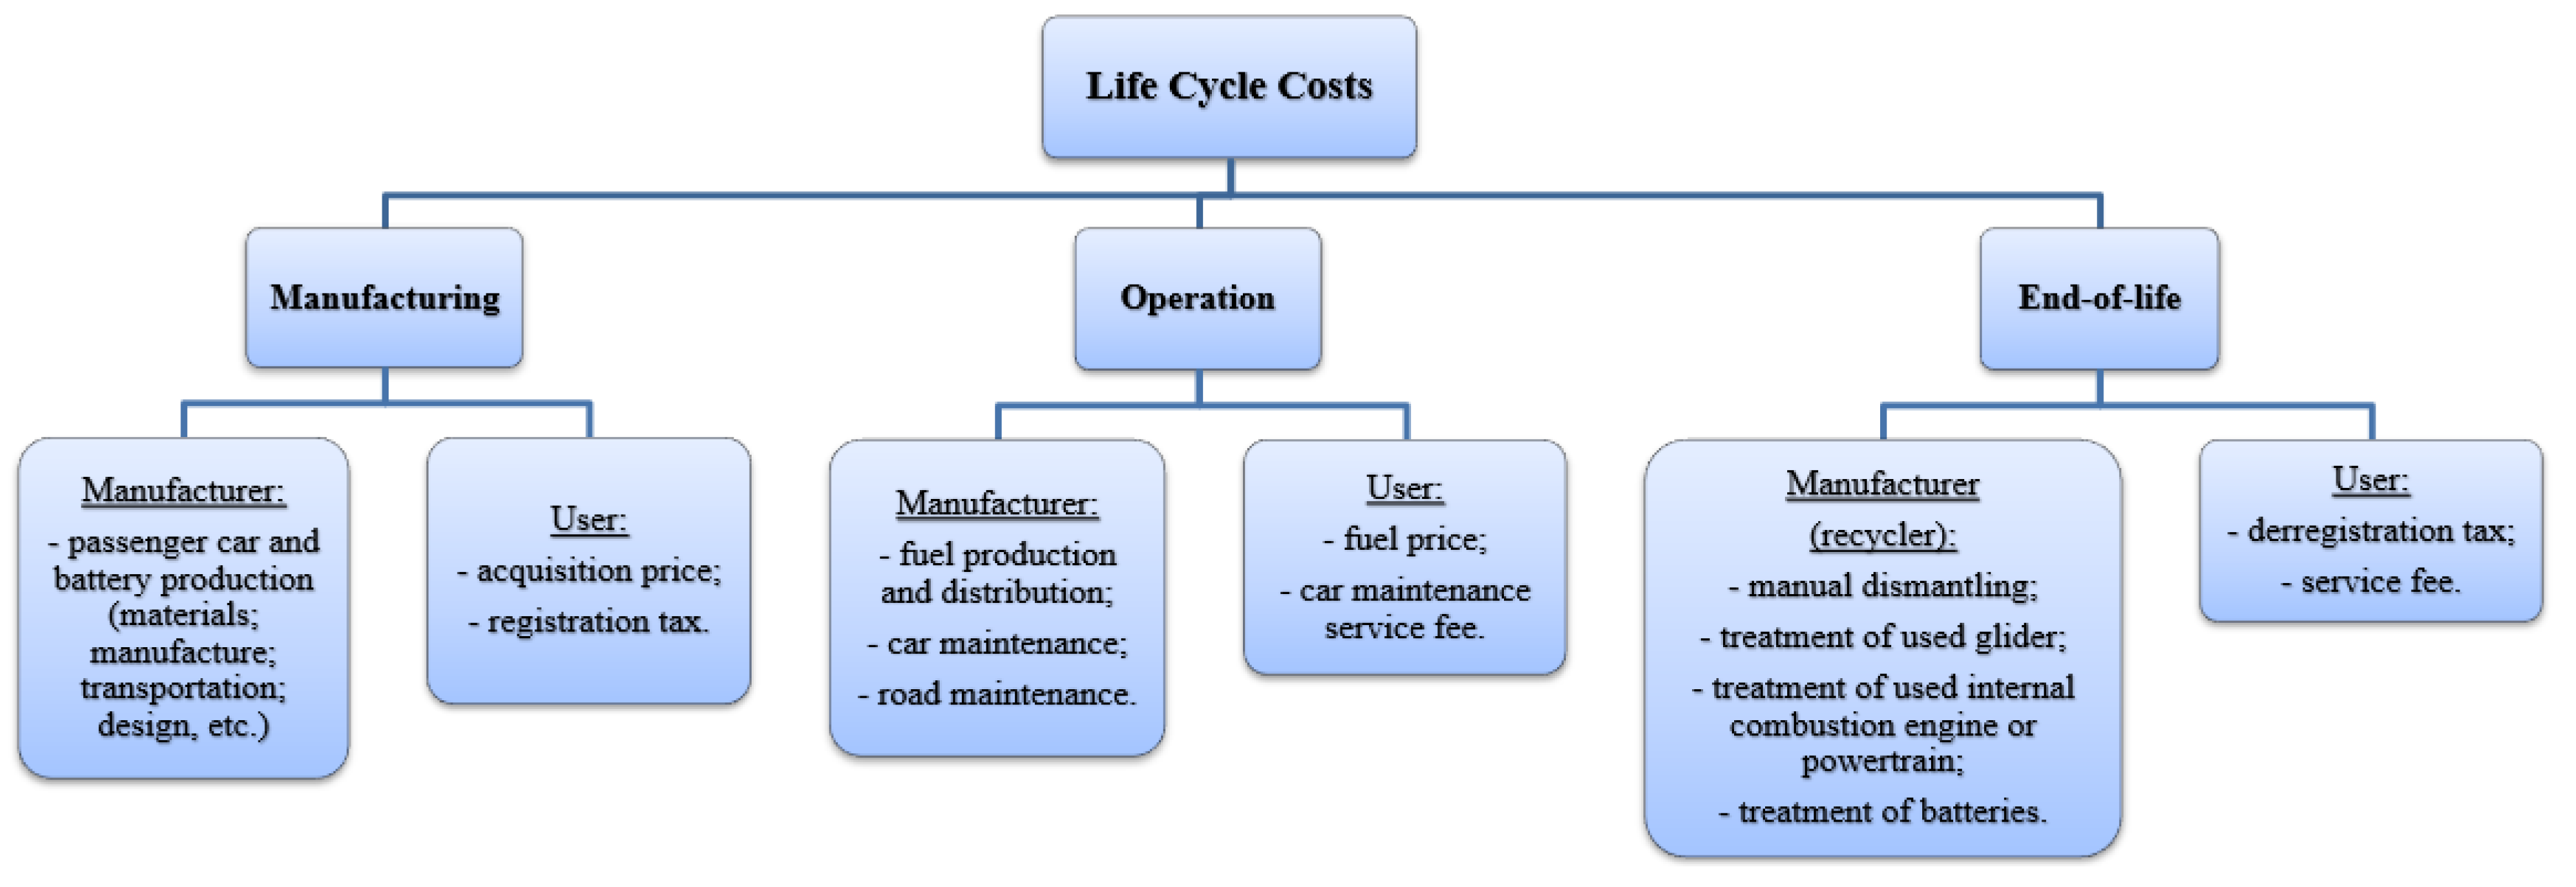
2.2. Scope and Costs Assessment Method for the LCC

The LCC can form an economic aspect in a life cycle sustainability assessment complementing environmental and social concepts. It is useful for making good decisions and identify challenges from various perspectives, such as a product or service developer or consumer. Therefore, the LCC was performed from both perspectives. The boundaries were determined using the Cradle-to-Grave approach and covered all three life cycle phases: manufacturing, operation, and end-of-life. Furthermore, the fuel cycle was evaluating, bringing the scope to a “Complete LCC”. This type of LCC, which is aligned with the LCA, is also called an environmental LCC, which may also include external costs (also termed externalities), but only if they are expressed in monetary units. In this study, due to a lack of data, the externalities were eliminated from the analysis. The system boundaries of the LCC are presented in Figure 2.
The results of the LCC are presented as a comparison of the analysed passenger cars in three combined phases (manufacturing, operation, and end-of-life) from two different perspectives: manufacturer and user/consumer. From the manufacturer side, the costs of the processes were aligned with the LCA. The manufacturing phase included costs linked to the production of vehicles and batteries: Li-ion and Ni-metal hydride batteries. Next, the operation phase included the costs of fuel production and distribution and car and road maintenance. Finally, the end-of-life stage included the costs of vehicle treatment processes: manual dismantling, treatment of the glider, internal combustion engine or powertrain, and batteries. From the consumer perspective, the manufacturing phase included the acquisition price and car registration tax. Next, the operation phase included the fuel/electricity price and car maintenance service fees. Finally, the end-of-life phase included only the deregistration tax and service fee for the passenger car (turned to the end-of-life vehicle) disposal, which is free of charge in Lithuania. It should be noted that the analysis did not include all passenger car usage costs. For instance, insurance, tires, and repair costs were excluded because they were assumed to be equal; therefore, they would not influence the comparative analysis.
For the LCC analysis, OpenLCA 1.10 software with the Ecoinvent 3.5 database was used as the measure of financial impact from the manufacturer point of view [46]. The analysis from the consumer side was performed by collecting the necessary data from various sources. The costs were quantified in euros.

2.3. Inventory Analysis

This study aimed to show the current situation in Lithuania according to the existing information, technologies, and available databases. As reported by the State enterprise “Regitra” (2020), the most popular BEV registered in Lithuania is the Nissan Leaf, the most popular HEV is the Toyota Prius, and the most popular ICEV is the Volkswagen Golf. As this research will measure the impact on the environment according to 2015–2050 forecasted electricity mixes using RES, the 2018 Nissan Leaf Acenta was chosen. In addition, the 2019 Volkswagen Golf powered with petrol and diesel was selected. The Nissan Leaf Acenta, Toyota Prius, and Volkswagen Golf powered with petrol and diesel are similar in weight and length and belong to the medium-size class; therefore, they are applicable for comparative life cycle and cost analyses. The costs and parameters of the selected vehicles were assumed to be on the level of 2020 year without prognosing their changes and technology evolution in the future.
The technical specifications of these passenger cars, published by representatives, are shown in Table 1 and Table 2.
The combined fuel consumption was determined according to the HEV’s and ICEVs’ specifications. This value was evaluated by the Worldwide Harmonized Light Vehicle Test Procedure (WLTP) laboratory, which utilises the test to calculate fuel consumption and carbon dioxide emissions from cars. Furthermore, according to the BEV specifications, the electricity consumption (20.6 kWh/100 km, including charging losses) was also rated by WLTP. The fuel/electricity consumption was the most important factor when calculating the use phase in the LCA, while the kerb weight and battery weight were taken into account when assessing the production stage. Furthermore, when assessing the environmental impact, the weight of a Li-ion battery (296 kg) for the BEV and the weight of a NiMH battery (39.3 kg) for the HEV were taken into account.

Inventory Analysis Regarding Electricity Mix Production

Utilising the inventory of electricity production by fuel type in Lithuania for the years 2015–2050, the data for present and future electricity production were investigated. Shares of electricity generation in Lithuania’s energy systems were apportioned and are presented in Table 3. Notably, the LCA analysis includes only the annual electricity generation mixes that are expected to be provided by local resources, although more than half of the electricity is imported in Lithuania, which is projected to decline to zero by 2050. This assumption was because the primary energy sources for the production of imported electricity are not known.
A strategic objective of the National Energy Independency Strategy is to boost the share of RESs in comparison with the present total energy consumption. One of the primary strategic ambitions is to enhance the share of electricity consumed from RESs to 30% of the total electricity consumption in 2020, 45% in 2030, and 100% in 2050 [16]. Electricity obtained from oil is projected to decrease from 4.57 to zero in the 2020 and later scenarios. The share of natural gas is projected to lower six times by 2050, while biomass will raise by approximately five times from 2020 to 2025 and decline further to 4.49 by 2050. At present, geothermal, biogas, and waste have inconsequential shares in the energy system and are prognosticated to be reduced as well. The shares of wind and solar energy are projected to boost considerably over the year 2050, from 1.76 to 45.57 and from 14.56 to 33.61, respectively, and they will be the most substantial energy sources in Lithuania. The amount (%) of electricity generation in the energy system by source were utilised to perform the LCA analyses of present and future BEVs and to carry out a comparative fuel cycle analysis of BEVs, HEV, and ICEVs powered with diesel and petrol.

3. Results and Discussion

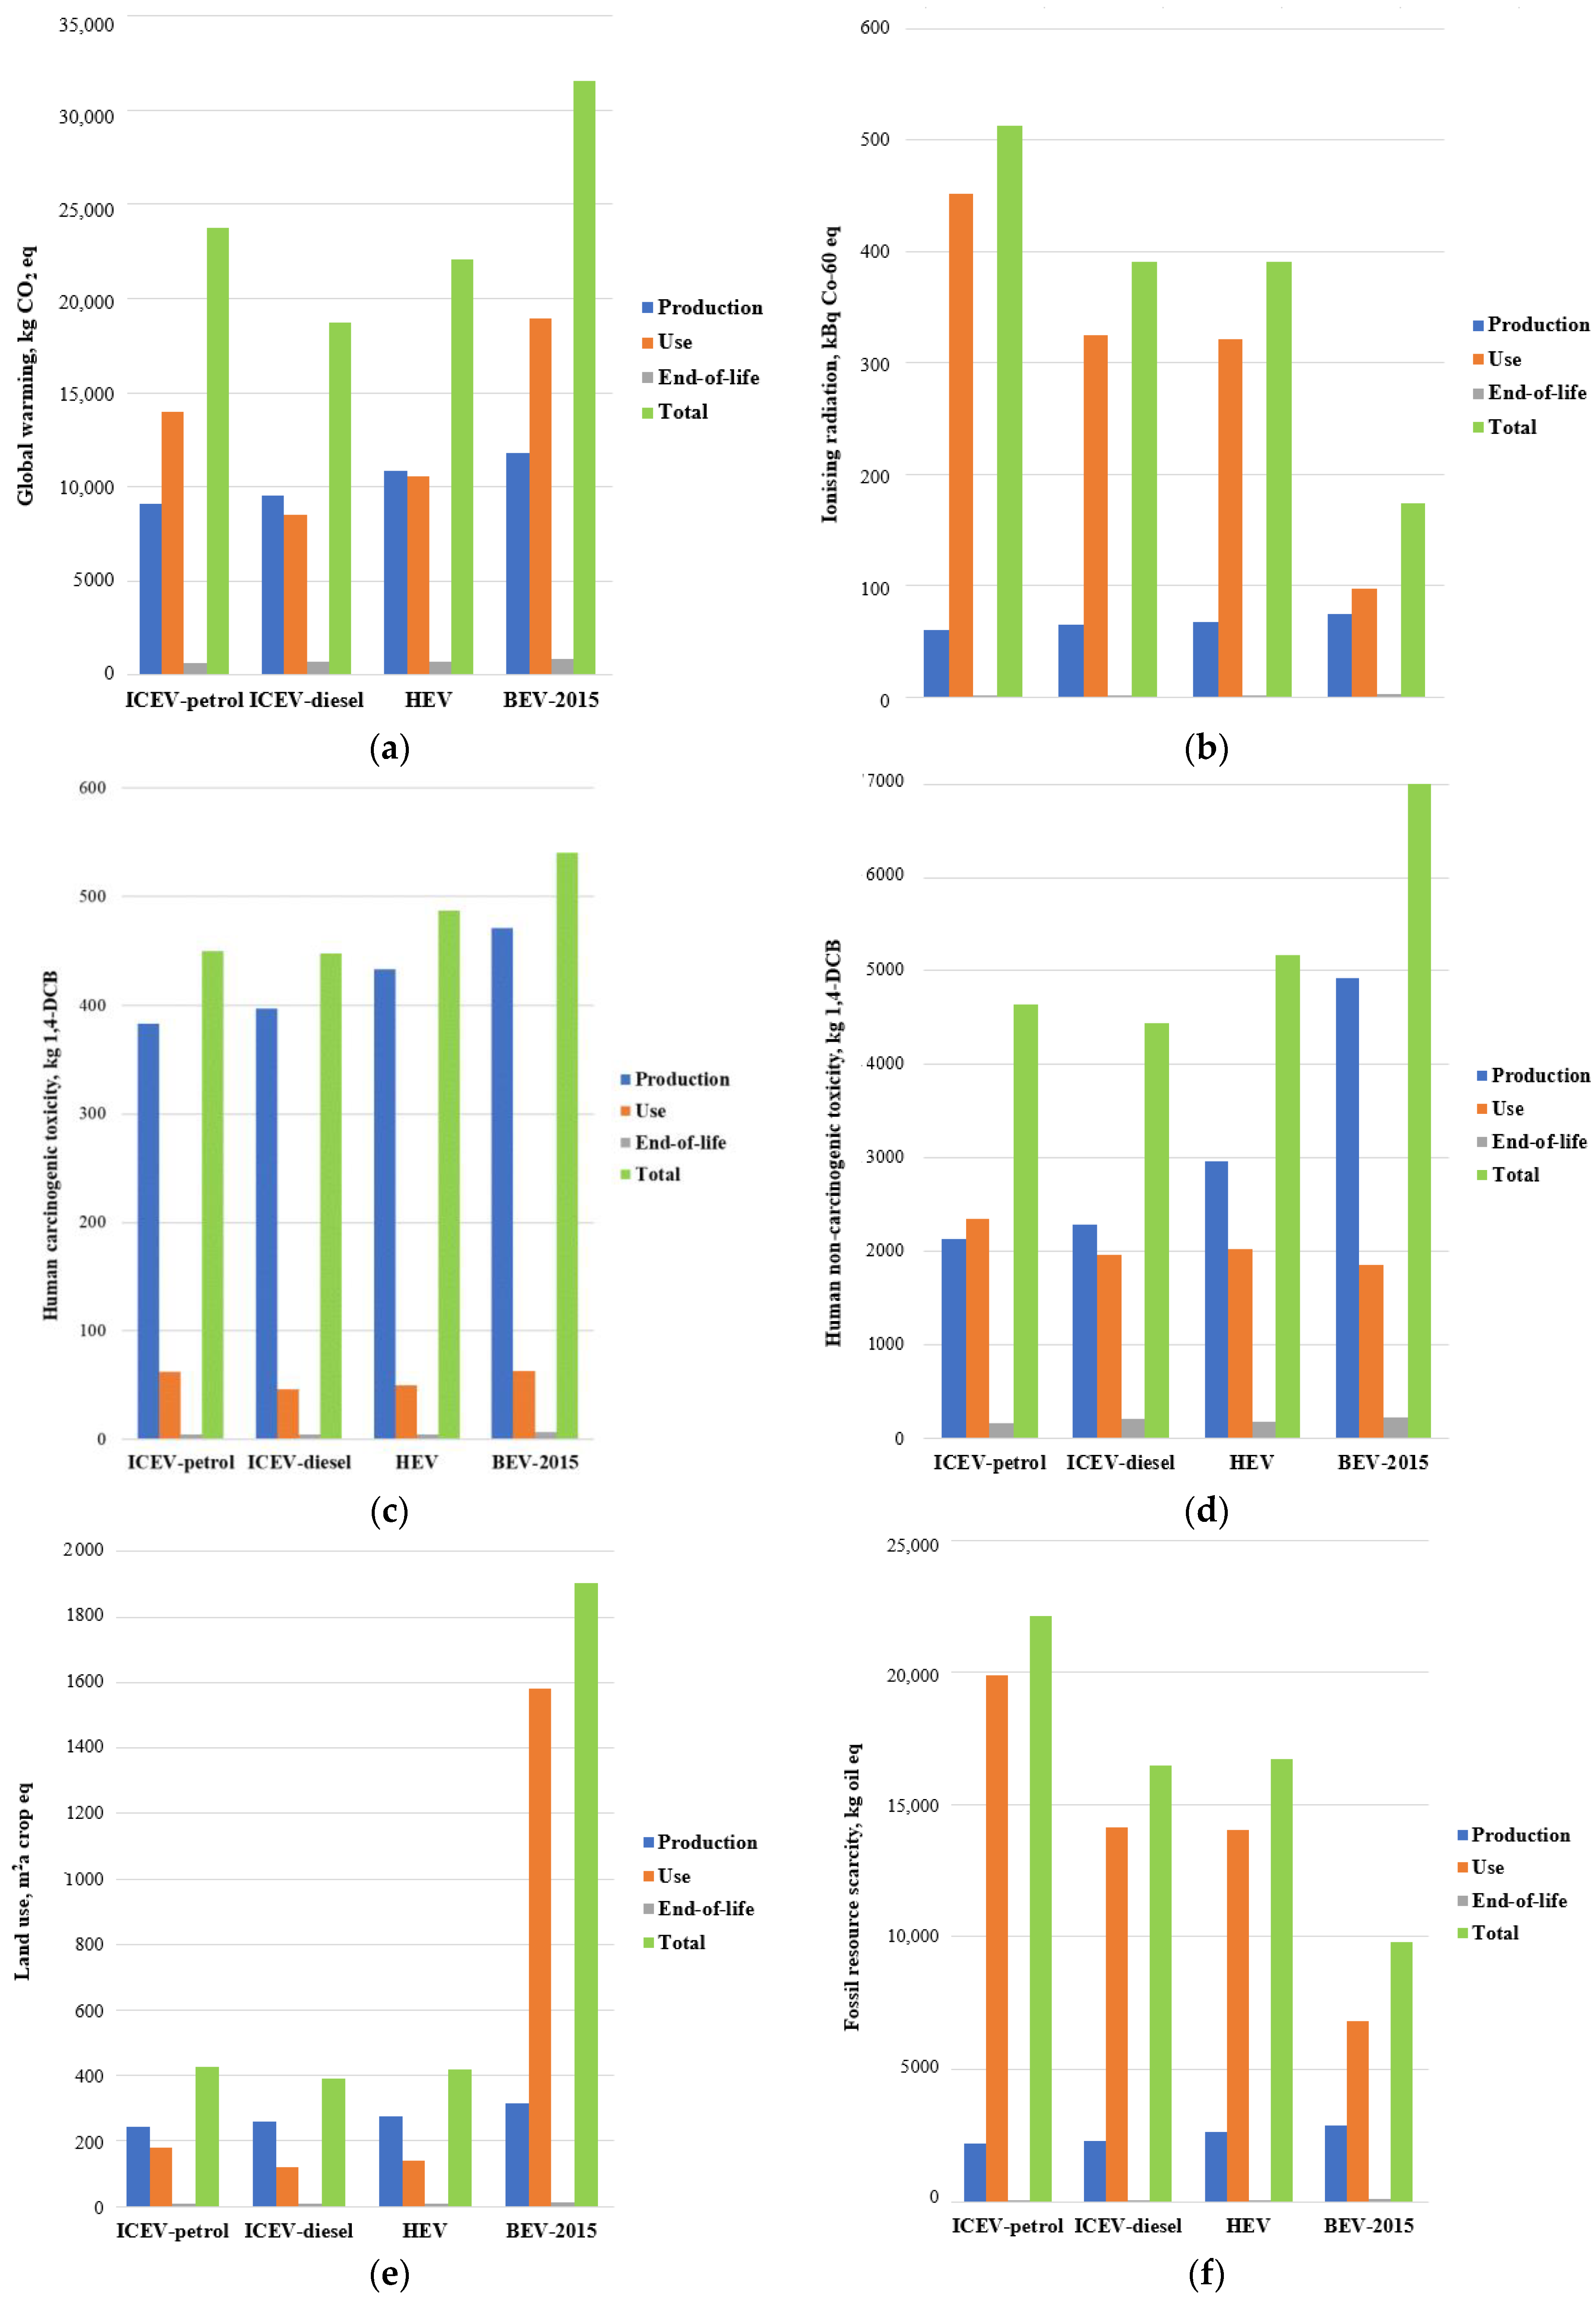
3.1. Midpoint Results of the LCA

The midpoint results of the LCA regarding the analysed environmental impact categories of BEV, HEV, and ICEVs powered with diesel and petrol are presented in Figure 3. The results reveal the major impacts of the BEV with the electricity mix of 2015, HEV, and ICEVs in the impact categories of global warming, ionising radiation, human carcinogenic toxicity, human non-carcinogenic toxicity, land use, and fossil resource scarcity as those with the highest values identified in the study.
The diagram (a) reveals that the value of CO2 eq all over the entire life cycle is 31,543 CO2 eq for the BEV, where the greatest impact (60%) on the environment is during the use phase. While ICEVs powered with diesel have the lowest total value of 18,721 CO2 eq. The impact of the end-of-life phase is similar among all the analysed passenger cars and accounts for 2.7–3.8%, but the greatest values of CO2 eq, as well as in all other impact categories, are for the BEV (electricity mix of 2015) because of the battery treatment. The graph (b) presents the impact of ionising radiation, which is the highest in the ICEVs and HEV because of the fuel production and distribution. The diagrams (c) and (d) display the human carcinogenic and non-carcinogenic toxicity, where the BEV creates the most substantial burden. Notwithstanding, the production stage exhibits considerable impacts for all car types because of the passenger car manufacturer. The diagram (e) provides the impact on land use, which has the greatest total values for the BEV (1906 m2a crop eq), where 83% of the total impact is due to electricity production in the 2015 mix energy scenario. Finally, the diagram (f) presents the impact on fossil resource scarcity, which clearly shows that fuel production from fossil fuels creates the highest values for the ICEV-petrol. The ICEV-diesel and HEV, which have almost the same value, provide 25% less impact than the ICEV-petrol, while the BEV contributes almost half the impact of the HEV and ICEV-diesel.
The midpoint results show that the BEV with the 2015 electricity mix is advantageous in terms of fossil resource scarcity and ionising radiation, while the ICEVs and HEV lead in the categories of global warming, human carcinogenic and non-carcinogenic toxicity, and land use.

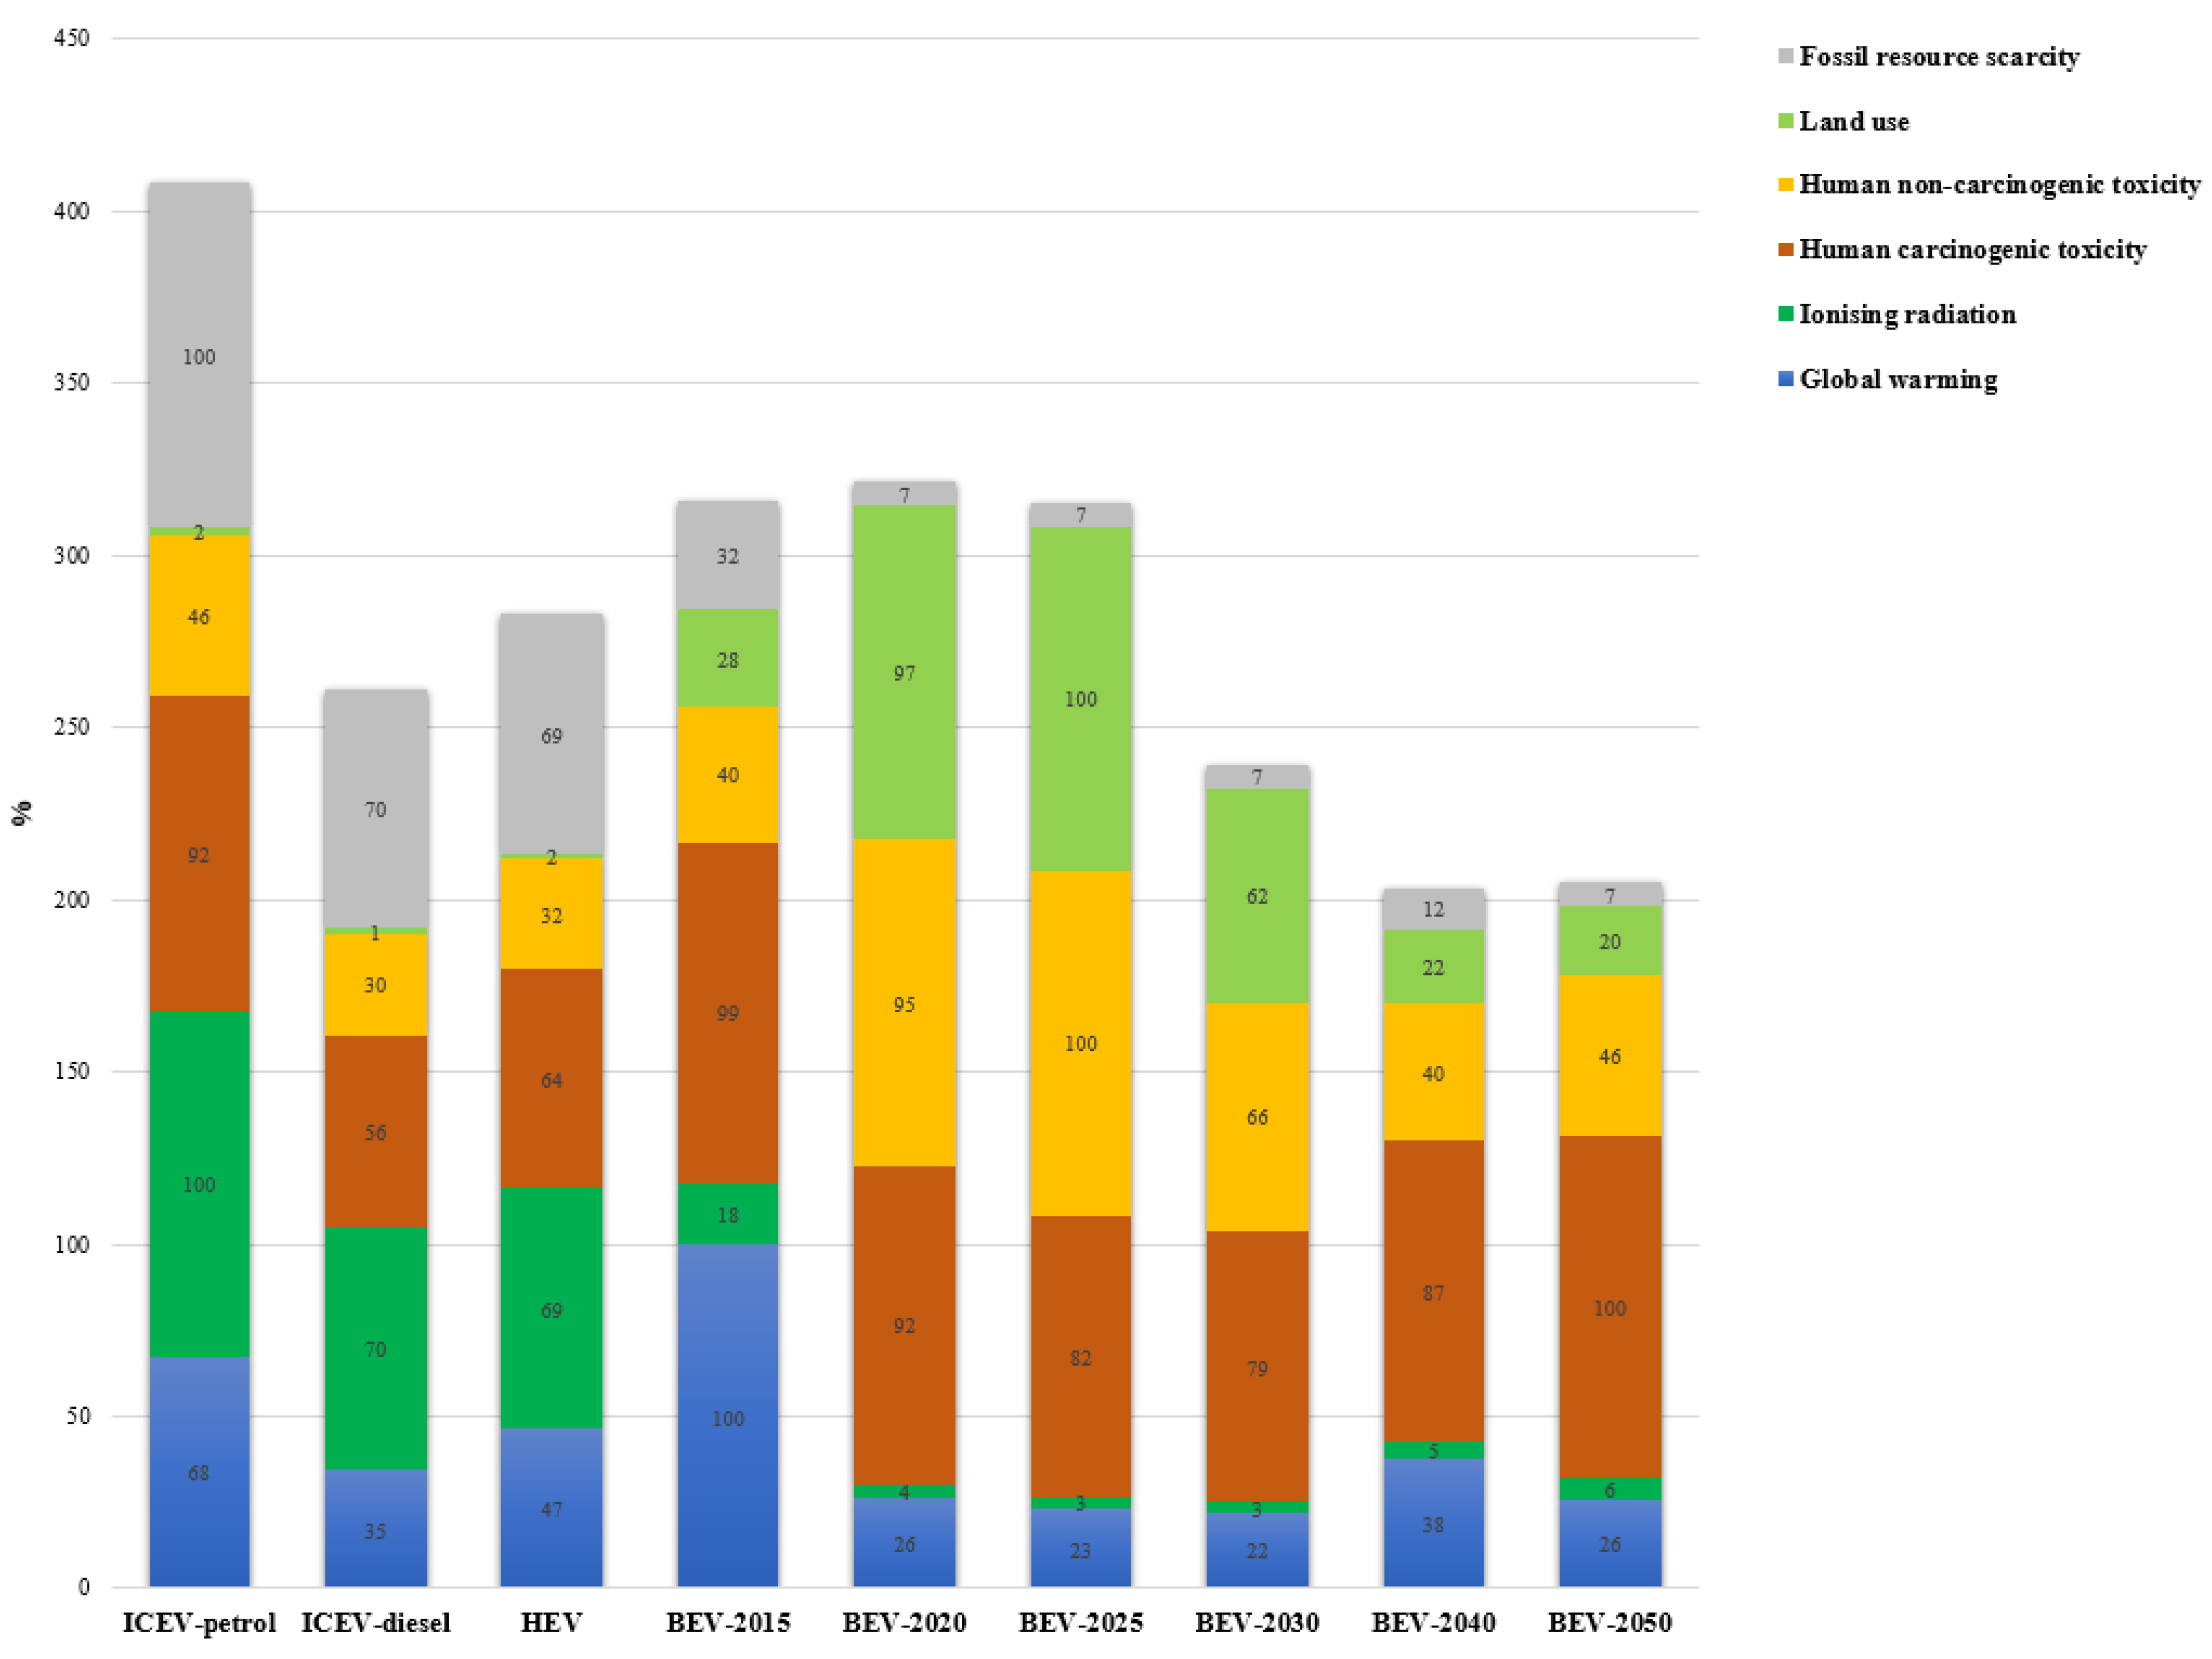
3.2. Comparative Well-to-Wheel Results of BEV (Electricity Mix Scenarios 2015–2050), HEV, and ICEVs at the Midpoint Level

The impact on the environment for the BEV depends on the electricity production mix. Therefore, Figure 4 presents the Well-to-Wheel analysis, showing the impact of the fuel cycle from the energy resource extraction until operation using various electricity production scenarios that are forecasted for the years 2015–2050 under Lithuanian conditions. All impacts were normalised according to the major contributor in the corresponding impact category. For instance, ICEV-petrol has the highest values in fossil resource scarcity and ionising radiation; therefore, these values are equated to 100%, and the impact values of the other analysed vehicles are calculated accordingly. Similarly, the most significant contributors to the other impact categories were identified, and the impact of the other vehicles was assessed accordingly.
The results show that in 2015, due to the use of natural gas (as the largest share) and oil, this electricity mix was the most polluting in terms of global warming potential. The BEV with an electricity mix of 2020–2050 is about 60–78% less than the BEV with the electricity mix of 2015 and ICEV-petrol, 45% less than the HEV, and 25% less than the ICEV-diesel. Furthermore, in terms of fossil resource scarcity, all the BEVs with electricity mixes from 2020 to 2050 are approximately 10 and 14 times more advantageous than the diesel and petrol car, respectively. The results reveal that the BEVs with electricity scenarios of 2040 and 2050 are the most desirable, with the values in almost all the impact categories among the lowest (except human carcinogenic toxicity). This is because solar and wind energy are actively used as the predominant sources in these scenarios.

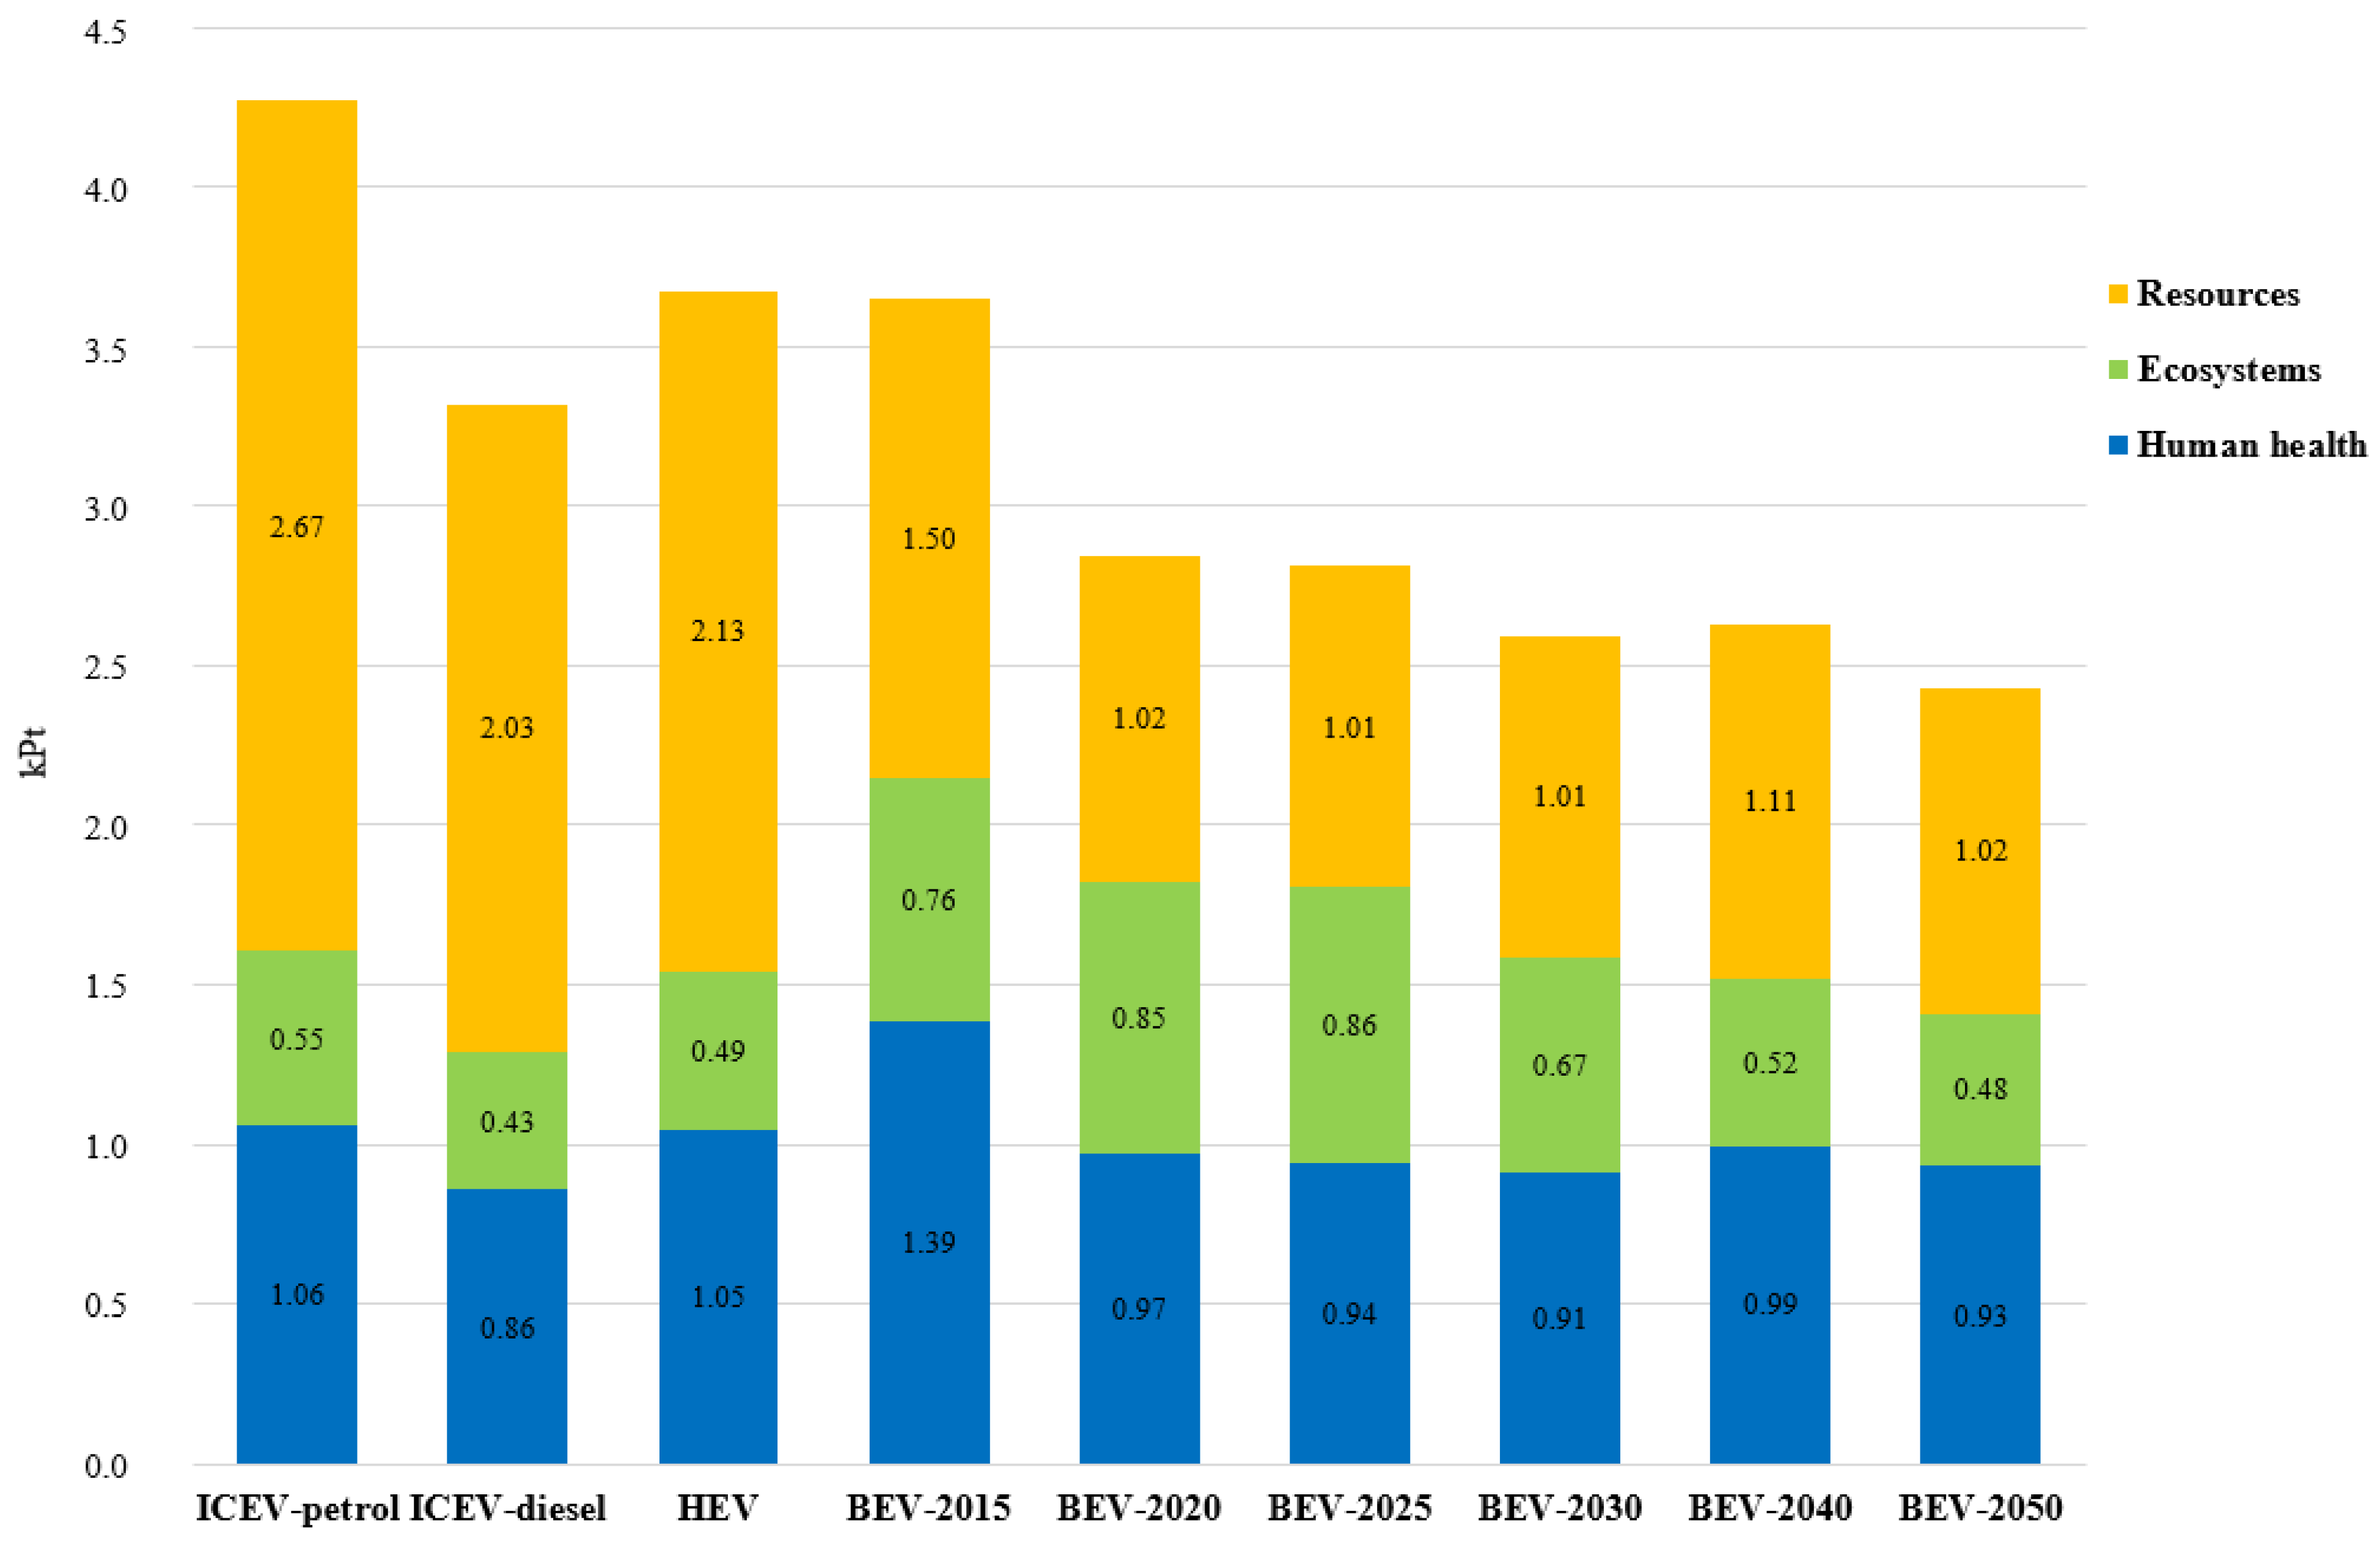
3.3. Endpoint Results of the LCA

The environmental LCA all over the entire life cycle (production, use, and end-of-life) was also investigated at the endpoint level. The results are shown in Figure 5 and summarise the total environmental load as damage to resources, ecosystems, and human health. The results are expressed as a single score, in which the characterisation, damage assessment, normalisation, and weighting are combined. The units are called points (Pt) and kilo points (kPt) in this case.
The results reveal that the ICEV-petrol has the greatest environmental damage compared with all the analysed passenger cars. The HEV and BEV with the electricity mix of 2015 have almost the same environmental damage, which is 14% less than that of the ICEV-petrol. Next, the ICEV-diesel contributes 10% less impact than the HEV and BEV. Furthermore, the BEVs with electricity mix scenarios from 2020 to 2050, which are composed primarily of RESs, provide the least environmental damage. These results reveal that switching from the usage of fossil fuels to renewables and expansion the RES share in electricity generation has a meaningful benefit in fostering sustainable city transportation.

3.4. Results of the Life Cycle Costing

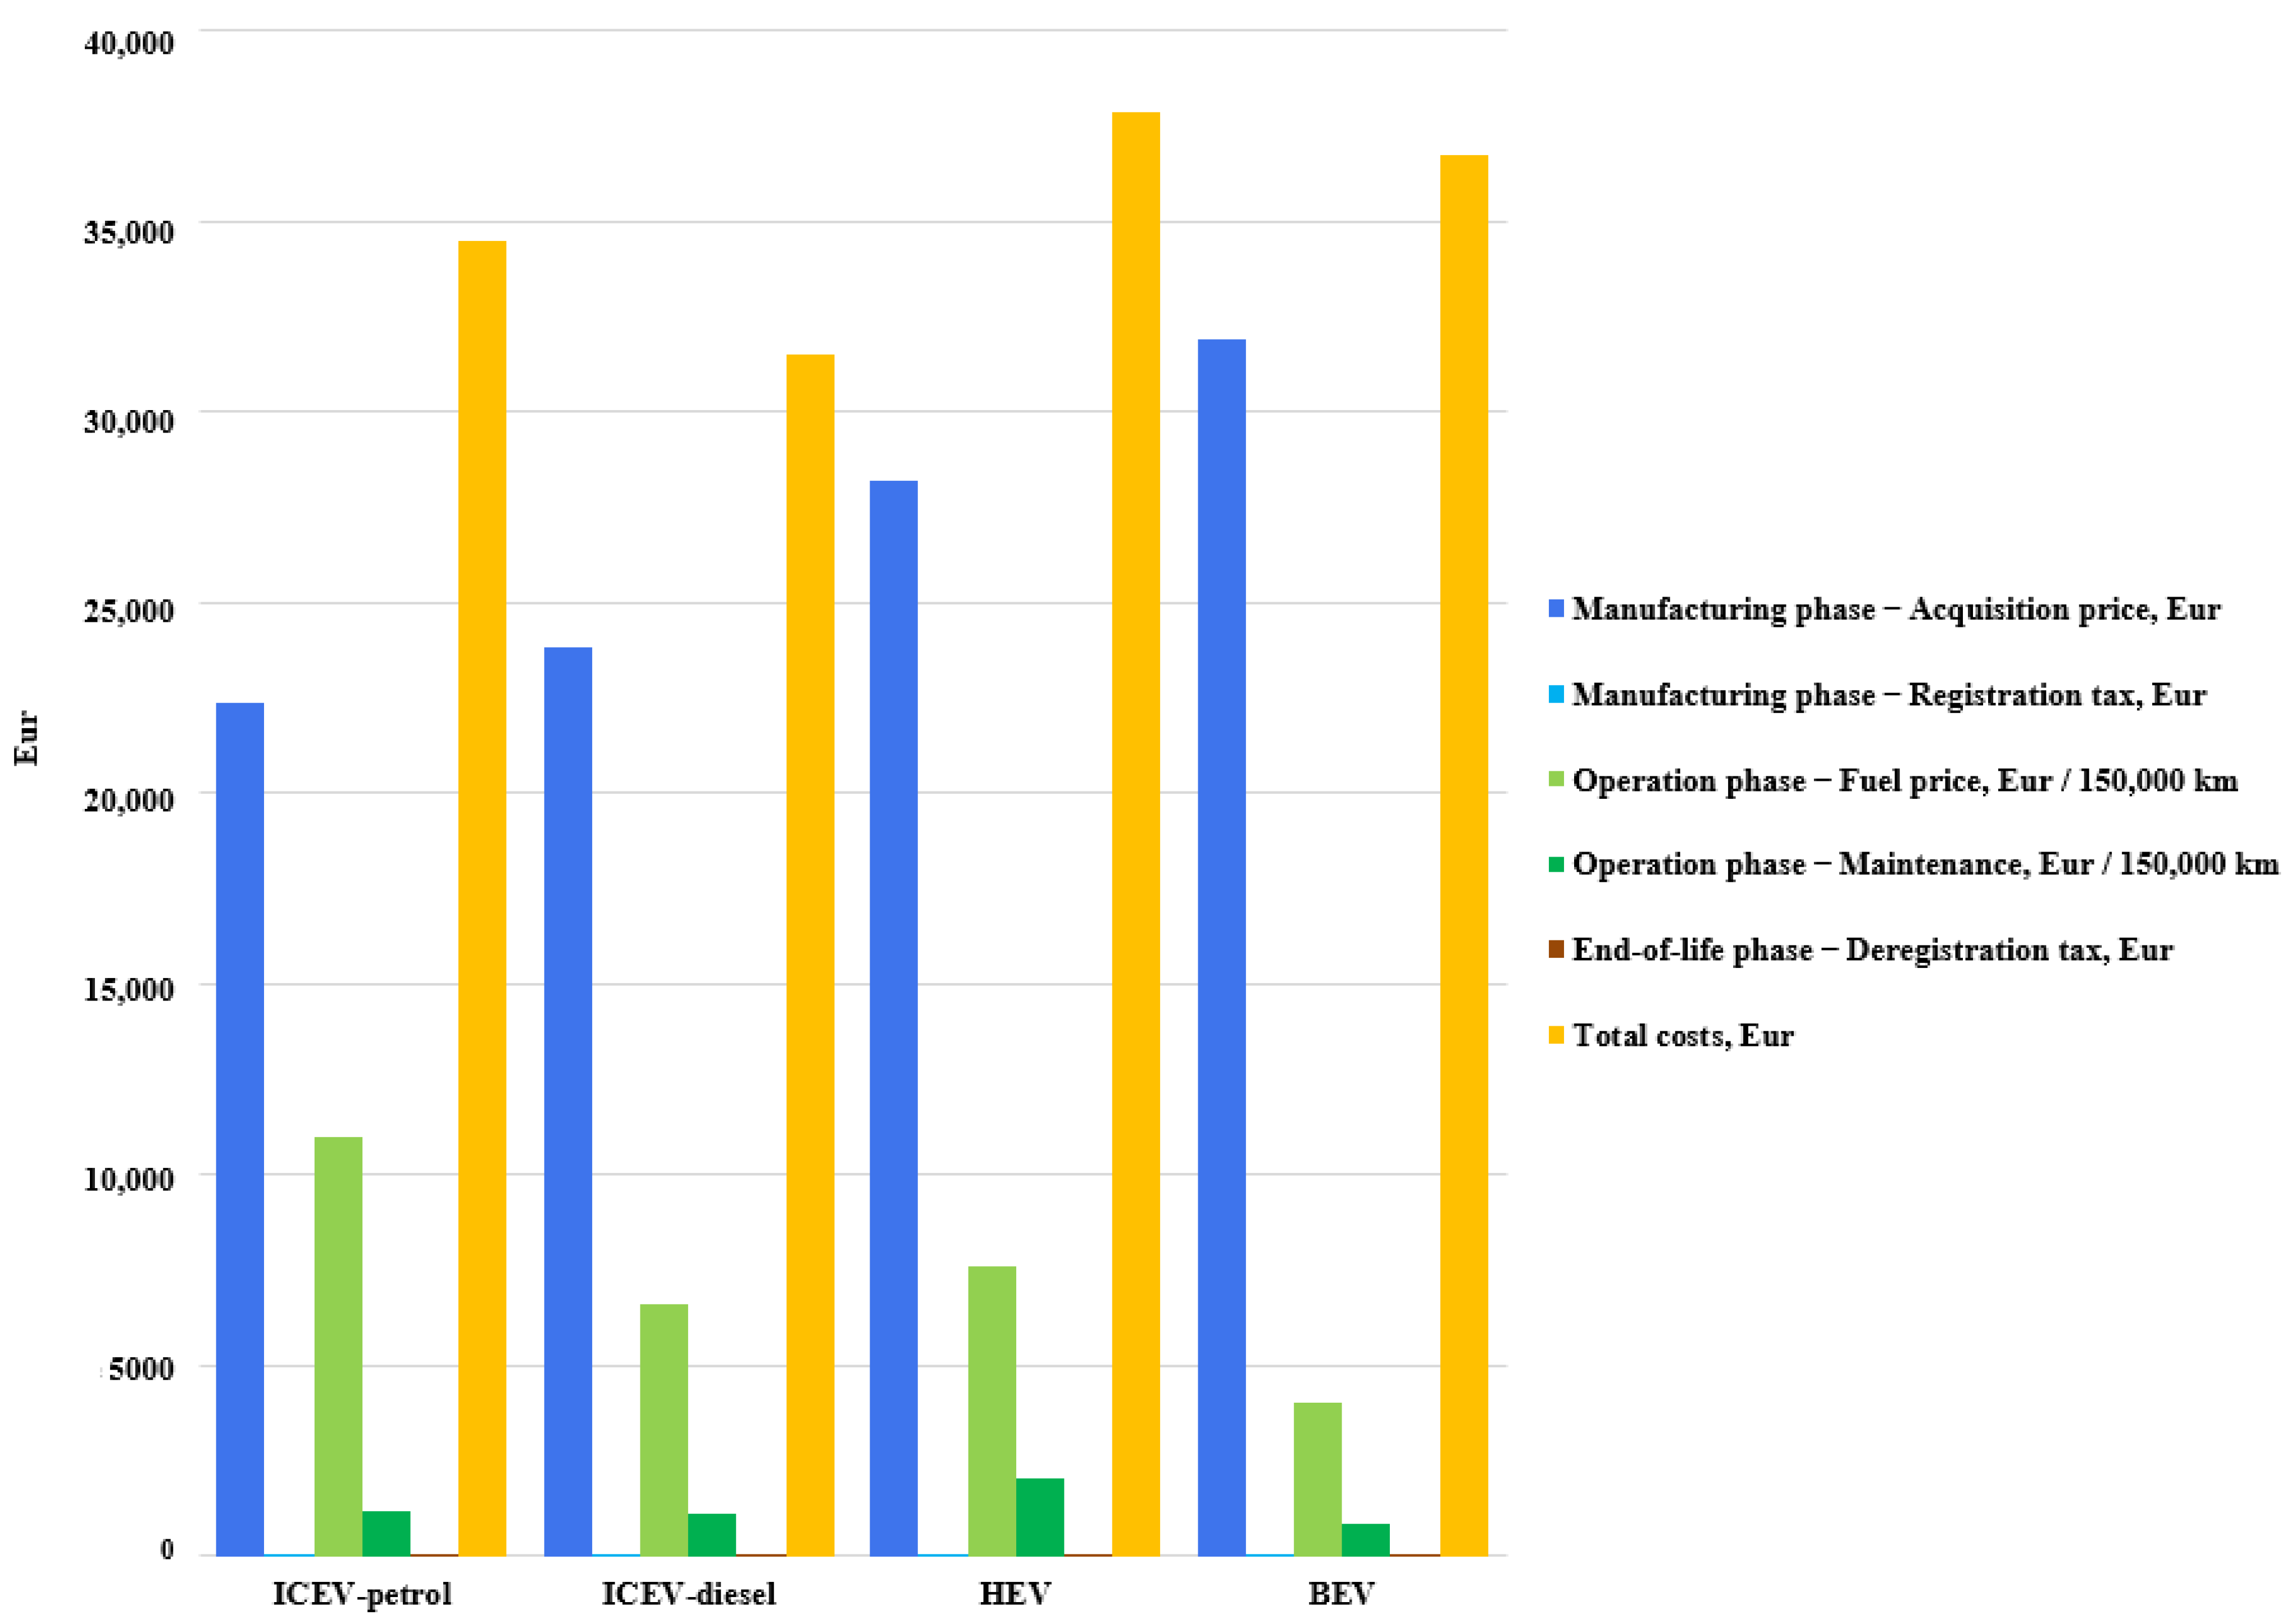
3.4.1. Results of the LCC from Consumer Side

The results of the LCC from the consumer side are presented in Figure 6.
The graph presents the results of the comparative LCC analysis of the same passenger cars from the consumer side under Lithuanian conditions. The manufacturing phase includes acquisition and registration tax; the operation phase includes maintenance and fuel price; the end-of-life phase includes only deregistration tax. When owners of a specified vehicle intend to discard their vehicles as waste, they have to deposit that vehicle at an authorised treatment facility for proper treatment and recovery, which is free of charge; therefore, it was omitted. All the costs include a value-added tax of 21%.
The results show that hybrid and battery electric cars have the highest costs because of the high purchase prices, while internal combustion vehicles have the lowest prices. However, comparing the operation stage, the electric cars are approximately 37% less costly than diesel cars and 60% less than petrol cars. It is assumed that an electric car is charged at home at the average cost of electricity of 0.13 Eur/kWh in 2019 for household consumers [51]. This charging scenario was used because charging at the public charging stations is more unpredictable due to the prices’ differences and more rare and stochastic usage. Moreover, the operation costs for electric car owners can be even less because most public charging stations are free of charge.
In 2020, spring financial incentives have been implemented to promote the purchase of electric passenger cars. Consumers can potentially receive a compensation of 2000 Eur to purchase a used electric car and 4000 Eur for the purchase of a new electric car. Therefore, Table 4 shows the same comparative results of the LCC from a consumer point of view, but with the compensation included.
Comparing the total costs, the results indicate that electric and diesel cars are the most competitive, where the total consumer life cycle costs are approximately 5–15% less than others.

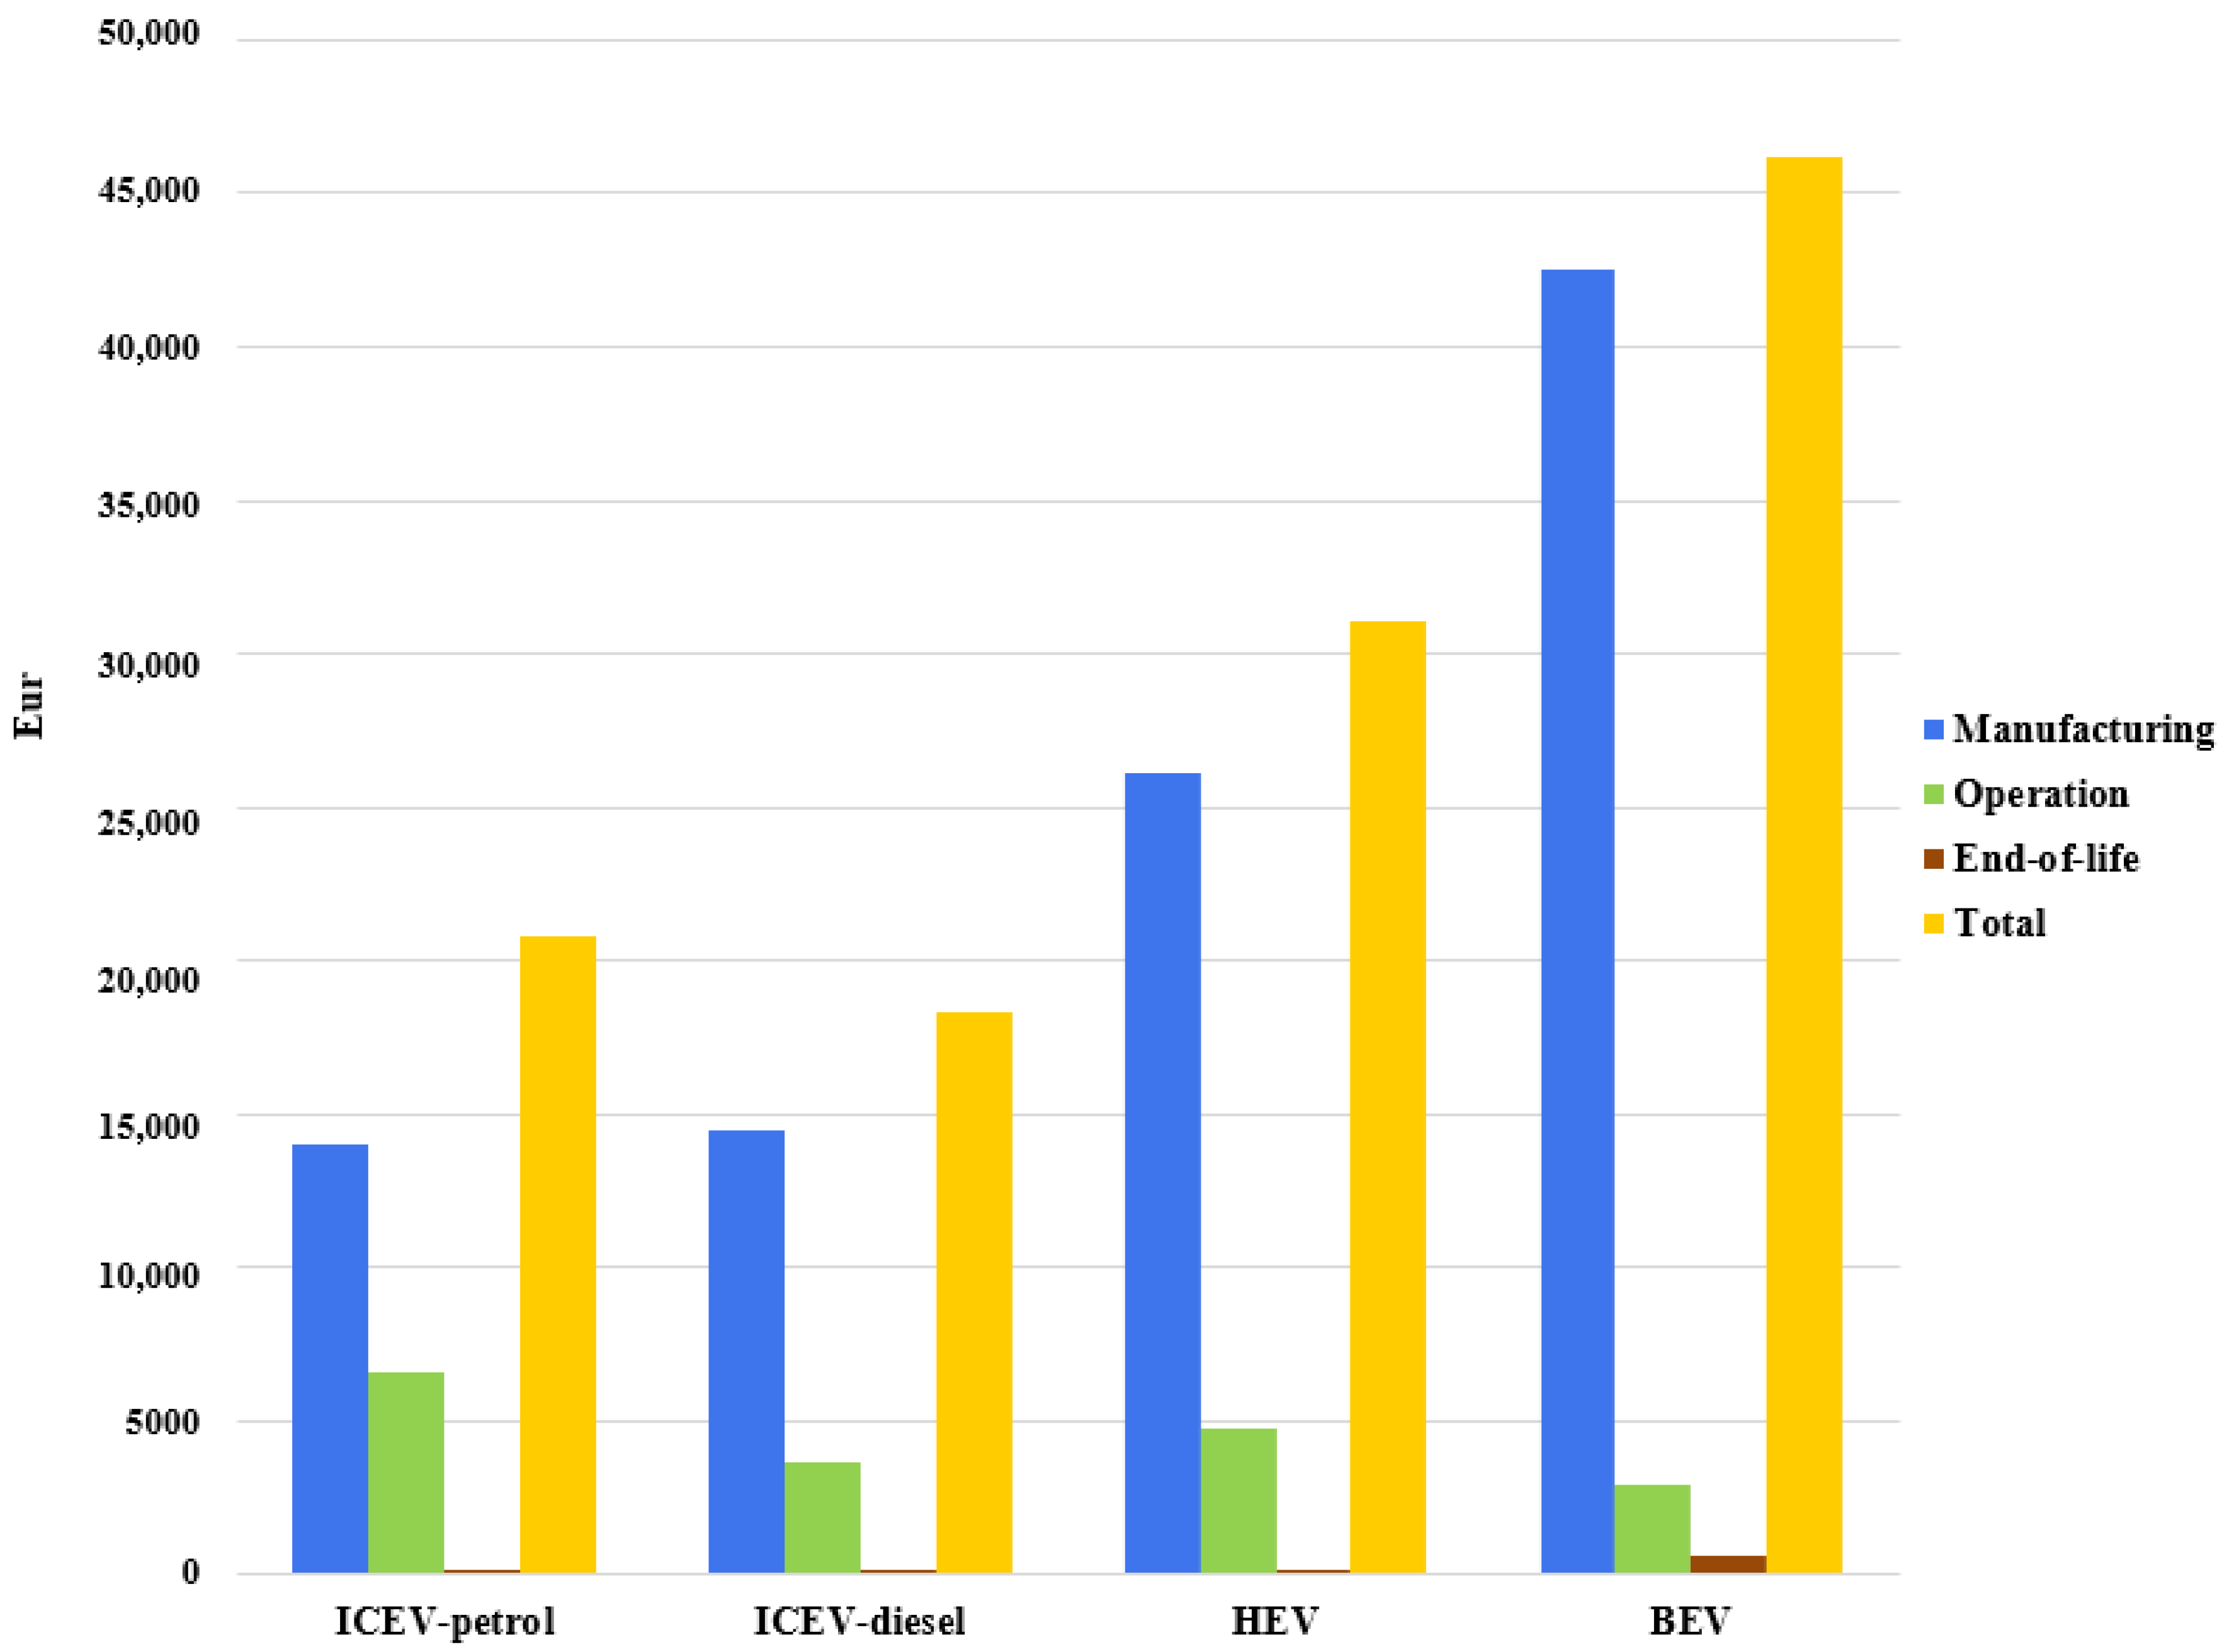
3.4.2. Results of the LCC from Manufacturer Side

A complete life cycle cost analysis should be performed not only on the consumer side, but also for the manufacturer. Therefore, Figure 7 presents the results from the manufacturer side, combining the manufacturing phase, which includes the passenger car and battery production, the operation phase, with fuel production and distribution and road and car maintenance, and the end-of-life phase, with manual dismantling, treatment of glider, powertrain or internal combustion engine, and batteries.
As mentioned in the methodology, the values were obtained using OpenLCA software with the Ecoinvent v3.5 database. It is necessary to mention that the data from the database were provided for 2005. Accordingly, due to data limitations, the results may differ from the present times. Nevertheless, the analysis intended to highlight that these results are similar to the previous graph in that the BEV has the highest costs in the production stage and the lowest costs during the operation stage.

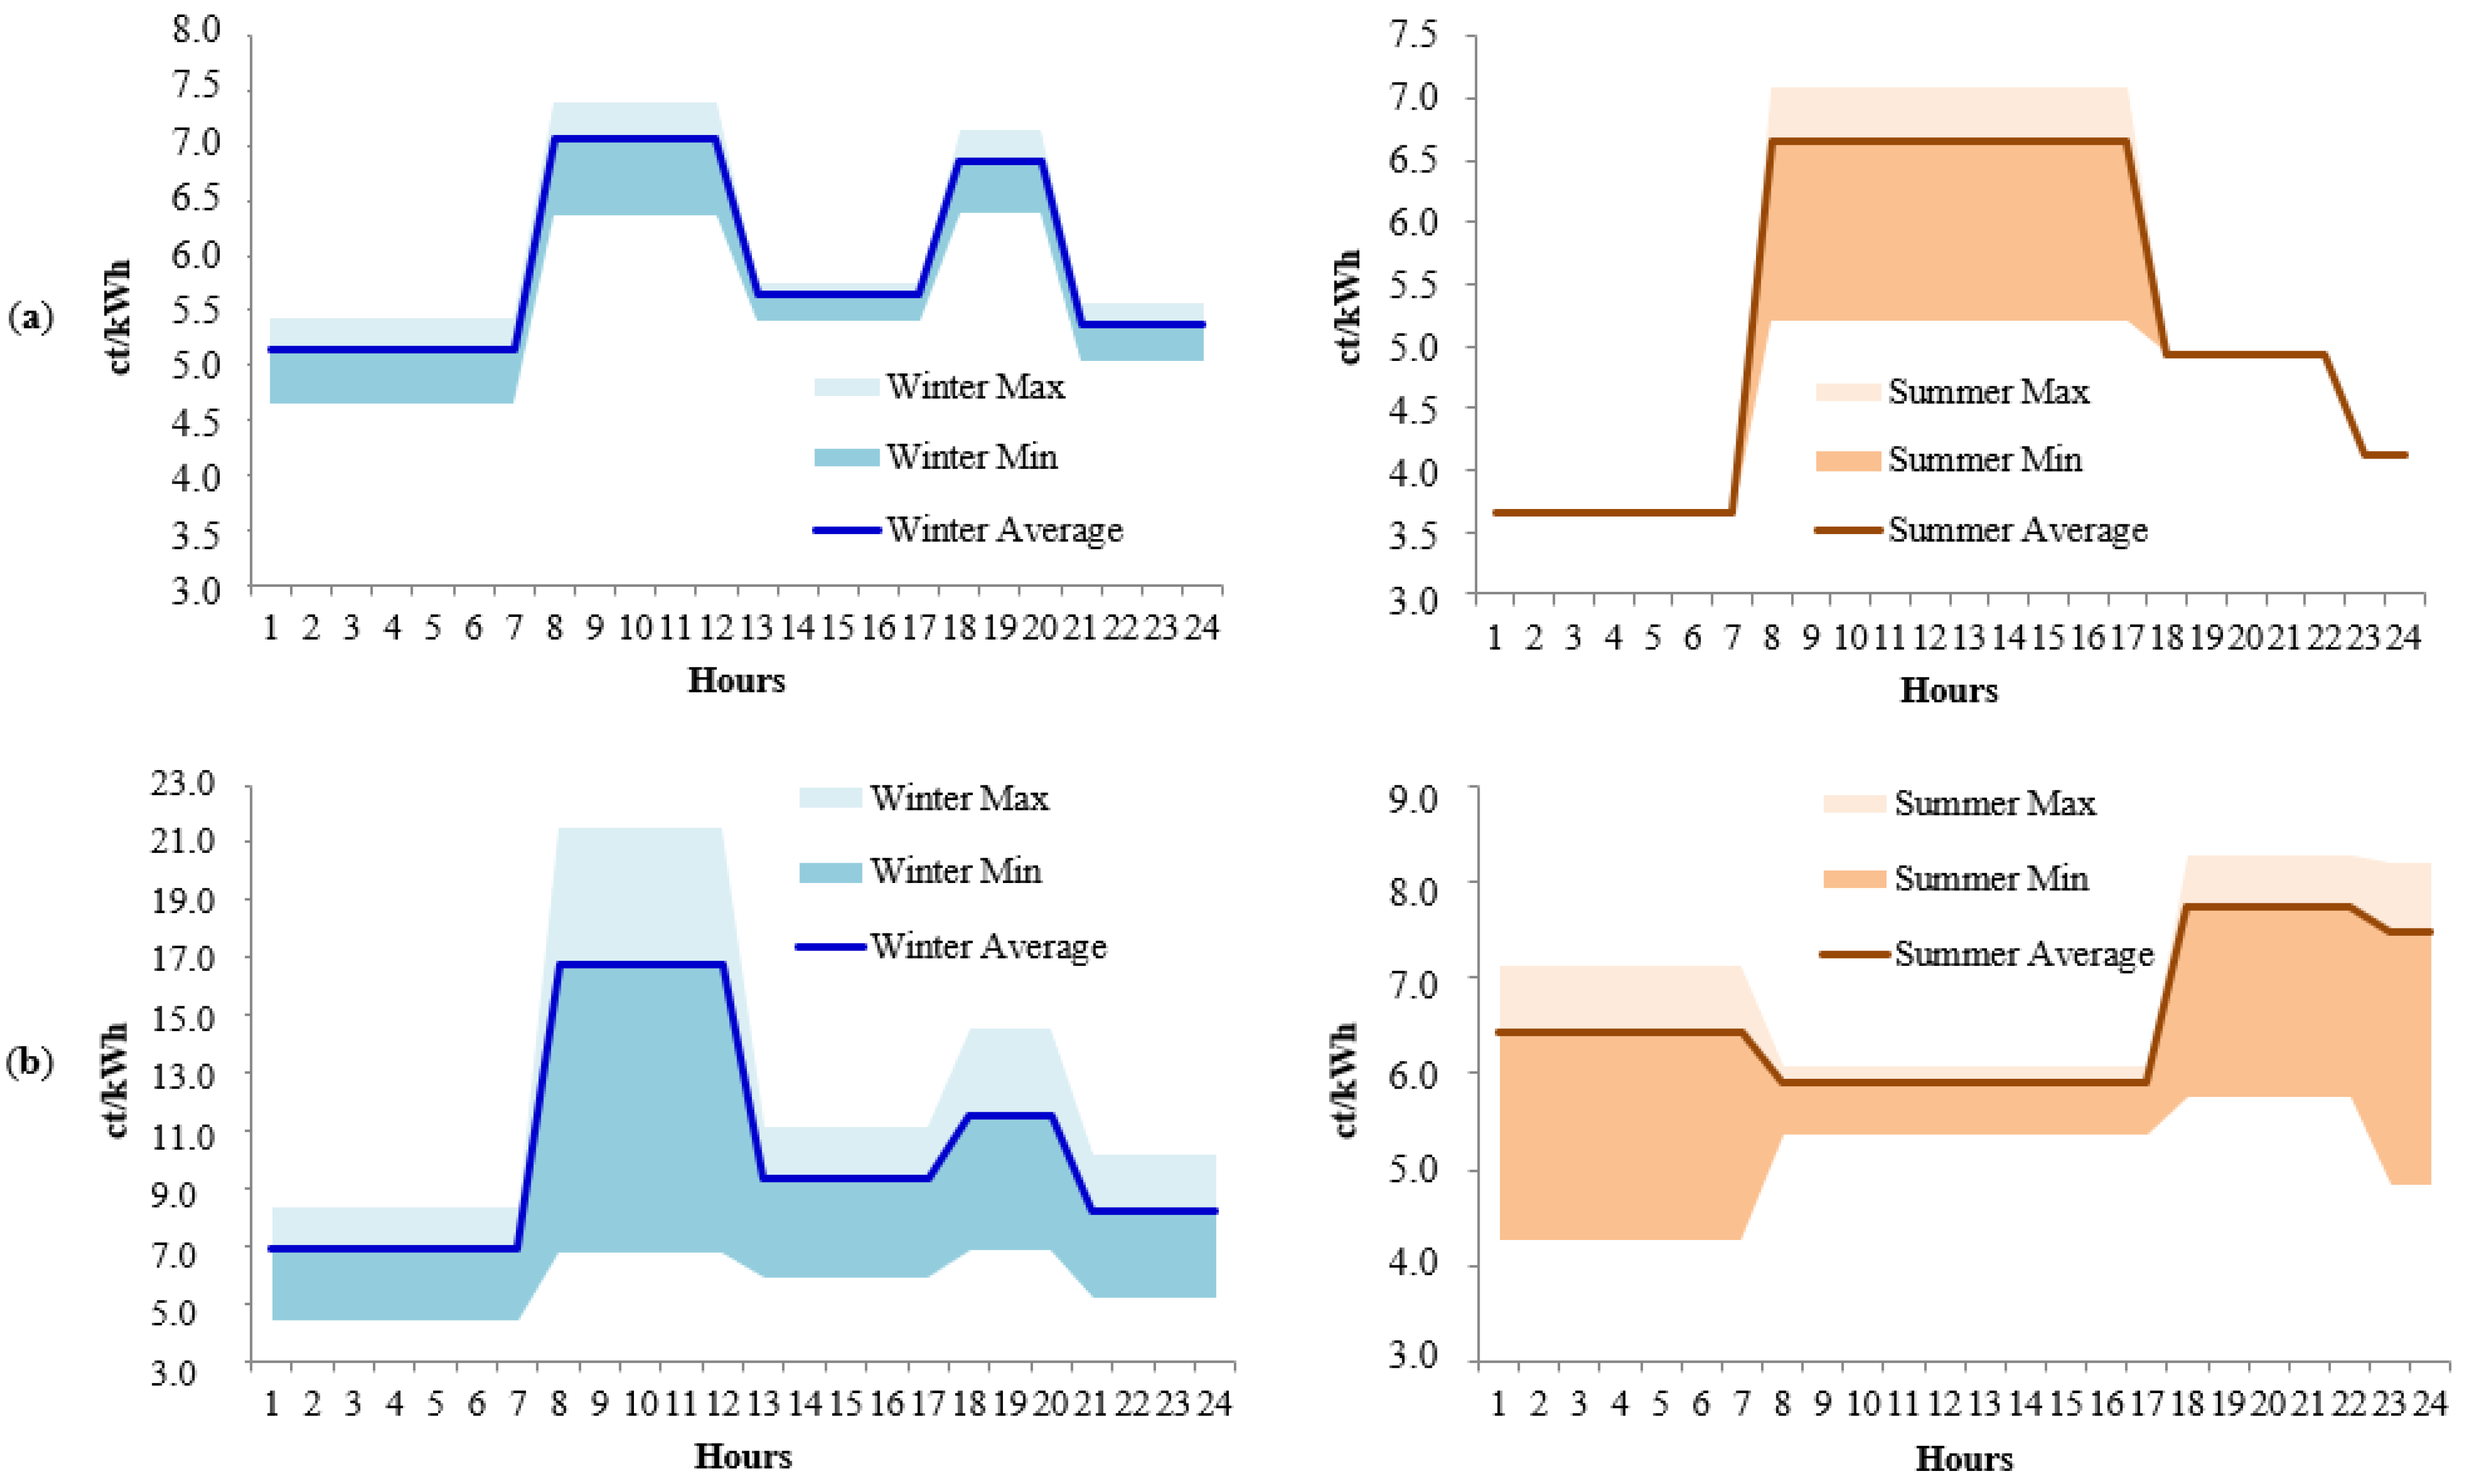
3.4.3. Electricity Production Costs for 2020 and 2040 Scenarios

Electricity production plays a critical role in measuring the most advantageous electricity mix and the most cost-effective time to charge the BEV. Figure 8 shows a comparison of electricity production costs (euro cent/kWh) for 2020 and 2040, which are projected under Lithuanian conditions.
The present results show that in the winter and summer seasons of 2020 as well as in the winter of 2040, the most cost-effective price to charge the BEV is from the late evening until 7 a.m. The short time interval in the middle of the day in terms of the price of electricity is also favourable for charging electric cars. In the summer season of 2040, the cheapest electricity is from 8 a.m. to 5 p.m. This is because solar energy is the dominant source (30%) in the 2040 scenario and generates excess energy during the summer. On the contrary, in 2020, solar energy accounts for only 6% of the electricity mix and the dominant source is wind (37%); therefore, solar energy does not generate excess energy during the summer, which leads to a higher price from 8 a.m. to 5 p.m., while the cost-effective price is from the late evening until 7 a.m. In addition, it should be mentioned that the volatility of wind and solar power generation increases electricity price fluctuations. This is clearly seen when comparing the possible price deviations from the average price in 2020 and 2040. The use of smart BEV charging options would partially rationally use these electricity price fluctuations to increase transportation efficiency as well as contribute to balancing electricity generation and consumption at individual points in time.

4. Conclusions

This research aims to reveal the current situation in Lithuania according to the existing information, technologies, and available databases. The main focus in LCA was assessment of BEV’s performance with different electricity mix scenarios prognosticated using scientific modelling for the years 2015–2050, according to the goals stated in National Energy Independency Strategy of Lithuania. The idea was to show how the impact on the environment would change if the electricity mix used to recharge the battery was generated from various proportions of renewable energy sources.
In accordance with the assumptions and limitations declared in the methodology, the following conclusions of LCA and LCC were drawn. The results at the midpoint level showed that all over the entire life cycle, the BEV with the 2015 electricity mix is advantageous in terms of fossil resource scarcity and ionising radiation, while the HEV and ICEVs caused a lower impact on global warming, land use, and human cancerogenic and non-carcinogenic toxicity. However, in the 2020–2050 electricity mix scenarios, renewable energy sources will be increased significantly. As a result, in terms of global warming, the contribution of the BEVs (electricity mix of 2050) will decrease by approximately 40%. Endpoint results showed that the petrol car has the most environmental damage (especially in resources). The HEV and BEV with the electricity mix of 2015 cause the same environmental damage, which is 14% less than that of the ICEV-petrol. Next, the ICEV-diesel contributes 10% less impact than the HEV. Furthermore, the BEVs with the 2020–2050 electricity mix scenarios, which are composed primarily of RESs, have the least environmental damage. As a result, the BEV with an electricity mix of 2050 contributes 43%, 33%, and 27% smaller environmental impacts than the ICEV-petrol, BEV (electricity mix of 2015), and ICEV-diesel, respectively.
A life cycle cost analysis was carried out from an economic perspective for the same passenger cars to estimate and compare costs over the life cycle under Lithuanian conditions. The life cycle cost analysis indicated that electric and diesel cars are the most competitive, where the total consumer life cycle costs are approximately 5–15% less than the others. In addition, the analyses from both the manufacturer and consumer sides determined that the BEV is the most cost-efficient vehicle during the operation stage (with approximately half less expenses), which can be even more beneficial if the BEV is charged from the late evening until 7 a.m.
More research is necessary not only from an environmental and economic perspectives but also from a social aspect. A social life cycle analysis would be valuable to better understand all the advantages that electric mobility can ensure as well as to fulfil the analysis of the life cycle sustainability assessment.

Author Contributions

Conceptualisation, K.P. and J.D.; data curation, K.P. and A.G.; investigation, K.P. and A.G.; methodology, K.P. and D.K.; supervision, J.D.; validation, K.P.; visualization, K.P. and D.K.; writing—original draft, K.P.; writing—review and editing, K.P., A.G. and D.K. All authors have read and agreed to the published version of the manuscript.

Funding

This research received no external funding.

Institutional Review Board Statement

Not applicable.

Informed Consent Statement

Not applicable.

Conflicts of Interest

The authors declare no conflict of interest.

References

  1. European Commission. Climate strategies & Targets. 2018. Available online: https://ec.europa.eu/clima/policies/strategies (accessed on 26 November 2020).
  2. European Commission. Communication and Roadmap on the European Green Deal; European Commission: Brussels, Belgium, 2019. [Google Scholar]
  3. EUROSTAT. Statistics Explained. Climate Change-Driving Forces. 2020. Available online: https://ec.europa.eu/eurostat/statistics-explained/index.php?title=Climate_change_-_driving_forces&oldid=461591#General_overview (accessed on 24 November 2020).
  4. Environmental Protection Agency. Lithuania‘s National Inventory Report 2020; Greenhouse Gas Emissions 1990–2018; Environmental Protection Agency: Vilnius, Lithuania, 2020.
  5. European Commission. The EU Environmental Implementation Review Country Report-LITHUANIA; European Commission: Brussels, Belgium, 2017. [Google Scholar]
  6. State Enterprise “Regitra”. Statistics on Vehicles Registered in Lithuania. 2020. Available online: https://www.regitra.lt/lt/paslaugos/duomenu-teikimas/statistika/transporto-priemones-2 (accessed on 1 January 2021).
  7. European Environmental Agency. Electric Vehicles from Life Cycle and Circular Economy Perspectives; TERM 2018: Transport and Environment Reporting Mechanism (TERM) Report; European Environmental Agency: Copenhagen, Denmark, 2018.
  8. European Commission. Electrification of the Transport System; European Commission: Brussels, Belgium, 2017. [Google Scholar]
  9. Burchart-Korol, D.; Jursova, S.; Folęga, P.; Pustejovska, P. Life cycle impact assessment of electric vehicle battery charging in European Union countries. J. Clean. Prod. 2020, 257, 120476. [Google Scholar] [CrossRef]
  10. Del Pero, F.; Delogu, M.; Pierini, M. Life Cycle Assessment in the automotive sector: A comparative case study of Internal Combustion Engine (ICE) and electric car. Procedia Struct. Integr. 2018, 12, 521–537. [Google Scholar] [CrossRef]
  11. Choi, H.; Shin, J.; Woo, J. Effect of electricity generation mix on battery electric vehicle adoption and its environmental impact. Energy Policy 2018, 121, 13–24. [Google Scholar] [CrossRef]
  12. Athanasopoulou, L.; Bikas, H.; Stavropoulos, P. Comparative Well-to-Wheel Emissions Assessment of Internal Combustion Engine and Battery Electric Vehicles. Procedia CIRP 2018, 78, 25–30. [Google Scholar] [CrossRef]
  13. Renewable Energy Statistics. Available online: https://ec.europa.eu/eurostat/statistics-explained/index.php/Renewable_energy_statistics (accessed on 24 November 2020).
  14. Ministry of Energy of the Republic of Lithuania. Statistics of Renewable Energy Resources. 2020. Available online: http://enmin.lrv.lt/lt/veiklos-sritys-3/atsinaujinantys-energijos-istekliai/statistika (accessed on 22 November 2020).
  15. Ministry of Energy of the Republic of Lithuania. National Energy Independence Strategy; Ministry of Energy of the Republic of Lithuania: Vilnius, Lithuania, 2018. [Google Scholar]
  16. National Energy and Climate Action Plan of the Republic of Lithuania for 2021–2030. Available online: https://am.lrv.lt/uploads/am/documents/files/KLIMATO%20KAITA/Integruotas%20planas/Final%20NECP.pdf (accessed on 1 January 2021).
  17. European Automobile Manufacturers Association. New Passenger Car Registrations by Fuel Type in the European Union. 2020. Available online: https://www.acea.be/uploads/press_releases_files/20201105_PRPC_fuel_Q3_2020_FINAL.pdf (accessed on 1 January 2021).
  18. The Environmental Projects Management Agency under the Ministry of Environment of the Republic of Lithuania. Promoting the Purchase of Electric Vehicles by Individuals. 2020. Available online: https://www.apva.lt/ (accessed on 17 December 2020).
  19. The Environmental Projects Management Agency under the Ministry of Environment of the Republic of Lithuania. Invitation to Purchase a Lower Pollution Car. 2020. Available online: https://www.apva.lt/ (accessed on 17 December 2020).
  20. The Environmental Projects Management Agency under the Ministry of Environment of the Republic of Lithuania. Business Support for the Purchase of New Electric Cars and Buses. 2020. Available online: https://www.apva.lt/ (accessed on 17 December 2020).
  21. Petrauskiene, K.; Dvarioniene, J.; Kaveckis, G.; Kliaugaite, D.; Chenadec, J.; Hehn, L.; Pérez, B.; Bordi, C.; Scavino, G.; Vignoli, A.; et al. Situation analysis of policies for electric mobility development: Experience from five European regions. Sustainability 2020, 12, 2935. [Google Scholar] [CrossRef] [Green Version]
  22. Hauschild, M.Z.; Rosenbaum, R.K.; Olsen, S.I. Life Cycle Assessment: Theory and Practice; Springer Nature: Cham, Switzerland, 2018. [Google Scholar]
  23. Kambanou, M.L. Life Cycle Costing: Understanding How It Is Practised and Its Relationship to Life Cycle Management—A Case Study. Sustainability 2020, 12, 3252. [Google Scholar] [CrossRef] [Green Version]
  24. Visentin, C.; Trentin, A.W.S.; Braun, B.A.; Thomé, A. Life cycle sustainability assessment: A systematic literature review through the application perspective, indicators, and methodologies. J. Clean. Prod. 2020, 270, 122509. [Google Scholar] [CrossRef]
  25. Fauzi, R.T.; Lavoie, P.; Sorelli, L.; Heidari, M.D.; Amor, B. Exploring the Current Challenges and Opportunities of Life Cycle Sustainability Assessment. Sustainability 2019, 11, 636. [Google Scholar] [CrossRef] [Green Version]
  26. Kara, S.; Li, W.; Sadjiva, N. Life Cycle Cost Analysis of Electrical Vehicles in Australia. Procedia CIRP 2017, 61, 767–772. [Google Scholar] [CrossRef]
  27. Prud’homme, R.; Koning, M. Electric vehicles: A tentative economic and environmental evaluation. Transp. Policy 2012, 23, 60–69. [Google Scholar] [CrossRef] [Green Version]
  28. Bubeck, S.; Tomaschek, J.; Fahl, U. Perspectives of electric mobility: Total cost of ownership of electric vehicles in Germany. Transp. Policy 2016, 50, 63–77. [Google Scholar] [CrossRef]
  29. Wu, G.; Inderbitzin, A.; Bening, C. Total cost of ownership of electric vehicles compared to conventional vehicles: A probabilistic analysis and projection across market segments. Energy Policy 2015, 80, 196–214. [Google Scholar] [CrossRef]
  30. Bekel, K.; Pauliuk, S. Prospective cost and environmental impact assessment of battery and fuel cell electric vehicles in Germany. Int. J. Life Cycle Assess. 2019, 24, 2220–2237. [Google Scholar] [CrossRef]
  31. Danielis, R.; Giansoldati, M.; Rotaris, L. A probabilistic total cost of ownership model to evaluate the current and future prospects of electric cars uptake in Italy. Energy Policy 2018, 119, 268–281. [Google Scholar] [CrossRef]
  32. Cox, B.; Bauer, C.; Beltran, A.M.; van Vuuren, D.P.; Mutel, C.L. Life cycle environmental and cost comparison of current and future passenger cars under different energy scenarios. Appl. Energy 2020, 269, 115021. [Google Scholar] [CrossRef]
  33. Gilmore, E.A.; Lave, L.B. Comparing resale prices and total cost of ownership for gasoline, hybrid and diesel passenger cars and trucks. Transp. Policy 2013, 27, 200–2008. [Google Scholar] [CrossRef]
  34. Mitropoulos, L.K.; Prevedouros, P.D.; Kopelias, P. Total cost of ownership and externalities of conventional, hybrid and electric vehicle. Transp. Res. Procedia 2017, 24, 267–274. [Google Scholar] [CrossRef]
  35. Mitropoulos, L.K.; Prevedouros, P.D. Life cycle emissions and cost model for urban light duty vehicles. Transp. Res. Part D 2015, 41, 147–159. [Google Scholar] [CrossRef]
  36. Traut, E.; Hendrickson, C.; Klampfl, E.; Liu, Y.; Michalek, J.J. Optimal design and allocation of electrified vehicles and dedicated charging infrastructure for minimum life cycle greenhouse gas emissions and cost. Energy Policy 2012, 51, 524–534. [Google Scholar] [CrossRef]
  37. ISO 14040. Environmental Management-Life Cycle Assessment-Principles and Framework; International Organization for Standardization: Geneva, Switzerland, 2006. [Google Scholar]
  38. ISO 14044. Environmental Management-Life Cycle Assessment-Requirements and Guidelines; International Organization for Standardization: Geneva, Switzerland, 2006. [Google Scholar]
  39. Nissan Leaf Representative in Lithuania. Nissan Leaf Technical Specifications and Price-List. 2020. Available online: https://www-europe.nissan-cdn.net/content/dam/Nissan/lt/brochures/lt_pricesandspec/LEAF_Klientų_kainininkai_MY19.pdf (accessed on 24 November 2020).
  40. Yang, Z.; Wang, B.; Jiao, K. Life cycle assessment of fuel cell, electric and internal combustion engine vehicles under different fuel scenarios and driving mileages in China. Energy 2020, 198, 117365. [Google Scholar] [CrossRef]
  41. Tagliaferri, C.; Evangelisti, S.; Acconcia, F.; Domenech, T.; Ekins, P.; Barletta, D.; Lettieri, P. Life cycle assessment of future electric and hybrid vehicles: A cradle-to-grave systems engineering approach. Chem. Eng. Res. Des. 2016, 112, 298–309. [Google Scholar] [CrossRef]
  42. Burchart-Korol, D.; Jursova, S.; Folęga, P.; Korol, J.; Pustejovska, P.; Blaut, A. Environmental life cycle assessment of electric vehicles in Poland and the Czech Republic. J. Clean. Prod. 2018, 202, 476–487. [Google Scholar] [CrossRef]
  43. National Institute for Public Health and the Environment. A Harmonized Life Cycle Impact Assessment Method at Midpoint and Endpoint Level Report I: Characterization; ReCiPe 2016 v1.1; RIVM: Bilthoven, The Netherlands, 2017.
  44. Swiss Centre for Life Cycle Inventories. Ecoinvent Database v3.5. 2019. Available online: https://www.ecoinvent.org/ (accessed on 10 November 2020).
  45. PRé Sustainability. SimaPro-LCA Software for Fact-Based Sustainability. 2020. Available online: https://simapro.com/ (accessed on 20 November 2020).
  46. GreenDelta. openLCA-Open Source Life Cycle Assessment Software. 2020. Available online: https://www.openlca.org/ (accessed on 21 November 2020).
  47. Electric Vehicle Database. Technical Specification of Nissan Leaf. 2019. Available online: https://ev-database.org/car/1106/Nissan-Leaf (accessed on 25 November 2020).
  48. Volkswagen Representative in Lithuania. Volkswagen Golf Technical Specifications and Price-List. 2020. Available online: https://www.volkswagen.lt/lt/models-and-configurator/golf-8.html#MOFA (accessed on 20 November 2020).
  49. JSC, Mototoja. Toyota Prius Technical Specifications and Price-List. 2020. Available online: https://www.mototoja.lt/toyota/lt/toyota-modeliai1126/toyota-modeliai2/car-14 (accessed on 18 November 2020).
  50. Lithuanian Energy Institute. Evaluation of the Implementation of Energy Policies listed in the National Energy Independence Strategy Project; Lithuanian Energy Institute: Kaunas, Lithuania, 2017. [Google Scholar]
  51. Statistics Lithuania. Electricity Prices for Household Consumers. 2020. Available online: https://osp.stat.gov.lt/statistiniu-rodikliu-analize#/ (accessed on 26 November 2020).
Figure 1. System scope including vehicle and fuel life cycle.
Sustainability 13 00957 g001
Figure 2. System boundaries of the life cycle costing (LCC).
Sustainability 13 00957 g002
Figure 3. ICEVs, HEV, and BEV (electricity mix of 2015) life cycle assessment (LCA) of the impact categories: (a) global warming; (b) ionising radiation; (c) human carcinogenic toxicity; (d) human non-carcinogenic toxicity; (e) land use; (f) fossil resource scarcity.
Sustainability 13 00957 g003
Figure 4. Results (%) of the fuel cycle analysis of ICEVs, HEV, and current and future BEVs in Lithuania.
Sustainability 13 00957 g004
Figure 5. Results of selected passenger cars at the endpoint level.
Sustainability 13 00957 g005
Figure 6. The results of the life cycle costing (LCC) from consumer perspective.
Sustainability 13 00957 g006
Figure 7. The results of the LCC from manufacturer perspective.
Sustainability 13 00957 g007
Figure 8. The results of electricity production costs for (a) 2020 and (b) 2040.
Sustainability 13 00957 g008
Table 1. Technical specification of selected battery electric vehicle (BEV) [47].
ParameterValue
FuelElectricity
Car bodyHatchback
Height1530 mm
Length4490 mm
Width1788 mm
Battery capacity40 kWh
Battery weight296 kg
Vehicle weight without battery1249 kg
Vehicle energy consumption (WLTP)20.6 kWh/100 km
Table 2. Technical specifications of selected internal combustion engine vehicles (ICEVs) and hybrid electric vehicle (HEV) and [48,49].
ParameterValueValueValue
FuelPetrolDieselPetrol/electricity
Engine1.5 TSI ACT (150 Hp), 1498 cm32.0 TDI (115 Hp), 1968 cm31.8 (99 Hp) 1798 cm3
Car bodyHatchbackHatchbackHatchback
Length4284 mm4284 mm4540 mm
Width1789 mm1789 mm1760 mm
Height1456 mm1456 mm1490 mm
Kerb weight1265 kg1305 kg1375 kg
Fuel consumption (combined) (WLTP)6.2–6.5 L/100 km4.1 L/100 km4.2–4.6 L/100 km
Emission standardEURO 6EURO 6EURO 6
Table 3. Amount (%) of electricity generation in the energy system by source (2015–2050) [50].
Unit, %201520202025203020402050
Waste2.286.634.162.501.791.28
Biogas3.514.791.750.570.971.13
Biomass5.8524.1225.1815.564.974.49
Natural gas41.7310.3310.6711.0919.907.28
Hydro20.556.975.284.446.345.72
Wind14.5636.7638.5852.4034.8633.61
Solar1.765.9611.7111.8330.0045.57
Geothermal5.194.452.681.601.170.93
Oil4.570.000.000.000.000.00
Table 4. Total consumer life cycle costs.
Total Consumer Life Cycle Costs
Passenger VehicleManufacturing PhaseOperation PhaseEnd-of-Life PhaseRevenuesTotal Costs, Eur/150,000 kmTotal Cost, Eur/km
Acquisition Price, EurRegistration Tax, EurFuel Price, Eur/150,000 kmMaintenance, Eur/150,000 kmDeregistration Tax, EurCompensation
ICEV-petrol22,32821.6810,95411862.9034,4920.23
ICEV-diesel23,83121.68658110722.9031,5080.21
HEV28,19021.68759020342.9037,8390.25
BEV31,88021.6840178172.9−400032,7390.22
Publisher’s Note: MDPI stays neutral with regard to jurisdictional claims in published maps and institutional affiliations.

