
Determining the Factors That Influence Electric Vehicle Adoption: A Stated Preference Survey Study in Beijing, China


Abstract
:1. Introduction
- How do respondents make purchase decisions among CVs, PHEVs, and BEVs?
- Does experience with e-bike use have any influence (either encouraging or discouraging) on EV purchase decisions?
2. Background and Literature Review
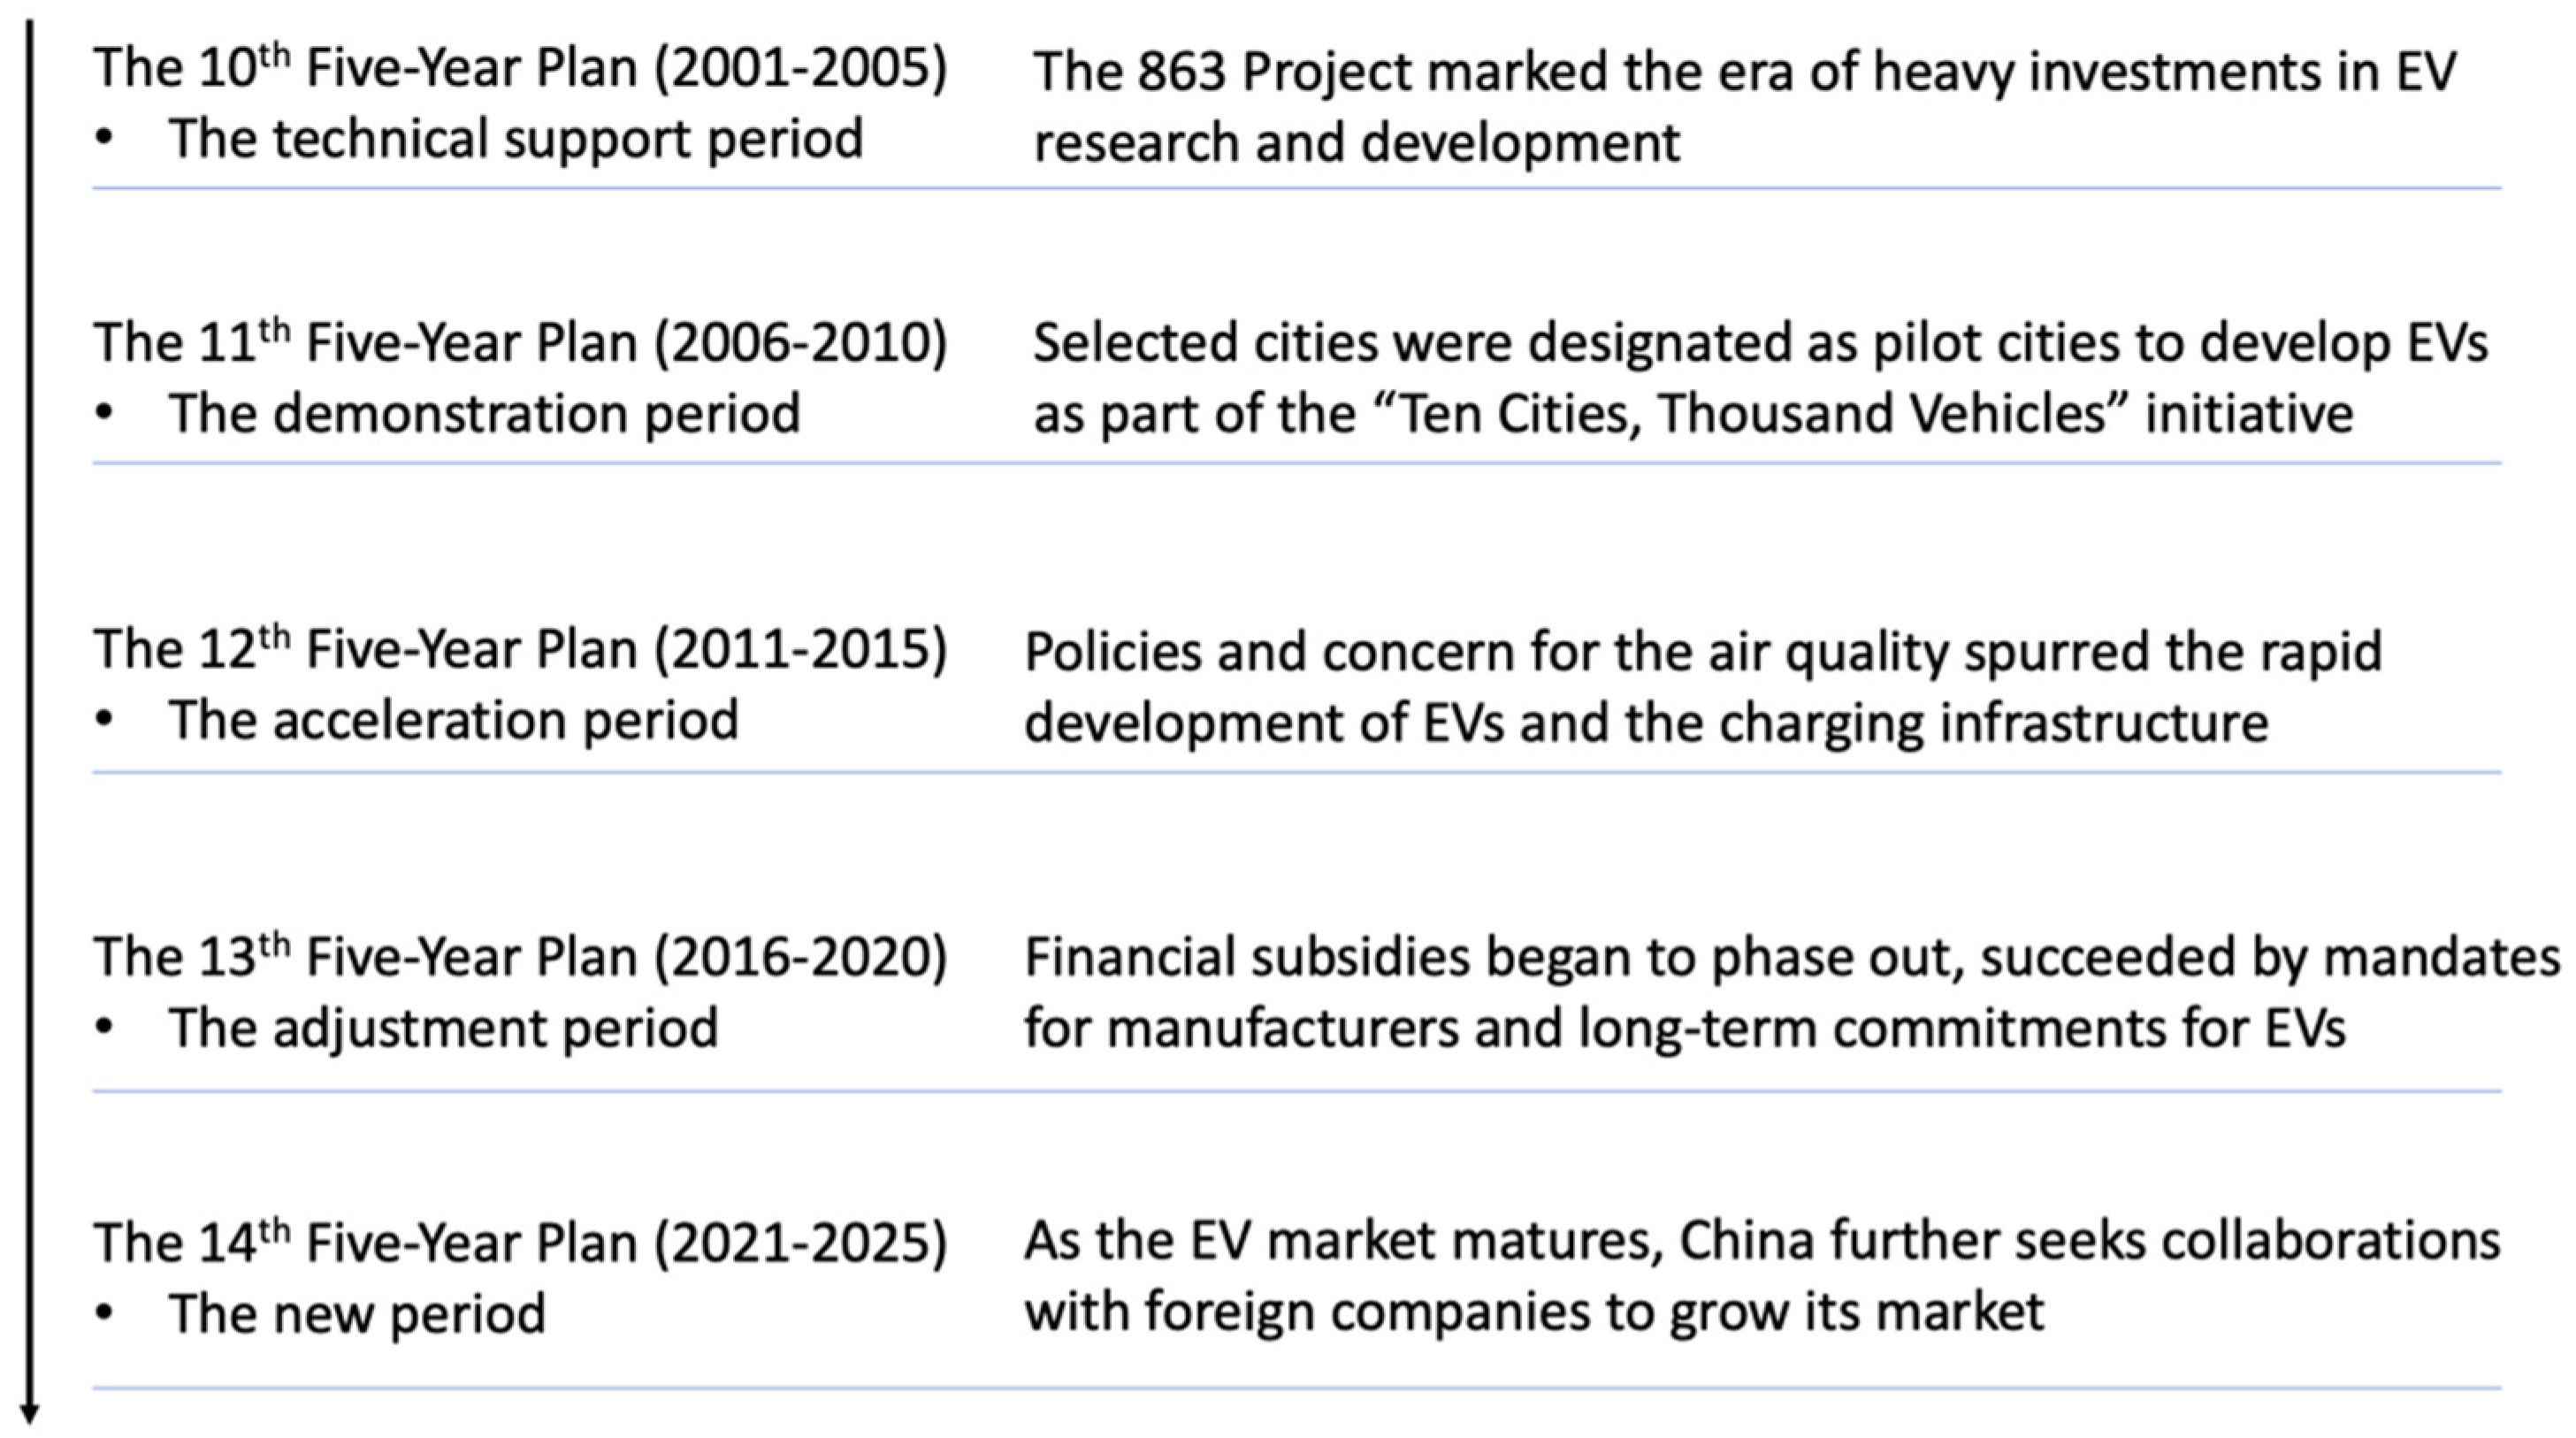
2.1. Government Policy
2.2. Past Work on EV Purchase Behavior
2.3. New Energy Vehicle Attitude and Purchase Intention Studies
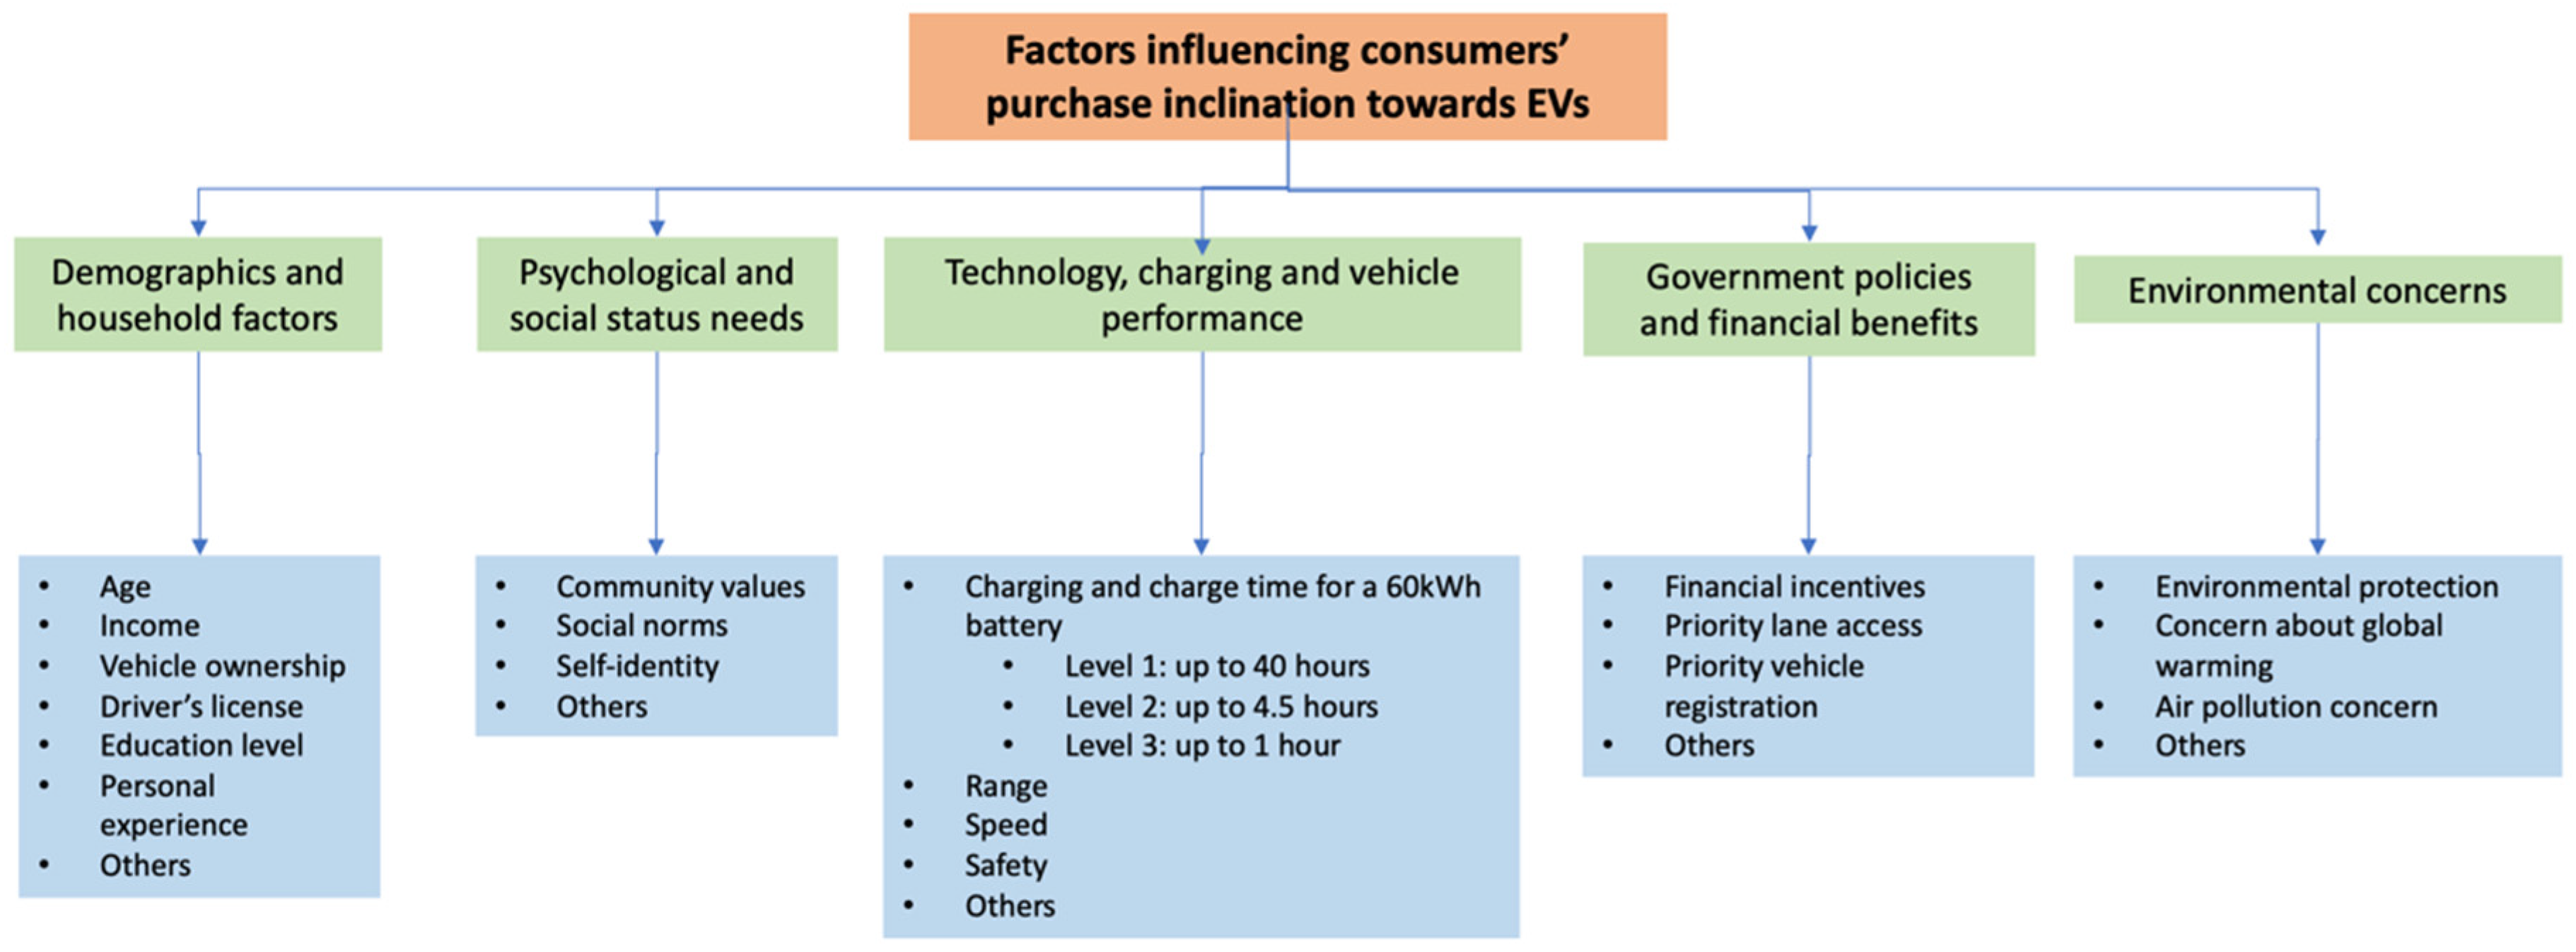
2.4. Factors Influencing New Energy Vehicle Purchase
3. Methods and Data
3.1. Data Collection
3.2. Future Conventional and Electric Vehicle Purchase Model
3.2.1. Car Purchase-Decision Model
3.2.2. Binary Logistic Regression Model
3.2.3. Multilevel Mixed-Effects Logistic Regression Model
3.2.4. Bayesian Multilevel Logistic Regression Model
3.2.5. Car Type Choice Model
4. Results and Analysis
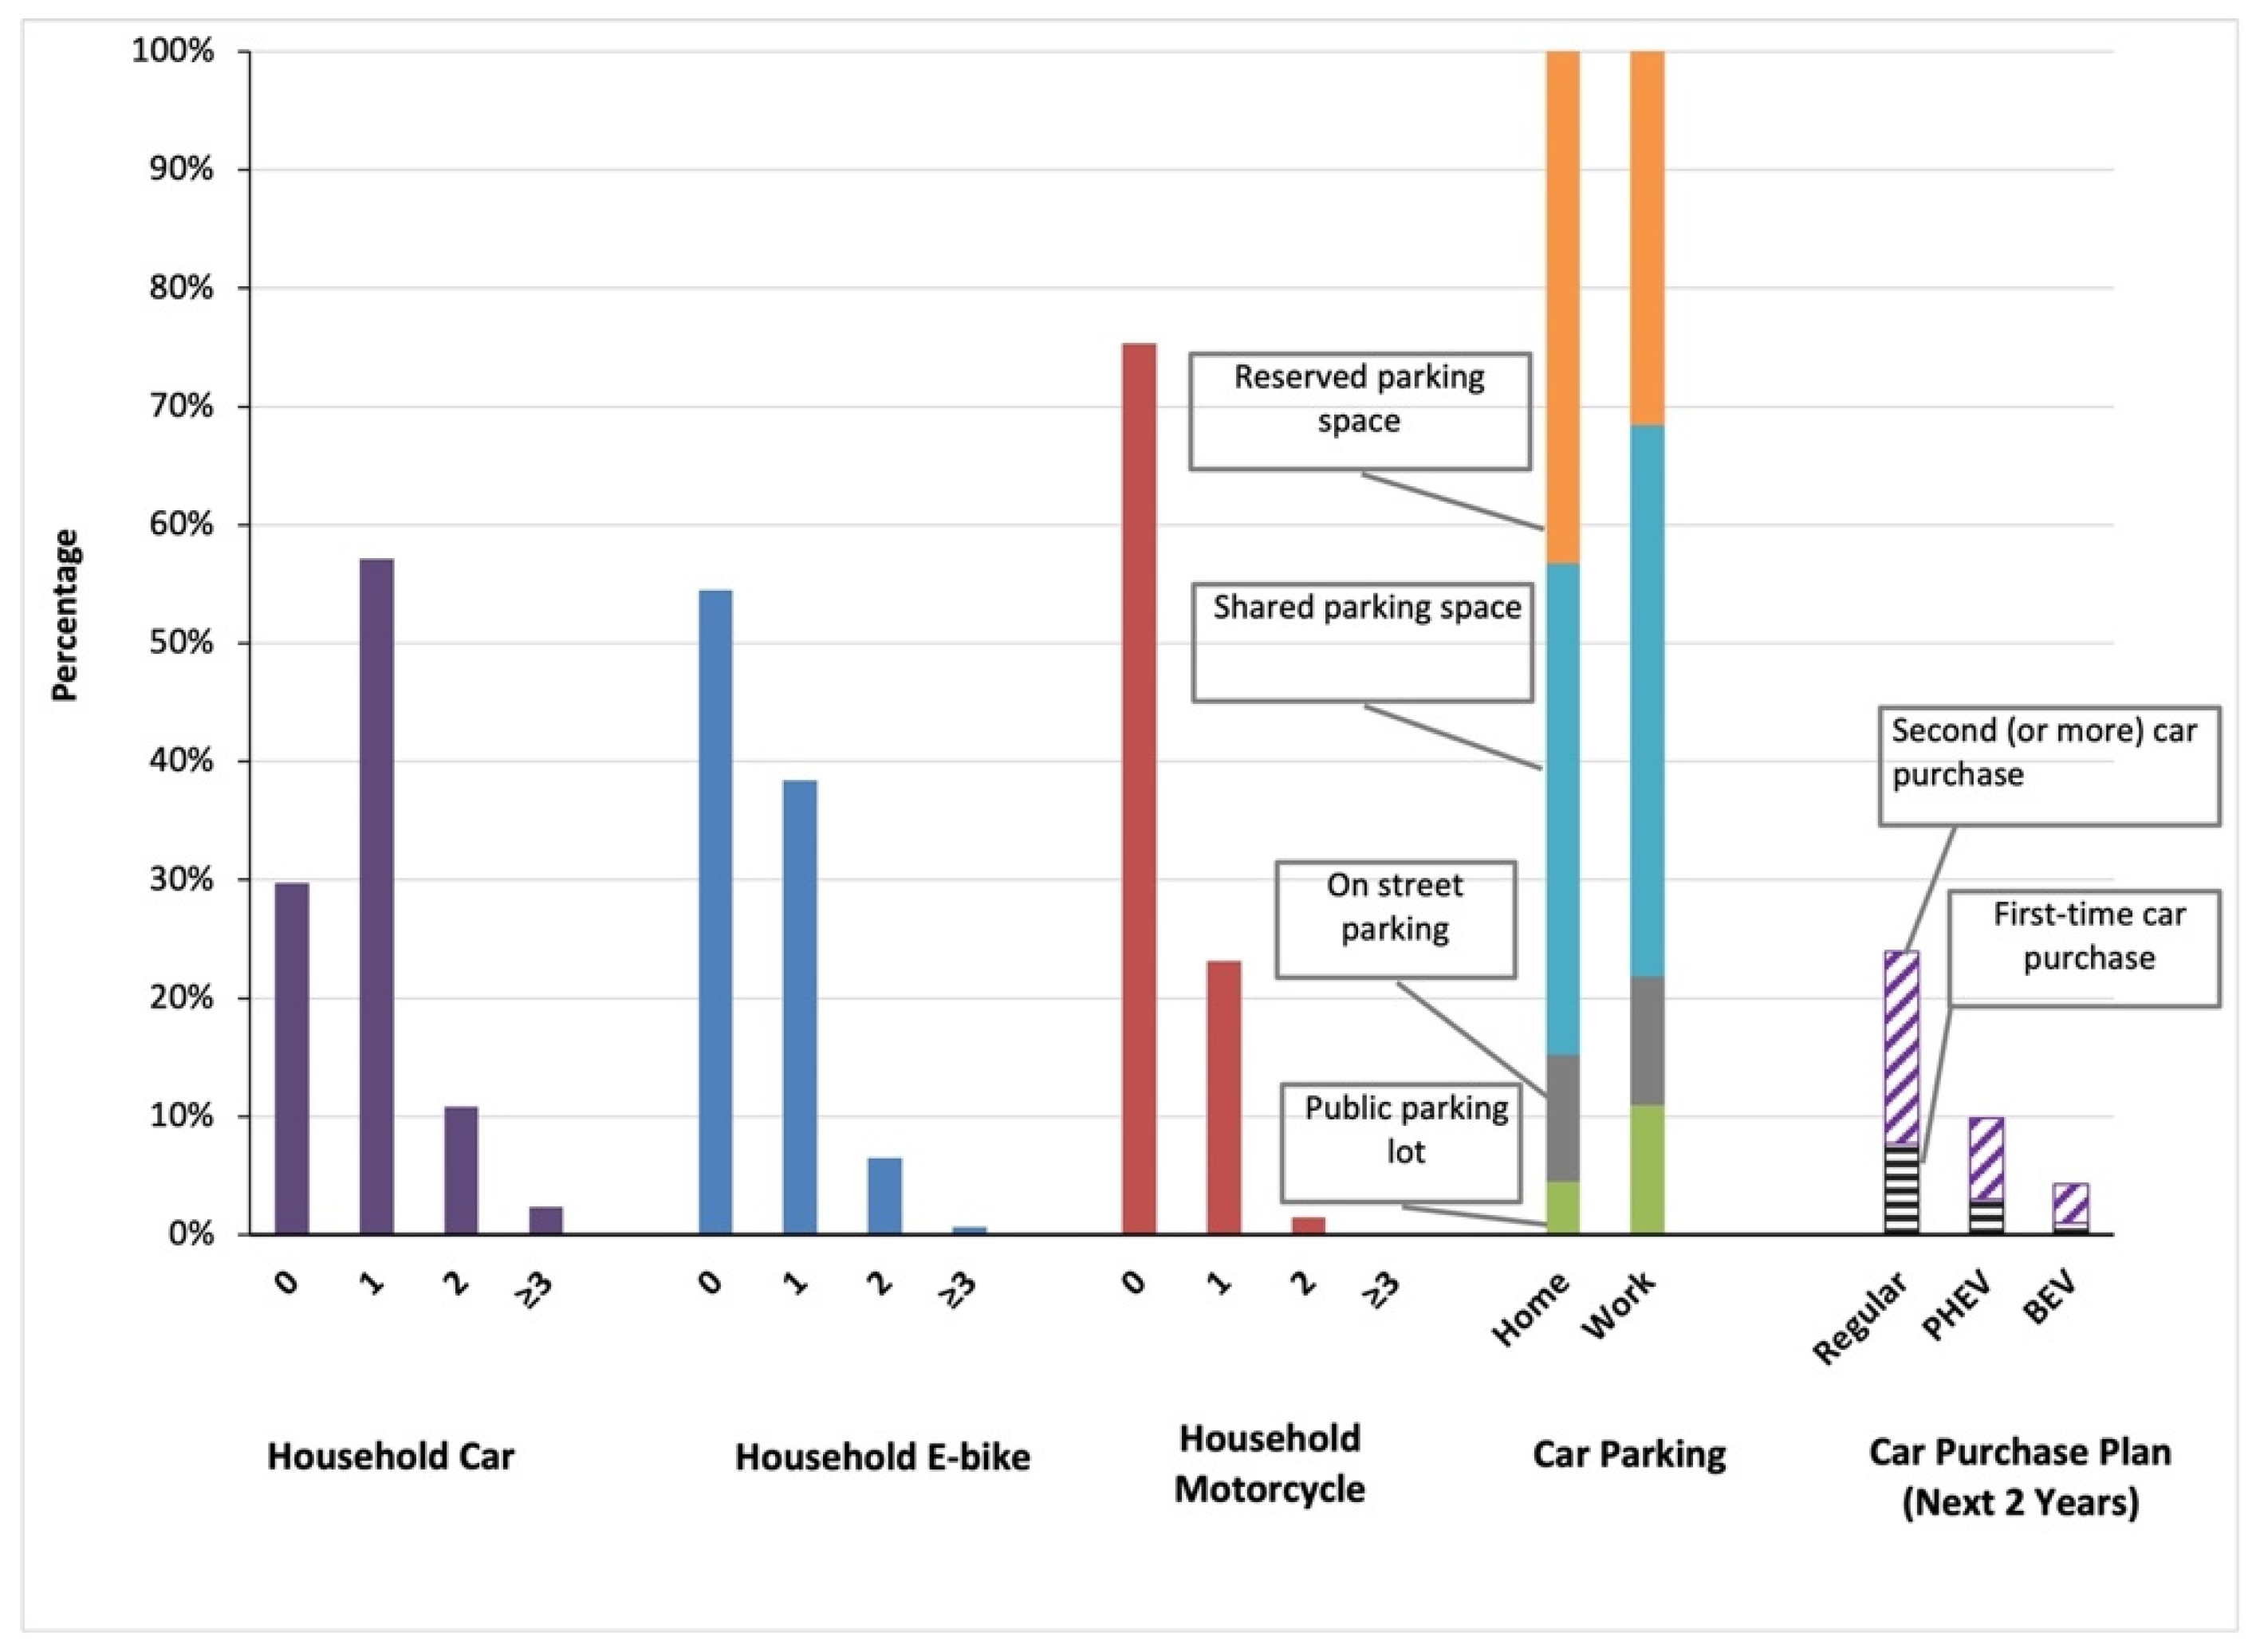
4.1. Respondent Demographics and Perception of EVs
4.2. Model Results
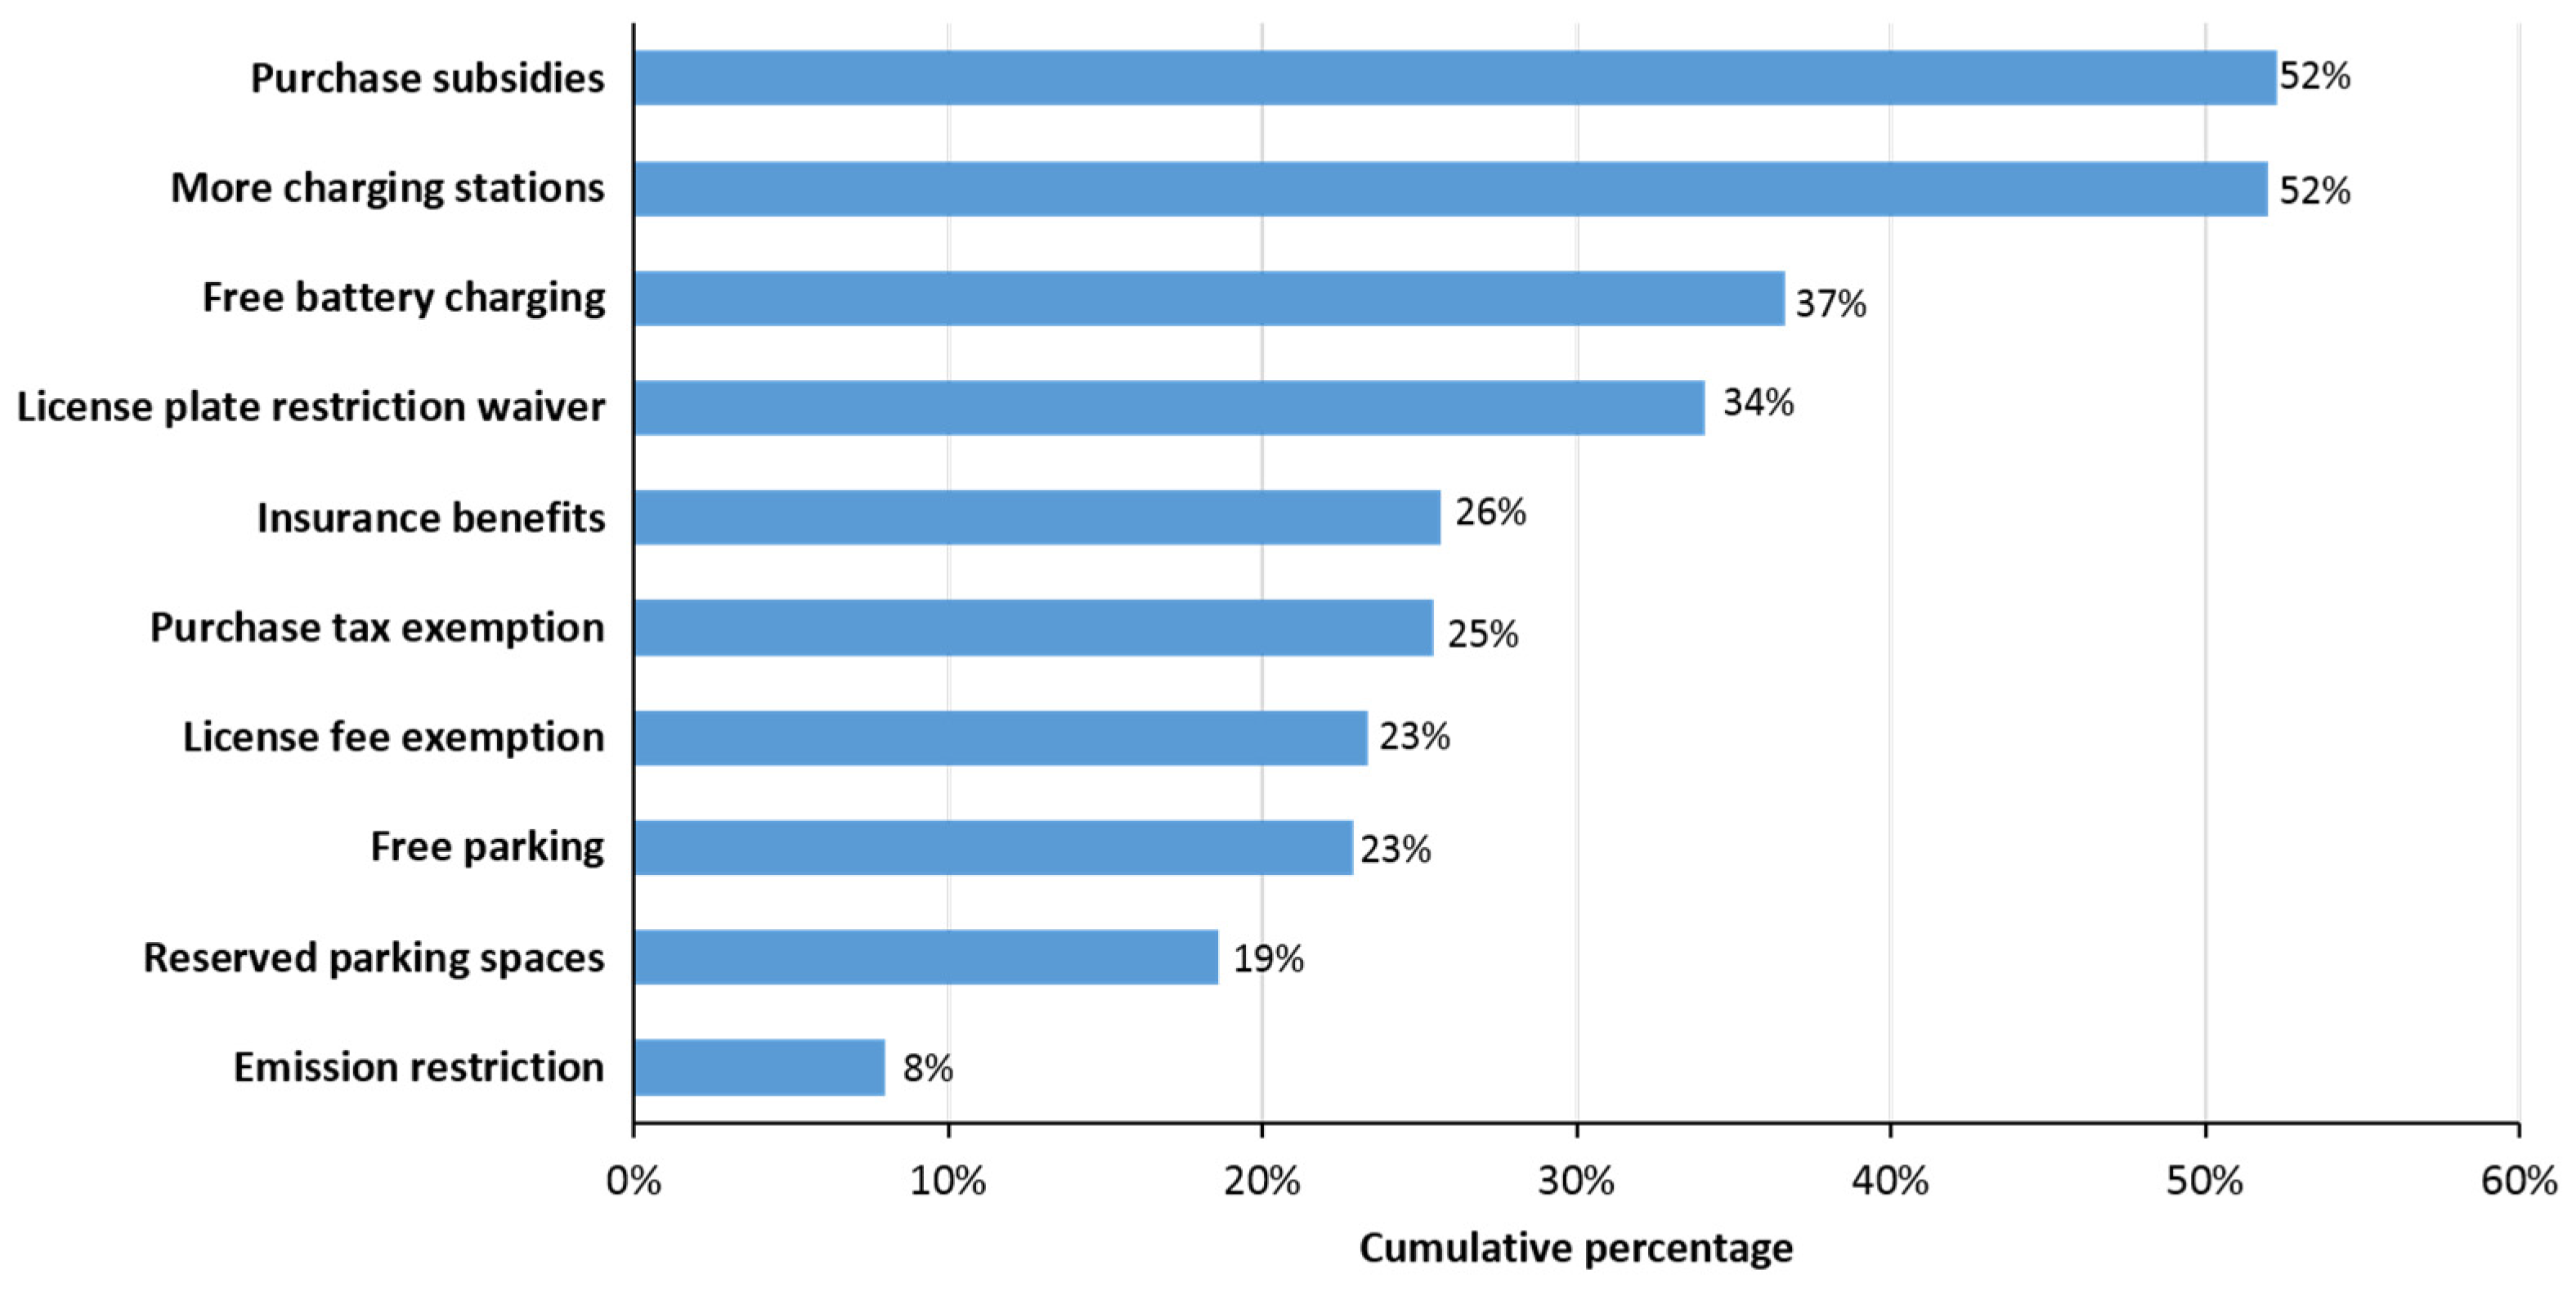
4.3. Policy Implications
4.4. Limitations
5. Conclusions
Author Contributions
Funding
Institutional Review Board Statement
Informed Consent Statement
Data Availability Statement
Conflicts of Interest
References
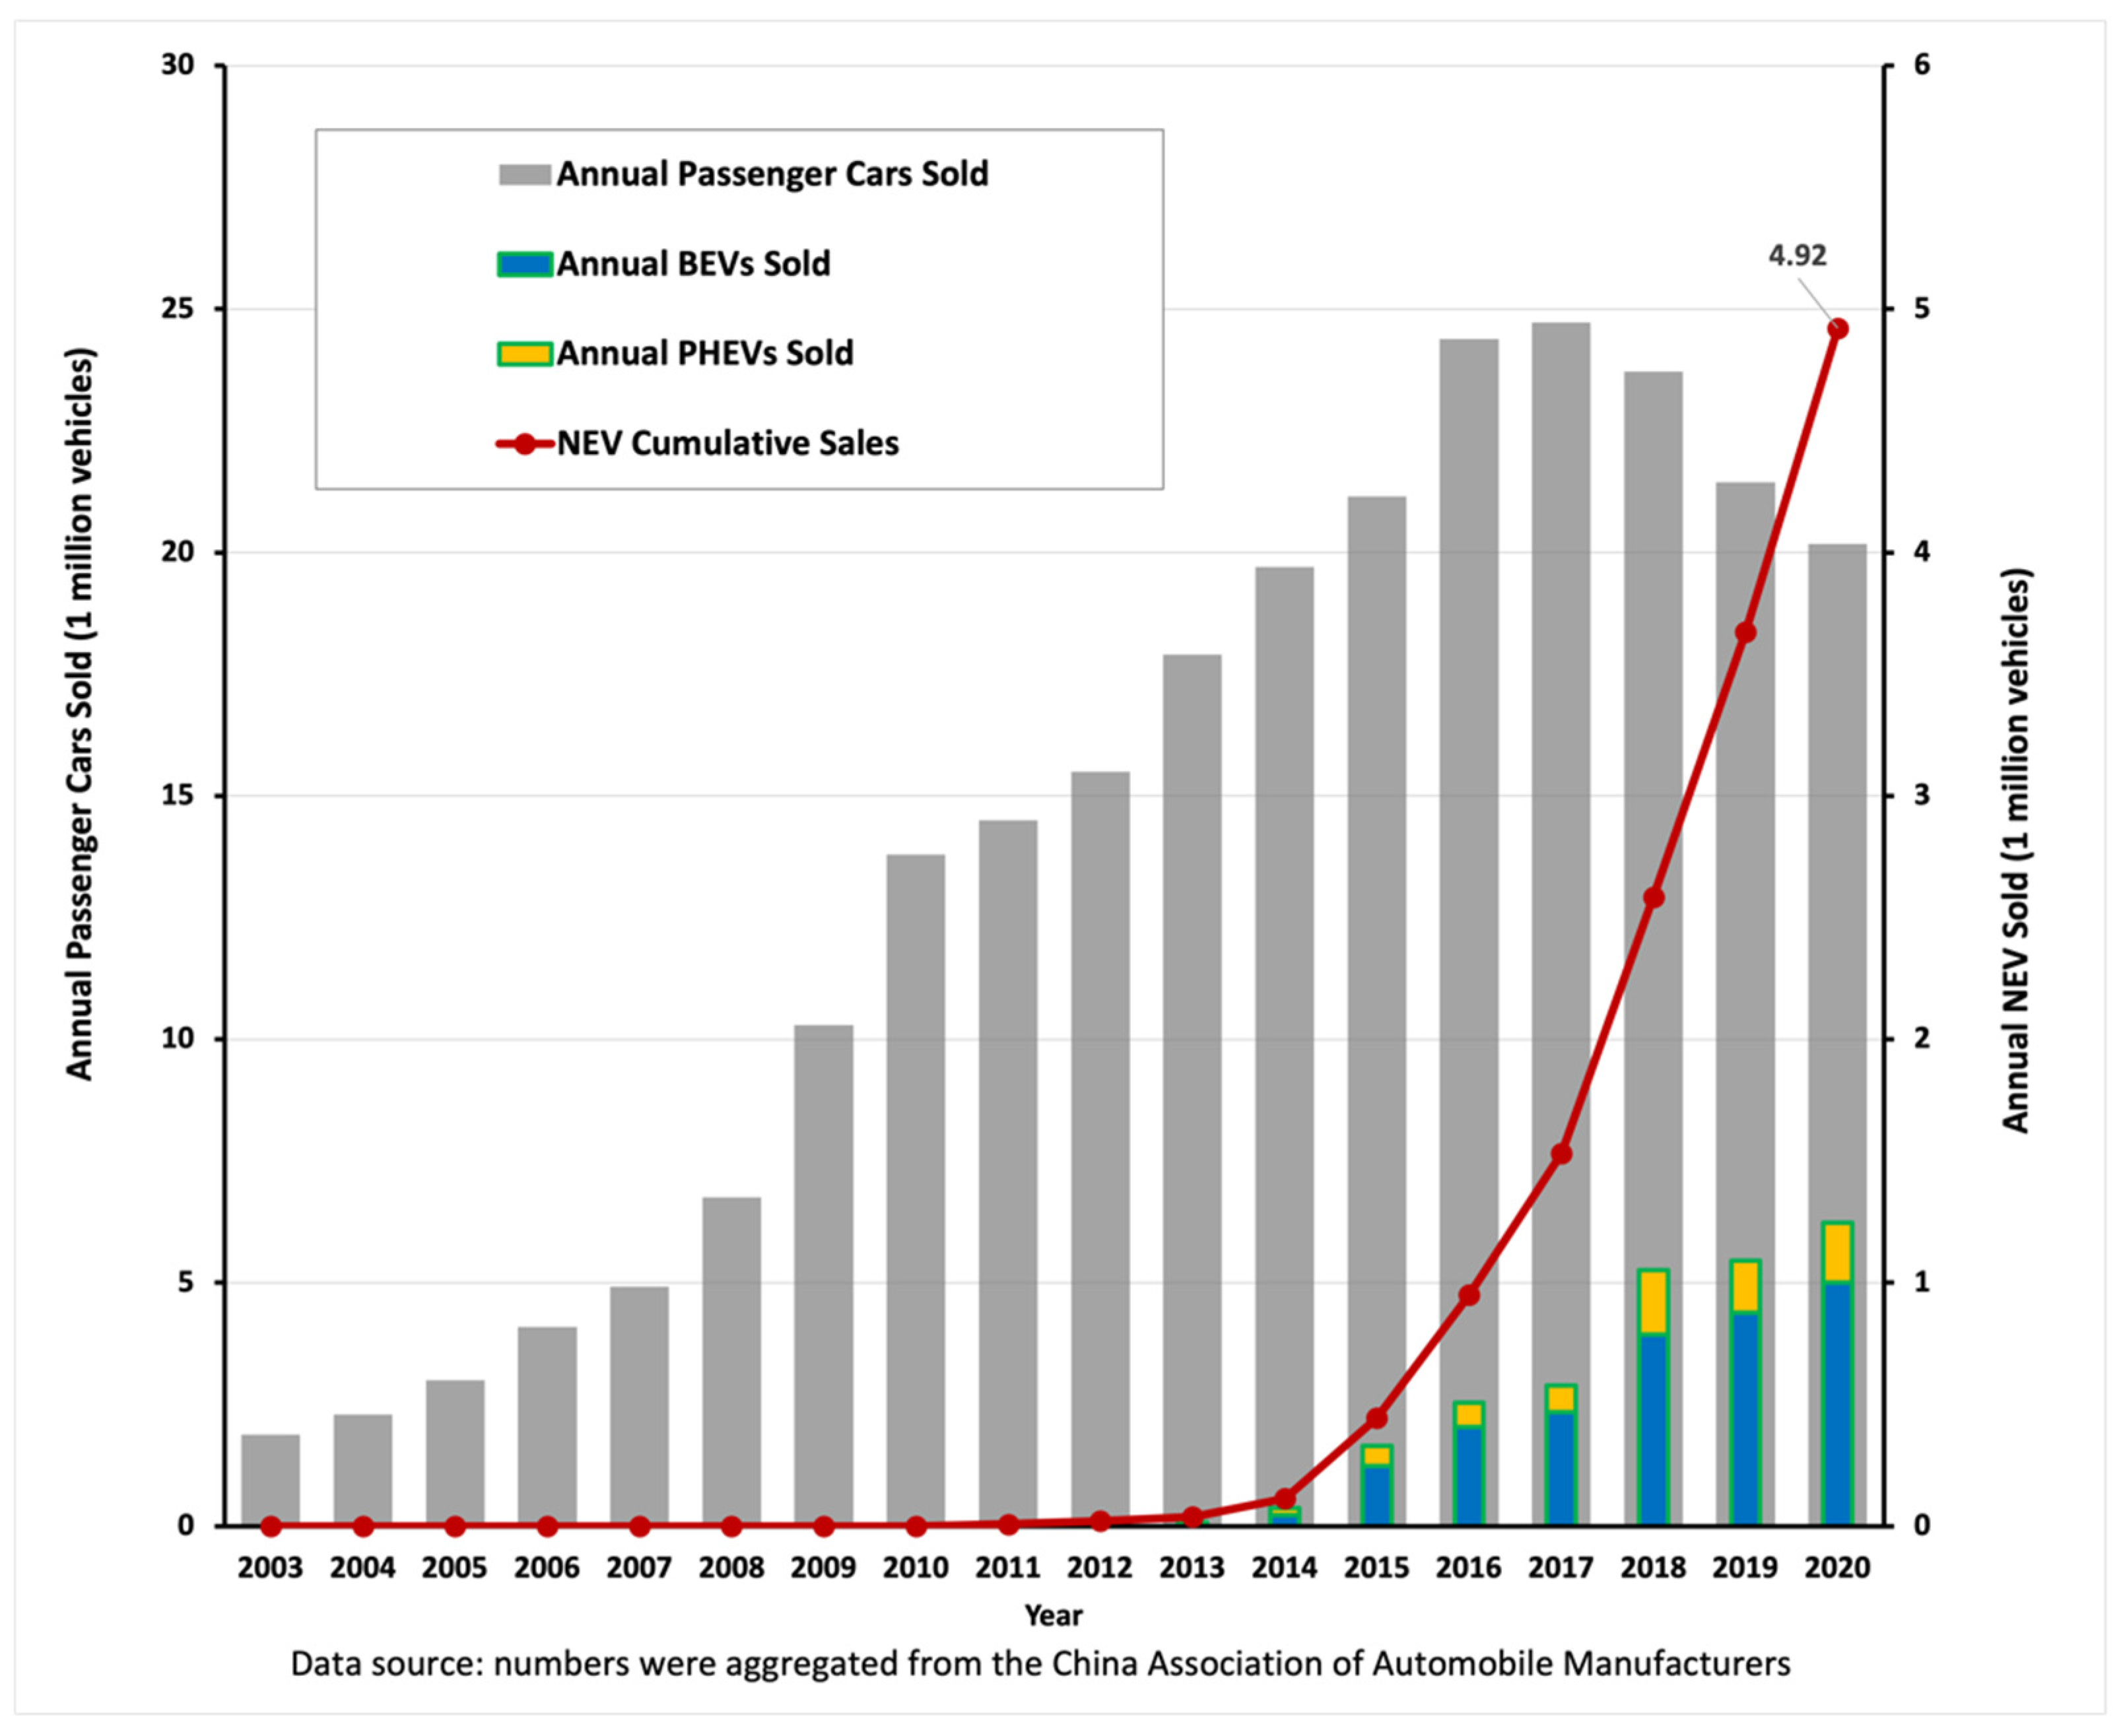
- China Association of Automobile Manufacturers. Passenger Cars Sold Worldwide in 2013. 2014. Available online: http://www.caam.org.cn/zongheshuju/20140717/1305164818.html (accessed on 23 February 2018). (In Chinese).
- China Association of Automobile Manufacturers. Passenger Cars Sold Worldwide in 2014. 2015. Available online: http://www.caam.org.cn/zongheshuju/20150710/1005164774.html (accessed on 23 February 2018). (In Chinese).
- Ling, Z.; Cherry, C.R.; Yang, H.; Jones, L.R. From e-bike to car: A study on factors influencing motorization of e-bike users across China. Transp. Res. Part D Transp. Environ. 2015, 41, 50–63. [Google Scholar] [CrossRef] [Green Version]
- Statista. Car Sales (Passenger and Commercial Vehicles) in China from 2008 to 2017* (in Million Units). 2017. Available online: https://www.statista.com/statistics/233743/vehicle-sales-in-china/ (accessed on 15 October 2021).
- International Organization of Motor Vehicle Manufacturers. 2015–2018 Sale Statistics. 2020. Available online: https://www.oica.net/category/sales-statistics/ (accessed on 15 October 2021).
- China Association of Automobile Manufacturers. The Economics of the Automobile Industry in 2020. 2021. Available online: http://www.caam.org.cn/chn/4/cate_39/con_5232916.html (accessed on 15 October 2021). (In Chinese).
- Huo, H.; Wang, M. Modeling future vehicle sales and stock in China. Energy Policy 2012, 43, 17–29. [Google Scholar] [CrossRef]
- Ou, X.; Yan, X.; Zhang, X. Using coal for transportation in China: Life cycle GHG of coal-based fuel and electric vehicle, and policy implications. Int. J. Greenh. Gas Control 2010, 4, 878–887. [Google Scholar] [CrossRef]
- Marquis, C.; Zhang, H.; Zhou, L. China’s Quest to Adopt Electric Vehicles. In Stanf. Soc. Innov. Rev.; 2013; Volume 11, pp. 52–57. [Google Scholar]
- Climate Action Tracker. China. 2015. Available online: http://climateactiontracker.org/countries/china.html (accessed on 15 October 2021).
- Ou, X.; Zhang, X.; Chang, S. Scenario analysis on alternative fuel/vehicle for China’s future road transport: Life-cycle energy demand and GHG emissions. Energy Policy 2010, 38, 3943–3956. [Google Scholar] [CrossRef]
- Zhang, Y.; Yu, Y.; Zou, B. Analyzing public awareness and acceptance of alternative fuel vehicles in China: The case of EV. Energy Policy 2011, 39, 7015–7024. [Google Scholar] [CrossRef]
- New Energy Vehicle Association. China’s Electric Vehicle Market Analysis of 2013. 2014. Available online: http://www.tyncar.com/News/guonei/20140303_7551.html (accessed on 15 October 2021). (In Chinese).
- Association of Beijing New Energy Automotives. New Energy Vehicle Sales Analysis of 2014. 2015. Available online: http://www.abnea.org.cn/News/article/aid/2/bid/51/art_id/213.html (accessed on 15 October 2021). (In Chinese).
- China Association of Automobile Manufacturers. 2016 New Energy Vehicle Production and Sales Were Over 500,000, an Increase of about 50%. 2017. Available online: https://www.d1ev.com/news/shuju/48462 (accessed on 15 October 2021). (In Chinese).
- Ou, S.; Lin, Z.; Wu, Z.; Zheng, J.; Lyu, R.; Przesmitzki, S.; He, X. A Study of China’s Explosive Growth in the Plug-In Electric Vehicle Market; The National Transportation Research Center: Oak Ridge, TN, USA, 2017.
- China Association of Automobile Manufacturers. Scanning the Statistics over the Market: New Energy Vehicle Production, Sales and Market Analysis. 2019. Available online: http://www.caam.org.cn/chn/3/cate_19/con_5223407.html (accessed on 15 October 2021). (In Chinese).
- Zhang, X.; Rao, R.; Xie, J.; Liang, Y. The current dilemma and future path of China’s electric vehicles. Sustainability 2014, 6, 1567–1593. [Google Scholar] [CrossRef] [Green Version]
- Du, J.; Ouyang, M.; Chen, J. Prospects for Chinese electric vehicle technologies in 2016–2020: Ambition and rationality. Energy 2017, 120, 584–596. [Google Scholar] [CrossRef]
- Zhou, Y.; Wang, M.; Hao, H.; Johnson, L.; Wang, H. Plug-in electric vehicle market penetration and incentives: A global review. Mitig. Adapt. Strateg. Glob. Chang. 2015, 20, 777–795. [Google Scholar] [CrossRef]
- Hao, H.; Ou, X.; Du, J.; Wang, H.; Ouyang, M. China’s electric vehicle subsidy scheme: Rationale and impacts. Energy Policy 2014, 73, 722–732. [Google Scholar] [CrossRef]
- Jin, L.; He, H.; Cui, H.; Lutsev, N.; Wu, C.; Chu, Y.; Zhu, J.; Xiong, Y.; Liu, X. Driving a Green Future: A Retrospective Review of China’s Electric Vehicle Development and Outlook for the Future 2021. Available online: https://trid.trb.org/view/1764439 (accessed on 15 October 2021).
- Gong, H.; Wang, M.Q.; Wang, H. New energy vehicles in China: Policies, demonstration, and progress. Mitig. Adapt. Strateg. Glob. Chang. 2013, 18, 207–228. [Google Scholar] [CrossRef]
- Yue, B.; Sheng, G.; She, S.; Xu, J. Impact of Consumer Environmental Responsibility on Green Consumption Behavior in China: The Role of Environmental Concern and Price Sensitivity. Sustainability 2020, 12, 2074. [Google Scholar] [CrossRef] [Green Version]
- Nie, Y.; Wang, E.; Guo, Q.; Shen, J. Examining Shanghai Consumer Preferences for Electric Vehicles and Their Attributes. Sustainability 2018, 10, 2036. [Google Scholar] [CrossRef] [Green Version]
- Xu, Y.; Zhang, W.; Bao, H.; Zhang, S.; Xiang, Y. A SEM–Neural Network Approach to Predict Customers’ Intention to Purchase Battery Electric Vehicles in China’s Zhejiang Province. Sustainability 2019, 11, 3164. [Google Scholar] [CrossRef] [Green Version]
- Zhang, G.; Xu, Y.; Zhang, J. Consumer-Oriented Policy towards Diffusion of Electric Vehicles: City-Level Evidence from China. Sustainability 2016, 8, 1343. [Google Scholar] [CrossRef] [Green Version]
- Mohiuddin, M.; Al Mamun, A.; Syed, F.A.; Mehedi Masud, M.; Su, Z. Environmental knowledge, awareness, and business school students’ intentions to purchase green vehicles in emerging countries. Sustainability 2018, 10, 1534. [Google Scholar] [CrossRef] [Green Version]
- Rezvani, Z.; Jansson, J.; Bodin, J. Advances in consumer electric vehicle adoption research: A review and research agenda. Transp. Res. Part D Transp. Environ. 2015, 34, 122–136. [Google Scholar] [CrossRef] [Green Version]
- Adnan, N.; Nordin, S.M.; Rahman, I.; Vasant, P.M.; Noor, A. A comprehensive review on theoretical framework-based electric vehicle consumer adoption research. Int. J. Energy Res. 2017, 41, 317–335. [Google Scholar] [CrossRef]
- Zhang, X.; Wang, K.; Hao, Y.; Fan, J.L.; Wei, Y.M. The impact of government policy on preference for NEVs: The evidence from China. Energy Policy 2013, 61, 382–393. [Google Scholar] [CrossRef]
- Li, W.; Long, R.; Chen, H. Consumers’ evaluation of national new energy vehicle policy in China: An analysis based on a four paradigm model. Energy Policy 2016, 99, 33–41. [Google Scholar] [CrossRef]
- Wang, S.; Fan, J.; Zhao, D.; Yang, S.; Fu, Y. Predicting consumers’ intention to adopt hybrid electric vehicles: Using an extended version of the theory of planned behavior model. Transportation 2016, 43, 123–143. [Google Scholar] [CrossRef]
- Li, W.; Long, R.; Chen, H.; Geng, J. Household factors and adopting intention of battery electric vehicles: A multi-group structural equation model analysis among consumers in Jiangsu Province, China. Nat. Hazards 2017, 87, 945–960. [Google Scholar] [CrossRef]
- He, X.; Zhan, W.; Hu, Y. Consumer purchase intention of electric vehicles in China: The roles of perception and personality. J. Clean. Prod. 2018, 204, 1060–1069. [Google Scholar] [CrossRef]
- Huang, Y.; Qian, L. Consumer preferences for electric vehicles in lower tier cities of China: Evidences from south Jiangsu region. Transp. Res. Part D Transp. Environ. 2018, 63, 482–497. [Google Scholar] [CrossRef]
- Yu, J.; Yang, P.; Zhang, K.; Wang, F.; Miao, L. Evaluating the Effect of Policies and the Development of Charging Infrastructure on Electric Vehicle Diffusion in China. Sustainability 2018, 10, 3394. [Google Scholar] [CrossRef] [Green Version]
- Lin, B.; Wu, W. Why people want to buy electric vehicle: An empirical study in first-tier cities of China. Energy Policy 2018, 112, 233–241. [Google Scholar] [CrossRef]
- Habich-Sobiegalla, S.; Kostka, G.; Anzinger, N. Citizens’ electric vehicle purchase intentions in China: An analysis of micro-level and macro-level factors. Transp. Policy 2019, 79, 223–233. [Google Scholar] [CrossRef]
- Sovacool, B.K.; Abrahamse, W.; Zhang, L.; Ren, J. Pleasure or profit? Surveying the purchasing intentions of potential electric vehicle adopters in China. Transp. Res. Part A Policy Pract. 2019, 124, 69–81. [Google Scholar] [CrossRef]
- Yang, C.; Tu, J.-C.; Jiang, Q. The Influential Factors of Consumers’ Sustainable Consumption: A Case on Electric Vehicles in China. Sustainability 2020, 12, 3496. [Google Scholar] [CrossRef] [Green Version]
- Brownstone, D.; Bunch, D.S.; Train, K. Joint mixed logit models of stated and revealed preferences for alternative-fuel vehicles. Transp. Res. Part B Methodol. 2000, 34, 315–338. [Google Scholar] [CrossRef] [Green Version]
- Hidrue, M.K.; Parsons, G.R.; Kempton, W.; Gardner, M.P. Willingness to pay for electric vehicles and their attributes. Resour. Energy Econ. 2011, 33, 686–705. [Google Scholar] [CrossRef] [Green Version]
- Jansson, J. Consumer eco-innovation adoption: Assessing attitudinal factors and perceived product characteristics. Bus. Strategy Environ. 2011, 20, 192–210. [Google Scholar] [CrossRef]
- Lieven, T.; Mühlmeier, S.; Henkel, S.; Waller, J.F. Who will buy electric cars? An empirical study in Germany. Transp. Res. Part D Transp. Environ. 2011, 16, 236–243. [Google Scholar] [CrossRef]
- Delang, C.O.; Cheng, W.-T. Consumers’ attitudes towards electric cars: A case study of Hong Kong. Transp. Res. Part D Transp. Environ. 2012, 17, 492–494. [Google Scholar] [CrossRef]
- Bessenbach, N.; Wallrapp, S. Why Do Consumers Resist Buying Electric Vehicles. An Empirical Study of Innovation Perception and the Effect of Consumer Characteristics, Innovation Exposure and Buying Incentives; Copenhagen Business School: Frederiksberg, Denmark, 2013. [Google Scholar]
- Jones, L.R.; Cherry, C.R.; Vu, T.A.; Nguyen, Q.N. The effect of incentives and technology on the adoption of electric motorcycles: A stated choice experiment in Vietnam. Transp. Res. Part A Policy Pract. 2013, 57, 1–11. [Google Scholar] [CrossRef]
- Moloughney, T. What Are the Different Levels of Electric Vehicle Charging? 2021. Available online: https://www.forbes.com/wheels/advice/ev-charging-levels/ (accessed on 15 October 2021).
- Schuitema, G.; Anable, J.; Skippon, S.; Kinnear, N. The role of instrumental, hedonic and symbolic attributes in the intention to adopt electric vehicles. Transp. Res. Part A Policy Pract. 2013, 48, 39–49. [Google Scholar] [CrossRef]
- Ozaki, R.; Sevastyanova, K. Going hybrid: An analysis of consumer purchase motivations. Energy Policy 2011, 39, 2217–2227. [Google Scholar] [CrossRef]
- Javid, R.J.; Salari, M.; Javid, R.J. Environmental and economic impacts of expanding electric vehicle public charging infrastructure in California′ s counties. Transp. Res. Part D Transp. Environ. 2019, 77, 320–334. [Google Scholar] [CrossRef]
- Feng, J.; Xu, S.X.; Li, M. A novel multi-criteria decision-making method for selecting the site of an electric-vehicle charging station from a sustainable perspective. Sustain. Cities Soc. 2021, 65, 102623. [Google Scholar] [CrossRef]
- Huang, Y.; Kockelman, K.M. Electric vehicle charging station locations: Elastic demand, station congestion, and network equilibrium. Transp. Res. Part D Transp. Environ. 2020, 78, 102179. [Google Scholar] [CrossRef]
- Jin, C.; Tang, J.; Ghosh, P. Optimizing electric vehicle charging: A customer’s perspective. IEEE Trans. Veh. Technol. 2013, 62, 2919–2927. [Google Scholar] [CrossRef]
- Morrissey, P.; Weldon, P.; O’Mahony, M. Future standard and fast charging infrastructure planning: An analysis of electric vehicle charging behaviour. Energy Policy 2016, 89, 257–270. [Google Scholar] [CrossRef]
- Kaya, Ö.; Alemdar, K.D.; Campisi, T.; Tortum, A.; Çodur, M.K. The Development of Decarbonisation Strategies: A Three-Step Methodology for the Suitable Analysis of Current EVCS Locations Applied to Istanbul, Turkey. Energies 2021, 14, 2756. [Google Scholar] [CrossRef]
- Erdem, C.; Şentürk, İ.; Şimşek, T. Identifying the factors affecting the willingness to pay for fuel-efficient vehicles in Turkey: A case of hybrids. Energy Policy 2010, 38, 3038–3043. [Google Scholar] [CrossRef]
- Lane, B.; Potter, S. The adoption of cleaner vehicles in the UK: Exploring the consumer attitude–action gap. J. Clean. Prod. 2007, 15, 1085–1092. [Google Scholar] [CrossRef]
- Potoglou, D.; Kanaroglou, P.S. Household demand and willingness to pay for clean vehicles. Transp. Res. Part D Transp. Environ. 2007, 12, 264–274. [Google Scholar] [CrossRef]
- Scherpenzeel, A. Why use 11-point scales. Swiss Househ. Panel 2002, 9, 2008. [Google Scholar]
- Cronbach, L.J. Coefficient alpha and the internal structure of tests. Psychometrika 1951, 16, 297–334. [Google Scholar] [CrossRef] [Green Version]
- Hair, J.F. Multivariate Data Analysis; Pearson: New York, NY, USA, 2009. [Google Scholar]
- Hinton, P.; McMurray, I.; Brownlow, C. SPSS Explained; Routledge: England, UK, 2014. [Google Scholar]
- Wang, N.; Tang, L.; Pan, H. Effectiveness of policy incentives on electric vehicle acceptance in China: A discrete choice analysis. Transp. Res. Part A Policy Pract. 2017, 105, 210–218. [Google Scholar] [CrossRef]
- Daziano, R.A. Conditional-logit Bayes estimators for consumer valuation of electric vehicle driving range. Resour. Energy Econ. 2013, 35, 429–450. [Google Scholar] [CrossRef]
- Washington, S.; Karlaftis, M.; Mannering, F.; Anastasopoulos, P. Statistical and Econometric Methods for Transportation Data Analysis; Chapman and Hall/CRC: Boca Raton, FL, USA, 2020. [Google Scholar]
- Gelman, A. Multilevel (hierarchical) modeling: What it can and cannot do. Technometrics 2006, 48, 432–435. [Google Scholar] [CrossRef] [Green Version]
- Nemes, S.; Jonasson, J.M.; Genell, A.; Steineck, G. Bias in odds ratios by logistic regression modelling and sample size. BMC Med. Res. Methodol. 2009, 9, 56. [Google Scholar] [CrossRef] [PubMed] [Green Version]
- Rodriguez, G.; Goldman, N. An Assessment of Estimation Procedures for Multilevel Models with Binary Responses. J. R. Stat. Soc. Ser. A 1995, 158, 73–89. [Google Scholar] [CrossRef]
- Goldstein, H.; Jon, R. Improved Approximations for Multilevel Models with Binary Responses. J. R. Stat. Soc. Ser. A 1996, 159, 505–513. [Google Scholar] [CrossRef] [Green Version]
- StataCorp, L. Stata Multilevel Mixed-Effects Reference Manual; StataCorp LP: College Station, TX, USA, 2013. [Google Scholar]
- Gelman, A.; Carlin, J.B.; Stern, H.S.; Rubin, D.B. Bayesian Data Analysis; CRC Press: Boca Raton, FL, USA, 2014; Volume 2. [Google Scholar]
- Noell, L.; de Rubens, G.Z.; Kester, J.; Lin, X.; Sovacool, B. The Status and Challenges of Electric Vehicles in Sweden-2016. 2016. Available online: https://btech.au.dk//fileadmin/user_upload/Initial_Observations_about_EVs_on_Sweden_-_Aarhus_University.pdf (accessed on 15 October 2021).
- Al-Alawi, B.M.; Bradley, T.H. Review of hybrid, plug-in hybrid, and electric vehicle market modeling Studies. Renew. Sustain. Energy Rev. 2013, 21 (Suppl. C), 190–203. [Google Scholar] [CrossRef]
- Ou, S.; Hao, X.; Lin, Z.; Wang, H.; Bouchard, J.; He, X.; Przesmitzki, S.; Wu, Z.; Zheng, J.; Lv, R.; et al. Light-duty plug-in electric vehicles in China: An overview on the market and its comparisons to the United States. Renew. Sustain. Energy Rev. 2019, 112, 747–761. [Google Scholar] [CrossRef]
- Ling, Z.; Cherry, C.R.; Yang, H. Emerging mini electric cars in China: User experience and policy implications. Transp. Res. Part D Transp. Environ. 2019, 69, 293–304. [Google Scholar] [CrossRef]
- Wen, W.; Yang, S.; Zhou, P.; Gao, S.Z. Impacts of COVID-19 on the electric vehicle industry: Evidence from China. Renew. Sustain. Energy Rev. 2021, 144, 111024. [Google Scholar] [CrossRef]


| Authors | EV | Sample; Data Source; Methodology | The Aim of the Paper | Factors 1 | ||||
|---|---|---|---|---|---|---|---|---|
| D | P | T | G | E | ||||
| Zhang, Yu [12] | EV 2 | 299 trainees in driving school; SP survey with questionnaires; binary logit model | To examine the factors that affect EV purchase time, and purchase price | √ | √ | √ | ||
| Zhang, Wang [31] | NEV 3 | 349 potential consumers from auto dealers; SP survey; regression model | To identify purchase motivation and examine the impact of government policies | √ | √ | √ | √ | √ |
| Li, Long [32] | NEV 3 | 727 consumers from auto dealers; SP survey; four-paradigm model | To analyze consumers’ evaluation of government policies | √ | ||||
| Wang, Fan [33] | HEV 4 | 433 consumers from auto dealers; SP survey; TPB, structure-equation model | To investigate consumers’ intention to adopt HEVs | √ | √ | √ | ||
| Li, Long [34] | BEV | 940 consumers from auto dealers; SP survey; TPB, structure-equation model | To investigate household factors in BEV adoption | √ | √ | |||
| He, Zhan [35] | EV 2 | 369 responses; a web-based SP survey; TPB, structure-equation model | To explore the roles of perception and personality factors in EV adoption | √ | √ | √ | √ | √ |
| Huang and Qian [36] | BEV, PHEV | 348 responses; SP survey; nested logit model | To investigate the influencing factors in EV adoption in developing cities | √ | √ | √ | √ | |
| Yu, Yang [37] | EV 2 | 157 samples; SP survey; system dynamics model | To understand the influence of government policies on EV adoption | √ | ||||
| Lin and Wu [38] | EV 2 | 988 samples; SP survey; ordered logit regression | To study the factors that influence public’s EV purchase intention in Chinese largest cities | √ | √ | √ | √ | √ |
| Habich-Sobiegalla, Kostka [39] | EV 2 | 1080 respondents; A web-based SP survey; Ordered logit regression | To examine the factors of Chinese citizens’ intentions to adopt EVs | √ | √ | √ | ||
| Sovacool, Abrahamse [40] | EV 2 | 805 samples; a web-based SP survey; regression and principal component analysis | To examine the factors related to potential EV adoption | √ | √ | √ | √ | |
| Yang, Tu [41] | EV 2 | 417 samples; a web-based SP survey; TPB, structure equation model | To analyze influencing factors in EV adoption | √ | ||||
| Sample | Beijing City Data | ||
|---|---|---|---|
| Category | Percentage/Number | Category | Percentage |
| Gender | |||
| Male | 58.6% | male | 51.4% |
| Female | 41.4% | female | 48.6% |
| Age | |||
| <18 | 4.9% | 0–14 | 9.9% |
| 18–50 | 88.8% | 15–59 | 75.2% |
| ≥51 | 6.3% | ≥60 | 14.9% |
| Annual income per person (1000 Yuan) | |||
| 40.58 | 43.91 | ||
| No. of cars per person | |||
| 0.21 | 0.26 | ||
| Education | |||
| Middle school or below | 3.8% | - | |
| High school or technical school | 25.2% | ||
| Bachelor | 58.0% | ||
| Master’s or above | 13.0% | ||
| Adults | 3.5 (1.1) | ||
| Children | 0.6 (0.8) | ||
| Number of licensed drivers | 1.7 (1.0) | ||
| No. | Category | Question/Level of Agreement on Statement | Mean | ANOVA Test | ||||
|---|---|---|---|---|---|---|---|---|
| EV | CV | No | EV vs. CV | EV vs. No | Within Group | |||
| Q1 | Experience with EVs | Have you ever driven or ridden in an EV? (Yes = 1, No = 0) | 0.45 | 0.38 | 0.34 | 0.128 | 0.007 *** | 0.024 ** |
| Q2 | Do you have friends/family or neighbors that own an EV? (Yes = 1, No = 0) | 0.53 | 0.41 | 0.38 | 0.010 ** | 0.000 *** | 0.002 *** | |
| Q3 | General rating | a What is your impression towards e-bikes in general? | 1.87 | 1.81 | 2.00 | 0.795 | 0.532 | 0.492 |
| Q4 | a What is your impression towards e-vehicles in general? | 2.36 | 1.91 | 2.20 | 0.036 ** | 0.374 | 0.064 * | |
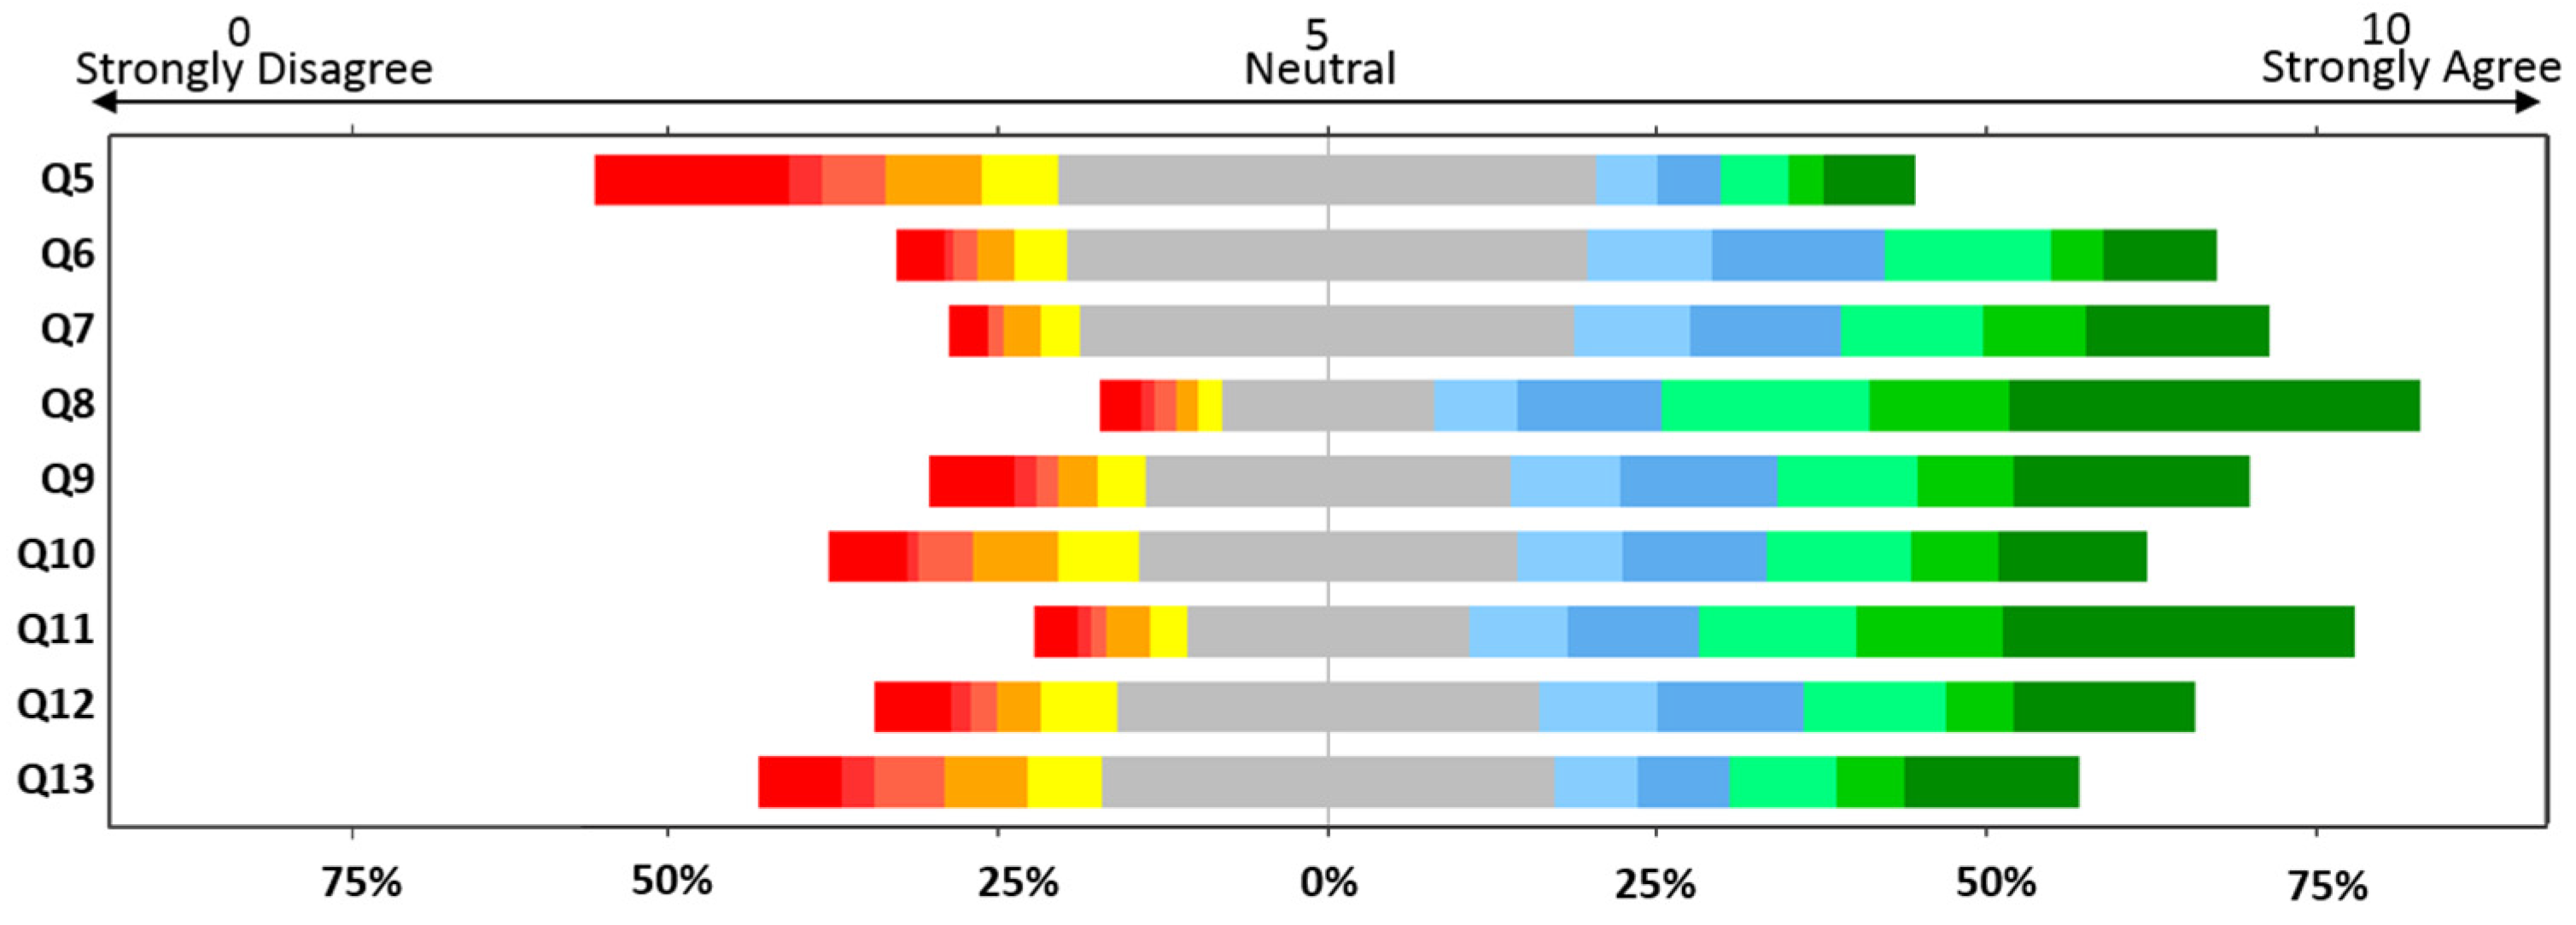
| Q5 | Social norm | b,c Driving an e-bike improves my status or self-image. | 4.45 | 4.65 | 4.55 | 0.468 | 0.658 | 0.749 |
| Q6 | b,c Driving a CV improves my status or self-image. | 5.60 | 6.06 | 6.02 | 0.032 ** | 0.023 ** | 0.056 * | |
| Q7 | b,c Driving an EV improves my status or self-image. | 6.81 | 6.27 | 6.33 | 0.013 ** | 0.012 ** | 0.026 ** | |
| Q8 | Purchase consideration | b,c I would consider vehicle emissions when I plan to purchase a car. | 7.52 | 7.31 | 7.48 | 0.439 | 0.859 | 0.589 |
| Q9 | b,c I have a positive attitude towards EVs because of e-bikes. | 6.51 | 6.21 | 6.27 | 0.269 | 0.304 | 0.494 | |
| Q10 | b,c Compared to a CV, an EV is similar in performance. | 6.23 | 5.80 | 5.72 | 0.102 | 0.019 ** | 0.069 * | |
| Q11 | b,c Compared to a CV, an EV is cheaper over the long term. | 7.36 | 7.15 | 6.98 | 0.433 | 0.088 * | 0.198 | |
| Q12 | b,c I (might) have more mechanical problems with an EV than a CV. | 6.25 | 6.20 | 5.87 | 0.842 | 0.070 * | 0.073 * | |
| Q13 | b,c I would prefer to drive a CV to an EV. | 5.06 | 6.10 | 5.45 | 0.000 *** | 0.094 * | 0.000 *** | |
| Logistic Regression Model | Binary | Multilevel Mixed Effect | Multilevel Bayesian | |||
|---|---|---|---|---|---|---|
| Factors | Coef. | p-Value | Coef. | p-Value | Coef. | 95% Credible Intervals |
| Fixed Effects | Population-Level Effects | |||||
| Constant | −2.71 | 0.00 | −2.20 | 0.00 | −2.57 | (−3.82, −1.68) |
| Gender (Male = 1, Female = 0) | 0.35 | 0.01 | 0.34 | 0.01 | 0.34 | (0.07, 0.61) |
| Driver license | ||||||
| Already have license | 1.66 | 0.00 | 1.66 | 0.00 | 1.62 | (1.14, 2.13) |
| Plan to get license | 1.10 | 0.00 | 1.11 | 0.00 | 1.06 | (0.55, 1.58) |
| No plan at all | base | - | - | |||
| Emission concern (Not Concerned = 1, … Very Concerned = 10) | −0.13 | 0.36 | −0.13 | 0.37 | −0.13 | (−0.41, 0.14) |
| No. of licensed drivers | 0.15 | 0.06 | 0.15 | 0.06 | 0.16 | (0.00, 0.32) |
| Household income | 0.03 | 0.00 | 0.03 | 0.00 | 0.03 | (0.02, 0.05) |
| No. of e-bikes | 0.12 | 0.38 | 0.11 | 0.40 | 0.13 | (−0.07, 0.33) |
| No. of motorcycles | 0.34 | 0.02 | 0.34 | 0.02 | 0.19 | (−0.06, 0.44) |
| No. of cars | −0.34 | 0.01 | −0.33 | 0.01 | −0.39 | (−0.62, −0.18) |
| Duration of first motorized vehicle ownership in months | 0.06 | 0.00 | 0.06 | 0.00 | 0.04 | (0.01, 0.08) |
| E-bike is the first motorized vehicle (Yes = 1, No = 0) | −0.48 | 0.10 | −0.48 | 0.10 | −0.47 | (−1.04, 0.09) |
| Motorcycle is the first motorized vehicle (Yes = 1, No = 0) | −0.96 | 0.01 | −0.94 | 0.01 | −0.93 | (−1.61, −0.27) |
| Car is the first motorized vehicle (Yes = 1, No = 0) | −0.54 | 0.05 | −0.54 | 0.05 | −0.54 | (−1.08, 0.01) |
| District | Random effects | Group-level effect | ||||
| 1 | Base | Intercept of District | Intercept of District | |||
| 2 | 0.44 | 0.03 | Variance | Std. dev. | Variance | |
| 3 | 0.94 | 0.00 | 0.09 | 0.08 | 0.38 | (0.15, 2.51) |
| 4 | 0.96 | 0.00 | ||||
| 5 | 0.38 | 0.04 | ||||
| Goodness of fit | LR chi2 = 148.67 | Wald chi2 = 105.83 | Rhat of each | |||
| p > chi2 = 0.001 | p > chi2 = 0.000 | parameter: 1 | ||||
| BIC | 1594.1 | 1586.1 | ||||
| Factors | Coefficient | Std. Err. | Z-Value | p-Value |
|---|---|---|---|---|
| CV | Base outcome | |||
| PHEV | ||||
| Gender (Male = 1, Female = 0) | 0.40 * | 0.26 | 1.56 | 0.120 |
| Personal inclination to CV (Likert-scale, Not at all: 0, …, Definitely yes: 10) | −0.08 ** | 0.04 | −1.85 | 0.064 |
| Plan to have a driver’s license within three years | −0.87 * | 0.58 | −1.50 | 0.135 |
| Household income (in 10,000 Yuan) | 0.22 *** | 0.09 | 2.37 | 0.018 |
| No. of e-bikes | 0.37 ** | 0.20 | 1.85 | 0.065 |
| Duration of first motorized vehicle ownership (years) | −0.04 * | 0.03 | −1.50 | 0.134 |
| First motorized vehicle was a motorcycle (yes = 1, no = 0) | 0.72 * | 0.46 | 1.55 | 0.121 |
| Constant | −1.42 * | 0.88 | −1.62 | 0.105 |
| BEV | ||||
| Gender (Male = 1, Female = 0) | 0.99 *** | 0.40 | 2.47 | 0.013 |
| Personal inclination to CV | −0.20 **** | 0.06 | −3.32 | 0.001 |
| Drive or ride EV before (Yes = 1, No = 0) | 0.94 **** | 0.35 | 2.71 | 0.007 |
| Already have a driver license | −1.34 ** | 0.70 | −1.91 | 0.056 |
| Household income (in 10,000 Yuan) | 0.53 **** | 0.15 | 3.48 | 0.001 |
| Purchase budget (in 1000 Yuan) | −0.01 *** | 0.00 | −2.51 | 0.012 |
| First motorized vehicle was a car (Yes = 1, No = 0) | 0.64 | 0.44 | 1.44 | 0.150 |
| Constant | −2.70 *** | 1.23 | −2.20 | 0.028 |
| LR chi2 (22) = 39.54 | Prob > chi2 = 0.000 | |||
| Log likelihood at convergence = −371.593 | Sample size: 464 (38% of the respondents who stated an intention to purchase a vehicle) | |||
Publisher’s Note: MDPI stays neutral with regard to jurisdictional claims in published maps and institutional affiliations. |
© 2021 by the authors. Licensee MDPI, Basel, Switzerland. This article is an open access article distributed under the terms and conditions of the Creative Commons Attribution (CC BY) license (https://creativecommons.org/licenses/by/4.0/).
Share and Cite
Ling, Z.; Cherry, C.R.; Wen, Y. Determining the Factors That Influence Electric Vehicle Adoption: A Stated Preference Survey Study in Beijing, China. Sustainability 2021, 13, 11719. https://doi.org/10.3390/su132111719
Ling Z, Cherry CR, Wen Y. Determining the Factors That Influence Electric Vehicle Adoption: A Stated Preference Survey Study in Beijing, China. Sustainability. 2021; 13(21):11719. https://doi.org/10.3390/su132111719
Chicago/Turabian StyleLing, Ziwen, Christopher R. Cherry, and Yi Wen. 2021. "Determining the Factors That Influence Electric Vehicle Adoption: A Stated Preference Survey Study in Beijing, China" Sustainability 13, no. 21: 11719. https://doi.org/10.3390/su132111719
APA StyleLing, Z., Cherry, C. R., & Wen, Y. (2021). Determining the Factors That Influence Electric Vehicle Adoption: A Stated Preference Survey Study in Beijing, China. Sustainability, 13(21), 11719. https://doi.org/10.3390/su132111719