
A Case Study of Tourist Perceptions and Revisit Intention Regarding Qingwan Cactus Park in Penghu, Taiwan


1
Department of Applied Foreign Languages, National Penghu University of Science and Technology, Magong 880, Taiwan
2
Department of Electrical Engineering, National Penghu University of Science and Technology, Magong 880, Taiwan
*
Author to whom correspondence should be addressed.
Sustainability 2021, 13(22), 12404; https://doi.org/10.3390/su132212404
Submission received: 8 July 2021
/
Revised: 21 October 2021
/
Accepted: 27 October 2021
/
Published: 10 November 2021
(This article belongs to the Special Issue Selected Papers from IEEE Eurasia Conference on Biomedical Engineering, Healthcare and Sustainability 2020)
Abstract
:In recent years, the citizens of Taiwan have exhibited an increasing demand for domestic tourism and travel options. Due to their relatively early development as a domestic tourism destination, the Penghu Islands are well known for their rich natural and cultural resources. The purpose of this study was to examine factors influencing tourists’ visits to Qingwan Cactus Park, including their reasons for visiting and their perceptions of their visits. With principal component analysis serving as the basis for an IPA methodology, and using the visiting destination as a reference point, the results obtained can provide a basic guideline for tourism planning. The visitors’ reactions and demands were re-examined through IPA analysis. The results could be used by national park managers to develop constructive suggestions on implementing sustainable development in Taiwan’s tourism industries. This study presents valuable data on Penghu and provides analyses of residents’ and tourists’ opinions, as well as their reactions. The study’s conclusions can be extrapolated to research on other destinations outside of Taiwan.
1. Introduction
The notion of sustainability has been applied in various fields since its conception. Young (1992) [1] pointed out that sustainability has been introduced into a wide range of disciplines, giving rise to concepts such as sustainable ecology, sustainable economy, sustainable agriculture, sustainable community development, sustainable human development, etc. Even though sustainability is emphasized differently in each discipline, the implications of sustainable development remain more or less the same. However, it is still widely held that a comprehensive sustainable development plan should simultaneously entail the three dimensions of environment, economy, and society, as these three dimensions depend on and mutually influence one another and should be taken into consideration. Ultimately, sustainable development should reach an optimum condition where all three systems can be sustained continuously. Many scholars have advocated that in the pursuit of environmental sustainability, the methods, systems, information, or finances utilized should not lead to the depletion of natural resources or destruction of natural life cycles [2,3]. Social cultural sustainability emphasizes the positive effects of economic efficacy on the environment and society. Meanwhile, productive efficiency and allocative efficiency are evaluation factors that promote sustainable businesses and economies. Productive efficiency is the point of optimal production where marginal cost is equal to marginal benefit and waste production is prevented. Allocative efficiency refers to the allocation of resources such that the situation will improve for some people, but not at the expense of others.
Tourism has emerged as an attractive option to achieve economic growth and regional development in several rural areas. Indeed, the beneficial effects of rural tourism on economy have been under study for a significant amount of time [4,5]. Tourism can diversify the economies of rural communities, especially communities located on islands that are small and difficult to access.
Without a doubt, be it for natural landscapes, cultural industries, or local food businesses, the utilization of advertisements, marketing strategies, and promotions are all attempts to expedite tourism growth in the region, and thereby generate more benefits. This study is focused on Penghu, an outlying island region of Taiwan that has been a longstanding focus and direction of the nation’s tourism industry.
The Penghu Islands possess rich resources for tourism and recreational activities, including not only twisting stretches of coastline and other natural ecological resources but also many historical monuments which are worth visiting and preserving.
Penghu’s Qingwan Cactus Park is one of the notable sights in Penghu, and it is located close to many other important tourist attractions, such as Shili Beach, Fonggui Cave, and Shetou Hill, among others. Therefore, the park and the surrounding area comprise a must-see attraction for tourists. With its beautiful landscapes featuring different types of cactus vegetation, as well as a wide offering of recreational and educational activities and multi-functional facilities, the park has brought about considerable prosperity and development to the area.
As defined by the World Tourism Organization (WTO), which in turn extracted the definition from the Brundtland Report, sustainable tourism consists of tourism that “meets the needs of tourists and host regions.” Despite debates over the concept, the above definition provides a clear path to follow [6,7] (Clarke, 1997, Hardy et al., 2002). For this reason, there is a need to formulate tourism policies with the objective of safeguarding natural, social and cultural resources, and to guarantee that the management of these resources fulfills the necessities of both actual and future residents and tourists [8,9] (Sharpley, 2000, Liu, 2003, Blancas’ et al., 2010).
In adherence to this new paradigm, the tourism planning policies aspire to develop a model of tourism characterized by quality, sustainability and diversity that can enhance the competitive capacity of destinations [10].
In the study “The assessment of sustainable tourism: Application to Spanish coastal destinations” (Blancas et al., 2010), the WTO proved to be a guide that provides indicators of sustainable development in terms of tourism destinations [11] (World Tourism Organization, 2004). These indicators of sustainable tourism can be determined and subdivided into the three subsets, namely key and complementary indicators of sustainable tourism, and specific site indicators. Blancas et al., (2010) described how a sustainable tourism indicator system’s information can be defined, quantified, and used for application in Spanish coastal destinations. The results of their analysis can serve as a practical basis for defining, quantifying, and utilizing data obtained from other sustainability indicators applied to other destinations for the green industries worldwide.
This study focused on visitors to Qingwan Cactus Park to assess whether travel expectations and tourist motivations may alter their perceptions towards the park as well as their intentions to revisit. Perception scales are useful tools for measuring people’s views regarding products, work situations, their quality of life, community characteristics, and the quality of outdoor recreation options, among other things. In seeking to understand and satisfy the needs of tourists, it is most important to explore their motivations and perception levels and, in order to understand these factors, it is necessary to take appropriate measurements.
1.1. Purposes of This Study
- Understand the value of tourist perceptions and provide professional management knowledge to enhance the management quality of national park services.
- Provide useful assessment of sustainable tourism for national park sightseeing.
- Determine the factors that contribute to Penghu visitors’ intentions and behaviors with regard to revisiting the cactus park.
- Provide the local government with a better decision-making process.
- Judge whether the satisfaction of tourists’ demands in terms of the recreational quality of national park services plays a significant role in Penghu.
1.2. Literature Review
Tourism accounts for more than 8% of the foreign exchange revenue earned globally, and the total revenue figure exceeds those of other forms of international trade. Generating around US$5.33 trillion in revenue, tourism is the most dominant form of international trade. Moreover, tourism is listed among the top five sources of income in 83% of countries around the world and contributes to 38% of the foreign exchange revenue of certain countries. For island countries or developing countries/regions, mass tourist numbers is a key driver of the tourism industry as well as related economies. Undoubtedly, tourism constitutes a pivotal green industry in the 21st century. Therefore, tourism has been and will continue to be a key player in economic development worldwide, together with aiding the development of economies in individual countries. Many scholars have regarded tourism as the world’s greatest green industry to date [12].
In connection with this research subject, this study investigated the factors of forward expectations, practical experiences, motivations, perceptions, and revisit intentions among tourists. The following sections provide a review, discussion, and brief compendium of pertinent literature to make the theoretical basis of the study clear and better explain the overall structure of this study.
1.3. Forward Expectations Theories and Implications
The term “expectation”, at least as used in the present research, was defined by Parasuraman, Zeithaml, and Berry (1988) [13] to refer to the requirements and desires of customers. These three scholars believe that what a provider should offer is far more important than what can be provided by a provider. In his theory of expectation, Lawler (1973) suggested that people regard their abilities to attain different achievements with different preferences, and engage in related actions accordingly. That is, people carry certain psychological expectations regarding their own abilities [14].
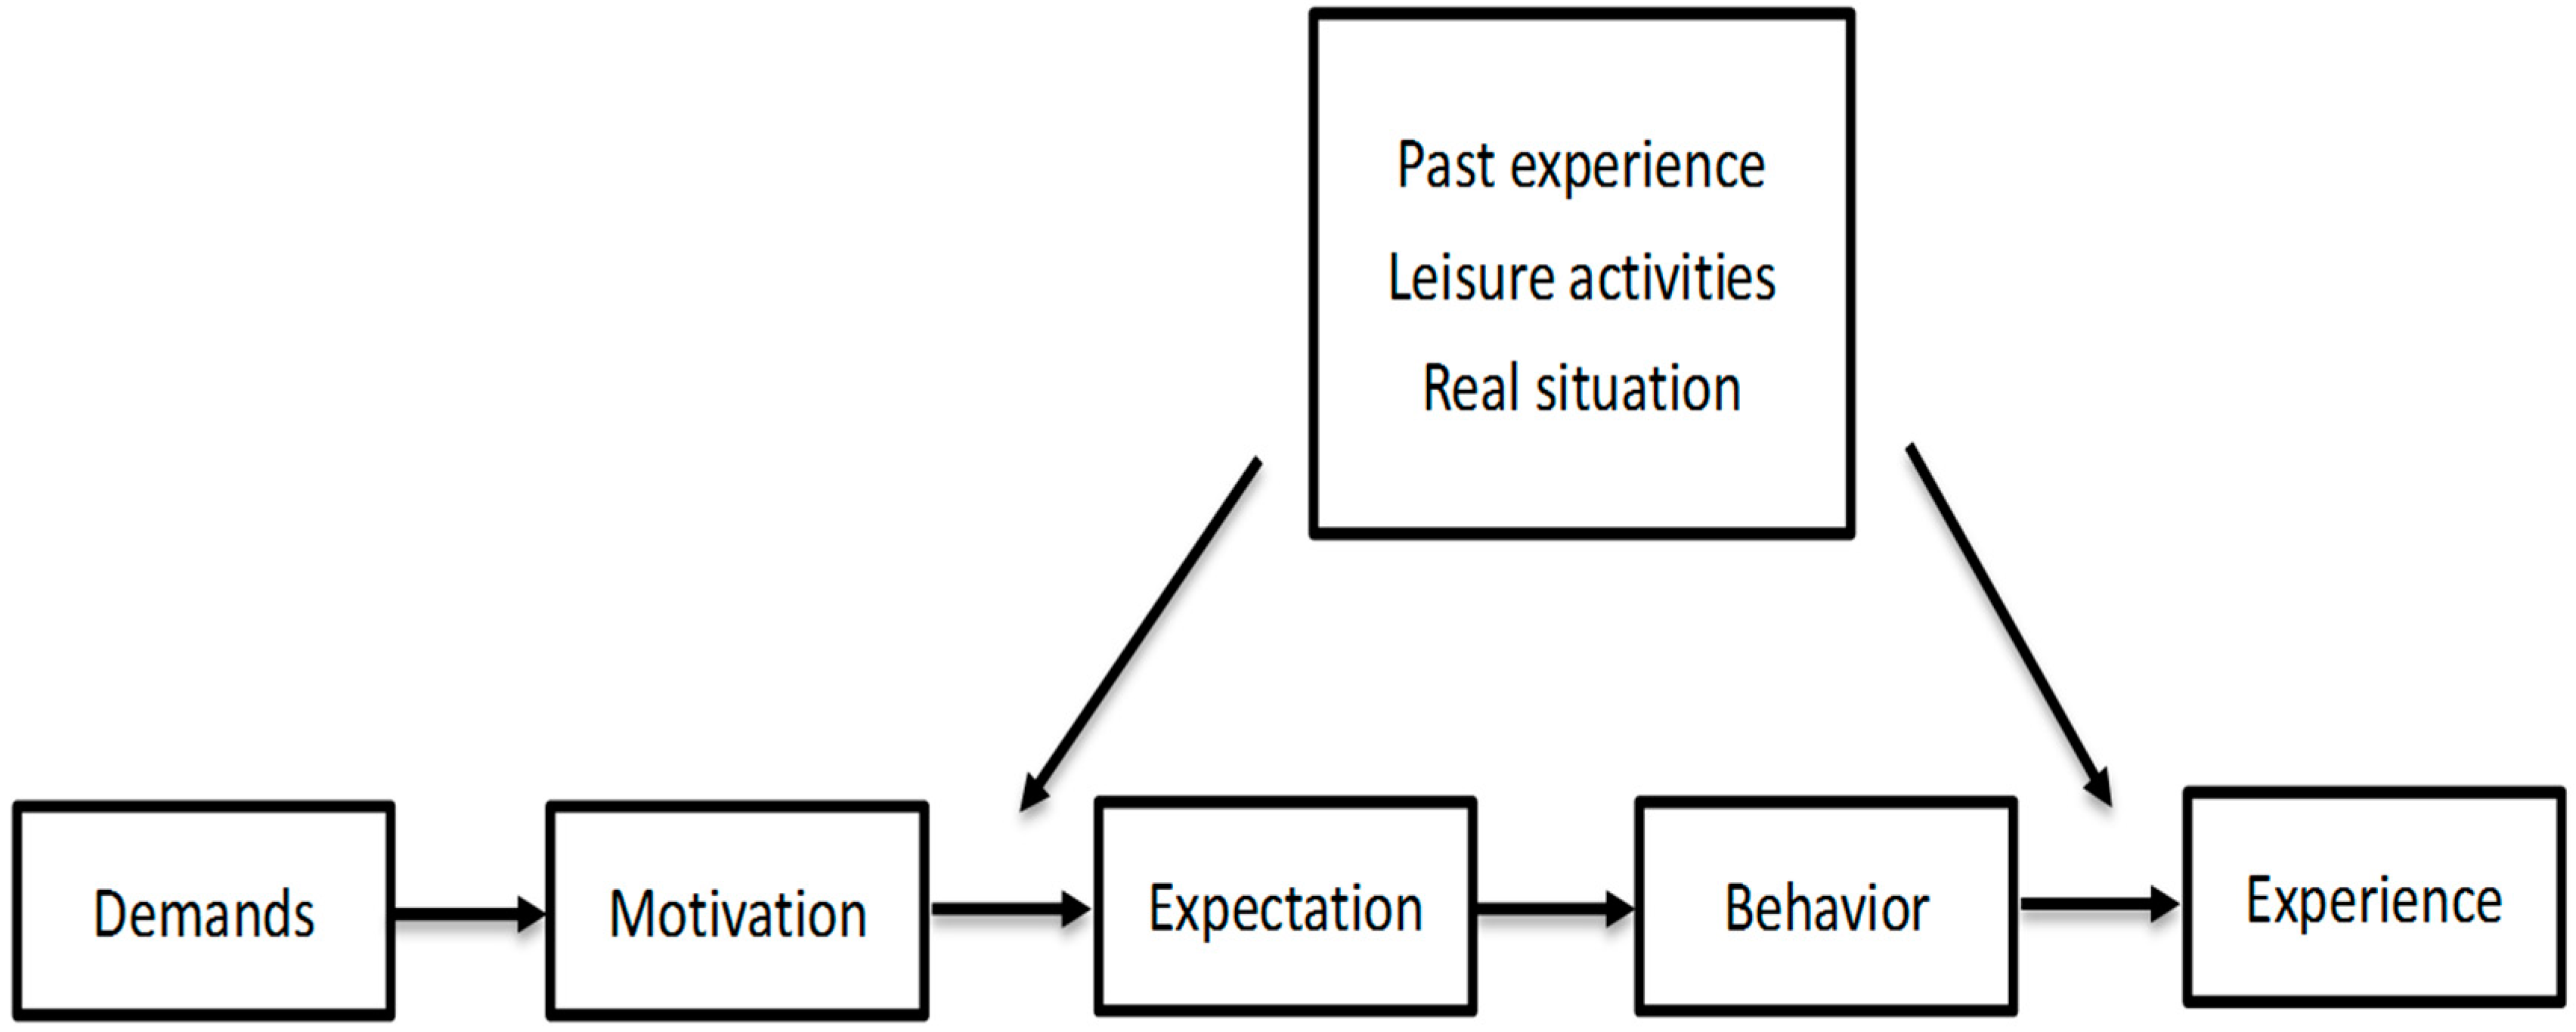
Miller (1977) demonstrated that expectations could be classified into four different types: “ideal”, “expected”, “minimum tolerable”, and “desirable” expectations [15]. Iso-Ahola, S. E. & Allen J. R. (1982) viewed the recreation demands and motivations of tourists as often being subject to the influence of personal characteristics and their past experiences [16]. Due to people potentially having different expectations regarding various forms of recreation, with these expectations leading in turn to their recreation-related behaviors, there are also environmental qualities, types of activities, and real situations that cause different recreational experiences, with these factors in turn eventually affecting a given tourist’s recreational perceptions (Figure 1).
To summarize, the aforementioned scholars generally agree that people regard their abilities to attain different achievements with different preferences. Moreover, people may have different expectations regarding recreational activities that lead to different recreational behaviors, which in turn cause different recreational experiences that affect their recreational perceptions.
1.4. Practical Experiences and Relevant Research
The process of a recreational experience includes five stages: a phase of anticipation phase, followed by the actual travel phase, then the on-site-activities phase, followed by the return travel phase and, finally, the recollection phase [17,18]. Hammitt (1980) explained that when engaging in recreational activities, a person’s senses, satisfactions, mind, and behavior will bring about continuous interactions with various environmental factors that will in turn yield various feelings and experiences. Such experiences are called recreational experiences [18]. According to Y. L. Chao & S.Y. Chao (2017), “Experience is individual that after it subject to external stimulation, through the emotion and satisfactions process to come about physiology and psychological reaction, and can be categorized into two groups according to the type of stimulation: intrinsic and extrinsic” [19,20].
Recreational degree of recognition refers to tourists visiting and reacting to a variety of natural and cultural landscapes, recreation facilities, security facilities, service qualities, and so on. Recreational perceptions refers to the subjective evaluations of tourists regarding recreational activities and experiences, which are affected by various subjective and objective factors during those recreational activities [21].
The concept of a recreational experience and its relevant phases are shown in Figure 2.
To summarize, the aforementioned scholars generally agree that when joining in recreational activities, a person will have continuous interactions with various environmental factors that will in turn yield various feelings and experiences. These feelings and experiences essentially comprise the subjective evaluations of tourists regarding recreational activities and experiences.
1.5. Tourist Motivations
The motivation to travel is a “drive”. This drive not only compels people to travel to meet social needs and mental needs but is a major factor in what recreational activities tourists choose to take part in (Iso-Ahola & Allen, 1982) [16]. When people engage in tourism activities, they have different tourist motivations. These motivations in turn result in behaviors that, if effective, bring the person to question perceptions [22].
Wu, H. C., Huang, C. T., & Hung, C. M. (2015) pointed out “the travel behavior of tourists” is controlled by both long-term motivations and short-term motivations. When people get together on weekends after a busy week or take a short trip to a destination close to home, they are generally driven by short-term motivations. However, when people plan a travel itinerary and collect related information for several months before taking a trip, they are being driven by long-term motivations [23].
Tourism is a high-quality leisure activity that allows people to reduce their stress levels and avoid over-stimulation in a relaxing quiet environment. Individuals can express themselves through leisure travel, and such travel will typically improve an individual’s physical and spiritual well-being. When a whole family travels together, the relationships among the family members will be improved and become harmonious through their shared participation in leisure activities. For this reason, tourism makes people fully relaxed, prepared for their next tasks, and more efficient in their work [23].
In recent years, the needs and development of domestic tourism and leisure recreation have been deemed as substantial elements that influence social and economic development [24]. According to the Oxford English Dictionary definition of “psychology”: “motivation and behavior are two relative constructs. The individual behavior was outside activity; on the other hand, the motivation was internal process promoted by individual action”. However, the majority of psychologists agree that: ‘’the motivation not only caused and maintains individual activities but also was an internal process, and promoted activities achieved the goal’’ [25].
A growing body of literature has revolved around discussing tourist motivations. Crompton (1979) pointed out that the factors influencing the objectives of tourism destination choices are called tourist motivations, which can be categorized into pull and push factors [26]. Among the seven main push factors are: escaping from reality, surveying self-esteem, relaxing, seeking prestige, recovery and promotion of family relationships, and advancing interpersonal relationships. The two major pull factors are newfangled objects and education. Thomas (1964) proposed that there are eighteen kinds of important travel motivations, which he grouped into in four major categories in 1964. [27] (Table 1).
In conclusion, the motivation to travel is a “drive”. This drive not only compels people to travel to meet social needs and mental needs but is a major factor in what recreational activities tourists choose to take part in. Individual people can express themselves through leisure travel, and when a whole family travels together, relationships among the members will be improved and become harmonious through their shared participation in leisure activities.
1.6. Tourist Satisfaction and Perceptions
“Satisfaction is one of the personality traits that an individual possesses, as an attitude, a feeling, an indistinct and abstract noun”. With regard to satisfaction, scholars have a lot of definitions of the word. Kotler (1997) took the view that customers have a tally board in their mind to determine whether they are satisfied or dissatisfied after purchasing goods or being served. The higher customer satisfaction is regarding a product or service, the better the chances a client will purchase that product or service again [28].
According to Dorfman (1979) [21], recreational satisfaction refers to a tourist’s overall evaluation of a recreational experience, while Martin (1988) regarded overall satisfaction as a measurement of the total sum of recreational expectations at different levels and the recreational experiences that have been obtained. Martin (1988) stated that there should be consistency between an individual’s expectations towards a certain experience and the actual experience that he or she gains during a trip. An individual will have a feeling of satisfaction if what he or she experiences is equal to or exceeds what he or she expected prior to the trip. Otherwise, an individual will not have a feeling of satisfaction with what he or she experiences.
Recreational quality, which is considered an element of the recreational experience, makes reference to the level of tourist needs met by recreational opportunities and the resulting satisfaction. If the manager of a destination provides recreation opportunities that better satisfy a tourist’s demands, the satisfaction in terms of the recreational quality will be higher [23].
The satisfaction of tourists is important to site managers. Tourist attractions that result in higher tourist satisfaction will have higher rates of sales and revisit intentions. Therefore, high tourist satisfaction is something that managers must strive to achieve. Hung et al., (2005) proposed a measurement of satisfaction in a study regarding the cultural tourism development of the Tai-An Railroad that includes four dimensions and environmental features with eleven variables (Table 2).
In summary, the aforementioned scholars agree that when a person has an experience, he or she will have expectations that are met, not met, or exceeded by the actual experience. When those expectations are either fulfilled or the result is better than anticipated, the customer will be satisfied. If not, they will not be satisfied. In other words, if the manager of a destination provides recreation opportunities that better satisfy a tourist’s demands, the satisfaction in terms of the recreational quality will be higher.
1.7. Revisit Intentions
Revisit intention refers to whether tourists are willing to travel again to a given destination or to other scenic spots in the same country [29]. In this study, we defined “revisit intention” as tourists being willing to travel to a single destination or a spot again. There have been numerous studies that have investigated tourists’ satisfaction with various attractions. Therefore, such studies have made some relevant contributions to the relevant domestic and foreign literature.
1.8. Current Literature on Destinations
The concept of tourism sustainability entails implementing controls to monitor the carrying capacity of a certain destination. This matter of carrying capacity in particular has drawn increasing interest from academia and the public institutions behind tourism planning. Published by the World Tourism Organization (WTO), the Global Code of Ethics for Tourism proposes that the different actors implicated in tourism ought to take into account their agenda while also considering the interests of the community, together with the site’s natural environment and cultural patrimony. (Antonio Alvarez-Sousa, Jose Luis Paniza Prados, 2020) [34,35]. A survey by Turistes titled “Tourists Barcelona 2016” was conducted between 22 February and 22 December 2016 and enrolled a total of 6032 tourists (over 15 years old) that stayed for between 1 and 28 nights in Barcelona. The CAPI computer system was utilized to carry out the interviews and data was analyzed using the program Atlas.ti, after which the grounded theory phases and the functions in Atlas.ti were integrated. The questionnaire items used for assessing the perception of tourists in terms of carrying capacity in Barcelona were as follows: 38_2 (representing the degree of agreement or disagreement with “Barcelona is too crowded for tourism”) and 38_3 (representing the degree of agreement or disagreement with “In Barcelona prices are higher than the quality offered”). The SPSS software was used to analyze the data [36,37,38,39] (Antonio Alvarez-Sousa, 2018).
1.9. Study by Antonio Alvarez-Sousa and Jose Luis Paniza Prados on “Visitor Management in World Heritage Destinations before and after COVID-19, Angkor”
This particular study focused on analyzing both visitor-management tactics and strategies implemented in World Heritage destinations, utilizing as case studies the Cambodian temples of Angkor. Even though the sustainability paradigm was maintained, including risk society concepts and public health objectives as central elements was an important complement [35,40,41].
In short, the aforementioned scholars agree that a statistically significant positive relationship exists between overall satisfaction in tourists and marine activities and their revisit intentions.
The Penghu Islands are a chain of islands to the west of the main island of Taiwan. In high season, the islands offer many popular and dynamic activities; for example, playing water sports, experiencing a fisherman’s life, and visiting historical and cultural landmarks. On the other hand, Penghu also has many kinds of tourist attractions that can be further developed in the future, such as Qingwan Cactus Park, which contains hundreds of cacti and various facilities. As such, the park definitely offers many fun and nature-related experiences to visitors.
In order to accommodate tourists seeking to visit the privately run Qingwan Cactus Park in Penghu, it is also necessary to market Penghu itself as a beautiful tourist destination. Conducting this research can benefit the Penghu County administration and assist Qingwan Cactus Park in turning itself into a must-visit place, as well as one of the famous scenic spots in Penghu [42,43].
This research study focused on forward expectations, practical experiences, tourist motivations, tourist satisfaction, and tourist revisit intentions as five major factors, as well as on related theories and literature [12,44]. The study was intended to investigate current tourists’ opinions of and impressions of Qingwan Cactus Park.
Previous research has claimed that what moves people to travel and, simultaneously, what lures them to visit certain destinations is simply motivation [45,46]. In the past, several studies were conducted in order to pinpoint the push and pull factors that contribute to forge tourists’ motivations, in addition to elucidating how to utilize these factors in the creation of more effective marketing strategies [26,45,46,47,48,49,50] (see Table 3).
A number of previous studies have also emphasized social media relevance in terms of offered services and products. Since experience is a main contributor to the perception of travel service, visitors consider that online reviews are a high-value source of information [57], to the point where these reviews exert considerable influence on the demand for a tourist service. Accordingly, Collie reported that, of all the travel organization made by travelers beforehand, around 69% is defined by online reviews obtained from previous tourists [42]. Whereas online reviews for sightseeing or activities at a certain destination are harder to find, those for restaurants or hotels are more frequently available. Despite them all being experiences related to tourism, they can be considered services [57]. Therefore, there is a necessity for tourism-related marketing to recognize the role of social media in terms of travelers’ perception of a destination [49,50].
2. Materials and Methods
The current study’s main purpose was to investigate the effects of tourists’ expectations and experiences on their levels of satisfaction with the Qing wan Cactus Park in Penghu. To do so, the study collected data on the satisfaction of actual visitors to the park. It was initially hypothesized that the expectations of park visitors and the quality of the services provided would have a direct association with the visitors’ overall satisfaction with their visits. In a general sense, the research aimed to determine the applicability of satisfaction-related theories to the specific case of the Qingwan Cactus Park in Penghu.
2.1. Participants
The participants in this study consisted of park visitors who viewed the park as a tourist attraction to be visited during a trip to the islands. More specifically, the study surveyed a total of 413 tourists who came to the park. These 413 tourists were randomly selected from among all the visitors to the park during a certain period and included individuals from a range of different cities.
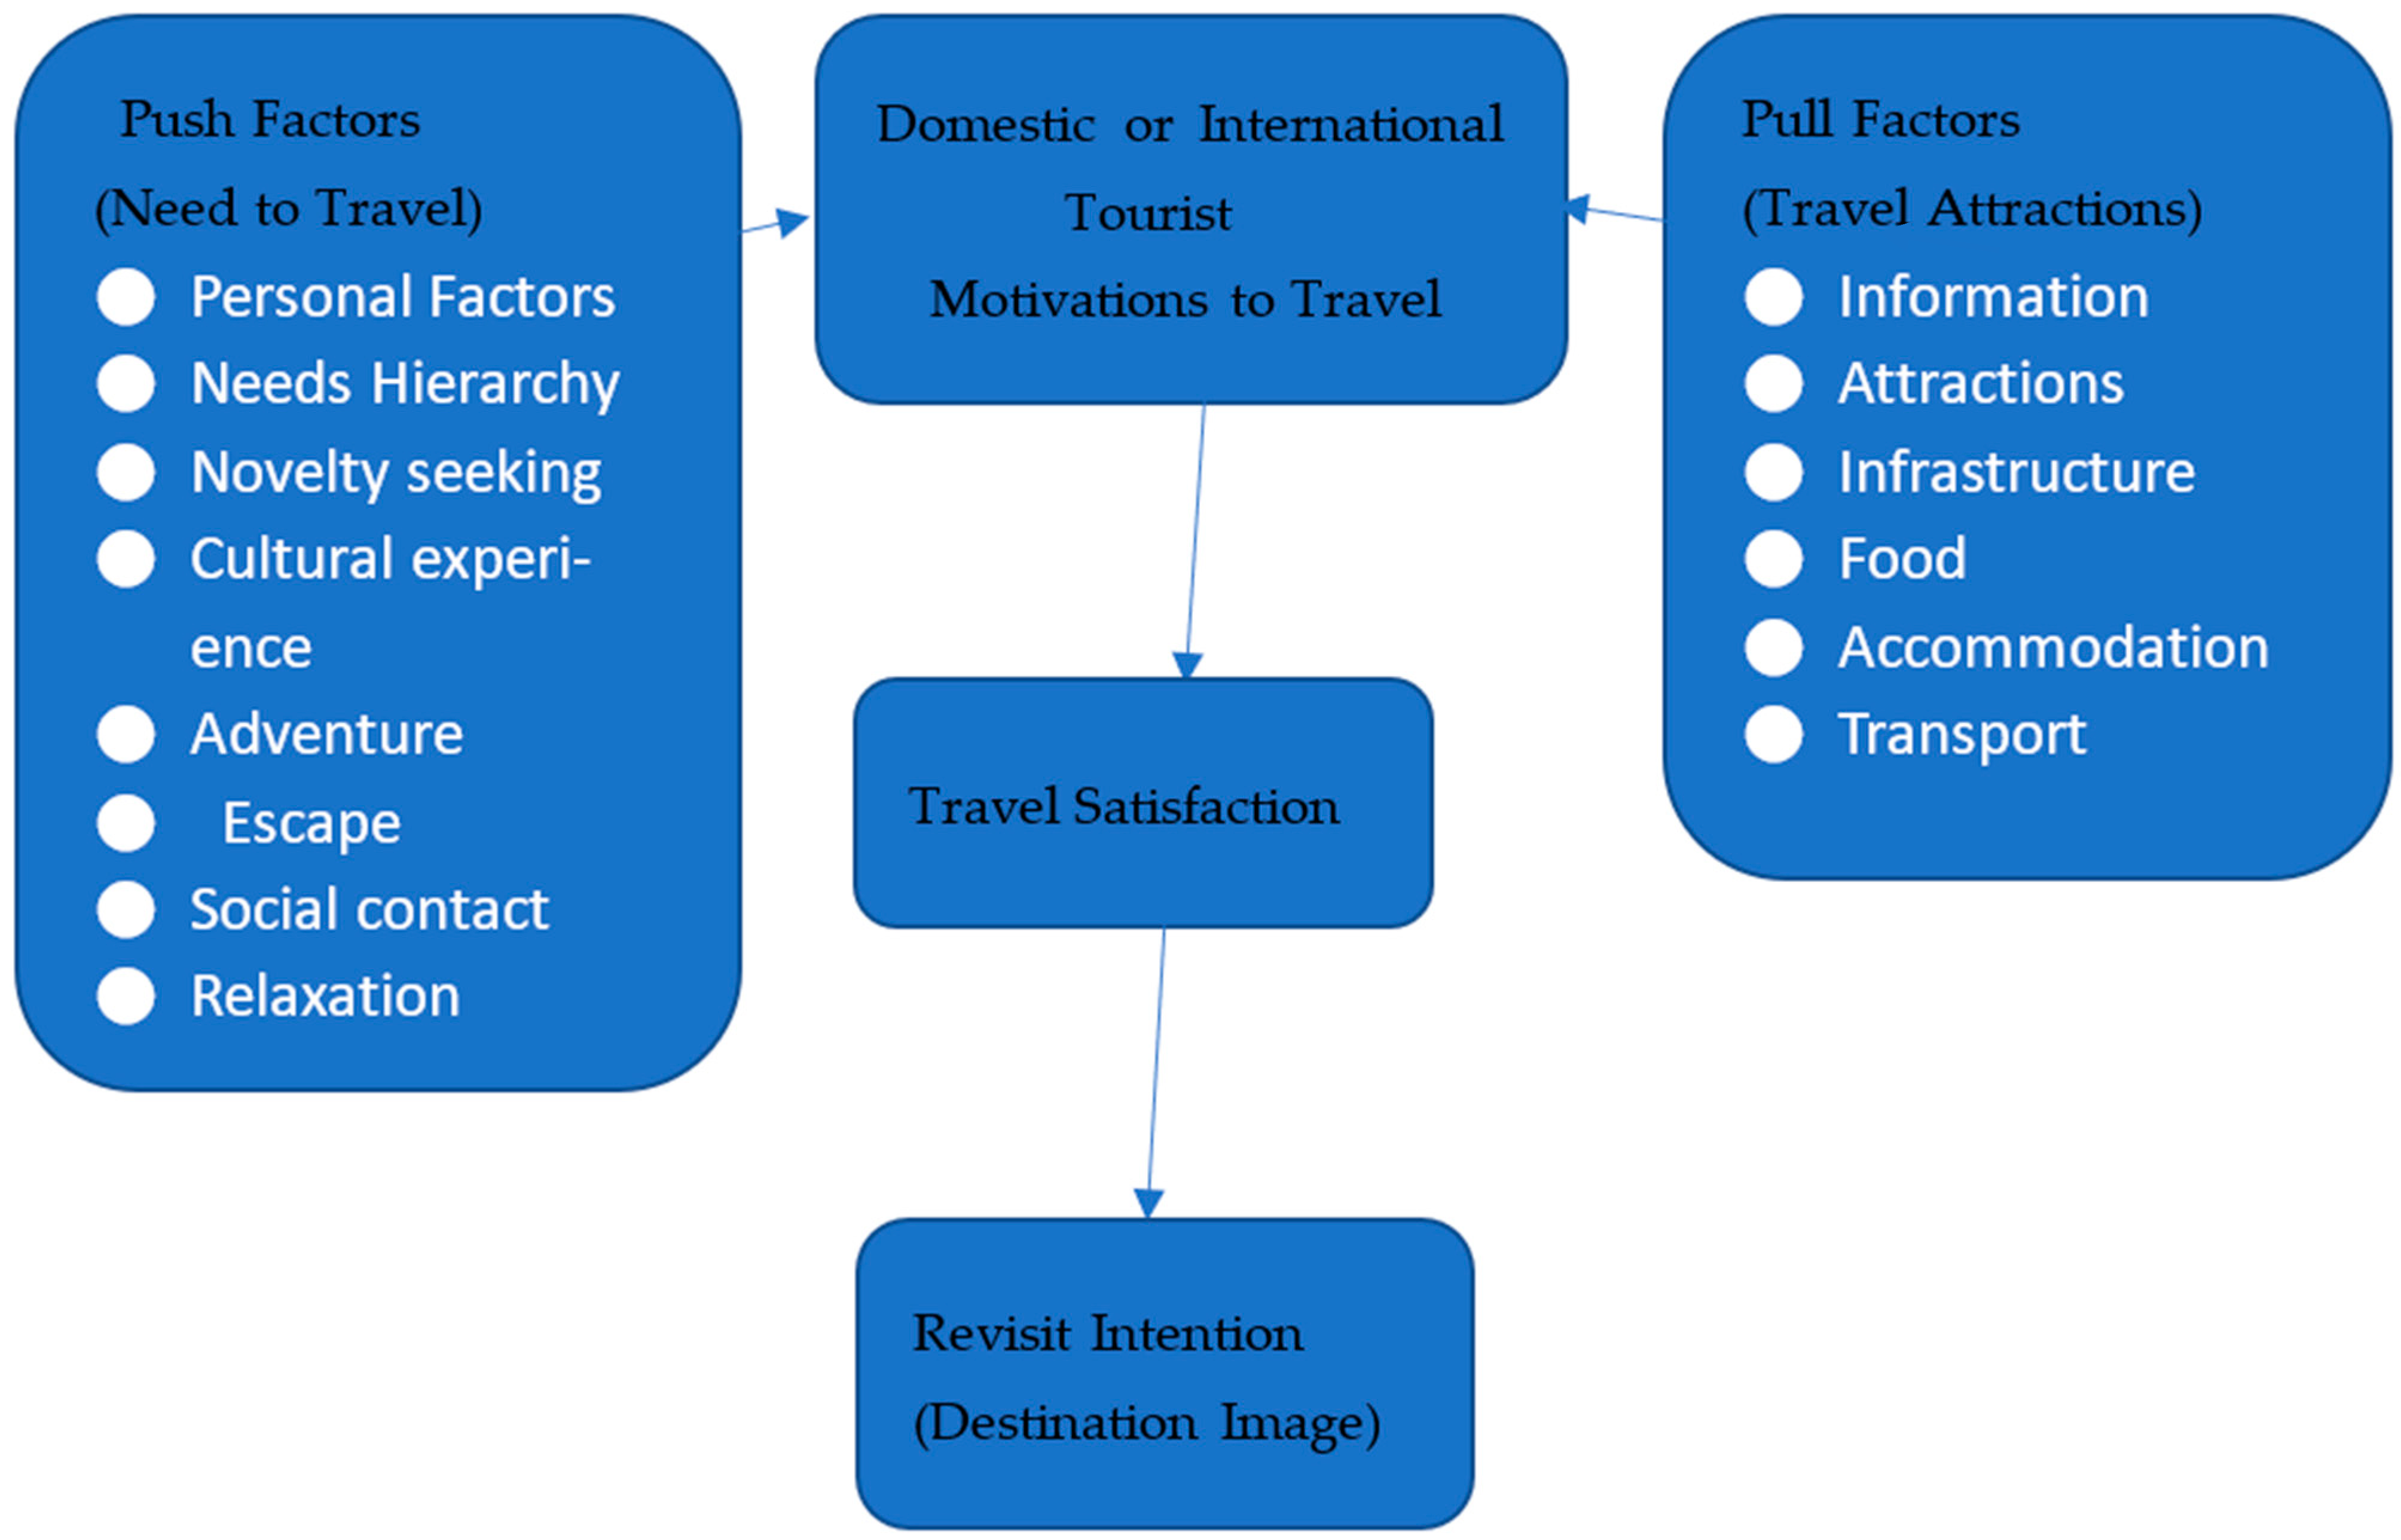
This study further explores the methodology proposed by Oh et al. [47], which proposes classifying tourists into diverse market segments according to their travel motivation. This segmentation contributes to predicting the motivation behind destination choices in travelers. This study aims to examine whether the segmentation analysis using push and pull factors could be applicable to the context of social media. In particular, we assess whether the motives of tourists to travel are influenced by their preferences during the information-seeking phase prior to travel within the social media context. The following research challenges are addressed by this study (See Figure 3).
2.2. Instruments
The selected tourists filled out a questionnaire that was a modified version of a formerly used survey. The questionnaire consisted of two separate sections in relation to two central factors: satisfaction and revisit intention. Four main topics were included in the sections referring to expectations and satisfaction as follows: (1) Public facilities, (2) BBQ areas, (3) Leisure and recreation facilities, and (4) Leisure and recreation areas. Throughout the questionnaire, the respondents were asked to rate their level of agreement with numerous elements using a 5-point Likert Scale, in which travelers can express their agreement or disagreement ranging from 1 = strongly disagree to 5 = strongly agree. To analyze visitors’ perceptions, we employed several approaches, including interpretative phenomenology analysis, IPA, and qualitative research methods.
2.3. What Is IPA?
With an IPA approach [9], a study’s advantageous elements increase fourfold as this approach allows researchers to bond with the study participants and form a relationship. In addition, due to its qualitative nature, IPA constitutes an ideal opportunity for researchers to better acquaint themselves with the innermost deliberation of “lived experiences” from interviewees (study participants). Being a “participant-oriented” approach, the interpretative phenomenological analysis approach makes it possible for interviewees to express themselves and convey their “lived experience” stories in a manner that they deemed to be appropriate and in the absence of any distortion and/or prosecution. Smith et al. (2009) [59] established that the field of psychology gave origin to IPA, as well as a considerable number of previous studies that utilized IPA were health psychology studies. Since then, IPA has seen increasingly frequent use, particularly in clinical and counseling psychology, as well as social and educational psychology. Unsurprisingly, the core constituent of IPA is, broadly speaking, applied psychology, that is, psychology in a real world setting. Being a tool especially designed for qualitative research, IPA enables numerous individuals with similar experiences to re-tell their stories in an environment without any distortions and/or prosecutions. Creswell (2012, p. 76) affirmed that [60], “a phenomenological study describes the common meaning for several individuals of their lived experiences of a concept or phenomenon”. With respect to research population and sample size, Creswell (2012) [60] explained that determining the size of the sample that will be required is vital when selecting study participants. Similarly, a typical phenomenological study can have a participant sample size of between 2 and 25. Participants in an IPA research study should also be drawn from a homogeneous sample pool, for which Smith et al. (2009) [59] pointed out the main challenge in IPA is the following: “IPA is a detailed account of individual experience. The issue is quality, not quantity, and given the complexity of most human phenomena, IPA studies usually benefit from a concentrated focus on a small number of cases”. A phenomenological research study conducted by Creswell (2013) [61] revealed that collecting information is a process that entails primary in-depth interviews with up to 10 participants, in which the key is to describe the essence of the phenomenon for the few who have experienced it. Therefore, collecting data for an IPA study should proceed following these instructions: IPA research should include semi- and non-structured interviews, where between two (2) and twenty-five (25) individuals participate.
Components of IPA research. At its core, the phenomenological research approach (i.e., IPA) grants the capacity to explore, evaluate, and understand the research participants’ “lived experiences”. Creswell (2013) [61] asserted that the exploratory capacity in qualitative research enables investigating, interpreting, and understanding the problems encountered in these studies. Additionally, he claimed that “We conduct qualitative research because a problem or issue needs to be explored”; therefore, he was of the opinion that the phenomenological approach is most suitable for uncovering the root-cause of a phenomenon.
2.4. Procedures
The developed questionnaire was distributed to the randomly selected visitors to the park from August 2019 to September 2019. In other words, the study’s measurements of tourists’ perception came from data collected from tourists when they were still at the park. This approach was taken because it meant that the tourists would be in the midst of experiencing their visits and, thus, would have fresh and clear opinions regarding the facilities, attractions, and customer services of the park. The total number of questionnaires distributed was 500, of which a total of 413 returned questionnaires were valid, which represents an effective rate of 82.6%. The questionnaire was intended to measure the visitors’ levels of satisfaction with various aspects of the different facilities/areas in the park.
3. Results
3.1. Characteristics of Respondents
There were 230 (55.7%) male and 183 (44.3%) female respondents among the total of 413 people who took part in this research. Approximately 234 (56.7%) of the visitors were 21 to 30 years old, while 29.1% of the visitors were 13 to 20 years old. With respect to education level, 51.6% of the respondents had a college education, 6.3% of the respondents had graduated from a senior high school, 6.1% of the respondents had received specialized subject education, and 6.5% of the respondents had a graduate school education or above. As such, more than 50% of the respondents had a high level of education. In terms of occupation, 67.1% of the respondents were students, while 10.2% were in the service industry and 5.1% worked in the fields of business. With respect to income, 52.5% of the respondents earned less than NTD 10,000 per month, and 17.2% earned NTD 10,001–20,000 per month. Most of the respondents were unmarried (88.1%) and lived in Penghu City (54.0%), and most had come to Qingwan Cactus Park with friends or colleagues (54.7%).
3.2. Tourist Motivations
Table 4 and Table 5 summarize the tourist motivations of the visitors. According to the strength of their motivations, the specific motivations were scored from 0 to 5. Over half of the respondents were motivated by wildlife appreciation (3.68), sightseeing (3.67), relaxing (3.59), improving friendships (3.26), getting out of the city (3.24), and just visiting while passing by (3.12).
3.3. Forward Expectations
The expectations of the participants are detailed in Table 6. We can see that the minimum and maximum values of the forward expectations were 3.02 and 4.25, respectively (out of a possible maximum of 5). The average value was 3.66. Therefore, only 1/3 of the values were over the average. Those expectation values included the expectation values for restrooms (4.25), shaded spaces (4.17), parking lots (4.05), recreation spaces (4.02), medical facilities (4.00), lakeside terraces (3.85), lighting facilities (3.83), posters (3.81), and display facilities (3.68). The tourists’ top three expectations requiring satisfaction at the Qingwan Cactus Park were therefore those for restrooms (4.25), shaded spaces (4.17), and recreation spaces (4.02).
3.4. Practical Experiences (Tourist Satisfaction)
The practical experiences of the tourists indicated the degree to which their expectations were satisfied. In this regard, as indicated in Table 6 and Table 7, the maximum and minimum values were 2.8 and 3.48, respectively (out of a possible maximum of 5). The average value was 3.13. Regarding all the questions, the responses for only a few questions were over the average of 3.13. The results revealed that most of the visitors’ responses were “disagree” or “neutral”, which caused the average value to fall near the middle of the scale. That is, the visitors were not that satisfied with the performances of the factors they were asked about. The results also indicated that most of the respondents had a bad impression of Qingwan Cactus Park from their visit and were also not satisfied with these factors after their visit.
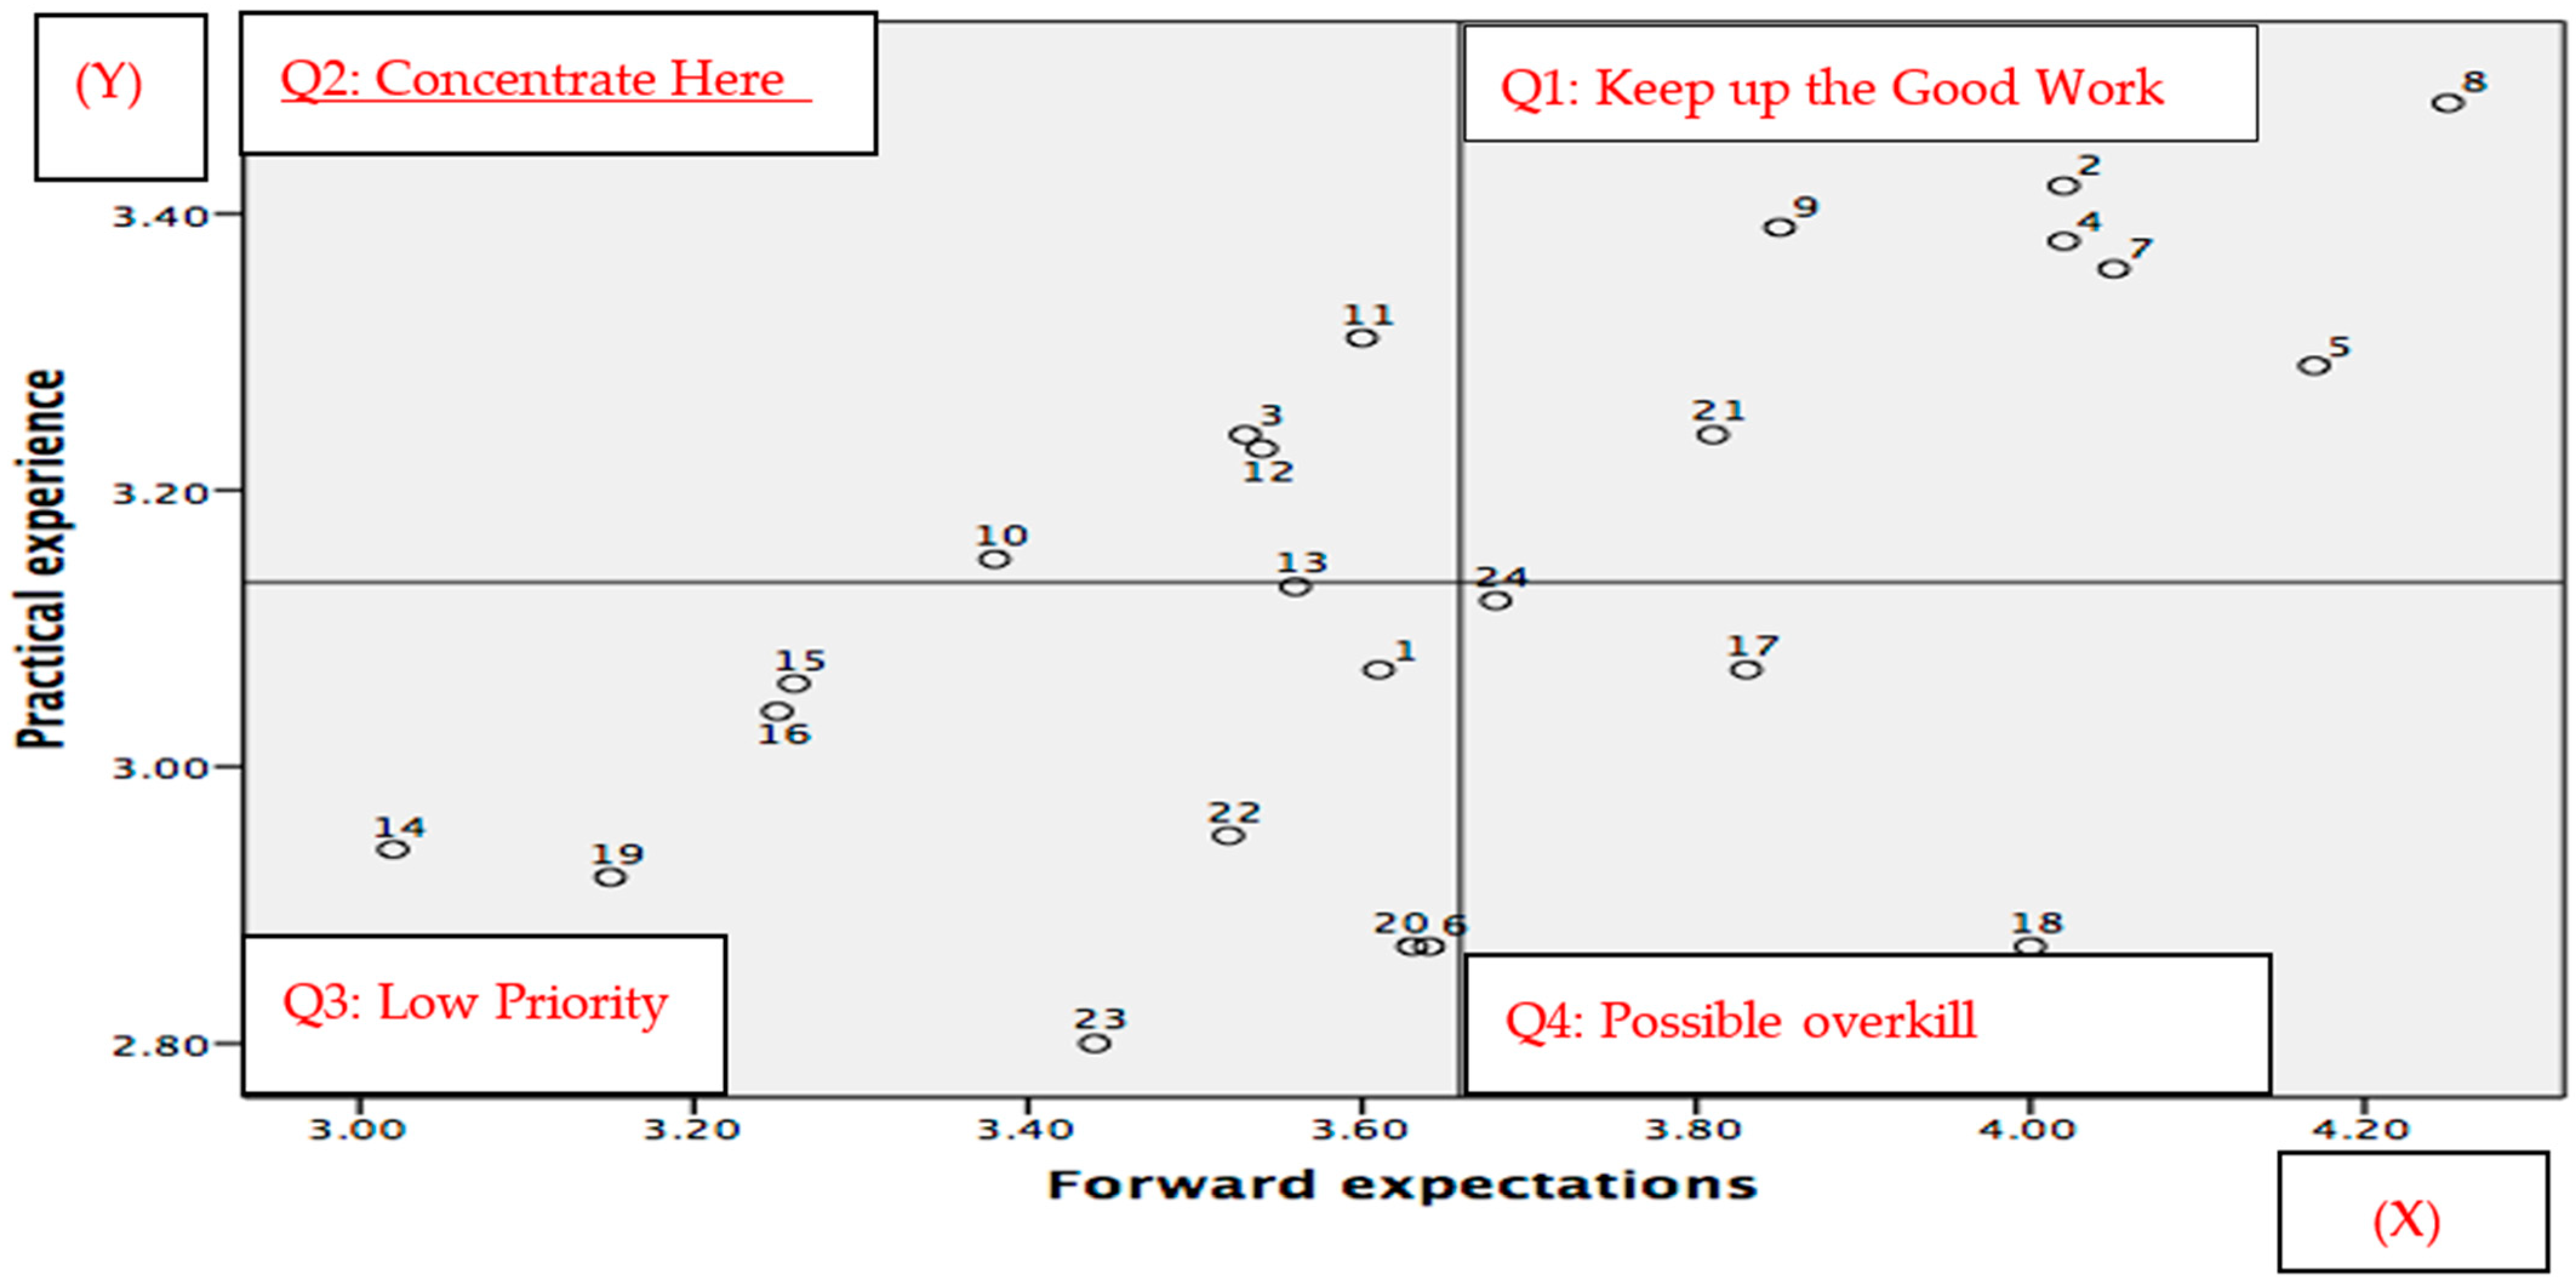
3.5. Importance-Performance Analysis (IPA)
In order to understand the visitors’ reactions to the questions, we decided to design a detail-oriented questionnaire. At the same time, we used IPA to analyze every average of “importance” and “performance”. Second, we put the results on a two-dimensional coordinate graph, and then described the performance of the items in order to have the priorities of the information provided. It was by using this analysis that we could easily know where the items fell in different quadrants. As shown in Figure 4, 10 items (41%) fell in quadrant C, which means that the “importance” and “performance” of those items were of low priority. In contrast, seven items (29%) were located in quadrant A, which showed that those items should maintain the good work. Taken together, the results discussed above suggested that Qingwan Cactus Park visitors were less likely to be satisfied by revisiting.
3.6. Revisit Intentions
The revisit intentions of the visitors are shown in Table 8 and Table 9. There were 36.3% (29.5 + 6.8%) of respondents who were satisfied with the park. The percentage of respondents who were willing to revisit and spread the word about the park was 35.1% (26.6 + 8.5%). However, if the entrance ticket price was to be increased, the proportion of respondents indicating a willingness to revisit was reduced to 20.6%. A quarter of the respondents were neutral about encouraging their friends to come to the park, but 41.4% of the respondents would do so. Only 27.4% (19.9 + 7.5%) of the respondents said they would view the park as a priority travel destination in the future, while 39.0% of the respondents were neutral and 27.8% of respondents said they would not view it as a priority travel destination.
4. Discussion
Indeed, Penghu has emerged among domestic visitors as a major, highly-popular tourist attraction. Compared with other scenic areas in Penghu, Qingwan Cactus Park is relatively new and features well-equipped facilities, including interactive and educational programs. The Park contains both natural and cultural elements, such as various plants, animals and historic monuments, as well as areas devoted to various do-it-yourself (DIY) activities. Since its opening in 2015, Qingwan Cactus Park has gradually become a popular and must-visit place.
The participants in the study consisted of visitors to the park who were invited to complete a questionnaire. Although the total number of questionnaires distributed was 500, only 413 of the returned questionnaires were valid, yielding an effective rate of 82.6%. After collecting the questionnaires, the SPSS statistical software was used to analyze the results, with the aim of determining future trends for Qingwan Cactus Park through the analysis of various factors, including tourist motivations, tourist perceptions, and revisit intentions.
In fact, planning and management cannot occur without the participation of different actors and particularly citizens; in this respect, the typologies proposed by Arsntein [62] and Tosun [63,64] are particularly helpful to identify (a) the opportunities provided by the government structure (b) their corresponding levels with regard to a specific moment. In the same vein, Mitchell’s creative destruction theory [65,66,67,68,69] can serve as a useful tool for understanding the state of a conflict at specific moment and the interventions that could follow.
The World Tourism Organization’s (WTO) definition was drawn from the Brundtland Report and defines sustainable tourism as the type of tourism that “meets the needs of tourists and host regions, while ensuring and enhancing future opportunities” [10].
This study analyzed and compared the differences in the surveyed visitors’ satisfaction levels prior to and after their practical experiences. We used IPA (Importance-Performance Analysis) to analyze the visitors’ satisfaction levels. From the data shown in Table 6, Table 7, Table 8 and Table 9, we can see that the top three features required for satisfaction included restrooms (4.25), shaded spaces (4.17), and recreation spaces (4.02). Relatedly, Qingwan Cactus Park is located in the south of Penghu, and it has the only public restroom on the road. We were impressed by this result, which exceeded our expectations. Furthermore, shaded spaces and recreation spaces were expected by visitors of every age. That was because of the scorching sun in summer and the windy weather in winter, which made people have the intention of finding a place for rest or shade.
Otherwise, the visitors also made some suggestions about Qingwan Cactus Park. For example, some said, “There should be more advertising for this place so that it can attract more visitors to go sightseeing. Also, it needs to fully use its own characteristics, such as using the basalt to crush out the sparks with cactus. However, now there are too many large buildings so that the original advantage can’t be seen by people”. Others said, “The signs are unclear, making it hard for visitors to know where to go”. Apparently, the park needs to take all these issues into consideration, and we hope that this study can help the park managers to understand its strengths and weaknesses so as to make necessary changes.
Our study is a source for national park managers and policymakers, along with communication strategists, since it presents crucial practical and managerial implications. These should be taken into consideration to better understand how push and pull factors can influence the intentions of tourists to revisit a destination, as well as the behavioral processes behind choosing a national park as a destination.
When it comes to our analysis, it should be noted that the participants may have lacked actual observations or personal experiences of using some of the facilities in the park; thus, they may not have formed specific opinions regarding some of the questions. Therefore, it may be assumed that they had no opinions toward certain questions when they filled out the questionnaire. Relatedly, the expectations of the participants were personal opinions regardless of their actual observations or experiences. This may have resulted in the higher validity of the participants’ expectations. This may explain the greater difference between the average and maximum values and the intermediate values in terms of the participants’ expectations rather than in terms of their opinions/satisfaction toward the facilities. The second validity weakness in the questionnaire as a whole may have been the sheer number of questions. The participants may not have had the patience to complete the whole questionnaire with their full attention.
The focus of this study was on implementing overall resource management such that economic, aesthetic, and social requirements are all fulfilled, and due respect is paid to important aspects such as key ecological processes and biodiversity, cultural integrity, and life support systems. [35,40,41] The visitors’ reactions and demands were examined through IPA analysis. The results could be used by national park managers to develop constructive suggestions on implementing sustainable development in Taiwan’s tourism industries.
Possible suggestions for improving the research questionnaire are the following: (a) Decrease the number of questions to encourage more sincere replies made with full attention, (b) Apply a ranking system instead of degrees among the opinions to avoid the validity weakness from respondents choosing “no comment” or “not sure”, and (c) Prepare some special offers to encourage visitors to state more opinions or expectations for future research.
Author Contributions
Conceptualization, H.-m.Y.; Data curation, P.J.B.T. and H.-m.Y.; Formal analysis, P.J.B.T.; Investigation, P.J.B.T.; Methodology, P.J.B.T. and H.-m.Y.; Project administration, M.-H.H.; Resources, H.-m.Y.; Visualization, M.-H.H.; Writing—original draft, P.J.B.T. All authors have read and agreed to the published version of the manuscript.
Funding
This research received no external funding.
Institutional Review Board Statement
Not applicable.
Informed Consent Statement
Not applicable.
Conflicts of Interest
The authors declare no conflict of interest.
References
- Young, M.D. Sustainable Investment and Resource Use; The Parthenon Publishing Group: Casterton, UK, 1992. [Google Scholar]
- Mitchell, R.; Wooliscroft, B.; Higham, J. Sustainable Market Orientation: A New Approach to Managing Market Strategy. J. Macromark. 2010, 30, 160–170. [Google Scholar] [CrossRef]
- Pushpakumara, H.; Atan, H.; Khatibi, A.; Azam, S.M.F.; Tham, J. Contribution of green orientation for the organizational performance: A review of stakeholder relationships and ecological modernization perspectives on sustainability. Int. J. Bus. Manag. Rev. 2018, 6, 56–72. [Google Scholar]
- Fleischer, A.; Felsenstein, D. Support for rural tourism: Does it make a difference? Ann. Tour. Res. 2000, 27, 1007–1024. [Google Scholar] [CrossRef]
- Gartner, W.C. Rural Tourism Development in the USA. Int. J. Tour. Res. 2004, 6, 151–164. [Google Scholar] [CrossRef]
- Clarke, J. A framework of approaches to sustainable tourism. J. Sustain. Tour. 1997, 5, 224–233. [Google Scholar] [CrossRef]
- Hardy, A.; Beeton, R.J.S.; Pearson, L. Sustainable Tourism: An Overview of the Concept and its Position in Relation to Conceptualisations of Tourism. J. Sustain. Tour. 2002, 10, 475–496. [Google Scholar] [CrossRef]
- Sharpley, R. Tourism and Sustainable Development: Exploring the Theoretical Divide. J. Sustain. Tour. 2000, 8, 1–19. [Google Scholar] [CrossRef]
- Blancas, F.J.; González, M.; Lozano, M.G.; Perez, F. The assessment of sustainable tourism: Application to Spanish coastal destinations. Ecol. Indic. 2010, 10, 484–492. [Google Scholar] [CrossRef]
- Butler, R. The Concept of a Tourist Area Cycle of Evolution: Implications for Management of Resources. Can. Geogr. Géographe Canadien 1980, 24, 5–12. [Google Scholar] [CrossRef]
- World Tourism Organization. Indicators of Sustainable Development for Tourism Destinations; A Guidebook; World Tourism Organization: Madrid, Spain, 2004. [Google Scholar]
- Dwyer, L.; Chen, N.; Lee, J. The role of place attachment in tourism research. J. Travel Tour. Mark. 2019, 36, 645–652. [Google Scholar] [CrossRef]
- Parasurama, A.; Zeithaml, V.A.; Berry, L.L. SERVQUAL: A multiple-item scale for measuring consumer perceptions of service quality. J. Retail. 1988, 64, 12–40. [Google Scholar]
- Lawler, E.E., III. Motivation in Work Organizations; Cole Publishing Company: Pacific Grove, CA, USA, 1973. [Google Scholar]
- Miller, J.A. Exploring satisfaction, modifying models, eliciting expectations, posing problems, and making meaningful measurements. In Conceptualizations and Measurement of Consumer Satisfaction and Dissatisfaction; Hunt, K.H., Ed.; Marketing Science Institute: Cambridge, MA, USA, 1977; pp. 72–91. [Google Scholar]
- Iso-Ahola, S.E.; Allen, J.R. The Dynamic of Leisure Motivation: The Effects of Outcome on Leisure Needs. Res. Q. Exerc. Sport 1982, 53, 141–149. [Google Scholar] [CrossRef] [PubMed]
- Clawson, M.; Knetsch, J.L. Economics of Outdoor Recreation; John Hopkins University Press: Baltimore, MD, USA, 1966. [Google Scholar]
- William, E.H. Outdoor Recreation: Is It a Multi-Phase Experience? J. Leis. Res. 1980, 12, 107–115. [Google Scholar] [CrossRef]
- Chao, Y.-L.; Chao, S.-Y. Resident and visitor perceptions of island tourism: Green sea turtle ecotourism in Penghu Archipelago, Taiwan. Isl. Stud. J. 2017, 12, 213–228. [Google Scholar] [CrossRef]
- Tan, P.J.B. An Empirical Study of How the Learning Attitudes of College Students toward English E-Tutoring Websites Affect Site Sustainability. Sustainability 2019, 11, 1748. [Google Scholar] [CrossRef] [Green Version]
- Dorfman, P.W. Measurement and meaning of recreation satisfaction: A case study of camping. Environ. Behav. 1979, 11, 483–510. [Google Scholar] [CrossRef]
- Moutinho, L. Consumer behavior in tourism. Eur. J. Marking 1997, 21, 3–44. [Google Scholar]
- Wu, H.C.; Huang, C.T.; Hung, C.M. Residents’ satisfactions of ecotourism and attitudes toward its development in the Pescadores, Taiwan. J. Outdoor Recreat. Study 2015, 18, 1–30. [Google Scholar]
- Tan, P.J.B.; Potamites, P.R.; Wens-Chi, L. Applying the TAM to understand the factors affecting use of online banking in the Pescadores. J. Sci. Technol. 2012, 2, 1022–1028. [Google Scholar]
- Tan, P.J.B. Applying the UTAUT to Understand Factors Affecting the Use of English E-Learning Websites in Taiwan. SAGE Open 2013, 3, 4. [Google Scholar] [CrossRef] [Green Version]
- Crompton, J.L. Motivations for pleasure vacation. Ann. Tour. Res. 1979, 6, 408–424. [Google Scholar] [CrossRef]
- Thomas, J.A. What Makes People Travel; ASTA Travel News: Alexandria, VA, USA, 1964; pp. 64–65. [Google Scholar]
- Kotler, P. Marketing Management: Analysis, Planning, Implementation and Control, 9th ed.; Prentice-Hall: Upper Saddle River, NJ, USA, 1997. [Google Scholar]
- Kozak, M. Repeaters’ behavior at two distinct destinations. Ann. Tour. Res. 2001, 28, 784–807. [Google Scholar] [CrossRef]
- Stavrianea, A.; Kamenidou, I. Memorable tourism experiences, destination image, satisfaction, and loyalty: An empirical study of Santorini Island. EuroMed J. Bus. 2021. ahead-of-print. [Google Scholar] [CrossRef]
- Hwang, S.N.; Lee, C.; Chen, H.J. The relationship among tourists’ involvement, place attachment and interpretation satisfaction in Taiwan’s national parks. Tour. Manag. 2005, 26, 143–156. [Google Scholar] [CrossRef]
- Ramkissoon, H.; Smith, L.D.G.; Kneebone, S. Visitor Satisfaction and Place Attachment in National Parks. Tour. Anal. 2014, 19, 287–300. [Google Scholar] [CrossRef]
- Lai, I.K.W.; Hitchcock, M.; Lu, D.; Liu, Y. The Influence of Word of Mouth on Tourism Destination Choice: Tourist-Resident Relationship and Safety Perception among Mainland Chinese Tourists Visiting Macau. Sustainability 2018, 10, 2114. [Google Scholar] [CrossRef] [Green Version]
- Alvarez-Sousa, A.; Prados, J.P. Visitor Management in World Heritage Destinations before and after Covid-19, Angkor. Sustainability 2020, 12, 9929. [Google Scholar] [CrossRef]
- World Tourism Organization. Tourism: The Year 2000 and Beyond Qualitative Aspects; World Tourism Organization: Madrid, Spain, 1993. [Google Scholar]
- Niedbalski, J.; Ślęzak, I. Computer assisted qualitative data analysis software. Using the NVivo and Atlas. ti in the research projects based on the methodology of grounded theory. In Computer Supported Qualitative Research; Costa, A.P., Reis, L.P., Souza, F.N., de Moreira, A., Lamas, D., Eds.; Springer: Cham, Switzerland, 2017; pp. 85–94. [Google Scholar]
- San Martín Cantero, D. Teoría fundamentada y Atlas. ti: Recursos metodológicos para la investigación educativa. Rev. Electrón. Investig. Educ. 2014, 16, 104–122. [Google Scholar]
- Alvarez-Sousa, A. The Problems of Tourist Sustainability in Cultural Cities: Socio-Political Perceptions and Interests Management. Sustainability 2018, 10, 503. [Google Scholar] [CrossRef] [Green Version]
- Alase, A. The Interpretative Phenomenological Analysis (IPA): A Guide to a Good Qualitative Research Approach. Int. J. Educ. Lit. Stud. 2017, 5, 9–19. [Google Scholar] [CrossRef] [Green Version]
- UNESCO. AngkorWorld Heritage Area. Tourism Management Plan. Available online: http://whc.unesco.org/document/134601 (accessed on 12 March 2021).
- Baniya, R.; Paudel, K. An Analysis of Push and Pull Travel Motivations of Domestic Tourists in Nepal. J. Manag. Dev. Stud. 2016, 27, 16–30. [Google Scholar] [CrossRef]
- Phau, I.; Lee, S.; Quintal, V. An investigation of push and pull motivations of visitors to private parks: The case of Araluen Botanic Park. J. Vacat. Mark. 2013, 19, 269–284. [Google Scholar] [CrossRef]
- Yuan, S.; McDonald, C. Motivational Determinates of International Pleasure Time. J. Travel Res. 1990, 29, 42–44. [Google Scholar] [CrossRef]
- Yi, J.; Yuan, G.; Yoo, C. The effect of the perceived risk on the adoption of the sharing economy in the tourism industry: The case of Airbnb. Inf. Process. Manag. 2020, 57, 102108. [Google Scholar] [CrossRef]
- Uysal, M.; Hagan, L.A.R. Motivation of pleasure travel and tourism. Enc. Hosp. Tour. 1993, 21, 798–810. [Google Scholar]
- Baloglu, S.; Uysal, M. Market segments of Push and pull motivations: A canonical correlation approach. Int. J. Contemp. Hosp. Manag. 1996, 8, 32–38. [Google Scholar] [CrossRef]
- Oh, H.M.; Uysal, M.; Weaver, P.A. Product bundles and market segments based on travel motivations: A canonical correlation approach. Int. J. Hosp. Manag. 1995, 14, 123–137. [Google Scholar]
- Fang, B.; Ye, Q.; Kucukusta, D.; Law, R. Analysis of the perceived value of online tourism reviews: Influence of readability and reviewer characteristics. Tour. Manag. 2016, 52, 498–506. [Google Scholar] [CrossRef]
- Boley, B.B.; McGehee, N.G.; Hammett, A.T. Importance-performance analysis (IPA) of sustainable tourism initiatives: The resident perspective. Tour. Manag. 2017, 58, 66–77. [Google Scholar] [CrossRef]
- Jih-Kuang, C. A New Approach for Diagonal Line Model of Importance-Performance Analysis: A Case Study of Tourist Satisfaction in China. Sage Open 2021, 11, 2158244021989276. [Google Scholar]
- Seebaluck, N.V.; Munhurrun, P.R.; Naidoo, P.; Rughoonauth, P. An analysis of the push and pull motives for choosing Mauritius as “the’’ wedding destination. Procedia-Soc. Behav. Sci. 2015, 175, 201–209. [Google Scholar] [CrossRef] [Green Version]
- Katsikari, C.; Hatzithomas, L.; Fotiadis, T.; Folinas, D. Push and Pull Travel Motivation: Segmentation of the Greek Market for Social Media Marketing in Tourism. Sustainability 2020, 12, 4770. [Google Scholar] [CrossRef]
- Dann, G.M.S. Tourism Motivation: An Appraisal. Ann. Tour. Res. 1981, 8, 187–219. [Google Scholar] [CrossRef]
- Khuong, M.N.; Ha, H.T.T. The Influences of Push and Pull on the International Leisure Tourists’ Return Intention to Ho Chi Min City, Vietnam—A Mediation Analysis of Destination Satisfaction. Int. J. Trade Econ. Financ. 2014, 5, 490. [Google Scholar] [CrossRef] [Green Version]
- Ratthinan, S.P.; Selamat, N.H. Understanding the Push and Pull Motivational Factors of Technology Usage for Traveling among Women Students in USM, Penang. J. Inf. 2017, 2, 52–63. [Google Scholar]
- Wen, J.; Huang, S. The Effects of push and pull travel motivations, personal values, and destination familiarity on tourist loyalty: A study of Chinese cigar tourists to Cuba. Asia Pac. J. Tour. Res. 2019, 24, 805–821. [Google Scholar] [CrossRef]
- Collie, M. Internet Leads Travel. Geton.com. Available online: http://www.geton.com/blog/geton/internetleads-travel (accessed on 30 April 2020).
- Baahar, A.M.; Mohammad, A.H.; Ahmad, P.M.S. An Analysis of Push and Pull Travel Motivations of Foreign Tourists to Jordan. Int. J. Bus. Manag. 2010, 5, 41. [Google Scholar]
- Smith, J.A.; Flowers, P.; Larkin, M. Interpretative Phenomenological Analysis: Theory, Method and Research; SAGE: Los Angeles, CA, USA, 2009. [Google Scholar]
- Creswell, J.W. Educational Research: Planning, Conducting and Evaluating Quantitative and Qualitative Research, 4th ed.; Pearson: Boston, MA, USA, 2012. [Google Scholar]
- Creswell, J.W. Qualitative Inquiry and Research Design Choosing Among Five Approaches, 3rd ed.; Sage Publications: Thousand Oaks, CA, USA, 2013. [Google Scholar]
- Arnstein, S. Eight rungs on the ladder of participation. In Citizen Participation: Ewecting Community Change; Cahn, S.E., Passett, A.B., Eds.; Praeger Publishers: New York, NY, USA, 1971; pp. 69–91. [Google Scholar]
- Tosun, C. Expected nature of community participation in tourism development. Tour. Manag. 2006, 27, 493–504. [Google Scholar] [CrossRef]
- Tosun, C. Limits to community participation in the tourism development process in developing countries. Tour. Manag. 2000, 21, 613–633. [Google Scholar] [CrossRef] [Green Version]
- Coccossis, H.; Mexa, A. The Challenge of Tourism Carrying Capacity Assessment: Theory and Practice; Ashgate Publishing Ltd.: Burlington, NJ, USA, 2004. [Google Scholar]
- World Tourism Organization. Global Code of Ethics for Tourism; WTO: Madrid, Spain, 1999. [Google Scholar]
- Halpern, C.; Mitchell, C.J.A. Can a preservationist ideology halt the process of creative destruction? Evidence from Salt Spring Island, British Columbia. Can. Geogr. Géographe Canadien 2011, 55, 208–225. [Google Scholar] [CrossRef]
- Mitchell, C.J. Entrepreneurialism, commodification and creative destruction: A model of post-modern community development. J. Rural Stud. 1998, 14, 273–286. [Google Scholar] [CrossRef]
- Mitchell, C.J.A.; Atkinson, R.G.; Clark, A. The creative destruction of Niagara-on-the-Lake. Can. Geogr. Géographe Canadien 2001, 45, 285–299. [Google Scholar] [CrossRef]
Figure 1.
Tourists Recreational Perceptions.

Figure 2.
Recreational Experience and its relevant phases.

Figure 3.
Research Model. Tourism-related Push and Pull Factors: A Theoretical Model theory and Model [26,58].

Figure 4.
Quadrant diagram of IPA Four Quadrants of IPA matrix.


Table 1.
Travel Motivations.
| Motivation | Explanation |
|---|---|
| Recreation & Entertainment | To break away from one’s job and the duties of daily routine. To play and have a good day. To go and obtain romantic experiences with the opposite sex. |
| Education and Culture | Not only to see how the locals work, live, and entertain themselves, but also to go sightseeing and attend special festivals. |
| Ethnic traditions | To pay respects to forebears. To visit any locations where family and friends have been to visit. |
| Others | Others refers to motivations related to climate, health, sports, the economy, and adventure. These motives are related to the ability to surpass others, to the pursuit of fashion, to participating in history, and to having a desire to understand the world. |
Table 2.
Dimensions and Environmental Features.
| Items | Measured by |
|---|---|
| Psychological experience |
|
| Recreation environment |
|
| Recreational facilities and services |
|
| Recreational activities |
|
Table 3.
Previous research on the underlying factors that determine revisit intentions.
| Author(s) | Theory or Model | Year | Destination/Country |
|---|---|---|---|
| Antonio Alvarez-Sousa & Angkor, Jose Luis Paniza Prados [35] | grounded theory | 2020 | Cambodia |
| Christina K., Leonidas H., Thomas F., Dimitrios F [42] | market segmentation push and pull motivation | 2020 | Greece |
| Jun Wen & S (SAM) Huang [51] | push and pull motivation | 2019 | Cuba |
| Antonio Alvarez-Sousa [39] | grounded theory | 2018 | Barcelona, Spain |
| Senutha P Ratthinan & Nor Hafizah Selamat [52] | Push and pull motivation | 2017 | Penang, Malaysia |
| Rojan Baniya & Kirtika Paudel [53] | Push and pull motivation | 2016 | Nepal |
| N.V.Seebaluck, P.R.Munhurrun, P.Naidoo, P.Rughoonauth [54] | Push and pull motivation | 2015 | Mauritius |
| Mai Ngoc Khuong & Huynh Thi Thu Ha [55] | Push and pull motivation | 2014 | Ho Chi Min City, Vietnam |
| lan Phau, Sean Lee, Vanessa Quintal [49] | Push and pull motivation | 2013 | Australia |
| Baahar A.M., A.H. Mohammad & Ahmad P. M. Som [56] | Push and pull motivation | 2010 | Jordan |
Table 4.
Tourist motivations (Push Factors).
| Factors (Push Motivators) | Mean | Standard Deviation |
|---|---|---|
| Sightseeing | 3.67 | 0.98 |
| Relaxing | 3.59 | 1.04 |
| Improving Friendship | 3.26 | 1.19 |
| Getting out of the city/Escape | 3.24 | 1.25 |
| Historical site/Cultural experience | 2.47 | 1.30 |
| Learning about environmental Protection | 2.85 | 1.28 |
| Wildlife Appreciation | 3.68 | 0.94 |
| Exercise and Fitness | 2.48 | 1.32 |
| Photography | 2.80 | 1.44 |
| Social events | 2.75 | 1.33 |
| Satisfying Curiosity | 3.37 | 1.11 |
| Work or Educational Purpose | 2.23 | 1.44 |
| Recommendation from family and friends | 2.83 | 25 |
| Achievement | 2.28 | 1.40 |
| Just visiting while passing by | 3.12 | 1.18 |
| Visit (spontaneous) | 2.93 | 1.18 |
| Stargazing | 2.01 | 1.44 |
| Memorable Experience | 1.97 | 1.48 |
Table 5.
Tourist motivations (Pull factors).
| Factors (Pull Motivators) | Mean | Standard Deviation |
|---|---|---|
| Sightseeing | 3.26 | 1.19 |
| Getting out of the city | 3.24 | 1.25 |
| Historical site | 2.47 | 1.30 |
| Learning about environmental Protection | 2.85 | 1.28 |
| Wildlife Appreciation | 3.68 | 0.94 |
| Exercise and Fitness | 2.48 | 1.32 |
| Photography | 2.80 | 1.44 |
| Social events | 2.75 | 1.33 |
| Satisfying Curiosity | 3.37 | 1.11 |
| Work or Educational Purpose | 2.23 | 1.44 |
| Recommendation from family and friends | 2.83 | 1.25 |
| Achievement | 2.28 | 1.40 |
| Just visiting while passing by | 3.12 | 1.18 |
| Visit (spontaneous) | 2.93 | 1.18 |
| Stargazing | 2.01 | 1.44 |
| Memorable Experience | 1.97 | 1.48 |
Table 6.
Forward expectations (X).
| Items (24) | Mean | Standard Deviation |
|---|---|---|
| (1) Tourist visitor center | 3.61 | 1.09 |
| (2) Signage | 4.02 | 0.92 |
| (3) The trail beside basalt | 3.53 | 0.95 |
| (4) Recreation spaces | 4.02 | 0.85 |
| (5) Shaded spaces | 4.17 | 0.88 |
| (6) Restaurants | 3.64 | 1.08 |
| (7) Parking lots | 4.05 | 0.91 |
| (8) Restrooms | 4.25 | 0.86 |
| (9) Lakeside terraces | 3.85 | 0.99 |
| (10) Dream hall | 3.38 | 1.17 |
| (11) Greenhouse cultivation | 3.60 | 1.02 |
| (12) Dahsianhua place | 3.54 | 1.03 |
| (13) The area where animals are found | 3.56 | 1.10 |
| (14) The place where there are many lover locks | 3.02 | 1.30 |
| (15) Rock flower place | 3.26 | 1.09 |
| (16) Chienhuhua place | 3.25 | 1.14 |
| (17) Lighting facilities | 3.83 | 1.11 |
| (18) Medical facilities | 4.00 | 1.12 |
| (19) Historic sites | 3.15 | 1.25 |
| (20) Explanation of handbook | 3.63 | 1.11 |
| (21) Explanation of billboard | 3.81 | 0.99 |
| (22) Explanation of poster | 3.52 | 1.07 |
| (23) Explanation of multimedia | 3.44 | 1.16 |
| (24) Facilities Display | 3.68 | 1.12 |
Table 7.
Practical experiences (Y).
| Items (24) | Mean | Standard Deviation |
|---|---|---|
| (1) Tourist visitor center | 3.07 | 1.11 |
| (2) Signage | 3.42 | 0.94 |
| (3) The trail beside basalt | 3.24 | 1.06 |
| (4) Recreation spaces | 3.38 | 1.02 |
| (5) Shaded spaces | 3.29 | 1.09 |
| (6) Restaurants | 2.87 | 1.25 |
| (7) Parking lots | 3.36 | 1.05 |
| (8) Restrooms | 3.48 | 1.09 |
| (9) Lakeside terraces | 3.39 | 1.07 |
| (10) Dream hall | 3.15 | 1.09 |
| (11) Greenhouse cultivation | 3.31 | 1.04 |
| (12) Dahsianhua place | 3.23 | 1.09 |
| (13) The area where animals are found | 3.13 | 1.14 |
| (14) The place where there are many lover locks | 2.94 | 1.25 |
| (15) Rock flower place | 3.06 | 1.15 |
| (16) Chienhuhua place | 3.04 | 1.16 |
| (17) Lighting facilities | 3.07 | 1.22 |
| (18) Medical facilities | 2.87 | 1.37 |
| (19) Historic sites | 2.92 | 1.29 |
| (20) Explanation of handbook | 2.87 | 1.31 |
| (21) Explanation of billboard | 3.24 | 1.10 |
| (22) Explanation of poster | 2.95 | 1.26 |
| (23) Explanation of multimedia | 2.80 | 1.32 |
| (24) Facilities Display | 3.12 | 1.21 |
Table 8.
Averages of forward expectations and practical experiences.
| N | Minimum | Maximum | Mean | Std. Deviation | |
|---|---|---|---|---|---|
| Forward expectations | 24 | 3.02 | 4.25 | 3.6588 | 0.32409 |
| Practical experiences | 24 | 2.80 | 3.48 | 3.1333 | 0.20071 |
| Valid N (listwise) | 24 |
Table 9.
Perceptions of revisit intentions and overall satisfaction of tourists.
| Items | Mean | Standard Deviation |
|---|---|---|
| Overall satisfaction with Qingwan Cactus Park | 3.23 | 0.93 |
| Intention to revisit Qingwan Cactus Park | 3.09 | 1.09 |
| If the entrance ticket price is raised higher in the future, your intention to revisit | 2.55 | 1.21 |
| I’ll spread the advantages of Qingwan Cactus Park to others | 3.08 | 1.13 |
| I’ll encourage my relatives and friends to experience the park | 3.17 | 1.10 |
| Qingwan Cactus Park will be a priority travel destination in the future | 2.79 | 1.26 |
Publisher’s Note: MDPI stays neutral with regard to jurisdictional claims in published maps and institutional affiliations. |
© 2021 by the authors. Licensee MDPI, Basel, Switzerland. This article is an open access article distributed under the terms and conditions of the Creative Commons Attribution (CC BY) license (https://creativecommons.org/licenses/by/4.0/).
Share and Cite
MDPI and ACS Style
Tan, P.J.B.; Yao, H.-m.; Hsu, M.-H. A Case Study of Tourist Perceptions and Revisit Intention Regarding Qingwan Cactus Park in Penghu, Taiwan. Sustainability 2021, 13, 12404. https://doi.org/10.3390/su132212404
AMA Style
Tan PJB, Yao H-m, Hsu M-H. A Case Study of Tourist Perceptions and Revisit Intention Regarding Qingwan Cactus Park in Penghu, Taiwan. Sustainability. 2021; 13(22):12404. https://doi.org/10.3390/su132212404
Chicago/Turabian StyleTan, Paul Juinn Bing, Hui-mei Yao, and Ming-Hung Hsu. 2021. "A Case Study of Tourist Perceptions and Revisit Intention Regarding Qingwan Cactus Park in Penghu, Taiwan" Sustainability 13, no. 22: 12404. https://doi.org/10.3390/su132212404
Note that from the first issue of 2016, this journal uses article numbers instead of page numbers. See further details here.